 Florian Salique1†
 Philippe M. C. Roth
- 1École Nationale Supérieure de Chimie de Paris - Université PSL, Paris, France
- 2Corning Reactor Technologies, Corning SAS, Samois-sur-Seine, France
Despite their widespread use in the chemical industries, hydrogenation reactions remain challenging. Indeed, the nature of reagents and catalysts induce intrinsic safety challenges, in addition to demanding process development involving a 3-phase system. Here, to address common issues, we describe a successful process intensification study using a meso-scale flow reactor applied to a hydrogenation reaction of ethyl cinnamate at kilo lab scale with heterogeneous catalysis. This method relies on the continuous pumping of a catalyst slurry, delivering fresh catalyst through a structured flow reactor in a continuous fashion and a throughput up to 54.7 g/h, complete conversion and yields up to 99%. This article describes the screening of equipment, reactions conditions and uses statistical analysis methods (Monte Carlo/DoE) to improve the system further and to draw conclusions on the key influential parameters (temperature and residence time).
Introduction
Hydrogenation reactions are synthetically useful. They rely on a simple green reagent and are present in many fields such as API synthesis (Ciriminna and Pagliaro 2013), common both in academic and industrial settings (Westerterp et al., 1997). A benefit from the implementation of hydrogenation is the limited amount of catalyst they require. However, the high reactivity of hydrogen itself is a major issue (Allian and Sperry, 2020), requiring significant safeguards during its use (Sperry et al., 2021). The outcome is a reactor system with a limited operating range (up to 5 bar and 100°C in many cases) (May 2017). The implantation of hydrogenation processes in continuous flow has been popularized, as it intrinsically involves a low reactive inventory and thus is easier to control (Porta et al., 2016; Yu et al., 2020; Guan et al., 2020; Guidi et al., 2020). As flow chemistry is part of process intensification, it can deliver “greener” conditions, thus its implementation in hydrogenation appears as a sensible beneficial outcome (Mason et al., 2007; Glasnov and Kappe 2010; Poechlauer et al., 2013; Horn and Cerato-Noyerie 2014; Mallia and Baxendale 2016; Glasnov 2016; Tanimu et al., 2017).
Hydrogenation reactions are used to reduce several functional groups such as alkenes (Mercadante and Leadbeater, 2012; Irfan et al., 2009) or nitro groups (Orlandi et al., 2018; Cole et al., 2019). In some cases, alternatives to hydrogen gas can be used (Battilocchio et al., 2013). A number of technologies exist to practically carry out the reaction, such as porous membrane reactors (Mo et al., 2018). Another way to perform the reaction is to have the catalyst precoated on static mixers in the reactor (Hornung et al., 2017; Gardiner et al., 2018; Lebl et al., 2020; Kundra et al., 2021) despite potential metal leaching.
A very common practice is the use of a trickle bed reactor (Saroha and Nigam, 1996; Al-Dahhan et al., 1997; Deutschmann et al., 2009) containing a packed bed of catalyst, which the reactants flow through (Gulotty et al., 2018). This is widely used in industry (Perry and Green 2008; Johnson et al., 2012; Rinaldi 2014; Carangio et al., 2020; Fernandez-Puertas et al., 2020), as it allows good control of reaction conditions and simplified scale-up (Jiménez-González et al., 2011; Hickman et al., 2013; Gutmann et al., 2015; Russell et al., 2017; Duan et al., 2020). In this case, the nature and particle size of the catalyst has to be optimized to obtain good results. Several commercial reactors to perform hydrogenations are available for laboratory scale, including the Thales Nano H-Cube system (Irfan et al., 2011; Moreno-Marrodan et al., 2017). One particular property of this technology is its reliance on disposable cartridges containing catalytic species. Other uses of trickled bed strategies have been implemented in microreactors (Yoswathananont et al., 2005; Oyamada et al., 2011; Tsubogo et al., 2015; Orlandi et al., 2018; Durndell et al., 2019). Use of a baffled system has also been reported (Navarro-Fuentes et al., 2021). Disadvantages of this approach include potential leaching as well as catalyst particle size distribution (Koekemoer and Luckos, 2015), which can lead to high pressure drops.(Gray et al., 2002; Rabbani et al., 2017; Jung et al., 2019)
An alternative to avoid issues with the catalyst breakdown is to pump a solution of slurry through the reactor and have it mixed within the system with the substrate and hydrogen (Buisson et al., 2009), such as in the Fischer-Tropsch process (Savchenko et al., 2016) or other hydrogenation reactions (Marie et al., 2010; Hofferb et al., 2006). In this case, the catalyst is always prepared and used “fresh” and there is a potential for catalyst recycling (Molnár and Papp 2017).
As part of Corning’s work towards industrialization of flow chemistry processes, we decided to examine the transposability of method developed using a laboratory scale cartridge-based system to a slurry system, select the best equipment by testing to compare both methodologies and explore the pros and cons of both approaches. After selecting a benchmark substrate such as ethyl cinnamate, the strategy was to transpose and scale-up the system, identify key parameters and study them using statistical data analysis. Modelling has already been used in similar research cases (Papari et al., 2012; Papari et al., 2014; Darvishi et al., 2016).
Materials and Methods
Choice of Reaction
In order to perform the work, a benchmark reaction on a simple, yet functionalized substrate, ethyl cinnamate was selected (Figure 1). This synthesis has already been carried out in different reactor types, such as the H-Cube (Dillon et al., 2009), allowing an easy comparison between methods (O’Brien et al., 2011; Cossar et al., 2015; Kobayashi et al., 2015; Kobayashi et al., 2015; Rathi et al., 2016;Ramezani and Abolhasani. 2020; Yu et al., 2020). As the original research paper is more than a decade old and that the reaction has often been used as a test one, it was selected as a starting point. In addition, the decision was made to perform the catalyst activation and thermal quench in situ. Indeed, the stability of solutions containing a catalyst can be problematic and might need special measures to protect it. Additionally, freshly generated or activated catalyst have a higher activity as they have not had time to decompose before they react. For these two reason, namely the ease of handling and the higher result reproducibility, it had been decided to activate the catalyst in situ. This approach makes the best use of flow chemistry toward an intensified process.
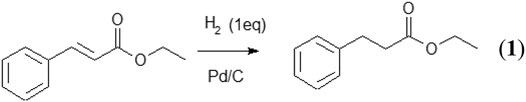
FIGURE 1. Substrate hydrogenation carried out in this work: ethyl cinnamate into ethyl 3-phenylpropanoate.
Reactor Equipment
To perform the reaction, a kilo lab scale flow reactor was selected. As Corning AFR have been released and characterized for many years (Lavric and Cerato-Noyerie, 2012), a G1 reactor was selected (More information in the Supplementary Material). Its working conditions go up to 200°C and 18 bar, so it is well inside the desired working range. In terms of setup, the system is adapted to fit its required number of inlets, outlets and residence time units (The Piping and Instrumentation Diagram (PID) is available in the Supplementary Material). The choice was carried out in accordance with a safety assessment (see Supplementary Material).
Auxiliary Equipment Selection
Back-Pressure Regulators
Performing reactions with gas such as hydrogen works better under pressure as gas solubility in the liquid phase is increased, which increases the reaction rate. Moreover, under pressure, the gaseous reagents take up less space and therefore leads to a better gas to liquid ratio, thus improving the gas-liquid flow regime inside of the channels. It also avoids flushing the reagent through the reactor resulting in a short residence time. The use of a back-pressure regulator (BPR) allows the reactor pressure to be easily set at a desired target. Two different systems were tested in the course of the experiments. One is from Equilibar (GSD3) while the second system is from Zaiput (BPR-1000). Pressure measurement was performed via an Endress Hauser PTP31B pressure sensor.
Slurry Pumps
The reliability of the pump to push a slurry through the reactor, under pressure, pulseless, reproducibly to ensure fast reagent mixing and high reaction throughput was first assessed. Two pump systems were evaluated in the course of this research: the Tacmina TPL, a two head membrane pump working at a range of 1–100 ml/min up to 100 bar and the Lewa Ecodos, a three head membrane pump from 15 to 100 ml/min up to 18 bar. The pump flow rate ranges and operating pressures were chosen to match with the optimal working conditions of the flow reactor used for the experiments. The recommended flow rate for multiphase mixing is 60 ml/min of total flow rate at a pressure up to 18 barg. Both pumps had been selected as they allowed a flexible adjustment of the flow rate close to 60 ml/min and both were able to operate at pressures close to the maximum allowable pressure of the system. This allowed to take most advantage of the pressurization of the gas for improved mass transfer and optimization of the residence time.
The pulsation of the pumps was recorded, as well as flow rate accuracy and reliability. No material compatibility issues were detected in this reaction.
Other Equipment
Other auxiliaries were selected to ensure an optimal working system. Amongst others, the dosing line for reactant solution was composed by an HNPm pump and a Coriolis Flowmeter M14 from Bronkhorst, linked to an Eurotherm Nanodac controller to operate in a control loop. The slurry flow was also controlled by a Bronkhorst Coriolis Flowmeters. The hydrogen and nitrogen gas flows were controlled by thermal mass flow meters. Gas was introduced in the liquid at the inlet of the reactor. The mixing took place within a Fluidic module of the reactor (more information in the Supplementary Materials). Temperature measurement was performed via Thermocouple K type connected to a Eurotherm (Figure 2). Data acquisition was performed via a Q.brixx2 A107 acquisition card to record both flow rate and pressure measurements. A LAUDA RP845 C proline thermostat was used to control the reaction temperature and a LAUDA Loop 250 for the quench temperature. All connections, for the liquid phase, were in 1/4” PFA tubing. Pressure was adjusted with Equilibar Back Pressure Regulator and measured with an Endress Hauser PTP31B pressure transmitter.
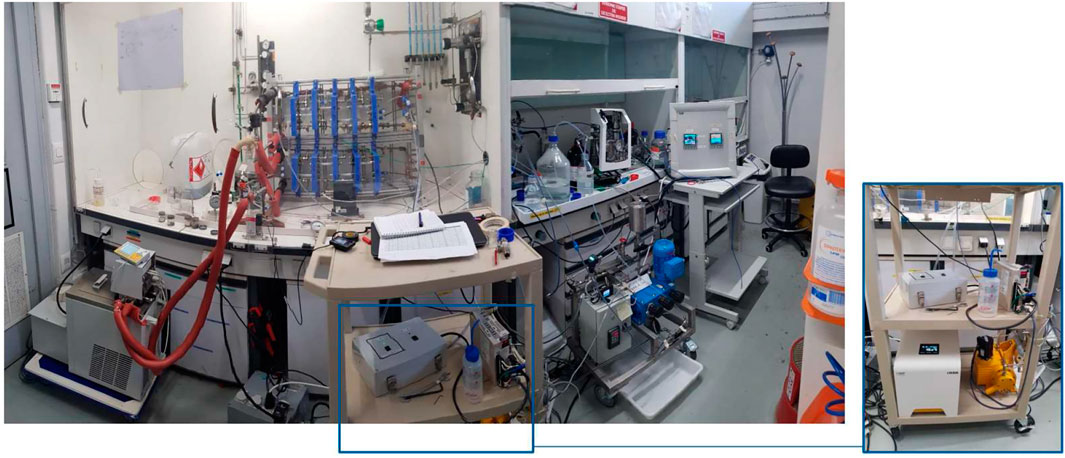
FIGURE 2. Setup of flow reactor and auxiliaries.
Plan of Experiments
To optimize the original work to a Corning Reactor, it was decided to perform reaction optimization based on a design of experiments (DoE) approach. It was set in four phases: 1) Auxiliary selection. 2) Different sets of conditions were tested empirically to identify key parameters (44 experiments) 3) A DoE approach was used to assess the critical parameters, allowing further study toward the optimal conditions (Taylor et al., 2021) 4) Lastly, a variability analysis on three parameters was carried out to assess the relative impact of each factor on the final result.
The parameter boundaries for this work (regarding the pump selection) were selected according to the technical limitations of the installation (15 barg). Once the best auxiliary had been selected, the optimization of the reaction itself was started. More precisely, the maximal temperature was set at 75°C. The shortest residence time (maximal flow rate) was set according the maximum tolerated pressure drop (18 bar). Similarly, the maximal ethyl cinnamate concentration took into account the viscosity of the solution. Concentration of ethyl cinnamate and Pd/C were calculated in mol/L and %wt considering the volume of the mixing solution. The analysis of potential metal leached in the final product was not included in the present scope.
Methodology: Experimental Run
A typical experimental run sequence is detailed here: 1) Switch on and set thermostat for the reaction. 2) Start flushing the system with nitrogen, both in the reactor and in the diluting outlet section. 3) Start the pump using the valves to move both solvents into system. 4) Set the back-pressure regulator. 5) Upon reaching a steady state, swap the solvent for the reaction system (valves). 6) Change the nitrogen gas to hydrogen in the reactor. 7) After waiting for stabilization, collect a sample and record all parameters at that time.
Two theoretical residence time (18 and 30 s) were set for the experiments in order to have stable parameters for statistical analysis. Flow rate of each stream was calculated to reach the right residence time while maintaining one equivalent of H2 for every experiment.
Shutdown procedure. Once the system has been stopped, the inverse procedure was followed: 1) Swap the hydrogen gas flow for nitrogen. 2) Switch the reagents back to solvent for both the reagent and catalyst pumps 3) Release the back-pressure regulator to reach atmospheric pressure 3) Switch off both liquid pumps 4) Switch off the gas system.
Statistical Analysis and Data Treatment
Sample Analysis
Upon collection, samples were filtered and analyzed by a GC-FID method to give the conversion. A few samples were analyzed via GC-MS to confirm the nature of the molecule.
Data Treatment (Design of Experiments)
The DoE was performed via Minitab (Kowalski, 2002; Montgomery, 2004). All recorded data were introduced to explore the chemical space.
Monte Carlo
The analysis of the variation of the main sample was performed via a Monte Carlo Analysis. Such method allowed the relative importance of different parameters to be assessed. This was performed via Oracle Crystal Ball software from Oracle (Mc Cracken, 1955; Trotter and Tukey, 1956)
Results and Discussion
Auxiliary Equipment Selection
Back-Pressure Regulators
Although both back-pressure regulators are very effective, the Equilibar system was selected for the next set of experiments. The Equilibar system smoothly dealt with the slurry and gas, meeting the requirement for a stable and reliable process. In addition to the ability to clean the BPR easily, the presence of metals did not have any compatibility issue with the chemicals involved. Even though hydrogen has been reported to trigger corrosion in metal devices, the low quantities, the room temperature and low pressure conditions are unlikely to make a serious hazard in the present case (Woodtli and Kieselbach, 2000; Dwivedi and Vishwakarma, 2018).
Slurry Pumps
Based on the results from the equipment testing (Back-Pressure Regulators), comparison between the Tacmina TPL and the Lewa Ecodos led to the conclusion that the Tacmina system is more suited for this application (cf Figure 3). The Tacmina TPL is more stable and more precise for low slurry concentration and same flow rate. However, due to its small valves, Tacmina can handle less concentrated slurries than Lewa. Moreover, the lower the flowrate, the higher the imprecision, regardless of the pump used. When parameters of the reaction are optimized, either pump can repeat this result.
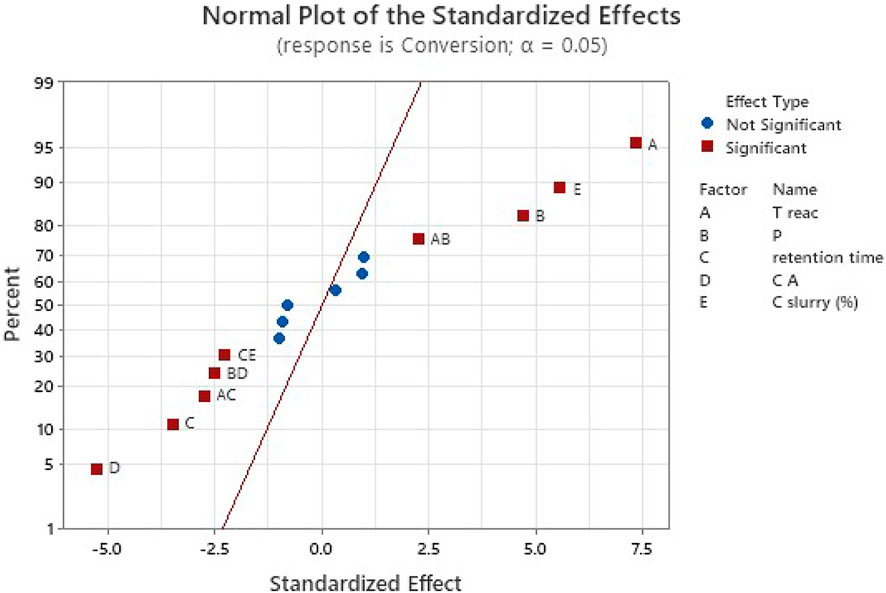
FIGURE 3. Normal probability plot used to select the most relevant parameters. The last stage of analysis is represented here (previous stages are in Supplementary Materials) and shows some significant interactions of parameters in complement to main parameters, while some other interactions of parameters appear not significant.
The pulsation behaviors are quite stable and reproducible for each pump when the BPR is clean, even if a check-valve is sometimes blocked for one or several pulsations. However, pulsation of Tacmina is comparatively smoother than Lewa (Figure 4). Lastly, the flow rate given by LEWA decreases when the pressure in the reactor increases. It can be explained by the fact that the pulsation period increases with the pressure. The Tacmina was able to carry the slurry with a relatively constant flow. However, under real process conditions, Tacmina valves must be regularly disassembled and cleaned. These results led to the selection of the Tacmina pump for the chemistry part of this project. The frequency of this maintenance was conditions dependent. They could vary between a daily and a weekly maintenance.
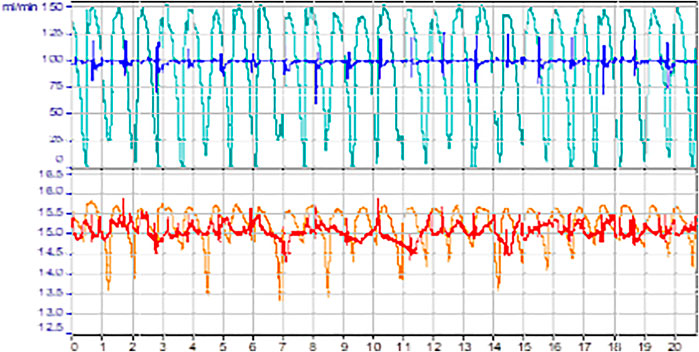
FIGURE 4. Recorded pulsation on slurry at 1% in IPA of LEWA in cyan (100 ml/min) and orange (15 ml/min) and Tacmina in blue (100 ml/min) and red (15 ml/min).
Reaction Optimization
Catalyst Activation and Reaction Quench
The catalyst activation (performed just before the reaction) and thermal quench of the reaction (15°C, performed after the reaction) were successfully implemented in the reactor. Indeed, independent of the yield, conversion started in all conditions after the initial catalyst activation (catalyst slurry and hydrogen flow). This premixing of catalyst slurry and hydrogen was necessary to increase the efficiency of the catalyst and reach good conversion. This aim of this activation is to reduce the Pd catalyst to its metallic state and link it with Hydrogen.
No attempt at optimizing these steps was made as they successfully met their target requirement.
Initial Results and Empirical Optimization
The results from the first series of experiments can be seen below (see Table 1). A complete list of results can be found in the Supplementary Material. This also includes the calculation of the residence time based on reactivity hypotheses. The following results were obtained using the Tacmina TPL (See Slurry Pumps) as slurry pump and Equilibar as BPR (See Back-Pressure Regulators) and performed in a five Fluidic Module (FM) G1 reactor (Total reaction volume = 41 ml).
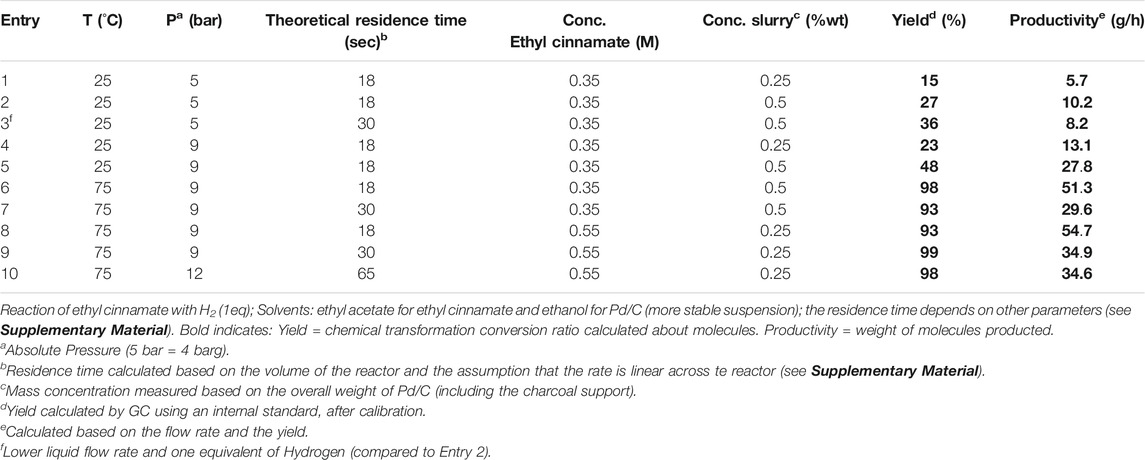
TABLE 1. Hydrogenation empirical optimization results.
Based on Table 1, the initial conditions, inspired by the research of Kappe et al., entry 1 gave a low yield. A higher catalyst loading led to a better yield. Increasing the residence time (entry 3) further improved the yield but not the productivity as flow rates had to be reduced. Moving on, the pressure was set at 9 bar to increase the amount of hydrogen in solution, with little effect of the catalyst slurry at 25°C (entries 4 and 5). Increasing the temperature to 75°C led to a significant improvement of the yield. Here again, varying the residence time did not have much impact (entry 6 and 7) compared to the temperature. Tests aiming at increasing the productivity by increasing the substrate concentration led to a higher productivity (entry 8 up to 54.7 g/h). Lastly, it is worth noting that a higher flow rate is better for productivity, compared to a lower flow rate with higher pressure (e.g., entry 10, 12 bar, there is a lower productivity (34.6 g/h) despite a high yield. Finally, the experiment n°9 (75°C, 9 bar, 30 s residence time, 0.55M Ethyl cinnamate (C) and 0.25%wt slurry) gave the best yield but experiment n°8 (75°C, 9 bar, 18 s residence time, 0.55M Ethyl cinnamate and 0.25%wt slurry) gave the best productivity.
Based on these results, a number of conclusions can be drawn.
1) The benchmark substrate can be successfully hydrogenated using the kilo lab scale reactor and the selected auxiliaries. Product yield up to 99% can be reached with only 1 eq of hydrogen. This means limited amounts of byproducts are formed, making the chemical purification step easier or avoidable altogether.
2) A productivity of 55 g/h was reached with all the parameters considered in the study. A higher productivity with the same installation might be reached by further optimization.
3) The contribution of the temperature on the yield is so overwhelming (yield >90% at 75°C whatever the other parameters) that the influence of other parameters cannot be analyzed without additional experiments. So for the statistical analysis of every parameter, experiments at 50°C have been carried out.
4) Longer residence time did not yield better results (e.g., entry 6 vs entry 7). This is because the flow rate conditions are outside the optimal mixing range of the reactor. Hence the mass and heat transfer are much lower. A lower mixing results in lower reactivity. This is especially true in the case of a triphasic liquid/gas/slurry mixture in which the benefit from diffusion is very limited.
Statistical Analysis
Statistical analysis was then performed on the results of the experiments obtained using the Tacmina TPL (See Slurry Pumps) as slurry pump and Equilibar as BPR (See Back-Pressure Regulators).
Statistical Analysis
Statistical analysis, using the software Minitab, were performed on experiments at 25 and 50°C using a DOE methodology. Using data at higher temperature completely removes the ability to see the impact of other factors as it was much more important. Indeed, most of the reactions at 75°C led to a 99% conversion. Although this is good result regarding the yield, it cannot be extrapolated to learn more about the reaction itself.
Design of Experiments
The study is about the influence of five parameters and their interactions (Concentration of Slurry, Concentration of reactants, Temperature, Pressure and residence time) on the conversion and aim to better characterize the reaction. Table 1 summarizes a number of variable parameters used for the design of experiments). The transformation therefore could include a wider range of parameters compared to an empirical optimization approach.
The identification of statistically significant parameters is described in supplementary materials and last stage is shown in Table 2. Revealing the effects of parameter interactions highlights the benefit of this approach compared to a one factor at a time approach.
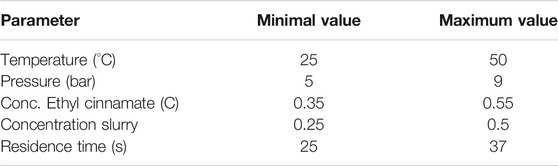
TABLE 2. Display of the parameters varied for the DoE study. The minima and maxima are reported. All the conditions can be found in the Supplementary Material section).
The selection of significant parameters results into a model to match the observed data. Using only the significant parameters to describe the system results into the equation below with a correlation coefficient R2 = 0.8886:
Symbols: T reaction = A, residence time = B, Conc. Ethyl Cinnamate (C) = C, C slurry (%) = D, Pressure = P
Effects of principal parameters as well as interactions of parameters on conversion were then determined as shown in Figure 5. Exploration of more complex interactions can also be found in Figure 6 and in the Supplementary material.
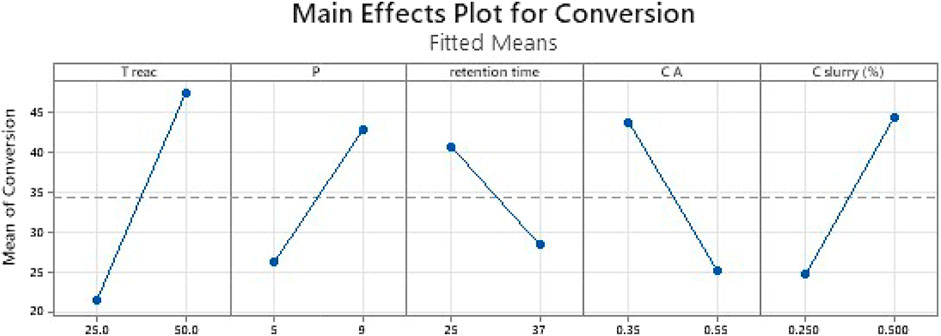
FIGURE 5. Effect of main parameters. The vertical axis represents the conversion while the horizontal axis displays different values of each parameter. The line in each case displays the correlation either positive or negative.
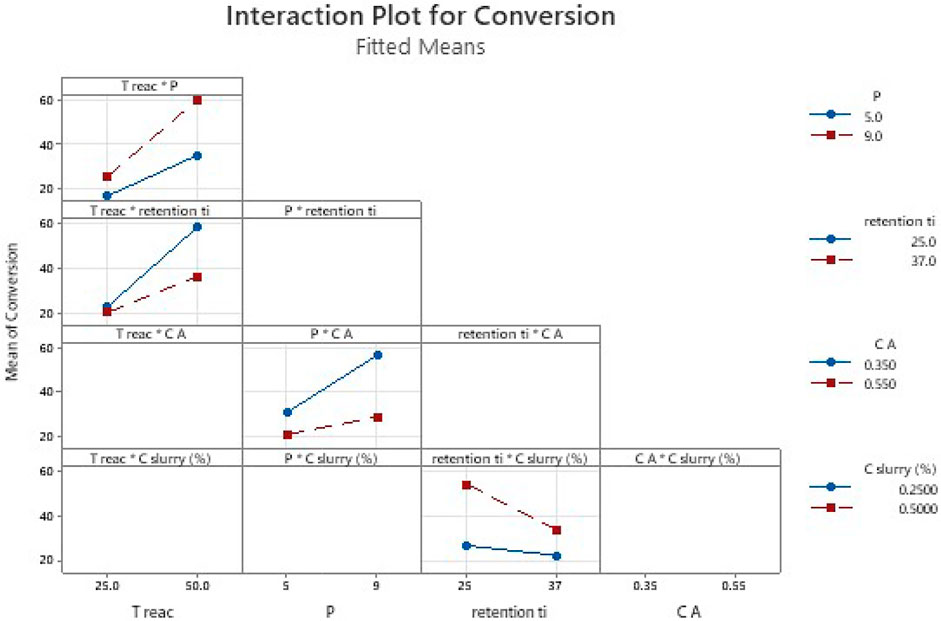
FIGURE 6. Effect of parameters interactions. To read the plot: consider first the name of each column of plots then the interaction of parameters considered. The colored lines in the plot correspond to the second term of the interaction in the legend, while the value of first term of interaction is readable on the abscises. The empty plots correspond to the interactions of parameters which are not statistically significant and are out of the equation.
The equation includes the main parameters (A, B, P, C, D) and interaction parameters (A*P, A*C, P*C, B*D).
This first set of data is also a good way to check the basic trends are sensible. For instance, there is a high correlation between the reaction temperature and the yield. A similar positive trend can be observed for the pressure, while a negative correlation can be found for both an increased reaction time and an increased reactant concentration. Initial testing also proved the results were randomly obtained and not the residual values of an unknown but impactful bias.
Figure 5 show that a rise of the temperature, the pressure or the concentration of slurry led to an increase of the conversion. However, more residence time or higher ethyl cinnamate concentration led to a decrease of the conversion. In fact, the more concentrated ethyl cinnamate is, the more the reaction requires optimized conditions to reach full conversion.
Moreover, the residence time is a parameter hard to control (indirectly through plump flowrate and the use of liquid/gas under pressure). When in conditions required for the flow to reach longer residence time, slurry pump work out these optimal flowrates and the flow became less stable. In addition, as the configuration of the reactor was unchanged, longer residence time meant decreased flow rate and therefore outside the optimal reactor operating conditions (poor gas mixing, poor mass and heat transfer coefficient). The statistical analysis points out this impact.
After the initial correlation, an adjustment of the model in regard to experimental data was carried out as shown in Figure 7. While the red line is the linear regression, a predictive domain (76.8% of probability) could be extrapolated. This area displays the relevance of the model in regard of the obtained data. While the domain might seems relatively large initially, it can be seen that it incorporates most of the experimental points. This therefore leads to the conclusion this set of data can provide an initial and relevant model, although not the most defined. The fact that the correlation coefficient is at 88.5% once adjusted reveals that this preliminary study is noisy due to uncertainties of residence time. A future study with a more accurate control might reveal more significant parameter interactions and an increase of correlation coefficient.
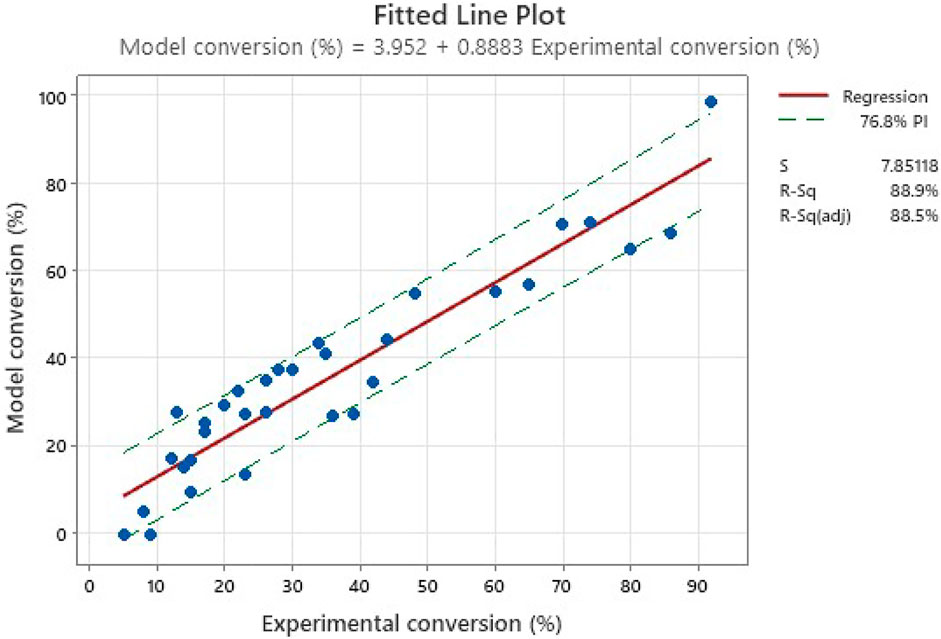
FIGURE 7. Model versus experimental trials. The dotted lines represent the interval of prediction of the model.
Monte Carlo Analysis
After the initial analysis, a Monte Carlo analysis was then performed on the DoE equation to study the variability of the system. This study is aimed at probing the impact and variability of each parameter on the final result (Table 3). It is useful as it allows a comparison of the real impact of each parameter (and the impact of measurement imprecision). The Monte Carlo analysis is very useful in the present case (cf Figure 8). From this operation (operation described), two relevant output and conclusion could be drawn. Firstly, it was possible to evaluate the variability of the experiments using the equation (i.e., equation of the conversion extracted from the DoE in Design of Experiments). The quality of fit from the equation could be due to the noise of the experiments. Additionally, the use of the Monte Carlo analysis can also help excluding the impact of the noise within the result and therefore see the impact and sensitivity of each parameter. The identification of relevant parameters becomes easier.

TABLE 3. Imprecision of each parameter considered for the Monte Carlo analysis.
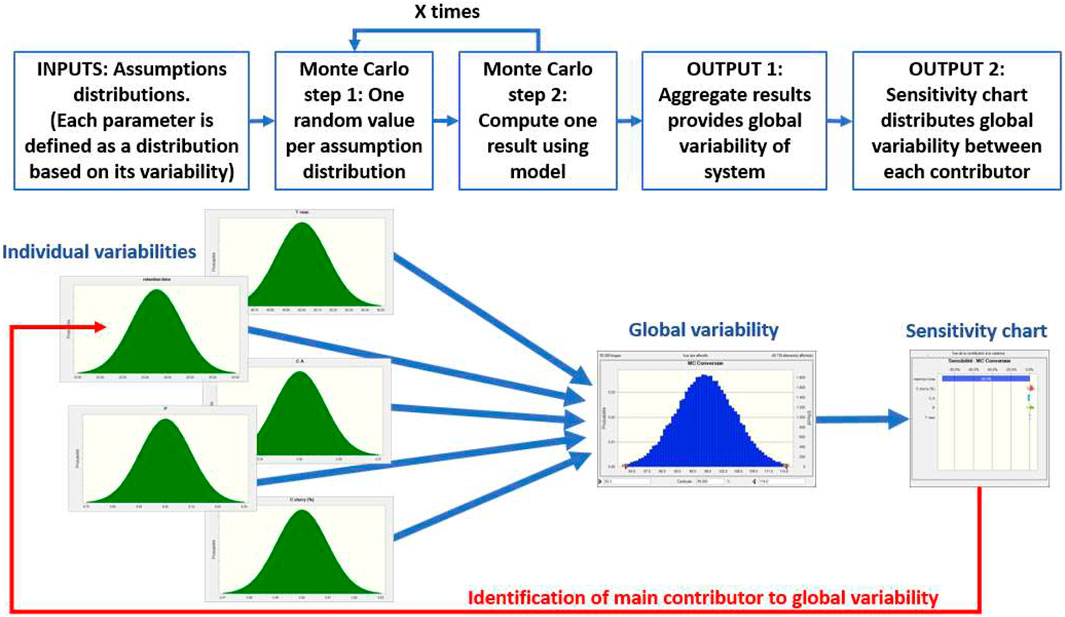
FIGURE 8. Explanation of the benefits from the Monte Carlo Analysis.
Additionally, a Tornado chart study was carried out (available in the Supplementary Materials).
Assumptions used for this study are given below:
The study was performed using the best parameters condition in dataset to obtain the highest conversion level (see Supplementary Material). The upper assumptions were then considered as 99.9% of Gaussian distributions, i.e., 50.5°C at 99.9% for a mean reaction temperature of 50°C, or 9.3 bars at 99.9% for a mean precision of 9 bars.
50,000 iterations were performed for Monte Carlo analysis (Figure 9). Results reveal a potentially high variability of conversion, mainly due to residence time variability. The maximum conversion level was not limited at 100% to allow the sensitivity to be estimated. All results above 100% naturally translate into a full conversion in real life. The result shows a Gaussian distribution of all the relevant parameters as all parameter distributions were considered as gaussians (See Supplementary Materials).
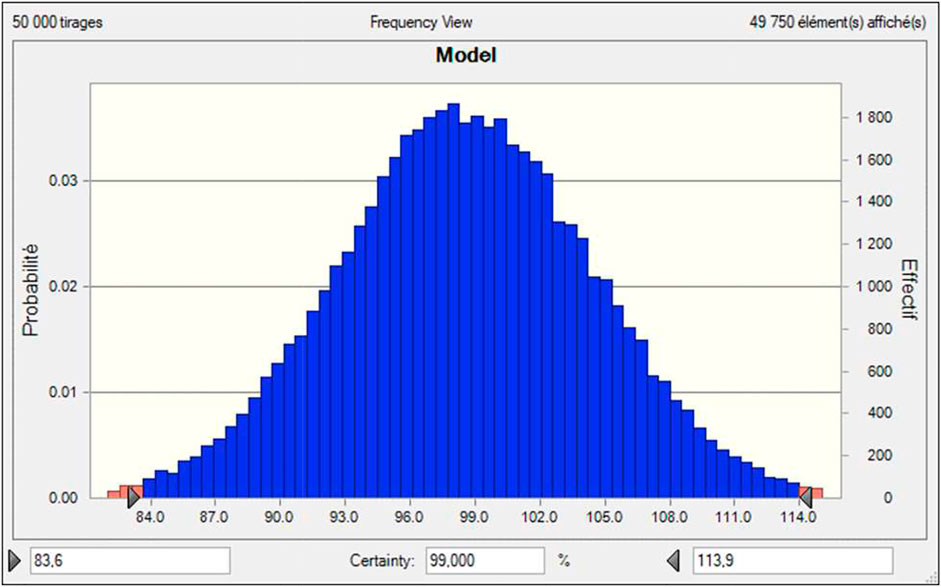
FIGURE 9. Monte Carlo Analysis results.
The result also confirms the calculated variability is compatible with the low R2 obtained through the DoE. Effectively, for the conditions explored, the model predicts a conversion of 98.5%, while the experimental result gives 92% (i.e., the leading parameter used as reference to perform the Monte Carlo Analysis on). But Monte Carlo analysis shows that the conversion level can vary for such experimental parameters from 83.6% up to 100%, mainly due to residence time variability which contributes to 92.9% of global variance.
The Monte Carlo analysis led to the identification of the most critical parameters when it comes to variation and reliability (Table 4). This is important in order to have good reproducibility when running experiments. It highlights that the residence time is by far the most critical parameter (in terms of variability, not in terms of impact on the reaction). While other parameters can be easily controlled (reagent concentrations, temperature, pressure), the exact measurement of the residence time remains elusive and the results of the Monte Carlo analysis point out that the most critical parameter is the residence time.
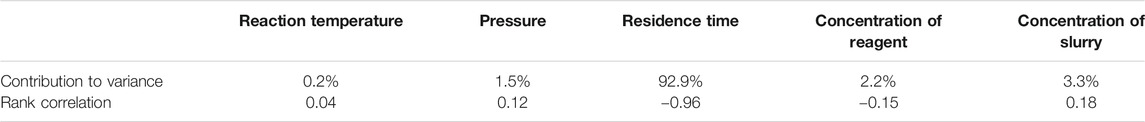
TABLE 4. Impact of each parameter variability on global variation of system.
The exact measurement of the residence time has to be calculated based on assumptions (See Supplementary Material). Indeed, as there is gas involved, its consumption greatly impacts the volume and the hydrodynamic behavior inside the reactor.
This highlights that the assumptions around it are important and require an in-depth analysis, rather than a quick assumption, which might not take into account the importance of this parameter. To study this part better, a more in-depth analysis of the mechanism itself might be interesting and have a strong impact on the exact residence time. This is especially true when optimizing a system, even more if the process is aimed at being implemented at industrial scales. The outcome is interesting as modification implies either changing the size of the reactor or the flow rate. This also has consequences related to the mixing itself.
Stepping back, the temperature of the reaction was even more important for the variability of this process (Statistical Analysis).
The main conclusion based on the present study is the importance of the temperature and a short and controlled residence time. Indeed, a shorter residence time translates into a higher throughput. These two outcomes are highly desirable in the vein of flow chemistry.
Throughput/Scale-Up Comparison With Other Methods.
Scale-Up From Initial Method
Table 5 compares this work to the original optimal conditions which uses a catalyst cartridge system to carry out the same reaction. A quick comparison shows that residence time in the H-Cube system is between 2.5 and 15 s, while the Corning is slightly higher at 18–44 s, albeit still in the sub-minute range. On the other hand, the slurry system allows higher reagent concentration and pressure (0.55 M, 5–9 bar vs 0.2M at 1 bar). On the other hand, the temperature conditions are close (75–80°C). Both systems can deliver complete conversions.
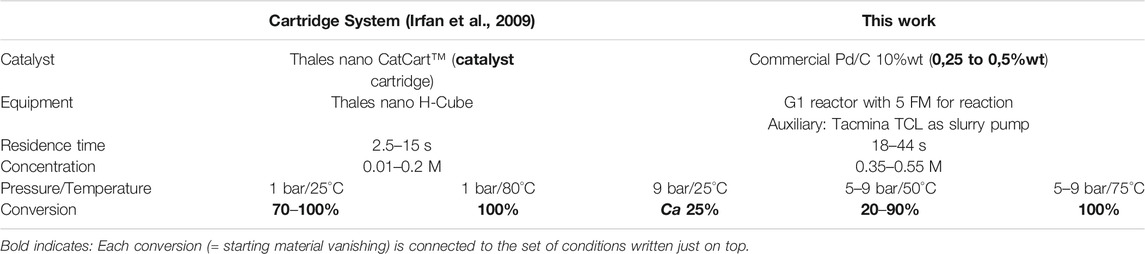
TABLE 5. Comparison of the cartridge and slurry hydrogenation conditions.
The conditions from the original paper, run in the commercial H-Cube unit, can be translated to a larger scale reactor using a slurry. This makes it easier to perform a chemical reaction regardless of the reactor technology used. This allows a transposability of the reaction. Additionally, the example shows the ability to scale-up moving from one method to another one. This may be an attractive way for scientists developing their research to identify scale-up technology. On the other hand, using a slurry requires homogeneous catalyst slurry and can add potential clogging issues.
Methods Comparisons
In order to take a snapshot of current technologies and their overall aspects, a number of points are discussed in the present section. This section compares a number of method in giving some general ideas of their different properties; As there are many different parameters (catalyst, substrate, etc … ) which are different, the current list should be considered as a summary. But many variation of each method can be found, so direct comparison has limited values although comparing the different approaches is interesting.
A comparison of the different methods used in flow hydrogenation is reported in Table 6. This includes a trickle bed reactor (Carangio et al., 2020), a catalytic mixer (Kundra et al., 2021), the H-cube (Irfan et al., 2009), and this work using a slurry conditions. In this case, a reactor of similar size is compared.
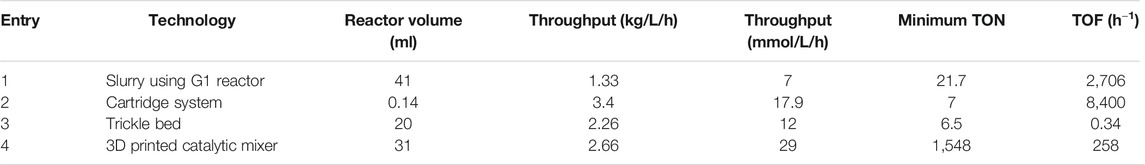
TABLE 6. Comparison of different flow hydrogenation methodologies (Slurry: this work, Cartridge Irfan et al. (2009), Trickle Bed: Carangio et al. (2020), 3D printed catalytic Mixer Kundra et al. (2021))
Firstly, the material of the G1 reactor is metal-free, giving a better chemical compatibility, including against hydrogen damage to metal parts (Woodtli and Kieselbach 2000; Dwivedi and Vishwakarma 2018). However, this phenomenon has only been observed in more extreme conditions compared to the ones used in this current case (usually at temperatures above 250°C).
As the substrates and the catalysts are different, a direct comparison of yield/methods cannot be directly carried out. However, an overall comparison is still relevant to compare the efficiency of the methods.
With a smaller reactor volume, the packed bed (entry 3) reached a high volumetric productivity (entry 2) of 2.26 kg/L/h versus 1.33 kg/L/h for the slurry system (entry 1), and up to 2.66 kg/L/h with the catalytic mixer (entry 4). Overall, this shows that all methods can offer the same range of throughput except for the H-Cube which is designed for laboratory scale. It has a productivity of up to 3.4 kg/L/h, but it has laboratory scale target and is not easily scalable.
However, while comparing the catalyst activity, the trend differs. As the packed bed reactor is filled with catalyst, it contains a large excess and the total amount is higher, resulting in a significantly lower turnover number (TON of 6.5 vs 21.7 for the slurry system). A run with more materials would significantly change this (19 h in the reported paper). The example using the H-Cube reports a TON of 7 due to the need of regularly replace cartridges. Lastly, the small amount of catalyst on the catalytic mixer meant a high TON of 1,548.
Looking at the turnover frequency (TOF), the catalytic mixer has a high TOF of 258 h−1, higher than the trickle bed and H-Cube. The slurry system, on the other hand, stands apart at 2,706 h−1. This is likely the effect of using continuously freshly activated catalyst. This shows the slurry method, although with a lower throughput, might be relevant in the case of a short-lived but very active catalyst. Such catalyst would mostly be beneficial in this case.
In terms of recycling, the catalyst slurry might get reused after filtration. H-cube uses cartridges which were changed at regular intervals in the published study. The trickle bed and catalytic mixers, if stable over time, do not necessitate filtration and thus are valuable solutions.
The main drawback of the use of slurry is the reliance on an adequate pump system, which has to be able to perform the pumping throughout the system without issue. This is critical and is very dependent on the pump used. Another main point of the slurry is the presence of the catalyst in the liquid. On the other hand, it needs an adequate filtering/removal system (Recho et al., 2014) as the presence of metals in the product is problematic in the pharmaceutical industry (Garrett and Prasad 2004) and requires removal and analytical method (Lukomski et al., 2020; Williams et al., 2020). This can be achieved with resin systems (for dissolved metal species) (Barbaras et al., 2009; Phillips et al., 2016) and subsequently filtration (Ottoboni et al., 2019).
The other positive point is that slurry use does not involve catalyst deactivation over time, as the metal involved can be prepared freshly, at any given time and on demand.
While the trickle bed method delivers high throughput and conversion, results are consistent while no deactivation arises (Brazier et al., 2014). Unfortunately, there are issues when it comes to the catalyst itself. Indeed, catalyst particle size distribution matters. It is the main variable issue as the catalyst may leach and there is a particle migration based on their sizes, leading to a higher pressure drop build up in the reactor (Wu et al., 2003; Li et al., 2004; Wu et al., 2006; Wu et al., 2007). Much work on the deactivation mechanism has been carried out, including investigation towards pressure drop (Quinn 2014) or hydrodynamic (Macdonald et al., 1979) equations, to better understand the technology (Hammond 2017; Carangio et al., 2020). Then, scaling up requires a good understanding of all key parameters (e.g., reactor volume, heat transfer, catalyst size) (Al-Dahhan et al., 1995; Hanusch et al., 2018; Wang et al., 2019).
Therefore, all different methods have their own advantages and limitations. Consequently, the selection of technology based on these criteria can be applied. In the case of short-lived catalyst species, the use of a slurry system is a noteworthy option.
Conclusion
The method and study described herein allows a safe continuous flow hydrogenation at kilo lab scale. The method relies on pumping a catalyst in slurry throughout the reaction and therefore delivers fresh catalyst to perform the reaction safely. After a risk assessment, the best auxiliaries were selected to ensure reliable delivery of material and stable conditions. The results were then exploited through statistical analysis to gain a deeper understanding of the system. The statistical method added an extra layer of investigation in the main parameters of the reaction.
Compared to existing methods, the reacting catalyst is always fresh and is not impacted by deactivation processes. The productivity is in the same order of magnitude and this method offers a range of options. We believe this method nicely complements other options available for hydrogenation reactions.
Data Availability Statement
The original contributions presented in the study are included in the article/Supplementary Material, further inquiries can be directed to the corresponding author.
Author Contributions
FS, AM, MW, and PR carried out the experiments. NY worked on the statistical analysis. PR, AM, NY, and FS wrote the manuscript. All authors reviewed the manuscript.
Conflict of Interest
Authors AM, MW, NY, and PR were employed by the company Corning SAS.
The remaining author declares that the research was conducted in the absence of any commercial or financial relationships that could be construed as a potential conflict of interest.
Publisher’s Note
All claims expressed in this article are solely those of the authors and do not necessarily represent those of their affiliated organizations, or those of the publisher, the editors and the reviewers. Any product that may be evaluated in this article, or claim that may be made by its manufacturer, is not guaranteed or endorsed by the publisher.
Acknowledgments
The author would like to thank Corning SAS and Mohammed Acherki.
Supplementary Material
The Supplementary Material for this article can be found online at: https://www.frontiersin.org/articles/10.3389/fceng.2021.701910/full#supplementary-material
References
Al-Dahhan, M. H., Larachi, F., Dudukovic, M. P., Laurent, A., and Laurent, A. (1997). High-Pressure Trickle-Bed Reactors: A Review. Ind. Eng. Chem. Res. 36 (8), 3292–3314. doi:10.1021/ie9700829
Al-Dahhan, M. H., Wu, Y., Dudukovic, M. P., and Dudukovic, M. P. (1995). Reproducible Technique for Packing Laboratory-Scale Trickle-Bed Reactors with a Mixture of Catalyst and Fines. Ind. Eng. Chem. Res. 34 (3), 741–747. doi:10.1021/ie00042a005
Allian, A. D., Shah, N. P., Ferretti, A. C., Brown, D. B., Kolis, S. P., and Sperry, J. B. (2020). Process Safety in the Pharmaceutical Industry-Part I: Thermal and Reaction Hazard Evaluation Processes and Techniques. Org. Process. Res. Dev. 24, 2529–2548. doi:10.1021/acs.oprd.0c00226
Barbaras, D., Brozio, J., Johannsen, I., and Allmendinger, T. (2009). Removal of Heavy Metals from Organic Reaction Mixtures: Preparation and Application of Functionalized Resins. Org. Process. Res. Dev. 13 (6), 1068–1079. doi:10.1021/op900102a
Battilocchio, C., Hawkins, J. M., and Ley, S. V. (2013). A Mild and Efficient Flow Procedure for the Transfer Hydrogenation of Ketones and Aldehydes Using Hydrous Zirconia. Org. Lett. 15 (9), 2278–2281. doi:10.1021/ol400856g
Brazier, J. B., Nguyen, B. N., Adrio, L. A., Barreiro, E. M., Leong, W. P., Newton, M. A., et al. (2014). Catalysis in Flow: Operando Study of Pd Catalyst Speciation and Leaching. Catal. Today. 229 (June), 95–103. doi:10.1016/j.cattod.2013.10.079
Buisson, B., Donegan, S., Wray, D., Parracho, A., Gamble, J., Caze, P., et al. (2009). Slurry Hydrogenation in a Continuous Flow Reactor for Pharmaceutical Application. Chem. Today. 27 (6), 12–16.
Carangio, A., Edwards, L. J., Fernandez-Puertas, E., Hayes, J. F., Kucharski, M. M., Rutherford, G. W., et al. (2020). Evaluation of Sponge Metal Catalysts in a Trickle Bed Reactor for the Continuous Hydrogenation of an Aliphatic Nitro Intermediate. Org. Process. Res. Dev. 24 (10), 1909–1915. doi:10.1021/acs.oprd.9b00447
Ciriminna, R., and Pagliaro, M. (2013). Green Chemistry in the Fine Chemicals and Pharmaceutical Industries. Org. Process. Res. Dev. 17 (12), 1479–1484. doi:10.1021/op400258a
Cole, K. P., Reizman, B. J., Hess, M., GrohGroh, J. M., Laurila, M. E., Cope, R. F., et al. (2019). Small-Volume Continuous Manufacturing of Merestinib. Part 1. Process Development and Demonstration. Org. Process. Res. Dev. 23 (5), 858–869. doi:10.1021/acs.oprd.8b00441
Cossar, P. J., Hizartzidis, L., Simone, M. I., McCluskey, A., and Gordon, C. P. (2015). The Expanding Utility of Continuous Flow Hydrogenation. Org. Biomol. Chem. 13 (26), 7119–7130. doi:10.1039/C5OB01067E
Darvishi, A., Davand, R., Khorasheh, F., and Fattahi, M. (2016). Modeling-Based Optimization of a Fixed-Bed Industrial Reactor for Oxidative Dehydrogenation of Propane. Chin. J. Chem. Eng. 24 (5), 612–622. doi:10.1016/j.cjche.2015.12.018
Deutschmann, O., Knözinger, H., Kochloefl, K., and Turek, T. (2009). “Heterogeneous Catalysis and Solid Catalysts,” in Ullmann’s Encyclopedia of Industrial Chemistry (Weinheim, Germany: Wiley-VCH Verlag GmbH & Co. KGaA). a05_313.pub2. doi:10.1002/14356007.a05_313.pub2
Dillon, E., Jimenez, G., Davie, A., Bulak, J., Nesbit, S., and Craft, A. (2009). Factors Influencing the Tensile Strength, Hardness, and Ductility of Hydrogen-Cycled Palladium. Mater. Sci. Eng. A. 524 (1–2), 89–97. doi:10.1016/j.msea.2009.07.036
Duan, S., Feng, X., Gonzalez, M., Bader, S., Hayward, C., Ljubicic, T., et al. (2020). Developing a Multistep Continuous Manufacturing Process for (1R,2R)-2-Amino-1-Methylcyclopentan-1-Ol. Org. Process. Res. Dev. 24 (11), 2734–2744. doi:10.1021/acs.oprd.0c00405
Durndell, L. J., Isaacs, M. A., Li, C. e., Parlett, C. M. A., Wilson, K., and Lee, A. F. (2019). Cascade Aerobic Selective Oxidation over Contiguous Dual-Catalyst Beds in Continuous Flow. ACS Catal. 9 (6), 5345–5352. doi:10.1021/acscatal.9b00092
Dwivedi, S. K., and Vishwakarma, M. (2018). Hydrogen Embrittlement in Different Materials: A Review. Int. J. Hydrogen Energ. 43 (46), 21603–21616. doi:10.1016/j.ijhydene.2018.09.201
Fernandez-Puertas, E., Robinson, A. J., Robinson, H., Sathiyalingam, S., Stubbs, H., and Edwards, L. J. (2020). Evaluation and Screening of Spherical Pd/C for Use as a Catalyst in Pharmaceutical-Scale Continuous Hydrogenations. Org. Process. Res. Dev. 24 (10), 2147–2156. doi:10.1021/acs.oprd.0c00183
Gardiner, J., Nguyen, X., Genet, C., Horne, M. D., Hornung, C. H., and Tsanaktsidis, J. (2018). Catalytic Static Mixers for the Continuous Flow Hydrogenation of a Key Intermediate of Linezolid (Zyvox). Org. Process. Res. Dev. 22 (10), 1448–1452. doi:10.1021/acs.oprd.8b00153
Garrett, C. E., and Prasad., K. (2004). The Art of Meeting Palladium Specifications in Active Pharmaceutical Ingredients Produced by Pd-Catalyzed Reactions. Adv. Synth. Catal. 346 (8), 889–900. doi:10.1002/adsc.200404071
Glasnov, T. (2016). Continuous-Flow Chemistry in the Research Laboratory: Modern Organic Chemistry in Dedicated Reactors at the Dawn of the 21st Century. Cham: Springer International Publishing. doi:10.1007/978-3-319-32196-7
Glasnov, T. N., and Kappe, C. O. (2010). Toward a Continuous-Flow Synthesis of Boscalid. Adv. Synth. Catal. 352 (17), 3089–3097. doi:10.1002/adsc.201000646
Gray, M. R., Srinivasan, N., and Masliyah, J. H. (2002). Pressure Buildup in Gas-Liquid Flow through Packed Beds Due to Deposition of Fine Particles. Can. J. Chem. Eng. 80 (3), 346–354. doi:10.1002/cjce.5450800302
Guan, F., Kapur, N., Sim, L., Taylor, C. J., Wen, J., Zhang, X., et al. (2020). A Universal Reactor Platform for Batch and Flow: Application to Homogeneous and Heterogeneous Hydrogenation. React. Chem. Eng. 5 (10), 1903–1908. doi:10.1039/D0RE00061B
Guidi, M., Seeberger, P. H., and Gilmore, K. (2020). How to Approach Flow Chemistry. Chem. Soc. Rev. 49, 8910–8932. doi:10.1039/C9CS00832B
Gulotty, R. J., Rish, S., Boyd, A., Mitchell, L., Plageman, S., McGill, C., et al. (2018). Run Parameters for a Continuous Hydrogenation Process Using ACMC-Pd to Replace Commercial Batch Reactor Processes. Org. Process. Res. Dev. 22 (12), 1622–1627. doi:10.1021/acs.oprd.8b00286
Gutmann, B., Cantillo, D., and Kappe, C. O. (2015). Continuous-Flow Technology-A Tool for the Safe Manufacturing of Active Pharmaceutical Ingredients. Angew. Chem. Int. Ed. 54 (23), 6688–6728. doi:10.1002/anie.201409318
Hammond, C. (2017). Intensification Studies of Heterogeneous Catalysts: Probing and Overcoming Catalyst Deactivation during Liquid Phase Operation. Green. Chem. 19 (12), 2711–2728. doi:10.1039/C7GC00163K
Hanusch, F., Rehfeldt, S., and Klein, H. (2018). Liquid Maldistribution in Random-Packed Columns: Experimental Investigation of Influencing Factors. Chem. Eng. Technol. 41 (11), 2241–2249. doi:10.1002/ceat.201800467
Hickman, D. A., Holbrook, M. T., Mistretta, S., and Rozeveld, S. J. (2013). Successful Scale-Up of an Industrial Trickle Bed Hydrogenation Using Laboratory Reactor Data. Ind. Eng. Chem. Res. 52 (44), 15287–15292. doi:10.1021/ie4005354
Hofferb, W., Voss, H., Schwab, E., Rheude, U., Kaibel, G., Haake, M., et al. (2006). METHOD FOR CONTINUOUS HYDROGENATION OR HYDROGENATING AMINATION. WO2007045641, filed April 26, 2007, and issued October 16, 2006. Available at: https://patentscope.wipo.int/search/fr/detail.jsf?docId=WO2007045641 (Accessed March 16, 2021).
Horn, C. R., and Cerato-Noyerie, C. (2014). A PdCl2-Based Hydrogenation Catalyst for Glass Microreactors. J. Flow Chem. 4 (3), 110–112. doi:10.1556/JFC-D-13-00036
Hornung, C. H., Nguyen, X., Carafa, A., Gardiner, J., Urban, A., Fraser, D., et al. (2017). Use of Catalytic Static Mixers for Continuous Flow Gas-Liquid and Transfer Hydrogenations in Organic Synthesis. Org. Process. Res. Dev. 21 (9), 1311–1319. doi:10.1021/acs.oprd.7b00180
Irfan, M., Glasnov, T. N., and Kappe, C. O. (2011). Heterogeneous Catalytic Hydrogenation Reactions in Continuous-Flow Reactors. ChemSusChem 4 (3), 300–316. doi:10.1002/cssc.201000354
Irfan, M., Petricci, E., Glasnov, T. N., Taddei, M., and Kappe, C. O. (2009). Continuous Flow Hydrogenation of Functionalized Pyridines. Eur. J. Org. Chem. 2009 (9), 1327–1334. doi:10.1002/ejoc.200801131
Jiménez-González, C., Poechlauer, P., Broxterman, Q. B., Yang, B.-S., am Ende, D., Baird, J., et al. (2011). Key Green Engineering Research Areas for Sustainable Manufacturing: A Perspective from Pharmaceutical and Fine Chemicals Manufacturers. Org. Process. Res. Dev. 15 (4), 900–911. doi:10.1021/op100327d
Johnson, M. D., May, S. A., Calvin, J. R., Remacle, J., Stout, J. R., Diseroad, W. D., et al. (2012). Development and Scale-Up of a Continuous, High-Pressure, Asymmetric Hydrogenation Reaction, Workup, and Isolation. Org. Process. Res. Dev. 16 (5), 1017–1038. doi:10.1021/op200362h
Jung, J., Kang, H., Cao, S. C., Al-Raoush, R. I., Alshibli, K., Lee, J. Y., et al. (2019). Effects of Fine-Grained Particles' Migration and Clogging in Porous Media on Gas Production from Hydrate-Bearing Sediments. Geofluids 2019 (May), 1–11. doi:10.1155/2019/5061216
Kobayashi, S., Okumura, M., Akatsuka, Y., Miyamura, H., Ueno, M., and Oyamada, H. (2015). Powerful Continuous-Flow Hydrogenation by Using Poly(Dimethyl)Silane-Supported Palladium Catalysts. ChemCatChem 7 (24), 4025–4029. doi:10.1002/cctc.201500973
Koekemoer, A., and Luckos, A. (2015). Effect of Material Type and Particle Size Distribution on Pressure Drop in Packed Beds of Large Particles: Extending the Ergun Equation. Fuel 158 (October), 232–238. doi:10.1016/j.fuel.2015.05.036
Kowalski, S. M. (2002). 24 Run Split-Plot Experiments for Robust Parameter Design. J. Qual. Tech. 34 (4), 399–410. doi:10.1080/00224065.2002.11980172
Kundra, M., Grall, T., Ng, D., Xie, Z., and Hornung, C. H. (2021). Continuous Flow Hydrogenation of Flavorings and Fragrances Using 3D-Printed Catalytic Static Mixers. Ind. Eng. Chem. Res. 60 (5), 1989–2002. doi:10.1021/acs.iecr.0c05671
Lavric, E. D., and Cerato-Noyerie, C. (2012). Mass Transfer in Gas-Liquid Flow in Corning® Advanced-FlowTM Reactors. Chem. Eng. Trans. 29 (September), 979–984. doi:10.3303/CET1229164
Lebl, R., Zhu, Y., Ng, D., Hornung, C. H., Cantillo, D., and Kappe, C. O. (2020). Scalable Continuous Flow Hydrogenations Using Pd/Al2O3-Coated Rectangular Cross-Section 3D-Printed Static Mixers. Catal. Today., S0920586120305174. doi:10.1016/j.cattod.2020.07.046
Li, Y., Wu, D., and Lin, Y. S. (2004). Mechanical Strength and Reliability of Solid Catalysts. China Particuology. 2 (2), 53–62. doi:10.1016/S1672-2515(07)60024-4
Lukomski, L., Pohorilets, I., and Koide, K. (2020). Third-Generation Method for High-Throughput Quantification of Trace Palladium by Color or Fluorescence. Org. Process. Res. Dev. 24 (1), 85–95. doi:10.1021/acs.oprd.9b00472
Macdonald, I. F., El-Sayed, M. S., Mow, K., and Dullien, F. A. L. (1979). Flow through Porous Media-the Ergun Equation Revisited. Ind. Eng. Chem. Fund. 18 (3), 199–208. doi:10.1021/i160071a001
Mallia, C. J., and Baxendale, I. R. (2016). The Use of Gases in Flow Synthesis. Org. Process. Res. Dev. 20 (2), 327–360. doi:10.1021/acs.oprd.5b00222
Marie, S., Trani, A., and Pilia, R. (2010). CONTINUOUS METHOD FOR THE HYDROGENATION OF AROMATIC COMPOUNDS. WO/2011/001041, filed January 6, 2011, and issued June 10, 2010. Available at: https://patentscope.wipo.int/search/en/detail.jsf?docId=WO2011001041 (Accessed March 16, 2021).
Mason, B. P., Price, K. E., Steinbacher, J. L., Bogdan, A. R., and McQuade, D. T. (2007). Greener Approaches to Organic Synthesis Using Microreactor Technology. Chem. Rev. 107 (6), 2300–2318. doi:10.1021/cr050944c
May, S. A. (2017). Flow Chemistry, Continuous Processing, and Continuous Manufacturing: A Pharmaceutical Perspective. J. Flow Chem. 7 (3–4), 137–145. doi:10.1556/1846.2017.00029
Mercadante, M. A., Kelly, C. B., Lee, C., and Leadbeater, N. E. (2012). Continuous Flow Hydrogenation Using an On-Demand Gas Delivery Reactor. Org. Process. Res. Dev. 16 (5), 1064–1068. doi:10.1021/op300019w
Mo, Y., Imbrogno, J., Zhang, H., and Jensen, K. F. (2018). Scalable Thin-Layer Membrane Reactor for Heterogeneous and Homogeneous Catalytic Gas-Liquid Reactions. Green. Chem. 20 (16), 3867–3874. doi:10.1039/C8GC01917G
Molnár, Á., and Papp, A. (2017). Catalyst Recycling-A Survey of Recent Progress and Current Status. Coord. Chem. Rev. 349 (October), 1–65. doi:10.1016/j.ccr.2017.08.011
Montgomery, D. C. (2004). Design and Analysis of Experiments. Sixth Edition. Phoenix: Arizona State University.
Moreno-Marrodan, C., Liguori, F., and Barbaro, P. (2017). Continuous-Flow Processes for the Catalytic Partial Hydrogenation Reaction of Alkynes. Beilstein J. Org. Chem. 13 (April), 734–754. doi:10.3762/bjoc.13.73
Navarro-Fuentes, F., Keane, M. A., and Ni, X. W. (2021). Continuous Hydrogenation of Alkynol in a Continuous Oscillatory Baffled Reactor. Org. Process. Res. Dev. 25, 206–211. doi:10.1021/acs.oprd.0c00458
O'Brien, M., Taylor, N., Polyzos, A., Baxendale, I. R., and Ley, S. V. (2011). Hydrogenation in Flow: Homogeneous and Heterogeneous Catalysis Using Teflon AF-2400 to Effect Gas-Liquid Contact at Elevated Pressure. Chem. Sci. 2 (7), 1250. doi:10.1039/c1sc00055a
Orlandi, M., Brenna, D., Harms, R., Jost, S., and Benaglia, M. (2018). Recent Developments in the Reduction of Aromatic and Aliphatic Nitro Compounds to Amines. Org. Process. Res. Dev. 22 (4), 430–445. doi:10.1021/acs.oprd.6b00205
Ottoboni, S., Price, C. J., Steven, C., Meehan, E., Barton, A., Firth, P., et al. (2019). Development of a Novel Continuous Filtration Unit for Pharmaceutical Process Development and Manufacturing. J. Pharm. Sci. 108 (1), 372–381. doi:10.1016/j.xphs.2018.07.005
Oyamada, H., Naito, T., and Kobayashi, S. (2011). Continuous Flow Hydrogenation Using Polysilane-Supported Palladium/Alumina Hybrid Catalysts. Beilstein J. Org. Chem. 7 (May), 735–739. doi:10.3762/bjoc.7.83
Papari, S., Kazemeini, M., and Fattahi, M. (2012). A Comparison between Heterogeneous and Homogeneous Gas Flow Model in Slurry Bubble Column Reactor for Direct Synthesis of Dme. March 6 (3), 233–237. doi:10.5281/ZENODO.1059976
Papari, S., Kazemeini, M., Fattahi, M., and Fatahi, M. (2014). DME DIRECT SYNTHESIS FROM SYNGAS IN A LARGE-SCALE THREE-PHASE SLURRY BUBBLE COLUMN REACTOR: TRANSIENT MODELING. Chem. Eng. Commun. 201 (5), 612–634. doi:10.1080/00986445.2013.782292
Phillips, S., Holdsworth, D., Kauppinen, P., and Mac Namara, C. (2016). Palladium Impurity Removal from Active Pharmaceutical Ingredient Process Streams. Johnson Matthey Tech. Rev. 60 (4), 277–286. doi:10.1595/205651316X693247
Poechlauer, P., Colberg, J., Fisher, E., Jansen, M., Johnson, M. D., Koenig, S. G., et al. (2013). Pharmaceutical Roundtable Study Demonstrates the Value of Continuous Manufacturing in the Design of Greener Processes. Org. Process. Res. Dev. 17 (12), 1472–1478. doi:10.1021/op400245s
Porta, R., Benaglia, M., and Puglisi, A. (2016). Flow Chemistry: Recent Developments in the Synthesis of Pharmaceutical Products. Org. Process. Res. Dev. 20 (1), 2–25. doi:10.1021/acs.oprd.5b00325
Quinn, H. M. (2014). A Reconciliation of Packed Column Permeability Data: Column Permeability as a Function of Particle Porosity. J. Mater. 2014 (April), 1–22. doi:10.1155/2014/636507
Perry, R. H., and Green, D. W. (2008). Perry’s Chemical Engineers’ Handbook. 8th ed. (New York: McGraw-Hill).
Rabbani, S., Sassi, M., and Shamim, T. (2017). Modeling of Hydrodynamics of Fine Particles Deposition in Packed-Bed Reactors. The J. Comput. Multiphase Flows. 9 (4), 157–168. doi:10.1177/1757482X17716045
Ramezani, M., Kashfipour, M. A., and Abolhasani, M. (2020). Minireview: Flow Chemistry Studies of High-Pressure Gas-Liquid Reactions with Carbon Monoxide and Hydrogen. J. Flow Chem. 10 (1), 93–101. doi:10.1007/s41981-019-00059-4
Rathi, A. K., Gawande, M. B., Ranc, V., Pechousek, J., Petr, M., Cepe, K., et al. (2016). Continuous Flow Hydrogenation of Nitroarenes, Azides and Alkenes Using Maghemite-Pd Nanocomposites. Catal. Sci. Technol. 6 (1), 152–160. doi:10.1039/C5CY00956A
Recho, J., Black, R. J. G., North, C., Ward, J. E., and Wilkes, R. D. (2014). Statistical DoE Approach to the Removal of Palladium from Active Pharmaceutical Ingredients (APIs) by Functionalized Silica Adsorbents. Org. Process. Res. Dev. 18 (5), 626–635. doi:10.1021/op5000336
Rinaldi, R. (2014). “Chapter 4. Solvents and Solvent Effects in Biomass Conversion,” in Energy and Environment Series. Editor R. Rinaldi (Cambridge: Royal Society of Chemistry), 74–98. doi:10.1039/9781782620099-00074
Russell, C. C., Baker, J. R., Cossar, P. J., and McCluskey, A. (2017). “Recent Developments in the Use of Flow Hydrogenation in the Field of Medicinal Chemistry,” in New Advances in Hydrogenation Processes - Fundamentals and Applications. Editor M. T. Ravanchi (London, UK: InTech). doi:10.5772/65518
Saroha, A. K., and Nigam, K. D. P. (1996). TRICKLE BED REACTORS. Rev. Chem. Eng. 12 (3–4), 207–347. doi:10.1515/REVCE.1996.12.3-4.207
Savchenko, V. I., Dorokhov, V. G., Makaryan, I. A., Sedov, I. V., and Arutyunov, V. S. (2016). Slurry Reactor System with Inertial Separation for Fischer-Tropsch Synthesis and Other Three-phase Hydrogenation Processes. Can. J. Chem. Eng. 94 (3), 518–523. doi:10.1002/cjce.22413
Sperry, J. B., Azuma, M., and Stone., S. (2021). Explosive Hazard Identification in Pharmaceutical Process Development: A Novel Screening Method and Workflow for Shipping Potentially Explosive Materials. Org. Process. Res. Dev. 25, 212–224. doi:10.1021/acs.oprd.0c00467
Tanimu, A., Jaenicke, S., and Alhooshani, K. (2017). Heterogeneous Catalysis in Continuous Flow Microreactors: A Review of Methods and Applications. Chem. Eng. J. 327 (November), 792–821. doi:10.1016/j.cej.2017.06.161
Taylor, C. J., Baker, A., Chapman, M. R., Reynolds, W. R., Jolley, K. E., Clemens, G., et al. (2021). Flow Chemistry for Process Optimisation Using Design of Experiments. J. Flow Chem. 11, 75–86. doi:10.1007/s41981-020-00135-0
Trotter, H. F., and Tukey, J. W. (1956). “Conditional Monte Carlo for Normal Samples,” in Proc. Symp. Monte Carlo. Editor H. A. Meyer (New York: John Wiley), 64–79.
Tsubogo, T., Oyamada, H., and Kobayashi, S. (2015). Multistep Continuous-Flow Synthesis of (R)- and (S)-Rolipram Using Heterogeneous Catalysts. Nature 520 (7547), 329–332. doi:10.1038/nature14343
Wang, S., Xu, C., Liu, W., and Liu, Z. (2019). Numerical Study on Heat Transfer Performance in Packed Bed. Energies 12 (3), 414. doi:10.3390/en12030414
Westerterp, K. R., Molga, E. J., and van Gelder, K. B. (1997). Catalytic Hydrogenation Reactors for the Fine Chemicals Industries. Their Design and Operation. Chem. Eng. Process: Process Intensification. 36 (1), 17–27. doi:10.1016/S0255-2701(96)04168-2
Williams, J. M., Wanner, A. K., and Koide, K. (2020). Catalysis-Based Fluorometric Method for Trace Palladium Detection with Improved Convenience. Org. Process. Res. Dev. 24 (12), 2941–2949. doi:10.1021/acs.oprd.0c00377
Woodtli, J., and Kieselbach, R. (2000). Damage Due to Hydrogen Embrittlement and Stress Corrosion Cracking. Eng. Fail. Anal. 7 (6), 427–450. doi:10.1016/S1350-6307(99)00033-3
Wu, D. F., Zhou, J. C., and Li, Y. D. (2006). Distribution of the Mechanical Strength of Solid Catalysts. Chem. Eng. Res. Des. 84 (12), 1152–1157. doi:10.1205/cherd05015
Wu, D., Song, L., Zhang, B., and Li, Y. (2003). Effect of the Mechanical Failure of Catalyst Pellets on the Pressure Drop of a Reactor. Chem. Eng. Sci. 58 (17), 3995–4004. doi:10.1016/S0009-2509(03)00286-0
Wu, D., Zhou, J., and Li, Y. (2007). Mechanical Strength of Solid Catalysts: Recent Developments and Future Prospects. Aiche J. 53 (10), 2618–2629. doi:10.1002/aic.11291
Yoswathananont, N., Nitta, K., Nishiuchi, Y., and Sato, M. (2005). Continuous Hydrogenation Reactions in a Tube Reactor Packed with Pd/C. Chem. Commun. 1, 40. doi:10.1039/b410014j
Keywords: hydrogenation, flow chemistry, heterogenous catalysis, slurry, palladium, pump, design of experiments, statistical analysis
Citation: Salique F, Musina A, Winter M, Yann N and Roth PMC (2021) Continuous Hydrogenation: Triphasic System Optimization at Kilo Lab Scale Using a Slurry Solution. Front. Chem. Eng. 3:701910. doi: 10.3389/fceng.2021.701910
Received: 28 April 2021; Accepted: 19 July 2021;
Published: 04 August 2021.
Edited by:
Raoni Schroeder, Federal University of Rio de Janeiro, BrazilReviewed by:
Moslem Fattahi, Petroleum University of Technology, IranJonathan McDonough, Newcastle University, United Kingdom
Rodrigo O. M. A. de Souza, Federal University of Rio de Janeiro, Brazil
Copyright © 2021 Salique, Musina, Winter, Yann and Roth. This is an open-access article distributed under the terms of the Creative Commons Attribution License (CC BY). The use, distribution or reproduction in other forums is permitted, provided the original author(s) and the copyright owner(s) are credited and that the original publication in this journal is cited, in accordance with accepted academic practice. No use, distribution or reproduction is permitted which does not comply with these terms.
*Correspondence: Philippe M. C. Roth, cm90aHBAY29ybmluZy5jb20=, cmVhY3RvcnNAY29ybmluZy5jb20=
†Present address: Florian Salique, ERIP Evaluation des risques d’incendie et d’explosion dans les procédé, INERIS, Institut National de l’environnement industriel et des risques, Verneuil-en-Halatte, France