Gas–Liquid Slug Flow Studies in Microreactors: Effect of Nanoparticle Addition on Flow Pattern and Pressure Drop
- Department of Chemical Engineering, Engineering and Technology Institute Groningen, University of Groningen, Groningen, Netherlands
Colloidal suspensions of nanoparticles (e.g., metals and oxides) have been considered as a promising working fluid in microreactors for achieving significant process intensification. Existing examples include their uses in microflow as catalysts for enhancing the reaction efficiency, or as additives to mix with the base fluid (i.e., to form the so-called nanofluids) for heat/mass transfer intensification. Thus, hydrodynamic characterization of such suspension flow in microreactors is of high importance for a rational design and operation of the system. In this work, experiments have been conducted to investigate the flow pattern and pressure drop characteristics under slug flow between N2 gas and colloidal suspensions in the presence of TiO2 or Al2O3 nanoparticles through polytetrafluoroethylene (PTFE) capillary microreactors. The base fluid consisted of water or its mixture with ethylene glycol. The slug flow pattern with nanoparticle addition was characterized by the presence of a lubricating liquid film around N2 bubbles, in contrast to the absence of liquid film in the case of N2-water slug flow. This shows that the addition of nanoparticles has changed the wall wetting property to be more hydrophilic. Furthermore, the measured pressure drop under N2-nanoparticle suspension slug flow is well described by the model of Kreutzer et al. (AIChE J 51(9):2428–2440, 2005) at the mixture Reynolds numbers ca. above 100 and is better predicted by the model of Warnier et al. (Microfluidics and Nanofluidics 8(1):33–45, 2010) at lower Reynolds numbers given a better consideration of the effect of film thickness and bubble velocity under such conditions in the latter model. Therefore, the employed nanoparticle suspension can be considered as a stable and pseudo single phase with proper fluid properties (e.g., viscosity and density) when it comes to the pressure drop estimation.
Introduction
Over recent decades, microreactor technology has been heralded as a highly promising concept for achieving significant process intensification in comparison with conventional scale reactors, owing to its distinct advantages including, e.g., high heat/mass transfer rates, precise process/reaction control under well-regulated flow patterns in miniaturized channels (Jensen, 2017). As a result, microreactors have received numerous research attention regarding their application potential in various chemical and material synthesis, where one typical case is seen in the uncatalyzed or homogeneously catalyzed gas–liquid/liquid–liquid microflow applications, such as extraction (Jovanović et al., 2011; Susanti et al., 2016), phase transfer catalysis (Magosso et al., 2021), gas absorption (Yao et al., 2017), oxidation reactions (Leclerc et al., 2008; Hommes et al., 2020), and biphasic transformations using other gases (Mallia and Baxendale, 2016).
Heterogeneous catalysts, due to their easiness in recycling and product separation, are more preferred than homogeneous ones to be applied in catalytic reactions. The most common way to introduce solid catalysts in microreactors is by coating a thin layer on the wall or applying a packed bed configuration (Yue, 2018). However, such catalyst immobilization has some drawbacks such as the requirement of tailored catalyst-coating procedures, high-pressure drop penalty and complex multiphase hydrodynamics over the packed bed. Another option is to suspend solid catalyst microparticles in the form of slurry flowing in microreactors, which has been explored for gas–liquid hydrogenation (Liedtke et al., 2013; Salique et al., 2021) and photocatalytic reactions such as liquid-phase fluorination and polymerization (Pieber et al., 2018; Li et al., 2021). In this aspect, the high activity and mobility of nanoparticle catalysts has also intrigued their promising uses in the form of colloidal suspensions in microreactors recently for catalytic reaction efficiency enhancement. For example, colloidal suspensions of rhodium/platinum nanoparticles (in the aqueous phase) have been employed for catalyzing gas–liquid–liquid hydrogenation of various alkenes (Yap et al., 2014; Yap et al., 2017), where a considerable reactant conversion was achieved in microreactors at a reaction time of ca. 10–100 times smaller than that required in the batch reactor. This efficiency increase is attributed to the much enhanced mass transfer rates of organic substrate and H2 toward the catalyst at the interface in microreactors, allowing to approach the intrinsic catalytic activity. Moreover, continuous transport of colloidal suspensions of metal oxide nanoparticles as the catalyst (support) in microreactors has been reported in liquid-phase reactions, such as using SiO2-supported FeCl3 catalyst in the benzylation of toluene (Pu and Su, 2018) and TiO2 catalyst for the photocatalytic reduction of nitrobenzene (Pu et al., 2019).
Colloidal nanoparticles (e.g., metals, oxides, and carbon nanostructures) were also used as the so-called nanofluids for modifying functional properties of the base fluid (e.g., water, glycols and oils) (Ali and Salam, 2020), offering potential applications in microreactors for heat and mass transfer intensification. The addition of such nanoparticles can improve the thermal conductivity of the base fluid and, thus, heat transfer capabilities (Verma and Tiwari, 2017). For example, the addition of 1.5 vol% TiO2 nanoparticles to water in microchannels substantially increased the heat transfer rate by 39.7% compared with the experiment with only pure water (Manay and Sahin, 2016). The application prospect of Al2O3-based nanofluids is also wide in many aspects involving heat transfer, given the relatively high thermal conductivity of Al2O3 (Zhang et al., 2013; Sivakumar et al., 2016). Numerical studies of gas–liquid slug flow in microreactors using CuO/H2O nanofluid were performed by Zhang et al. (2020). The heat transfer coefficient increased as the nanoparticle concentration increased (1–3 vol%), while it decreased with the increase in gas void fraction from 0.25 to 0.5. The enhancement of heat transfer coefficient reached a maximum of 4% with 3 vol% CuO nanoparticles in water at a high Reynolds number (Re) of 500. However, in the much higher range of nanoparticle concentrations, the nanofluid viscosity increased dramatically, which leads to a decrease in the (maximum) heat transfer coefficient and performance in microreactors. In addition, nanofluids represent a promising new solvent system for improving gas absorption rates. The gas-nanofluid slug flow was utilized to enhance the mass transfer of CO2 absorption in a square microchannel, where the liquid side volumetric mass transfer coefficient with the addition of nanoparticles (i.e., 20 wt% silica) was measured to be 2.6 times of that in pure water at a high gas–liquid flow ratio (Huang et al., 2021). Several mechanisms of mass transfer enhancement in conventional reactors with the addition of nanoparticles have been proposed, including the shuttle effect, bubble breaking effect and hydrodynamic effect (Cheng et al., 2019). Typically, nanoparticles are considered to enhance the mass transfer via, e.g., its cycling in the liquid phase (thereby realizing the exchange of the adsorbed gas) or adhering on the bubble surface to avoid coalescence, which remains to be studied in depth in microreactors.
In the abovementioned microreactor systems with colloidal nanoparticle suspension flow, the microreactor performance is closely affected by the flow pattern inside (Yap et al., 2014; Cheng et al., 2019; Huang et al., 2021). Especially, multiphase flow patterns in microreactors are largely affected by viscous forces and surface tension (Angeli and Gavriilidis, 2008). Pressure drop is another essential parameter for a rational design and operation of microreactor systems (e.g., in choosing the working pump, flow rate ranges), which also helps provide rich insights into the inner details of flow patterns and relevant mass transfer properties (e.g., gas–liquid interaction and reactor parameter values that are dependent on the gaseous flow rate) (Warnier et al., 2010; Molla et al., 2011; Yin et al., 2018). The addition of nanoparticles would exert a certain influence on the flow pattern and pressure drop due to the change in liquid physical properties, which is, therefore, of vital importance to be well studied and understood toward realizing the abovementioned promising applications of colloidal nanoparticle suspensions in microflow.
This work deals with the characterization of flow pattern and pressure drop under gas–colloidal suspension slug flow in the presence of TiO2 or Al2O3 nanoparticles in microreactors, based on the further consideration of numerous benefits that slug flow processing offers for solid-catalyzed gas–liquid reactions (Yue, 2018), heat/mass transfer intensification in the presence of nanofluids (Cheng et al., 2019; Huang et al., 2021). So far, very limited hydrodynamic studies of gas–nanofluid slug flow in microreactors have been reported (Zhang et al., 2020; Huang et al., 2021). N2-CuO/water nanofluid slug flow was numerically studied in a vertical capillary with an inner diameter of 1.0 mm (Zhang et al., 2020). A thicker liquid film in the nanofluid than that in pure liquid was predicted due to the decreased surface tension of nanofluid. The overall gas–nanofluid pressure drop increased with the increase in nanofluid concentration and the mixture Reynolds number, while it decreased with increasing the gas void fraction. Similar results on pressure drop were also found in the experimental work of CO2 absorption in SiO2/water nanofluids under slug flow in microreactors (Huang et al., 2021). However, no pressure drop models were established in both works.
It is noteworthy that pressure drop under slug flow of gas and pure liquid (i.e., without solid particle presence) has received significant investigations both in numerical and experimental studies. Several pressure drop models have been introduced based on the homogeneous flow or Lockhart–Martinelli approach (Kawahara et al., 2002; Yue et al., 2007; Fries et al., 2008; Cygański et al., 2012). These models are highly empirical and not well suited for the case of gas–liquid slug flow, as they did not consider the influence of slug flow inner details (e.g., bubble/slug lengths) and surface tension effects, which are important in determining pressure drop in microreactors (Yue et al., 2008; Warnier et al., 2010). It is now commonly recognized that the overall pressure drop of gas–liquid slug flow through microchannels consists of the frictional pressured drop in the slug and the additional interfacial pressure drop caused by the bubble presence, as elaborated in the notable work of Kreutzer et al. (2005). With surface tension effects and slug length being considered, Kreutzer et al. (2005) described that the frictional pressure drop gradient (
where dc is the diameter of the (micro)channel, ρl is the liquid density, and Umix is the mixture velocity (here equal to the sum of gas and liquid superficial velocities, i.e., = Ug + Ul). Ls and Lb are the lengths of liquid slug and bubble, respectively (see Figure 1). Remix is the Reynolds number, and Camix is the capillary number, both defined based on Umix (i.e., Remix = dcUmixρl/μl and Camix = μlUmix/σ; where μl and σ denote the liquid viscosity and surface tension, respectively). The parameter a in Eq. 1 was determined via CFD simulation to be 0.07, while the experimental pressure drop data of air–liquid (water, decane, or tetradecane) in a capillary of 2.3-mm internal diameter are described by this equation if a higher value (a = 0.17) is used, which is ascribed to Marangoni effects of impurities likely present in the tested liquids.
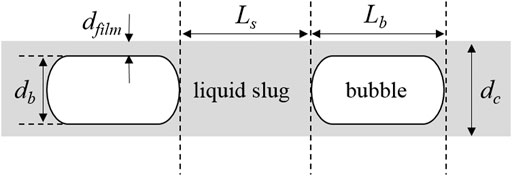
FIGURE 1. Configurations of gas–liquid slug flow in a microreactor (in the case of the microchannel wall being wetted by the liquid).
The semi-empirical pressure drop model of Kreutzer et al. (2005) was obtained under relatively large Reynolds numbers (e.g., Remix being typically above 100). Considering that the bubble shape and liquid film thickness (dfilm) at relatively lower Reynolds numbers would be different, thus, affecting the pressure drop to some extent, Warnier et al. (2010) proposed a modified model as shown below:
where Cab is the capillary number based on the bubble velocity Ub (Cab = μlUb/σ). δ is the correction parameter for the liquid slug length by further considering the liquid volume surrounding bubble caps and is found from
Equation 2 could well predict their experimental data of nitrogen-water slug flow in a round capillary with an inner diameter of 250 μm (with Camix varied from 2.3 × 10⁻³ to 8.8 × 10⁻³ and Remix from 41 to 159), whereas the model of Kreutzer et al. (2005) largely fails in the prediction. The good prediction accuracy in the model of Warnier et al. (2010) is explained by properly accounting for the influence of liquid film thickness at such low Reyonlds numbers [i.e., using the analysis of Aussillous and Quéré (2000)] and the influence of bubble velocity. So far, both pressure drop models have been used or further modified in order to satisfactorily predict the experimental data dealing with various gas–liquid systems in microreactors of different channel shapes (Fries et al., 2008; Walsh et al., 2009; Yue et al., 2009; Kurimoto et al., 2017). However, their applicability for microflow involving colloidal nanoparticle suspensions has not been examined.
In this study, circular polytetrafluoroethylene (PTFE) capillaries with three inner diameters (0.5, 0.8, 1.0 mm) were applied to investigate the effect of nanoparticle addition on slug flow pattern and pressure drop characteristics. Such capillary microreactors are convenient to use given its low cost and ready availability and easy scale up by combining more capillaries (Szymborski et al., 2018; Yang et al., 2020). TiO2 and Al2O3 nanoparticles were dispersed in the base fluid (water or its mixture with ethylene glycol) to prepare the colloidal suspension (called simply as nanofluid hereafter for ease of description). The influence of nanoparticle addition on the wettability change of microreactor wall and the resulting change in the N2-nanofluid slug flow pattern details (liquid film presence and bubble length) was studied. Pressure drop data were measured for N2-nanofluid slug flow in the microreactor at different flow rates and solid loadings, and compared with the prediction of the models of Kreutzer et al. (2005) and Warnier et al. (2010) in which the nanofluid was treated as a pseudo homogeneous single phase with mixture properties. The finding of this work, thus, provides useful insights in the precise manipulation of nanofluids in slug flow microreactors.
Materials and Methods
Chemicals
TiO2 nanoparticles in rutile phase (diameter: 21 nm) and Al2O3 nanoparticles in gamma phase (diameter: <50 nm) were supplied by Sigma Aldrich Corporation. Ultrapure water (Milli-Q, type 1) was used for the preparation of base fluids. Ethylene glycol (EG) with a purity of >95% was purchased from VWR, and nitrogen gas (>99.9%) was purchased from Linde.
Preparation of nanofluids
In this study, the two-step method was applied to prepare TiO2/H2O, TiO2/H2O + EG, and Al2O3/H2O nanofluids with a volume fraction (φ) of 0.05% and 0.15% (Yang and Hu, 2017; Wu et al., 2009), as shown in Table 1. The samples were prepared by dispersing nanoparticles in the base fluid under a 30-min stirring without adding surfactant, followed by using the ultrasonic vibrator (at a power of 600 W for 1 h) to break down the possible agglomeration of nanoparticles. Besides water as the base fluid, ethylene glycol was mixed with water under different fractions to change the properties of nanofluid (e.g., viscosity), which also has potential applications in heat transfer intensification (Reddy and Rao, 2013; Yiamsawas et al., 2013). The density of nanofluid is calculated based on the physical principle of mixture rule (Pak and Cho, 1998) as
where ρnf, ρnp, and ρbf denote the densities of nanofluid, nanoparticle, and base fluid, respectively. Viscosities of nanofluid were measured by a viscometer (Thermo Fisher Scientific, Waltham, MA, USA). The surface tension of nanofluid depends on, among others, the concentration and size of nanoparticles. For instance, the surface tension of Al2O3/H2O nanofluid was reported to decrease with increasing volume concentrations of nanoparticles in the work of Zhu et al. (2011), while others indicated that the surface tension of nanofluid (e.g., Al2O3/H2O, TiO2/H2O, and SiO2/H2O) increased with solid concentration (Bhuiyan et al., 2015). In the latter work, the larger nanoparticles were found to exhibit a higher surface tension. In this work, the surface tension of the prepared nanofluids and base fluids was measured by a tensiometer (Dataphysics OCA25 system) using the pendant drop method. The obtained physical properties of these fluids are listed in Table 1. To help illustrate the effect of nanoparticle addition on the two-phase flow pattern in the current microreactor, the contact angle of the tested fluids on a flat PTFE plate was measured using the Dataphysics OCA25 system via the sessile drop method. Moreover, analyses of scanning electron microscopy (SEM; Zeiss Gemini Ultra 55) and dynamic light scattering (DLS; Beckman Coulter Delsa Nano C system) were performed to investigate the morphology and size of TiO2 and Al2O3 nanoparticles in the nanofluid, and the stability of the used nanofluids. Before SEM analysis, samples were prepared by casting a drop of nanofluid on the sample holder and drying in a vacuum oven for 6 h to evaporate the base fluid. DLS measurements were performed on a Brookhaven ZetaPALS instrument to determine the particle size distribution. A minimum of 2 ml of the prepared nanofluid was transferred into a disposable plastic cuvette and then placed in the equipment for analysis. The collected data were analyzed using the multimodal size distribution algorithm of the equipment software.
Experimental Setup
Figure 2 illustrates the experimental system for the flow pattern and pressure drop study of N2-nanofluid slug flow in the PTFE capillary microreactor. N2 and nanofluid were connected to the microreactor by an inlet Y-junction mixer (bore diameter: 0.5 mm) made of polyether ether ketone (PEEK). The nanofluid was injected by a syringe pump (model LA30, HLL GmbH) to one inlet of the Y-junction. N2 was delivered from a cylinder to another inlet of the Y-junction through a mass flow controller (EL-Flow, Bronkhorst HI-TEC). A flow restrictor, consisting of a 10-cm-long section of PEEK capillary of very small inner diameter (42 μm), was placed in the gas line before N2 reached the Y-junction in order to induce sufficient pressure drop that prevented back flow and maintained a steady slug flow generated in the subsequent microchannel. Three inner diameters of PTFE capillary microreactors (dc = 0.5, 0.8 and 1.0 mm; each with a length of L = 40 cm) were tested, with the inlet gas flow rate (Qg; corresponding to 1 bar and 20°C) varied from 1.5 to 3.0 ml/min and the nanofluid flow rate (Qnf) from 0.5 to 5.0 ml/min.
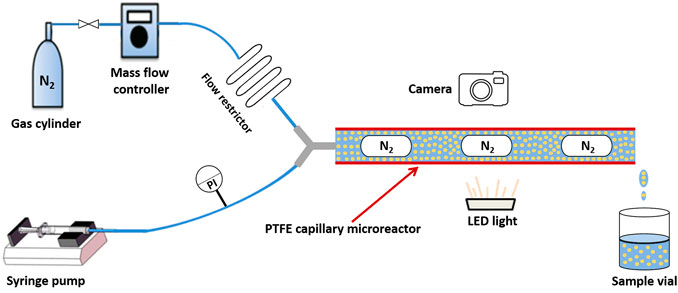
FIGURE 2. Experimental setup for flow pattern and pressure drop study of N2-nanofluid slug flow in polytetrafluoroethylene (PTFE) capillary microreactors.
N2-nanofluid flow pattern in the microchannel was captured by a Nikon D3300 digital camera equipped with a Nikon lens (AF-S Micro NIKKOR 60 mm F/2.8G ED) with the help of a cold light (MI-LED A2, Dolan-Jenner, Fiber-Lite). At the outlet of the microchannel, the nanofluid was collected in a vial and recycled for use in flow experiments, as long as it was stable according to DLS analysis (vide infra). A pressure indicator (PI; ESI-Tec, GS4200-USB) was placed in the liquid line (before the inlet of Y-junction) to measure the corresponding pressure. The pressure drop during gas-nanofluid slug flow in the microchannel itself was obtained based on a comparison with additional experiments conducted without the presence of PTFE capillary microreactor, that is, being equal to the measured pressure difference between experiments with microreactor and without under otherwise the same operating conditions. Experiments were performed under ambient conditions (ca. 22°C and 1 bar). A good reproductivity was confirmed in experiments conducted at least in duplicate under representative operating conditions, with a standard deviation generally (much) less than 10%.
N2-water slug flow in the PTFE microreactor was also studied using the setup shown in Figure 2 to provide a reference for comparison with the nanofluid case. In addition, pressure drop characteristics under single-phase flow of the prepared nanofluids were studied in the microreactor using the same experimental setup, except that the gas-side inlet of the Y-junction was blocked. The single-phase frictional pressure drop under fully developed laminar flow through the microchannel was then obtained from the pressure difference measured in the setup with a relatively long microreactor (L = 45 cm) and a short one (L = 5 cm), in order to exclude the influence of entrance effect.
Results and Discussion
Stability of Nanofluids
Figure 3 shows the SEM micrographs of TiO2 nanoparticles in the freshly prepared TiO2/H2O nanofluid. The mean particle size is about 24 or 28 nm for the solid loading of 0.05 vol% or 0.15 vol%, respectively. This shows that the particle size tended to increase at higher solid loadings likely due to its easier aggregation, which further implies that nanofluids with a lower solid concentration are more stable. This is consistent with the results of DLS analysis, where the measured mean particle sizes of TiO2 are about 20 and 27 nm for 0.05 vol% and 0.15 vol% TiO2/H2O nanofluids, respectively (Figures 4A,B). The DLS results also suggest that the mean particle size of TiO2 became larger in the H2O + EG base fluid, being, respectively, ca. 52.5 and 57.5 nm for 0.05 vol% TiO2/H2O + EG (3:2) and 0.05 vol% TiO2/H2O + EG (1:1) (Figures 4C, D), likely due to more significant particle agglomeration induced by EG addition. The TiO2-based nanofluid could keep a good stability within 3–7 days, as inferred from the almost unchanged particle size distribution (with a further consideration of the analysis error). This ensured the recycled use of nanofluids in the flow experiments for several days. However, for the Al2O3/H2O nanofluid, the mean particle size in the dispersion is much bigger (ca. 300–400 nm) and tended to increase more dramatically over days, indicating its somewhat low stability.
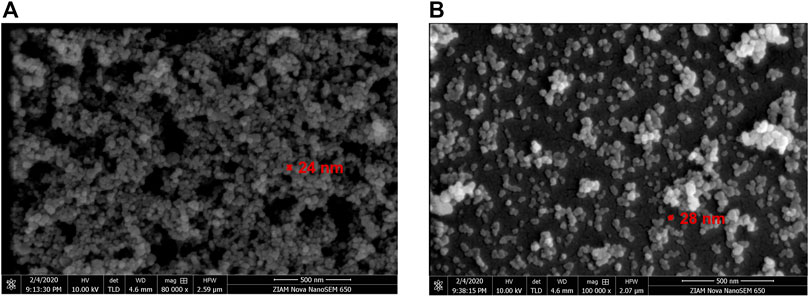
FIGURE 3. Scanning electron microscopy (SEM) images of TiO2 nanoparticles in the freshly prepared TiO2/H2O nanofluid. (A) φ = 0.05 vol%; (B) φ = 0.15 vol%.
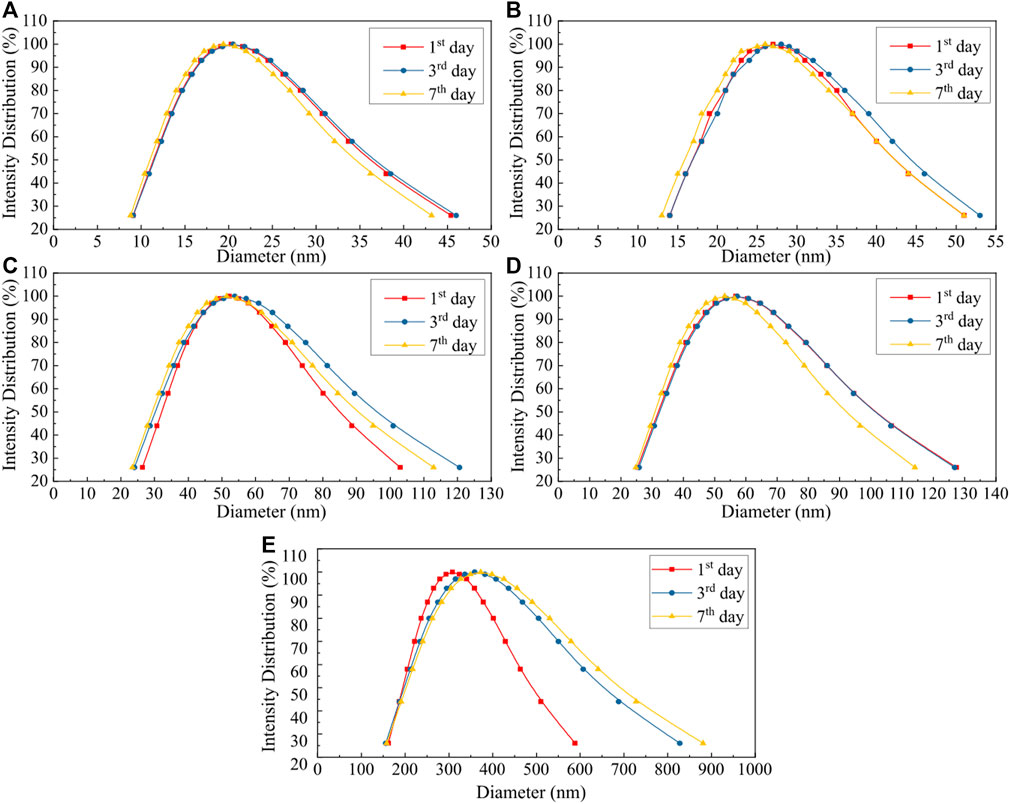
FIGURE 4. Particle size distribution in the nanofluid in different days after its preparation via dynamic light scattering (DLS) analysis. (A) TiO2/H2O, φ = 0.05 vol%; (B) TiO2/H2O, φ = 0.15 vol%; (C) TiO2/H2O + EG (3:2), φ = 0.05 vol%; (D) TiO2/H2O + EG (1:1), φ = 0.05 vol%; (E) Al2O3/H2O, φ = 0.05 vol%.
Flow Pattern
Figure 5A shows a typical flow pattern of N2-water slug flow in the current microreactor, suggesting no thin liquid film presence between the N2 bubble and PTFE microchannel wall, as can be inferred from the concave shape of the front and rear ends of the bubble (Choi et al., 2011; Yue et al., 2013). This is consistent with the measurement of static contact angle (θ) of water on PTFE (Figure 5B), showing that θ = 108.0° and, thus, the hydrophobic nature of PTFE with water. This type of flow is also called plug flow in the literature, which can introduce a significant energy dissipation due to the alternative movement of gas and liquid phases along a dry solid surface creating three-phase contact lines (Lee and Lee, 2008).
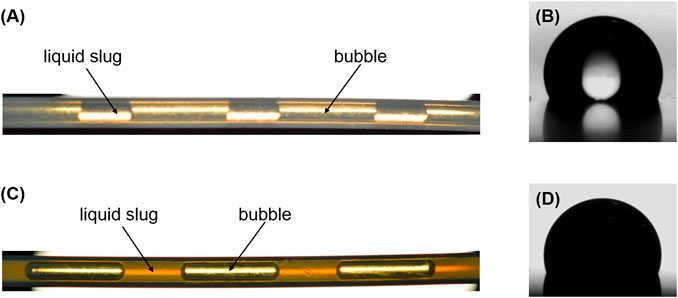
FIGURE 5. (A) Picture of N2-water slug flow in the PTFE microchannel (dc = 0.8 mm). (B) Static contact angle of water on PTFE (θ = 108.0°). (C) Picture of N2–TiO2/H2O nanofluid (φ = 0.05 vol%) slug flow in the PTFE microchannel (dc = 0.8 mm). (D) Static contact angle of 0.05 vol% TiO2/H2O nanofluid on PTFE (θ = 72.5°). In (A) and (C), the flow direction is from left to right, Qg = 2.77 ml/min, the water flow rate (Qw) and nanofluid flow rate (Qnf) are both at 1.5 ml/min.
In the case of N2-nanofluid flow, the slug flow was found to be characterized by a presence of the lubricating liquid film around bubbles, as supported by the convex shape of bubble end caps (e.g., see Figure 5C). This implies that the addition of nanoparticles in the base fluid has changed the wettability of PTFE microchannel wall to be more hydrophilic, which was confirmed by the contact angle measurement (e.g., θ = 72.5° for 0.05 vol% TiO2/H2O nanofluid on PTFE; cf. Figure 5D as well as Supplementary Table S1). Lim et al. (2015) also reported that the contact angle of SiO2/H2O nanofluid on a gold plate (originally hydrophobic) was less than 90°. Thus, nanoparticles have been attached to the microreactor inner surface during continuous flowing that improved its hydrophilicity (Chaudhuri and Paria, 2014). To confirm this, the wettability change in PTFE wall material was first examined over long hours. In more detail, a flat PTFE plate was pretreated by immersing in the 0.05 vol% TiO2/H2O nanofluid for 6 and 24 h, respectively. Then the contact angle of water on the pretreated PTFE plate was measured and found to be 76° (for the 6-h pretreatment) and 72° (for the 24-h pretreatment). The results here are consistent with the literature, which reported a contact angle of water on a TiO2 film being 76° without UV illumination (Horprathum et al., 2010). This means that the nanofluid film was actually formed on the surface of PTFE microchannel wall, causing the stable presence of liquid film around bubbles (which took typically around 30 min in the case of experiments with an unused PTFE capillary). In addition, as TiO2 was widely used as a photocatalyst, the effect of lab light on the contact angle of TiO2/H2O nanofluid on PTFE was examined. No significant change in the contact angle was found in 2 days, illustrating that the normal light in the lab did not affect the surface properties of TiO2 film attached on the microchannel wall.
It is worth to note that the alteration in the wettability of PTFE microreactor by nanoparticles was not permanent once without nanofluids flowing inside. For example, after stopping the TiO2/H2O nanofluid flow in the microreactor, a continuous operation of N2-water slug flow through this used microreactor rendered a flow pattern with the liquid film presence at first (Figure 6A), but the liquid film gradually disappeared due to water flushing away the deposited TiO2 on the wall (Figure 6B).
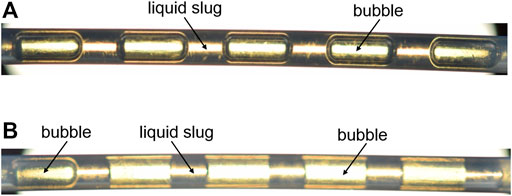
FIGURE 6. Pictures of N2-water slug flow at first (A) and after ca. 30 min (B) in the PTFE microchannel (dc = 1.0 mm) previously used in the N2–TiO2/H2O flow experiments. Qg = 2.77 ml/min, Qw = 1.5 ml/min, the flow direction is from left to right.
Similar changes in the slug flow inner details were observed for all nanofluids in this study. Figure 7 shows the pictures captured for N2-nanofluid slug flow at different flow rates at the entrance region of the 0.8-mm diameter microreactor (i.e., after the Y junction). The continuous presence of a lubricating liquid film around the bubble body was observed in all nanofluid cases, corresponding to the measured lower contact angle after nanoparticle addition (i.e., θ < 90°; Supplementary Table S1). In contrast, higher contact angles (i.e., θ > 90°) were observed for all base fluids on the new PTFE plate, indicating a poor wettability. Besides, the contact angle of all tested nanofluids on the pretreated PTFE plate (by immersing in the nanofluid for 24 h) was found to decrease (slightly) with increasing nanofluid concentration (Supplementary Table S1), possibly due to, among others, the increase in surface roughness or adhesion tension between solid and liquid (Chaudhuri and Paria, 2014). Another common observation in Figures 7A–F is that at a constant gas flow rate, the bubble length decreased with increasing flow rate of nanofluids. This is more clearly shown in Figures 8A–C that the measured bubble length in microreactors of different diameters can be predicted according to the equation below:
where the subscript 0 refers to the entrance of the microchannel. Thus, the inlet gas superficial velocity (Ug,0) was calculated based on the microreactor inlet pressure. Unf denotes the superficial velocity of nanofluid. Equation 5 is well according to the mechanism of bubble/droplet formation in another continuous liquid phase under the squeezing regime in microfluidic T-junctions proposed by Garstecki et al. (2006). They formulated the same equation except that dc in Eq. 5 is replaced with the width of the side channel fed with the dispersed phase and reasoned that the two constants, α1 and α2, are on the order of 1 and depend on the junction geometry. The good fitting of the majority of the experimental data using Eq. 5 as shown in Figure 8 implies that the bubble formation process within gas–nanofluid flow in the current Y-junction of circular geometry (Figure 2) can be described primarily by the squeezing mechanism, though it cannot be visualized due to the opaque PEEK material of the junction. The predominance of squeezing regime in the bubble breakup is in line with the relatively low capillary numbers involved in this work (Camix,0 ranging from 0.001 to 0.027). This is also supported by the fact that the measured bubble length for the cases of all nanofluids tested in the 0.8- or 1.0-mm diameter microreactor more or less collapses onto the same prediction line according to Eq. 5 (Figures 8B,C), though the influence of viscosity seems to exist to some extent. That is, the bubble length seems to (slightly) decrease in the case with more viscous nanofluids like TiO2/H2O + EG (1:1) (see Table 1), suggesting the likely somewhat important role of shear stress in determining the bubble length as well under the current conditions of non-negligible Reynolds numbers (Remix,0 ranging from 21 to 307) (Dang et al., 2013; Lu et al., 2014). Furthermore, it was noticed that the fitted values of α1 and α2 generally increased with decreasing microreactor diameters (Figure 8), which could be mainly related to the fixed Y-junction in use (with an inner diameter of 0.5 mm). In other words, for the same gas–nanofluid flow ratio, the emerging bubble volume at the junction might not vary to a much different extent, resulting in relatively longer bubbles in smaller diameter microreactors. However, largely different values of α1 and α2 were obtained in the 0.5-mm diameter microreactor for various nanofluid cases (Figure 8), possibly due to the local geometry imperfections around the Y-junction (e.g., caused by the frequent dismantling and re-mounting of capillaries connected with the junction in the experiments) that have affected the bubble formation to a certain extent. The slug length at the entrance (Ls,0) was found to decrease with increasing gas–nanofluid flow ratio (see Supplementary Figure S1 in the Supplementary Material as well as Figure 7), which could be explained according to the mass balance in the unit cell within a slug flow (Warnier et al., 2010).
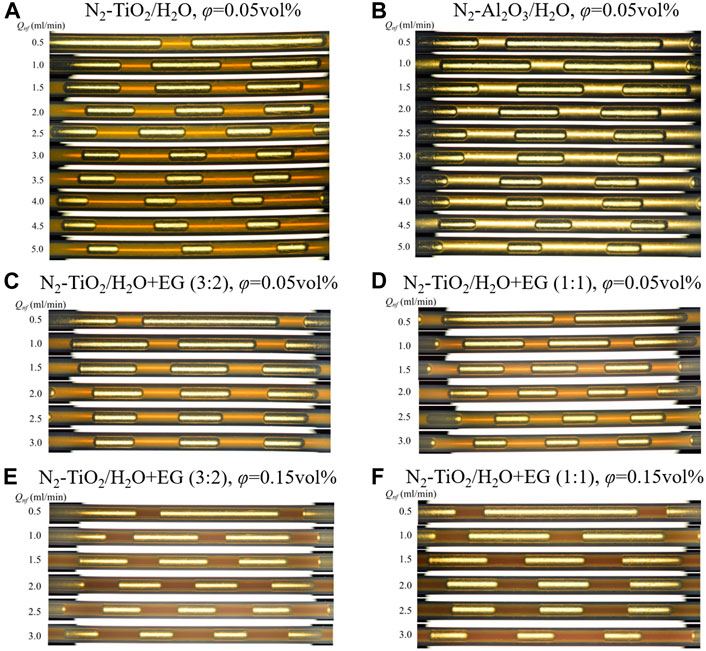
FIGURE 7. Flow pattern of N2-nanofluid slug flow in the PTFE microchannel (dc = 0.8 mm). The flow direction is from left to right, Qg = 2.77 ml/min. (A) N2–TiO2/H2O, φ = 0.05 vol%, θ = 72.5°; (B) N2–Al2O3/H2O, φ = 0.05 vol%, θ = 65.5°; (C) N2–TiO2/H2O + EG (3:2), φ = 0.05 vol%, θ = 84.5°; (D) N2–TiO2/H2O + EG (1:1), φ = 0.05 vol%, θ = 87.5°; (E) N2–TiO2/H2O + EG (3:2), φ = 0.15 vol%, θ = 77.3°; (F) N2–TiO2/H2O + EG (1:1), φ = 0.15 vol%, θ = 77.4°.
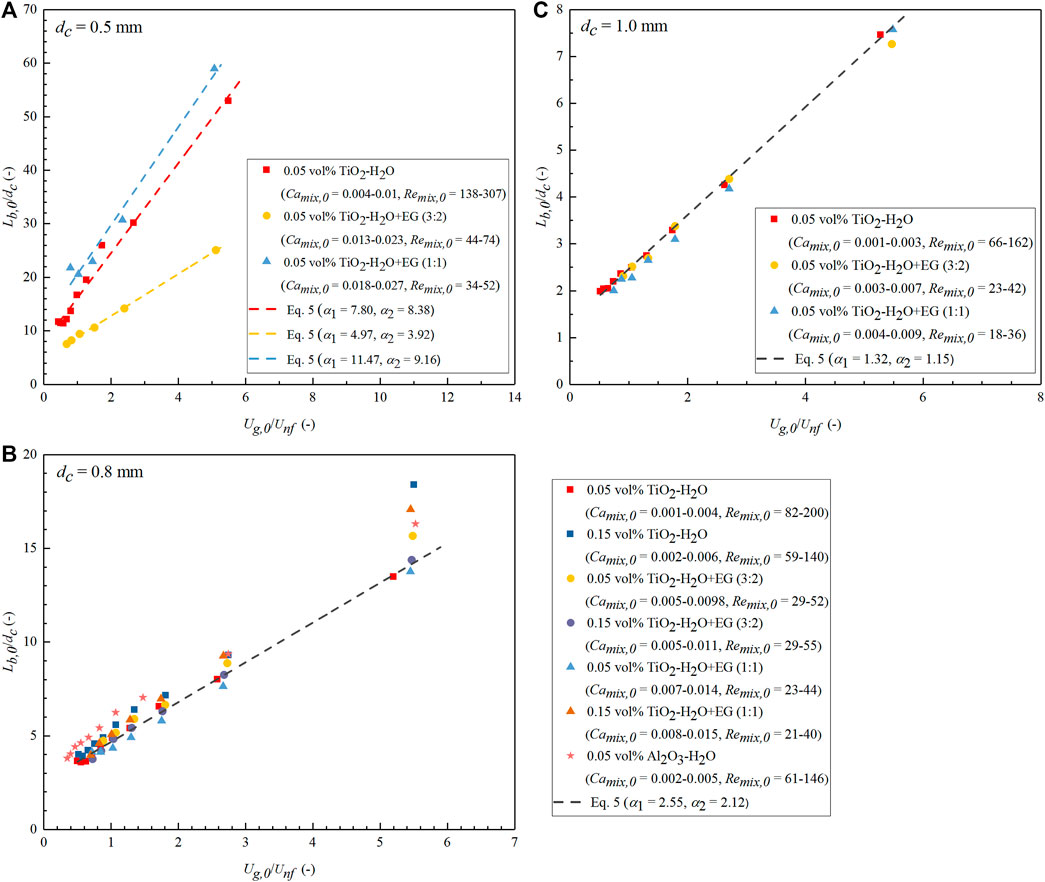
FIGURE 8. Bubble length as a function of the inlet gas–nanofluid flow ratio in the current PTFE microchannels of different diameters. (A) dc = 0.5 mm; (B) dc = 0.8 mm; (C) dc = 1.0 mm. Symbols represent the experimental data and lines are according to the prediction of Eq. 5. Camix,0 and Remix,0 represent the capillary number and Reynolds number calculated based on the mixture velocity at the microreactor entrance (i.e., Umix,0 = Ug,0 + Unf).
Pressure Drop
Pressure Drop of Single-Phase Nanofluid Flow
To check the feasibility of the current experimental setup and further examine whether the nanofluid flow in the microchannel still conforms to the classic laminar flow theory, the pressure drop data of the prepared nanofluids under single-phase flow through the current microreactors have been collected (cf. Experimental Setup) and compared with the theoretical model predictions. According to the classical Hagen–Poiseuille equation for fully developed laminar flow of a Newtonian fluid through a circular channel (Molla et al., 2011), there is
where Q is the volumetric flow rate, and μ is the viscosity of the fluid. Equation 6 can be further rearranged as
where f is the Darcy friction factor, and Re is the Reynolds number of the fluid (= dcUρ/μ). With Eq. 7, the values of fRe and Re were calculated for the nanofluid flow case, based on its flow rate, the collected pressure gradient (
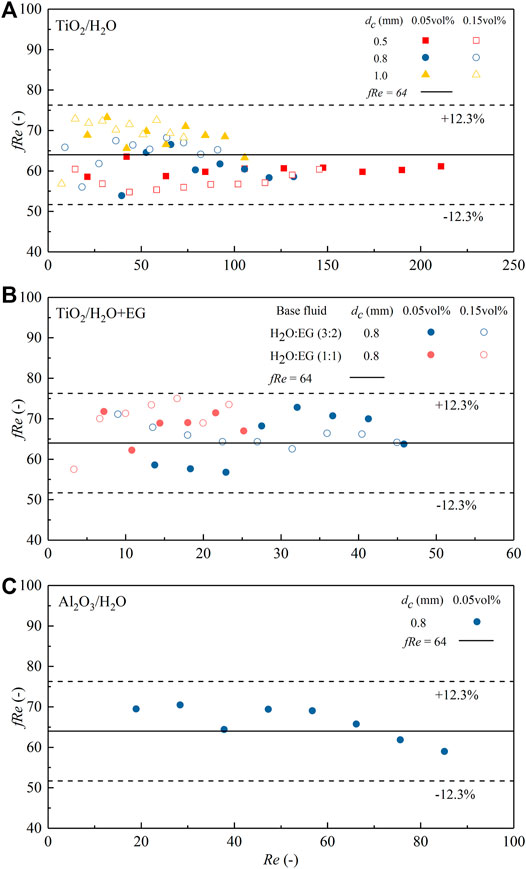
FIGURE 9. Comparison between the measured fRe under TiO2 or Al2O3-based nanofluid single-phase flow in the microchannel and the theoretical value. (A) TiO2/H2O; (B) TiO2/H2O + EG; (C) Al2O3/H2O. Symbols represent the experimental data and solid lines the theoretical value.
Pressure drop of N2-nanofluid slug flow
To verify the effect of nanoparticle addition on pressure drop of gas–nanofluid slug flow, experiments were performed in three different diameter microreactors under various nanofluid flow rates (Qnf = 0.5–5.0 ml/min) and N2 flow rates (Qg = 1.5–3.0 ml/min). Figure 10 depicts the influence of flow rate on the measured pressure drop of N2-nanofluid slug flow in the 0.8-mm diameter microreactor and a comparison with the case of N2-water slug flow. The pressure drop exhibits a clear increase with increasing nanofluid flow rate, especially for the nanofluid with a higher viscosity (e.g., when EG was present in the base fluid; see Table 1) or solid loading (Figures 10A, B). The measured pressure drop with N2-water flow, though also increasing at the higher water flow rate (Qw), is by far much larger than that with N2-nanofluid flow. This is ascribed to the absence of liquid film in the form case (e.g., see Figure 5A), resulting in the moving gas–liquid–solid contact lines that created significantly higher pressure drop than that by the viscous/inertial force (Lee and Lee, 2008). While in the nanofluid case, the addition of nanoparticles changed the PTFE microreactor wall to be more hydrophilic (e.g., see Figure 5D), and thus, the gas could slide over a continuous liquid film that covered the wall (e.g., see Figure 5C), largely reducing pressure drop.
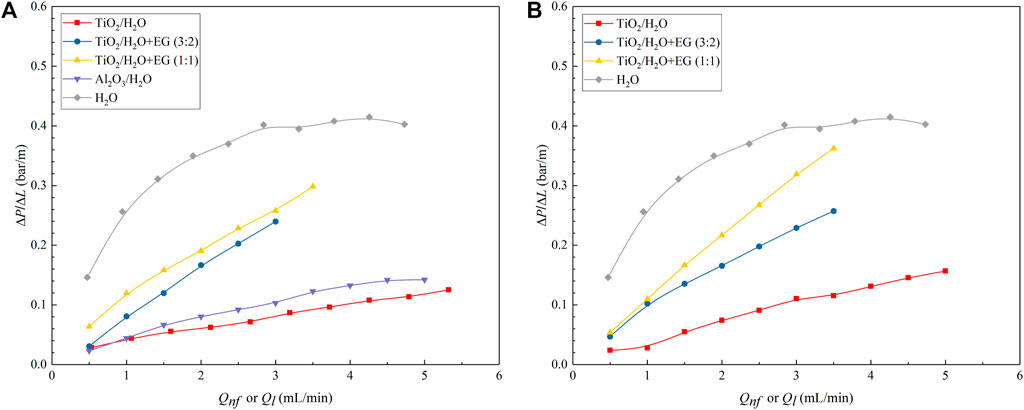
FIGURE 10. Comparison between the measured pressure drop data under slug flows of N2-nanofluid and N2-water in the 0.8-mm diameter microchannel. Qg = 2.77 ml/min. (A) φ = 0.05 vol%; (B) φ = 0.15 vol%.
Figure 11 plots the measured pressure drop of N2-nanofluid slug flow versus the length of unit cell (i.e., one slug plus one bubble) at a fixed gas flow rate in the 0.8-mm diameter microreactor. It is evident in all nanofluid cases that besides the effect of nanofluid viscosity as discussed above, the measured pressure drop tends to increase with the decreased unit cell length. This corresponds well with literature findings on gas–liquid slug flow in microreactors (Kreutzer et al., 2005; Molla et al., 2011), where shorter slugs and bubbles result in a higher amount of unit cells per channel length and, thus, could enhance pressure drop dramatically by the more dominant interfacial pressure contribution over bubbles in addition to the contribution from the inner recirculation in the slug.
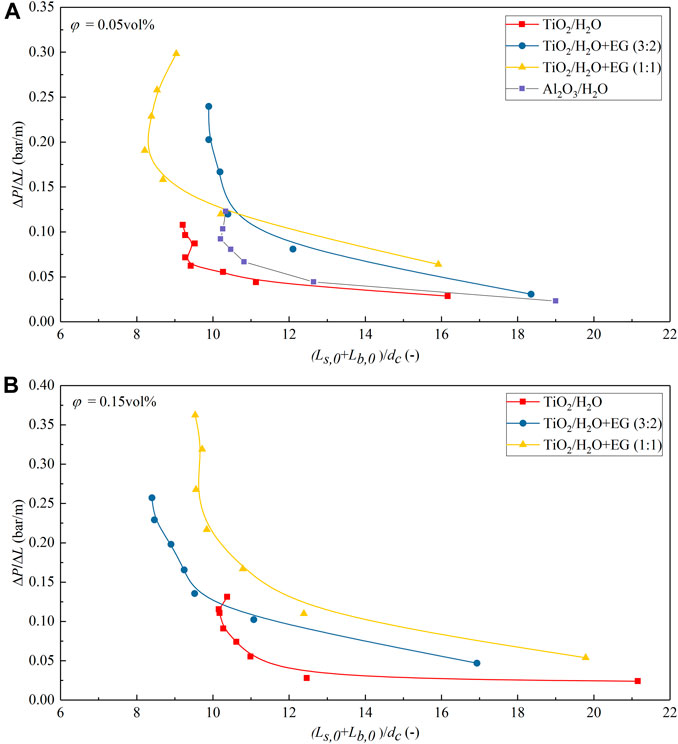
FIGURE 11. Measured pressure drop of N2-nanofluid slug flow versus the normalized unit cell length [i.e., (Lb,0 + Ls,0)/dc] at a constant gas flow rate (Qg = 2.77 ml/min) in the 0.8-mm diameter microchannel. (A) φ = 0.05 vol%; (B) φ = 0.15 vol%.
The measured pressure drop of gas–nanofluid flow in microchannels was further compared with the prediction of the established models of Kreutzer et al. (2005) and Warnier et al. (2010), that is, Eq. 1 with a = 0.07 and Eq. 2, respectively. The nanofluid was treated as a pseudo homogenous liquid so that its mixture density, viscosity, and surface tension as shown in Table 1 can be directly used in the calculation with both equations. To account for the pressure change along the microchannel, certain parameter values (including the bubble length and velocity, the mixture velocity, the capillary number, and Reynolds number) in both equations are evaluated based on the average pressure in the microchannel (i.e., at the middle section). More deduction details are provided in Supplementary Sections S4 and S5 of the Supplementary Material.
A comparison of the measured ΔP/ΔL values under N2-nanofluid slug flow with the model predictions of Kreutzer et al. (2005) and Warnier et al. (2010) is shown in Figure 12. It clearly shows that both models can describe (most of) the experimental results, with an overall much better and satisfactory prediction accuracy by the model of Warnier et al. (2010). Therefore, nanofluids used in this work can be reasonably considered as a stable and pseudo single phase.
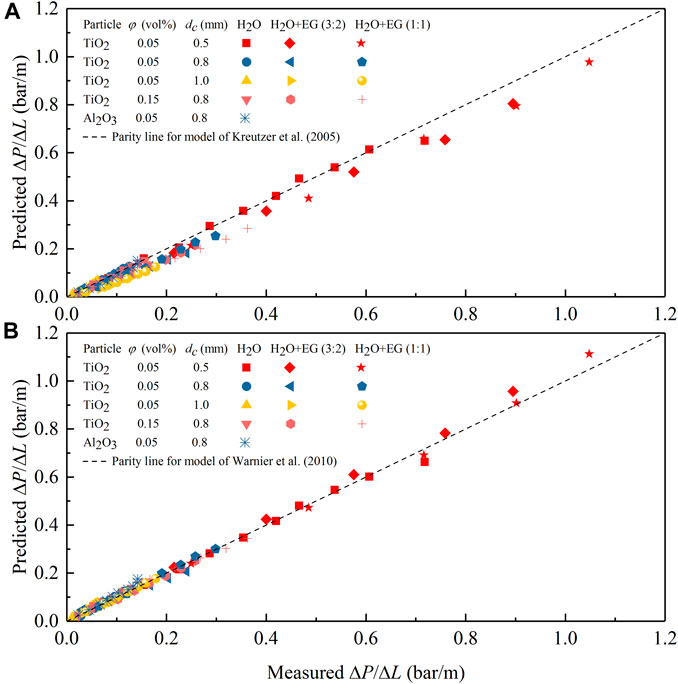
FIGURE 12. Comparison between the measured pressure drop data for N2-nanofluid slug flow in the microchannel and predictions according to the model of Kreutzer et al. (2005) (A) and Warnier et al. (2010) (B).
To further reveal the flow behavior and the detailed performance of both models, the measured ΔP/ΔL value was compared with the model prediction under different slug flow operation conditions for the used nanofluids in Figures 13–15. The increasing trend of pressure drop with the gas–nanofluid mixture Reynolds number (Remix) in all nanofluids and the three PTFE microchannels tested is generally well matched with the two models. However, a closer examination suggests that the model of Kreutzer et al. (2005) has a good accuracy in predicting the pressure drop under N2-TiO2/H2O and N2-Al2O3/H2O slug flow in the current microchannels, where the Reynolds number is comparatively large (e.g., Remix being typically above 100; Figure 13). However, it somewhat underestimates the slug flow pressure drop in the cases of TiO2/H2O + EG (3:2) and TiO2/H2O + EG (1:1) nanofluids (Figures 14, 15), where Remix is below 100 caused by the significant increase in nanofluid viscosity with EG addition (Table 1). In comparison, the model of Warnier et al. (2010) increased the prediction accuracy on the pressure drop to a satisfactory level when Remix is at such a small level for all nanofluids mentioned above (Figures 13B–D, 14, 15).
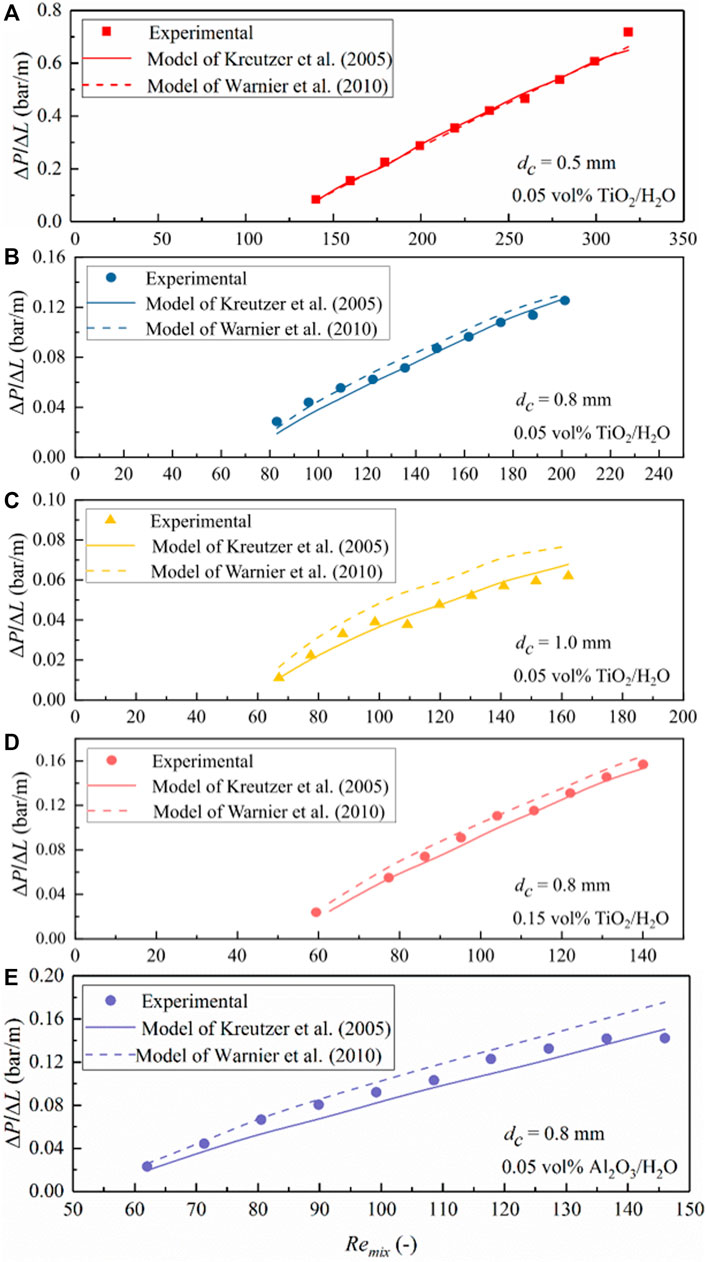
FIGURE 13. Comparison of the measured pressure drop data for N2–TiO2/H2O and N2–Al2O3/H2O nanofluid slug flows in the microchannel with predictions according to the models of Kreutzer et al. (2005) and Warnier et al. (2010). (A) TiO2/H2O, dc = 0.5 mm, φ = 0.05 vol%; (B) TiO2/H2O, dc = 0.8 mm, φ = 0.05 vol%; (C) TiO2/H2O, dc = 1.0 mm, φ = 0.05 vol%; (D) TiO2/H2O, dc = 0.8 mm, φ = 0.15 vol%. (E) Al2O3/H2O, dc = 0.8 mm, φ = 0.05 vol%. Values of Remix shown are evaluated based on the mixture velocity corresponding to the average pressure in the microchannel (the same for Figures 14, 15).
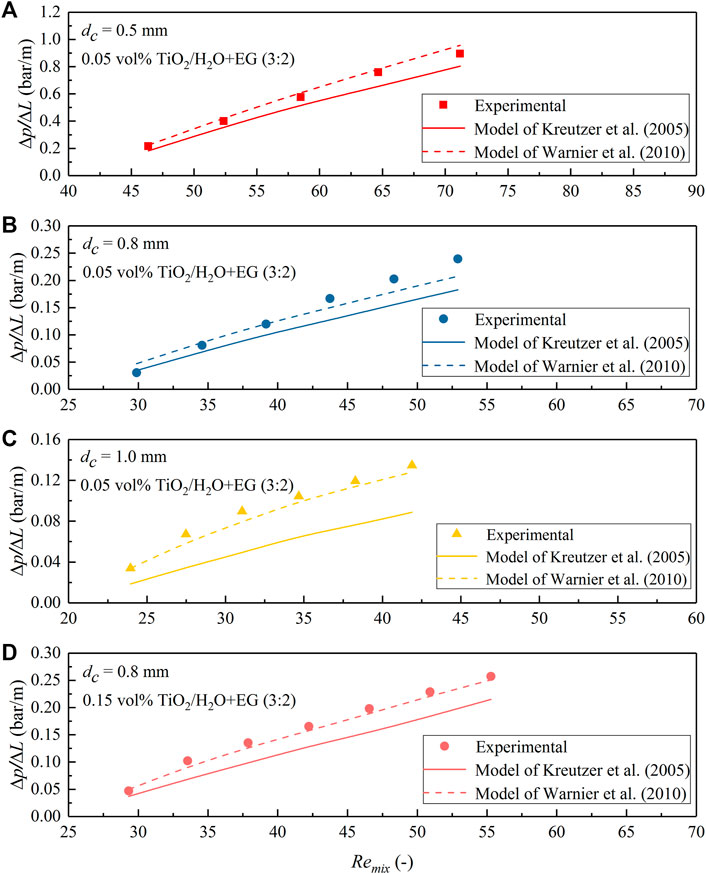
FIGURE 14. Comparison of the measured pressure drop data for N2-TiO2/H2O + EG (3:2) nanofluid slug flow in the microchannel with predictions according to the models of Kreutzer et al. (2005) and Warnier et al. (2010). (A) dc = 0.5 mm, φ = 0.05 vol%; (B) dc = 0.8 mm, φ = 0.05 vol%; (C) dc = 1.0 mm, φ = 0.05 vol%; (D) dc = 0.8 mm, φ = 0.15 vol%.
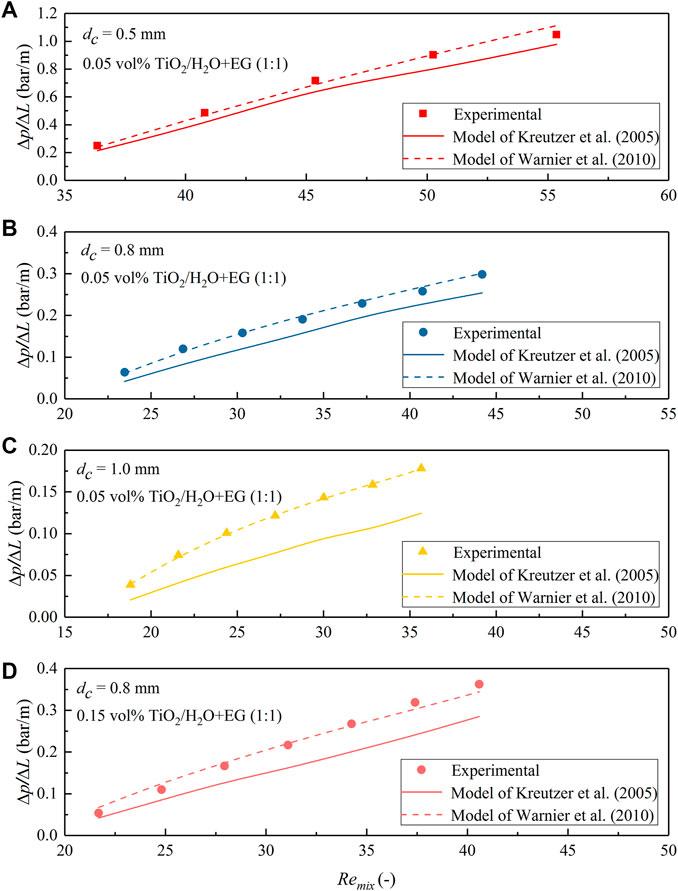
FIGURE 15. Comparison of the measured pressure drop data for N2–TiO2/H2O + EG (1:1) nanofluid slug flow in the microchannel with predictions according to the model of Kreutzer et al. (2005) and Warnier et al. (2010). (A) dc = 0.5 mm, φ = 0.05 vol%; (B) dc = 0.8 mm, φ = 0.05 vol%; (C) dc = 1.0 mm, φ = 0.05 vol%; (D) dc = 0.8 mm, φ = 0.15 vol%.
The difference in the prediction performance of both models is, first, because in the model of Kreutzer et al. (2005), the frictional pressure drop in the liquid slug and pressure drop over gas bubbles were introduced based on their CFD simulation results at relatively large two-phase mixture Reynolds numbers (Remix typically above 100). Thus, pressure drop over bubbles at relatively low Reynolds numbers could not be precisely captured by this model, due to the changing role of inertial force in determining the liquid film thickness and bubble curvatures. In the pressure drop model of Warnier et al. (2010) as shown in Eq. 2, the effect of small Reynolds numbers was taken into account by using the liquid film thickness correction proposed by Aussillous and Quéré (2000). Moreover, the effect of bubble velocity was included, and the slug length was corrected by further considering the liquid volume around bubble end caps (Eq. 3). A better accuracy in the pressure drop predictions than those of Kreutzer et al. (2005) was also confirmed with their experimental data collected for nitrogen–water slug flow in a hydrophilic microreactor (with Camix varied from 2.3 × 10⁻³ to 8.8 × 10⁻³ and Remix from 41 to 159). This conclusion is consistent with the current experimental results dealing with gas-nanofluid flow, further supporting that nanofluids tested in this study could be reasonably considered as a stable and pseudo homogeneous phase. This entails the use of both models in describing the obtained pressure drop data under gas–nanofluid slug flow, i.e., the model of Kreutzer et al. (2005) for Reynolds numbers (Remix) typically above 100 and that of Warnier et al. (2010) at smaller Remix values, by further considering the relative low capillary number of this work (Camix ranging from 0.001 to 0.028 in the middle of the microchannel) being well within the ranges involved in both literature studies.
Outlook
The addition of nanoparticles within the current slug flow processing has changed the PTFE microreactor wall wettability to cause the presence of liquid film covering the wall. This could have some consequences regarding the potential applications of such colloidal nanoparticle suspensions. The deposition of nanoparticles on the wall could introduce additional heat transfer resistance, which might need to be considered when using nanofluids for improving the thermal performance of the energy system. On the other hand, the presence of a lubricating film around the bubble body further increases the interfacial area available for mass transfer and reaction, which is beneficial for improving the reaction efficiency when using suspended nanoparticles as the catalyst in gas–liquid reactions.
The employed nanofluids could be regarded as a pseudo homogeneous single phase, which could be also due to the relatively low solid loadings used (up to 0.15 vol%). However, a somewhat significant viscosity increase with nanoparticle addition is already clear compared with that of base fluids (cf. Table 1). Thus, the experimental results observed in this work (e.g., regarding the bubble length and pressure drop) are certainly related (in part) to the effect of nanoparticle presence. Whether similar flow results can be achieved at (much) higher solid loadings still awaits further research. Moreover, the desired solid loading depends on the specific applications like heat/mass transfer and chemical reaction (Pieber et al., 2018; Pu and Su, 2018; Zhang et al., 2020; Huang et al., 2021). In the case of using a much higher solid loading, the stability issue of nanoparticles needs to be well addressed, e.g., via the addition of surfactants as the stabilizer (Pu and Su, 2018), which could also impose a change on the hydrodynamic and mass transfer characteristics in microreactors (yet to be studied in depth).
Conclusion
The flow pattern and pressure drop characteristics of N2-nanofluid slug flow along circular PTFE microreactors of three different diameters (0.5, 0.8, and 1.0 mm) have been investigated. TiO2 and Al2O3 were used as nanoparticles to be dispersed in the base fluid (water or its mixture with EG in different fractions). The experiments were performed at a gas flow rate of 1.5–3.0 ml/min and nanofluid flow rates of 0.5–5.0 ml/min, corresponding to the capillary number (Camix) between 0.001 and 0.028 and Reynolds number (Remix) between 18 and 320. The following conclusions can be drawn:
(1) The slug flow in the presence of nanofluids is characterized by the appearance of a lubricating film around N2 bubbles, in contrast to the film absence in the case of N2-water slug flow. This shows that the addition of nanoparticles has changed the PTFE microreactor wall to be more hydrophilic due to nanoparticle deposition, as also supported by the offline static contact angle measurement of nanofluids on PTFE plates.
(2) The lengths of bubbles generated within gas–nanofluid flow could be generally described by the scaling relation proposed by Garstecki et al. (2006) under the squeezing regime, though the influence of nanofluid viscosity and inlet Y-junction geometry seems to exist.
(3) The measured pressure drop under single-phase nanofluid laminar flow through the current microchannels is generally well represented by the Hagen–Poiseuille equation within the experimental uncertainty. Thus, its flow behavior is still governed by the classical laminar flow theory.
(4) The measured pressure drop data of N2-nanofluid slug flow are generally well described by the model of Kreutzer et al. (2005) at Reynolds number (Remix) >100 as seen in the cases of N2–TiO2/H2O and N2–Al2O3/H2O slug flows, but the model tends to underestimate at lower Reynolds numbers. In contrast, the pressure drop model of Warnier et al. (2010) gave a better and satisfactory prediction accuracy at Remix <100 as seen in the slug flow case with more viscous nanofluid with H2O + EG as the base fluid. This is ascribed to a better consideration of the effect of film thickness and bubble velocity at such low Reynolds numbers in the latter model.
(5) Based on the above, the employed nanofluids can be reasonably considered as a stable, pseudo homogeneous phase with proper fluid properties (e.g., viscosity and density), especially when it comes to the pressure drop estimation.
The finding of this work, thus, provides useful insights in the precise manipulation of nanofluids in microreactors operated under slug flow, which would help realize the promising application of such colloidal nanoparticle suspensions in, among others, heat/mass transfer and solid-catalyzed gas–liquid reactions toward achieving significant process intensification.
Data Availability Statement
The original contributions presented in the study are included in the article/Supplementary Material. Further inquiries can be directed to the corresponding author.
Author Contributions
JZ conducted the experiments, data analysis, and wrote the draft version of the manuscript. JY supervised the project, prepared the manuscript, and revised the manuscript.
Funding
This work is financially supported by the University of Groningen (start-up package in the area of green chemistry and technology for JY).
Conflict of Interest
The authors declare that the research was conducted in the absence of any commercial or financial relationships that could be construed as a potential conflict of interest.
Publisher’s Note
All claims expressed in this article are solely those of the authors and do not necessarily represent those of their affiliated organizations, or those of the publisher, the editors, and the reviewers. Any product that may be evaluated in this article, or claim that may be made by its manufacturer, is not guaranteed or endorsed by the publisher.
Acknowledgments
JZ would like to thank Uche Adago for the assistance in several initial experimental work.
Supplementary Material
The Supplementary Material for this article can be found online at: https://www.frontiersin.org/articles/10.3389/fceng.2021.788241/full#supplementary-material
References
Ali, A. R. I., and Salam, B. (2020). A Review on Nanofluid: Preparation, Stability, Thermophysical Properties, Heat Transfer Characteristics and Application. SN Appl. Sci. 2 (10), 1–17. doi:10.1007/s42452-020-03427-1
Angeli, P., and Gavriilidis, A. (2008). Hydrodynamics of Taylor Flow in Small Channels: A Review. Proc. Inst. Mech. Eng. C: J. Mech. Eng. Sci. 222, 737–751. doi:10.1243/09544062JMES776
Aussillous, P., and Quéré, D. (2000). Quick Deposition of a Fluid on the Wall of a Tube. Phys. Fluids 12 (10), 2367–2371. doi:10.1063/1.1289396
Bhuiyan, M. H. U., Saidur, R., Mostafizur, R. M., Mahbubul, I. M., and Amalina, M. A. (2015). Experimental Investigation on Surface Tension of Metal Oxide-Water Nanofluids. Int. Commun. Heat Mass Transfer 65, 82–88. doi:10.1016/j.icheatmasstransfer.2015.01.002
Chaudhuri, R. G., and Paria, S. (2014). The Wettability of PTFE and Glass Surfaces by Nanofluids. J. Colloid Interf. Sci. 434, 141–151. doi:10.1016/j.jcis.2014.07.044
Cheng, S.-Y., Liu, Y.-Z., and Qi, G.-S. (2019). Progress in the Enhancement of Gas-Liquid Mass Transfer by Porous Nanoparticle Nanofluids. J. Mater. Sci. 54, 13029–13044. doi:10.1007/s10853-019-03809-w
Choi, C., Shin, J. S., Yu, D. I., and Kim, M. H. (2011). Flow Boiling Behaviors in Hydrophilic and Hydrophobic Microchannels. Exp. Therm. Fluid Sci. 35, 816–824. doi:10.1016/j.expthermflusci.2010.07.003
Cygański, P., Sobieszuk, P., and Pohorecki, R. (2012). Pressure Drop in Two-Phase Gas-Liquid (Taylor) Flow in Microreactors. Chem. Proc. Eng. 33, 369–384. doi:10.2478/v10176-012-0033-y
Dang, M., Yue, J., Chen, G., and Yuan, Q. (2013). Formation Characteristics of Taylor Bubbles in a Microchannel with a Converging Shape Mixing Junction. Chem. Eng. J. 223, 99–109. doi:10.1016/j.cej.2013.02.108
Fries, D. M., Trachsel, F., and von Rohr, P. R. (2008). Segmented Gas-Liquid Flow Characterization in Rectangular Microchannels. Int. J. Multiphase Flow 34, 1108–1118. doi:10.1016/j.ijmultiphaseflow.2008.07.002
Garstecki, P., Fuerstman, M. J., Stone, H. A., and Whitesides, G. M. (2006). Formation of Droplets and Bubbles in a Microfluidic T-junction-scaling and Mechanism of Break-Up. Lab. Chip 6, 437–446. doi:10.1039/B510841A
Hommes, A., Disselhorst, B., and Yue, J. (2020). Aerobic Oxidation of Benzyl Alcohol in a Slug Flow Microreactor: Influence of Liquid Film Wetting on Mass Transfer. Aiche J. 66 (11), 1–14. doi:10.1002/aic.17005
Horprathum, M., Chindaudom, P., Limnonthakul, P., Eiamchai, P., Nuntawong, N., Patthanasettakul, V., et al. (2010). Fabrication and Characterization of Hydrophilic TiO2Thin Films on Unheated Substrates Prepared by Pulsed DC Reactive Magnetron Sputtering. J. Nanomater. 2010, 1–7. doi:10.1155/2010/841659
Huang, M., Zhu, C., Fu, T., and Ma, Y. (2021). Enhancement of Gas-Liquid Mass Transfer by Nanofluids in a Microchannel under Taylor Flow Regime. Int. J. Heat Mass Transfer 176, 121435. doi:10.1016/j.ijheatmasstransfer.2021.121435
Jensen, K. F. (2017). Flow Chemistry-Microreaction Technology Comes of Age. Aiche J. 63, 858–869. doi:10.1002/aic.15642
Jovanović, J., Rebrov, E. V., Nijhuis, T. A., Kreutzer, M. T., Hessel, V., and Schouten, J. C. (2011). Liquid-Liquid Flow in a Capillary Microreactor: Hydrodynamic Flow Patterns and Extraction Performance. Ind. Eng. Chem. Res. 51, 1015–1026. doi:10.1021/ie200715m
Kawahara, A., Chung, P. M.-Y., and Kawaji, M. (2002). Investigation of Two-Phase Flow Pattern, Void Fraction and Pressure Drop in a Microchannel. Int. J. Multiphase Flow 28, 1411–1435. doi:10.1016/S0301-9322(02)00037-X
Kreutzer, M. T., Kapteijn, F., Moulijn, J. A., Kleijn, C. R., and Heiszwolf, J. J. (2005). Inertial and Interfacial Effects on Pressure Drop of Taylor Flow in Capillaries. Aiche J. 51, 2428–2440. doi:10.1002/aic.10495
Kurimoto, R., Nakazawa, K., Minagawa, H., and Yasuda, T. (2017). Prediction Models of Void Fraction and Pressure Drop for Gas-Liquid Slug Flow in Microchannels. Exp. Therm. Fluid Sci. 88, 124–133. doi:10.1016/j.expthermflusci.2017.05.014
Leclerc, A., Alamé, M., Schweich, D., Pouteau, P., Delattre, C., and de Bellefon, C. (2008). Gas-liquid Selective Oxidations with Oxygen under Explosive Conditions in a Micro-Structured Reactor. Lab. Chip 8, 814–817. doi:10.1039/B717985E
Lee, C. Y., and Lee, S. Y. (2008). Pressure Drop of Two-Phase Plug Flow in Round Mini-Channels: Influence of Surface Wettability. Exp. Therm. Fluid Sci. 32, 1716–1722. doi:10.1016/j.expthermflusci.2008.06.007
Li, M., Zhang, Y., Zhang, J., Peng, M., Yan, L., Tang, Z., et al. (2021). Continuous Gas-Liquid-Solid Slug Flow for Sustainable Heterogeneously Catalyzed PET-RAFT Polymerization. Ind. Eng. Chem. Res. 60, 5451–5462. doi:10.1021/acs.iecr.1c00361
Liedtke, A.-K., Bornette, F., Philippe, R., and de Bellefon, C. (2013). Gas-Liquid-solid "slurry Taylor" Flow: Experimental Evaluation through the Catalytic Hydrogenation of 3-Methyl-1-Pentyn-3-Ol. Chem. Eng. J. 227, 174–181. doi:10.1016/j.cej.2012.07.100
Lim, S., Horiuchi, H., Nikolov, A. D., and Wasan, D. (2015). Nanofluids Alter the Surface Wettability of Solids. Langmuir 31, 5827–5835. doi:10.1021/acs.langmuir.5b00799
Lu, Y., Fu, T., Zhu, C., Ma, Y., and Li, H. Z. (2014). Scaling of the Bubble Formation in a Flow-Focusing Device: Role of the Liquid Viscosity. Chem. Eng. Sci. 105, 213–219. doi:10.1016/j.ces.2013.11.017
Magosso, M., van den Berg, M., and van der Schaaf, J. (2021). Kinetic Study and Modeling of the Schotten-Baumann Synthesis of Peroxyesters Using Phase-Transfer Catalysts in a Capillary Microreactor. React. Chem. Eng. 6, 1574–1590. doi:10.1039/D1RE00141H
Mallia, C. J., and Baxendale, I. R. (2016). The Use of Gases in Flow Synthesis. Org. Process. Res. Dev. 20, 327–360. doi:10.1021/acs.oprd.5b00222
Manay, E., and Sahin, B. (2016). Heat Transfer and Pressure Drop of Nanofluids in a Microchannel Heat Sink. Heat Transfer Eng. 38, 510–522. doi:10.1080/10407782.2016.1195162
Molla, S., Eskin, D., and Mostowfi, F. (2011). Pressure Drop of Slug Flow in Microchannels with Increasing Void Fraction: Experiment and Modeling. Lab. Chip 11, 1968–1978. doi:10.1039/C0LC00478B
Pak, B. C., and Cho, Y. I. (1998). Hydrodynamic and Heat Transfer Study of Dispersed Fluids with Submicron Metallic Oxide Particles. Exp. Heat Transfer 11, 151–170. doi:10.1080/08916159808946559
Pieber, B., Shalom, M., Antonietti, M., Seeberger, P. H., and Gilmore, K. (2018). Continuous Heterogeneous Photocatalysis in Serial Micro-batch Reactors. Angew. Chem. Int. Ed. 57, 9976–9979. doi:10.1002/anie.201712568
Pu, X., and Su, Y. (2018). Heterogeneous Catalysis in Microreactors with Nanofluids for fine Chemicals Syntheses: Benzylation of Toluene with Benzyl Chloride over Silica-Immobilized FeCl3 Catalyst. Chem. Eng. Sci. 184, 200–208. doi:10.1016/j.ces.2018.03.049
Pu, X., Zhang, B., and Su, Y. (2019). Heterogeneous Photocatalysis in Microreactors for Efficient Reduction of Nitrobenzene to Aniline: Mechanisms and Energy Efficiency. Chem. Eng. Technol. 42, 2146–2153. doi:10.1002/ceat.201800735
Reddy, M. C. S., and Rao, V. V. (2013). Experimental Studies on Thermal Conductivity of Blends of Ethylene Glycol-Water-Based TiO2 Nanofluids. Int. Commun. Heat Mass Transfer 46, 31–36. doi:10.1016/j.icheatmasstransfer.2013.05.009
Salique, F., Musina, A., Winter, M., Yann, N., and Roth, P. M. C. (2021). Continuous Hydrogenation: Triphasic System Optimization at Kilo Lab Scale Using a Slurry Solution. Front. Chem. Eng. 3, 701910. doi:10.3389/fceng.2021.701910
Sivakumar, A., Alagumurthi, N., and Senthilvelan, T. (2016). Investigation of Heat Transfer in Serpentine Shaped Microchannel Using Al2O3/Water Nanofluid. Heat Trans. Asian Res. 45, 424–433. doi:10.1002/htj.21169
Susanti, , Winkelman, J. G. M., Schuur, B., Heeres, H. J., and Yue, J. (2016). Lactic Acid Extraction and Mass Transfer Characteristics in Slug Flow Capillary Microreactors. Ind. Eng. Chem. Res. 55, 4691–4702. doi:10.1021/acs.iecr.5b04917
Szymborski, T., Jankowski, P., and Garstecki, P. (2018). Teflon Microreactors for Organic Syntheses. Sens. Actuators B: Chem. 255, 2274–2281. doi:10.1016/j.snb.2017.09.035
Verma, S. K., and Tiwari, A. K. (2017). Characterization of Nanofluids as an Advanced Heat Transporting Medium for Energy Systems. Mater. Today Proc. 4, 4095–4103. doi:10.1016/j.matpr.2017.02.313
Walsh, E., Muzychka, Y., Walsh, P., Egan, V., and Punch, J. (2009). Pressure Drop in Two Phase Slug/Bubble Flows in Mini Scale Capillaries. Int. J. Multiphase Flow 35, 879–884. doi:10.1016/j.ijmultiphaseflow.2009.06.007
Warnier, M. J. F., de Croon, M. H. J. M., Rebrov, E. V., and Schouten, J. C. (2010). Pressure Drop of Gas-Liquid Taylor Flow in Round Micro-capillaries for Low to Intermediate Reynolds Numbers. Microfluid Nanofluid 8, 33–45. doi:10.1007/s10404-009-0448-z
Wu, X., Wu, H., and Cheng, P. (2009). Pressure Drop and Heat Transfer of Al2O3-H2O Nanofluids through Silicon Microchannels. J. Micromech. Microeng. 19, 105020. doi:10.1088/0960-1317/19/10/105020
Yang, L., and Hu, Y. (2017). Toward TiO2 Nanofluids-Part 1: Preparation and Properties. Nanoscale Res. Lett. 12, 417. doi:10.1186/s11671-017-2184-8
Yang, H., Akinoglu, E. M., Guo, L., Jin, M., Zhou, G., Giersig, M., et al. (2020). A PTFE Helical Capillary Microreactor for the High Throughput Synthesis of Monodisperse Silica Particles. Chem. Eng. J. 401, 126063. doi:10.1016/j.cej.2020.126063
Yao, C., Zhu, K., Liu, Y., Liu, H., Jiao, F., and Chen, G. (2017). Intensified CO2 Absorption in a Microchannel Reactor under Elevated Pressures. Chem. Eng. J. 319, 179–190. doi:10.1016/j.cej.2017.03.003
Yap, S. K., Yuan, Y., Zheng, L., Wong, W. K., Zhang, J., Yan, N., et al. (2014). Rapid Nanoparticle-Catalyzed Hydrogenations in Triphasic Millireactors with Facile Catalyst Recovery. Green. Chem. 16, 4654–4658. doi:10.1039/C4GC01504E
Yap, S. K., Wong, W. K., Ng, N. X. Y., and Khan, S. A. (2017). Three-phase Microfluidic Reactor Networks - Design, Modeling and Application to Scaled-Out Nanoparticle-Catalyzed Hydrogenations with Online Catalyst Recovery and Recycle. Chem. Eng. Sci. 169, 117–127. doi:10.1016/j.ces.2016.12.005
Yiamsawas, T., Mahian, O., Dalkilic, A. S., Kaewnai, S., and Wongwises, S. (2013). Experimental Studies on the Viscosity of TiO2 and Al2O3 Nanoparticles Suspended in a Mixture of Ethylene Glycol and Water for High Temperature Applications. Appl. Energ. 111, 40–45. doi:10.1016/j.apenergy.2013.04.068
Yin, Y., Zhu, C., Guo, R., Fu, T., and Ma, Y. (2018). Gas-liquid Two-Phase Flow in a Square Microchannel with Chemical Mass Transfer: Flow Pattern, Void Fraction and Frictional Pressure Drop. Int. J. Heat Mass Transfer 127, 484–496. doi:10.1016/j.ijheatmasstransfer.2018.07.113
Yue, J., Chen, G., Yuan, Q., Luo, L., and Gonthier, Y. (2007). Hydrodynamics and Mass Transfer Characteristics in Gas-Liquid Flow through a Rectangular Microchannel. Chem. Eng. Sci. 62, 2096–2108. doi:10.1016/j.ces.2006.12.057
Yue, J., Luo, L., Gonthier, Y., Chen, G., and Yuan, Q. (2008). An Experimental Investigation of Gas-Liquid Two-phase Flow in Single Microchannel Contactors. Chem. Eng. Sci. 63, 4189–4202. doi:10.1016/j.ces.2008.05.032
Yue, J., Luo, L., Gonthier, Y., Chen, G., and Yuan, Q. (2009). An Experimental Study of Air-Water Taylor Flow and Mass Transfer inside Square Microchannels. Chem. Eng. Sci. 64, 3697–3708. doi:10.1016/j.ces.2009.05.026
Yue, J., Falke, F. H., Schouten, J. C., and Nijhuis, T. A. (2013). Microreactors with Integrated UV/Vis Spectroscopic Detection for Online Process Analysis under Segmented Flow. Lab. Chip 13, 4855–4863. doi:10.1039/C3LC50876E
Yue, J. (2018). Multiphase Flow Processing in Microreactors Combined with Heterogeneous Catalysis for Efficient and Sustainable Chemical Synthesis. Catal. Today 308, 3–19. doi:10.1016/j.cattod.2017.09.041
Zhang, H., Shao, S., Xu, H., and Tian, C. (2013). Heat Transfer and Flow Features of Al2O3-Water Nanofluids Flowing through a Circular Microchannel - Experimental Results and Correlations. Appl. Therm. Eng. 61, 86–92. doi:10.1016/j.applthermaleng.2013.07.026
Zhang, J., Li, S., Wang, X., Sundén, B., and Wu, Z. (2020). Numerical Studies of Gas-Liquid Taylor Flows in Vertical Capillaries Using CuO/water Nanofluids. Int. Commun. Heat Mass Transfer 116, 104665. doi:10.1016/j.icheatmasstransfer.2020.104665
Keywords: microreactor, slug flow, nanoparticle, flow pattern, pressure drop, wettability
Citation: Zong J and Yue J (2022) Gas–Liquid Slug Flow Studies in Microreactors: Effect of Nanoparticle Addition on Flow Pattern and Pressure Drop. Front. Chem. Eng. 3:788241. doi: 10.3389/fceng.2021.788241
Received: 01 October 2021; Accepted: 22 November 2021;
Published: 17 January 2022.
Edited by:
Gianvito Vilé, Politecnico di Milano, ItalyReviewed by:
Renzo Luisi, University of Bari Aldo Moro, ItalyGiuseppe L. Martina, Politecnico di Torino, Italy
Copyright © 2022 Zong and Yue. This is an open-access article distributed under the terms of the Creative Commons Attribution License (CC BY). The use, distribution or reproduction in other forums is permitted, provided the original author(s) and the copyright owner(s) are credited and that the original publication in this journal is cited, in accordance with accepted academic practice. No use, distribution or reproduction is permitted which does not comply with these terms.
*Correspondence: Jun Yue, yue.jun@rug.nl
 Jie Zong
 Jun Yue