 Allan Niidu
 Henrik Grénman
 Kati Muldma3
 Margus Lopp
- 1School of Engineering, Virumaa College, TalTech, Kohtla-Järve, Estonia
- 2Johan Gadolin Process Chemistry Centre, Laboratory of Industrial Chemistry and Reaction Engineering, Åbo Akademi University, Turku, Finland
- 3Department of Chemistry and Biotechnology, School of Science, TalTech, Tallinn, Estonia
- 4Department of Material and Environmental Technology, School of Engineering, TalTech, Tallinn, Estonia
Oxidation has been a long sought-after alternative to classical thermal processing of oil shale, in order to obtain valuable raw materials for the chemical industry. A number of different methods have been applied, but thus far, one of the most effective ways to transform oil shale to value added products, such as aliphatic terminal dicarboxylic acids, is oxidation with nitric acid. In order to obtain insight into the reactivity of oil shale in nitric acid, a study focusing on the kinetics and behavior of oil shale particles during oxidative leaching was performed. To that end, the particle size distribution, surface area, and carbon content were measured during the leaching process in addition to the amount of total residual solids. Determining the carbon content of the solid residue was proposed as a simple measure of the reaction progress, based on the hypothesis that all carbon measured by elemental analysis correspond to organic carbon since inorganic carbon is present as carbonate in the starting material and would have dissolved under the acidic conditions. To our surprise, the solid residue had a significant amount of organic carbon in the form of calcium oxalate mineral. Thus, measuring carbon content in the solid residue could provide only an indirect measure of the overall oxidation degree provided that the amount of oxalates was known. In general, the results revealed that the total solid residue amounts to between 20% and 34% of the initial values after 24 h of the reaction, while the total carbon content ranges from 4% to 14% of the starting values. These results show that we were able to extract around 90% of the organic carbon present in the solid phase.
Introduction
Nitric acid is a well-established industrial chemical, which is produced in large quantities (62 Mt/a) mainly for fertilizer production and manufacturing of organic chemicals (Groves, 2020). Nitric acid is known to produce dicarboxylic acids with chain lengths of 4–10 carbons from monocarboxylic acids present in oil shale. The production of myristic acid (14 carbons) (Nordlinger,1887) and cerotic acid (26 carbons) (Marie, 1890) was reported as early as in the 19th century. Already by the middle of the 20th century, several patents describing production of dicarboxylic acids via nitric acid oxidation were awarded (Hamblet and McAlevy,1951; Lindsay, 1954; Nebe and Boehm, 1955). Around the same time, coal (Benning,1955) and oil shale (Fomina and Degtereva,1956; Degtereva and Fomina, 1959a; Degtereva and Fomina, 1959b) were subjected to nitric acid oxidation in different parts of the world, with various success rates. Eventually, in the case of kukersitic oil shale, a patent was awarded to a chemical oxidation process (Degtereva et al., 1960), which on closer examination did not constitute a feasible industrial process. As an alternative to the nitric acid process, wet air oxidation of kukersitic kerogen was extensively studied at St. Petersburg, formerly known as Leningrad in the USSR (Broi-Karre and Proskuryakov,1965) and to an extent from Colorado oil shale at Dow Chemical Co. (Brower and Graham, 1958). Estonian (Fomina and Pobul,1955) and Ukrainian (Pobul et al., 1974) oil shale were also extensively subjected to K2MnO4 oxidation with somewhat less encouraging results than nitric acid oxidation. Efforts in nitric acid oxidation prior to the 1990s were very nicely summarized and described by Veski and Veski, (2019). As part of the efforts to develop the oil shale industry toward new paths in Estonia and globally, we studied the behavior of selected well-defined kukersitic oil shale particles under acidic oxidative conditions with one of the aims being the development of a simple analytical method for monitoring the reaction progress. The particle size distribution was also monitored during the extraction to lay the ground for future solid–liquid separation studies and to enable the selection of proper methods and equipment for the separation.
Materials and Methods
All chemicals were used as purchased without any further treatment or purification. Sieved oil shale fraction (63–125 μm) was obtained from Oil Shale Competence Centre (Estonia), and the elemental composition (CHNS, C (40.3%), H (4.62%), N (0.11%), and S (2.114%)) and organic content (47.2%) were analyzed at their facilities.
Elemental analysis was performed either by the Department of Energy Technologies or Oil Shale Competence Centre using the Vario EL Cube Elementar equipment. Particle size distribution was determined with a Horiba LA-950 Laser Scattering Particle Size Distribution Analyzer using distilled water as the dispersion medium. Specific surface area measurements were performed with Costech Instruments Sorptometer KELVIN 1042 using N2 as adsorptive gas and He as carrier gas. All the samples were pretreated in He flow at 110°C for at least 2 h prior the analysis. SEM micrographs were obtained with Zeiss FEG-SEM Ultra-55 including surface elemental composition of selected materials using EDS. Powder X-ray diffraction (PXRD) was measured on Bruker D-8 advance diffractometer using Co Kα radiation at 35 kV and 40 mA, 2theta range 5–75°, step size 0.02°, and 0.5 s in step and Lynxeye 190 channel detector. ATR–FTIR was measured on a Thermo Scientific Nicolet Summit spectrometer in the absorbance mode from 400 to 4,000 cm−1. FTIR data were acquired using OMNIC software and processed using QtiPlot (1.0.0-rc11). Results of the elemental analysis and surface area measurements are presented in Table 1.
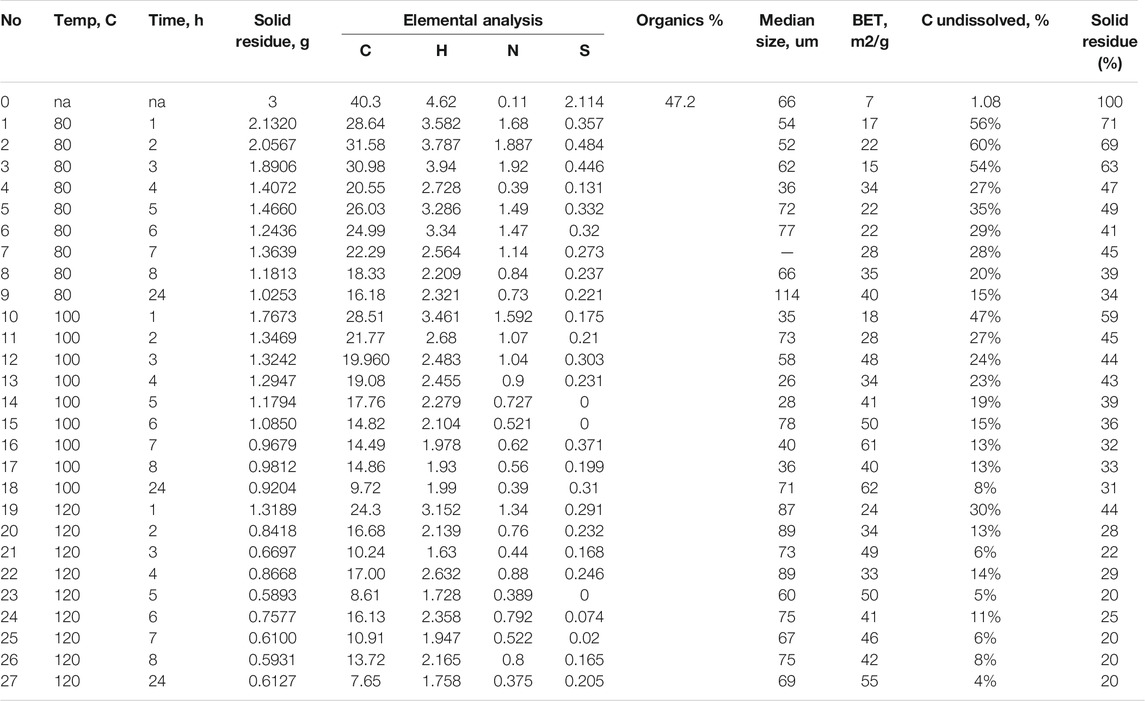
TABLE 1. Aggregate data on elemental analysis, specific surface area, and solid reaction residue.
In a typical experiment, oil shale (3.0 g) was weighed and placed into a 250-ml three-necked glass flask equipped with a magnetic stirrer and fitted with a water cooler and temperature probe. The oil shale was wetted with distilled water (3.0 ml), and then HNO3 (aq. 65%, 21.4 ml, d = 1.4 g/ml) was added dropwise at a rate of 1 ml/min. Evolved gases were trapped in an NaOH absorber (aq. 50% 400 ml). After addition of HNO3, the reaction temperature was adjusted to the desired value of 80, 100, or 120°C and kept there for a predetermined time between 1 and 24 h, giving overall nine data points per temperature. After cooling the reaction mixture to room temperature (usually 22–24°C), aq. 50% NaOH (typically 15 ml) was added, and the solids were separated by centrifugation. The resultant solid residue was washed with distilled water until the supernatant pH equaled 7 and then dried in an oven at 105°C for at least 24 h prior to analysis.
Results and Discussion
Dissolved Carbon vs. Solid Residue
Estonian oil shale is known to be a carbonate-rich mineral (Bondar and Koel,1998), and thus, when reacted with acid, inorganic carbon will decompose to produce CO2, leaving only organic carbon in the solid residue. Therefore, as an indicator of the extent of dissolution, the mass of the solid residue after reaction and the carbon content in it were determined. In general, both the weight of the solid residue (Figure 1) and carbon content (Figure 2) correlate well with the extent of reaction, and in both cases, it became clear that for the most part, the reaction time required to obtain high conversions was over 3 h. The hypothesis regarding organic content accounting for the entire carbon held true only in the case when the reaction temperature was set to 120°C (Table 2; Figures 3–5), as at lower temperatures, traces of calcite were observed, according to the XRD analysis (Table 2). The solid residue was weighed after separation by centrifugation, and drying was performed at 105°C for at least 24 h. Time intervals for reactions were set to 1, 2, 3, 4, 5, 6, 7, 8, and 24 h for studying the extraction kinetics. For each time interval, a separate experiment was conducted. The obtained dry solids were subjected to elemental analysis to understand how organics in the solid behave under the reaction conditions, as a function of reaction time. To check the mineral composition of reaction residue, the XRD analysis was performed (Table 2), as discussed in Mineral Composition of Oil Shale and Its Oxidation Residues.
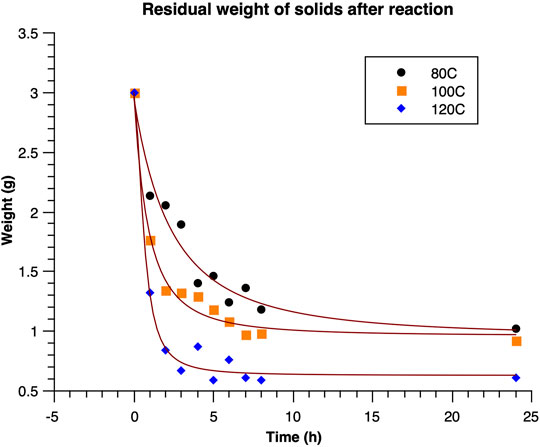
FIGURE 1. Residual weight of solids after oxidation (fitted curves are provided for visualization purposes only).

FIGURE 2. Residual carbon in solids (fitted curves are provided for visualization purposes only).

TABLE 2. Mineral composition of solid residue according to PXRD analysis.
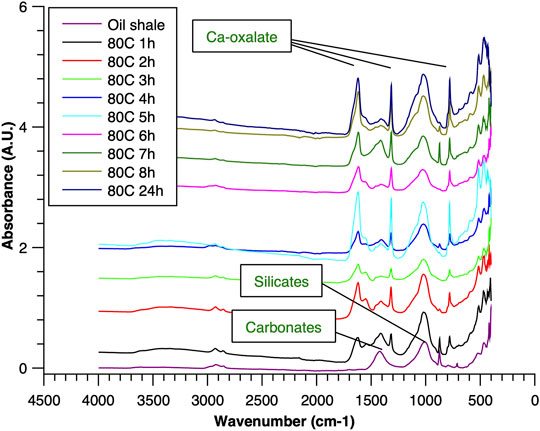
FIGURE 3. ATR–FTIR of oil shale and reaction residues at 80°C.
FIGURE 4. ATR–FTIR of oil shale and reaction residues at 100°C.
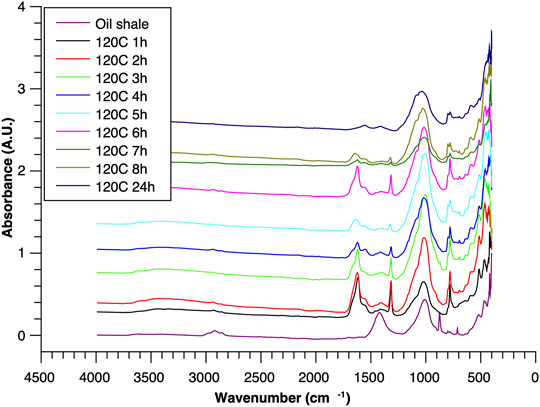
FIGURE 5. ATR–FTIR of oil shale and reaction residues at 120°C.
Analysis of the starting material indicated a rather high organic content of 47.7%, with an overall carbon content of 40.3% (Table 1), 15.5% of carbonate, and 37.3% of ash. From these results, it was observed that the amount of inorganic carbon in the oil shale was around 4.2%. Data for solid residue and residual carbon content (Table 1) show that stabilization of the residual weight occurred after 8 h at 80°C, 6 h at 100°C, and 3 h at 120°C (Figure 1). Similarly, the carbon content remained roughly constant after 8 h at 80°C, 6 h at 100°C, and 3 h at 120°C (Figure 2), showing a good correlation between weight of residual solids and residual carbon content. All in all, at 80°C, the maximum amount of carbon extracted from oil shale was 85%; at 100°C, it was 92%; and at 120°C, it was 96%. The kinetics of the extraction were concluded to increase significantly with temperature.
Mineral Composition and Morphology
Mineral Composition of Oil Shale and Its Oxidation Residues
To acquire insight into the change in mineral composition of the solid residue during oxidation, semiquantitive PXRD1 and FTIR analyses were carried out. Oil shale was subjected to the same analysis. The results are shown in Table 2, and they display that the starting material was composed of quartz (SiO2, 9.9%), feldspar (KAlSi3O8, 10.5%), illite [K1.5Al4(Si6.5,Al1.5)O20(OH)4, not quantified], muscovite [KAl2(AlSi3O10)(F,OH)2, 1.3%], calcite (CaCO3, 67.9%), dolomite [CaMg(CO3), 6.8%], and pyrite (FeS, 3.5%). Calcite was dissolved during the reaction depending on temperature and time, as was pyrite. On the other hand, nitratine, whewellite, and weddellite were formed during the process. Nitratine (NaNO3) is a compound obtained during the neutralization of the reaction mixture with NaOH. Both whewellite and weddellite are calcium salts of oxalic acid differing only by the amount of crystal water attached (Conti et al., 2010). While sodium nitrate in solids could be expected, the calcium oxalate under such circumstances has not been described prior to this work to the best of our knowledge. The latter minerals are the products of kerogen oxidation where dicarboxylic acids of various chain lengths are obtained (Fomina, Veski, and Mannik 1977). Comparison of XRD patterns obtained at different temperatures with the starting material (Figure 6) reveals relatively fast removal of calcite (CaCO3). After 1 h at 80°C, the signal attributed to calcite was reduced substantially; for example, the ratio to quartz dropped from 6.9 to 2.5 at 80°C (Figure 7; Table 3), and after 24 h, at 80°C, only traces (ratio of calcite to quartz 0.13–1) of calcite were observed (Figure 8). The same appears to have been the case with experiments performed at 100 and 120°C, where the kinetics of the process were faster and only traces of calcite were observed after just 1 h (Figures 9, 10). Observations were similar after 24 h also (Figures 11, 12).
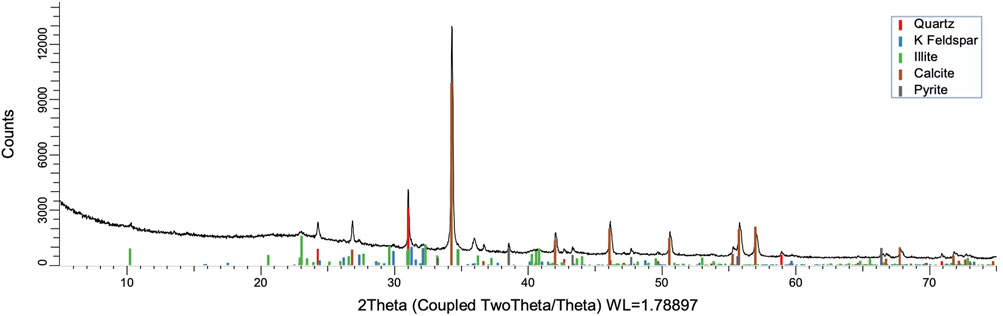
FIGURE 6. XRD pattern of Estonian oil shale.
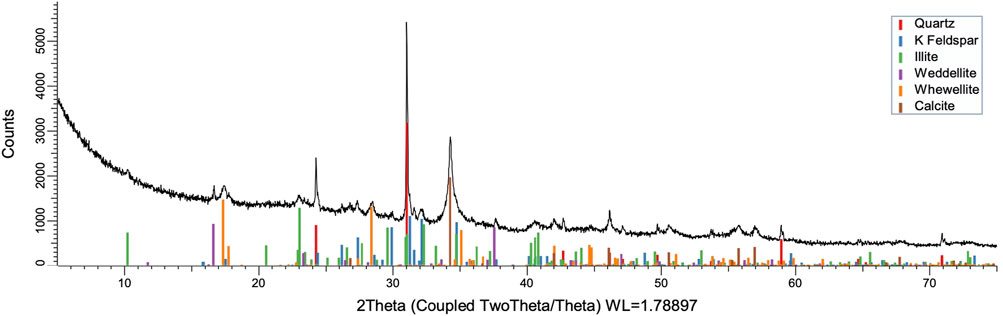
FIGURE 7. XRD pattern of oxidation residue at 80°C and 1 h.
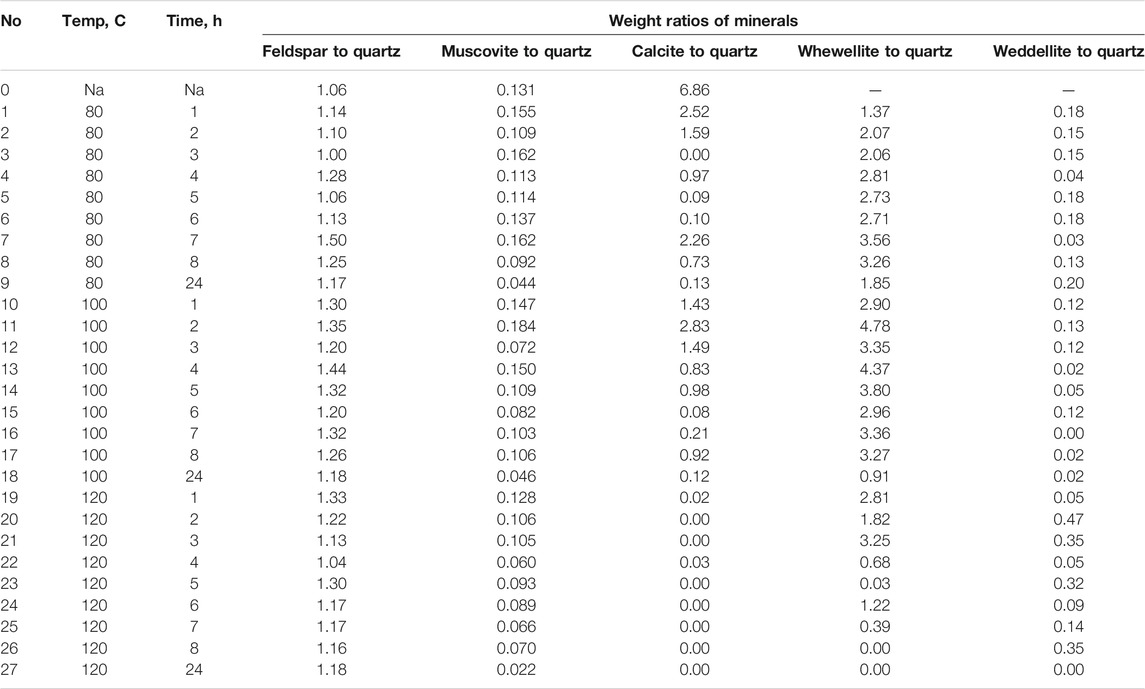
TABLE 3. Weight ratios of minerals in solid samples.
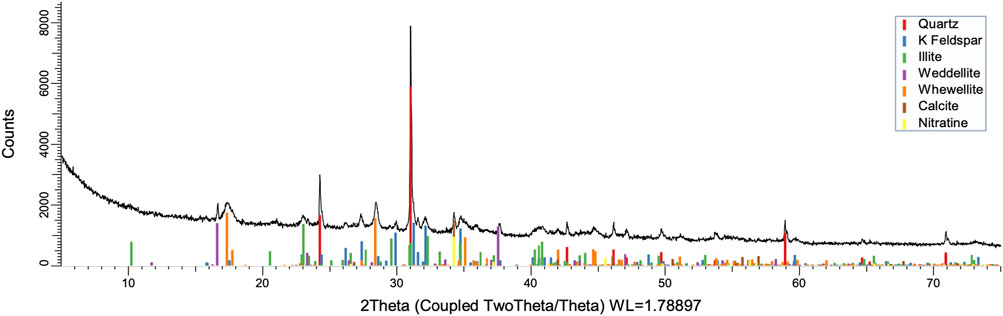
FIGURE 8. XRD pattern of oxidation residue at 80°C and 24 h.
FIGURE 9. XRD pattern of oxidation residue at 100°C and 1 h.
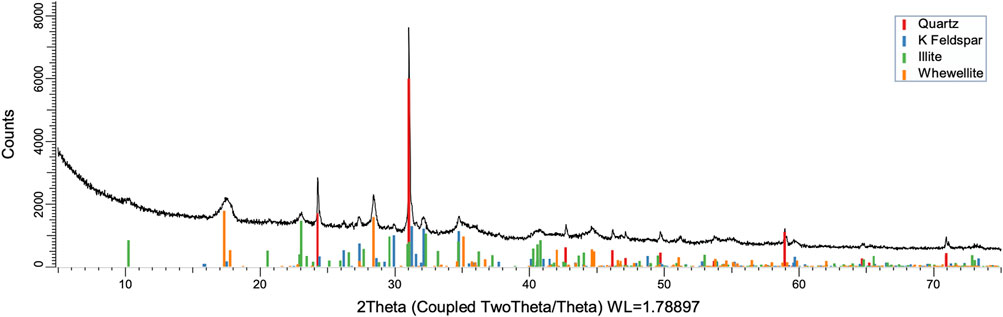
FIGURE 10. XRD pattern of oxidation residue at 120°C and 1 h.
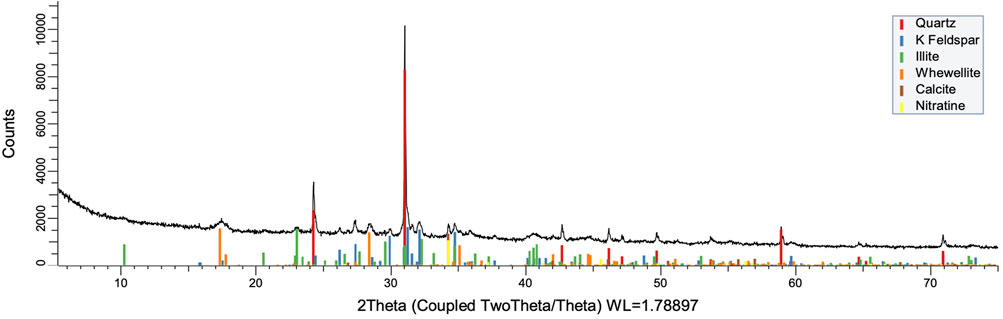
FIGURE 11. XRD pattern of oxidation residue at 100°C and 24 h.
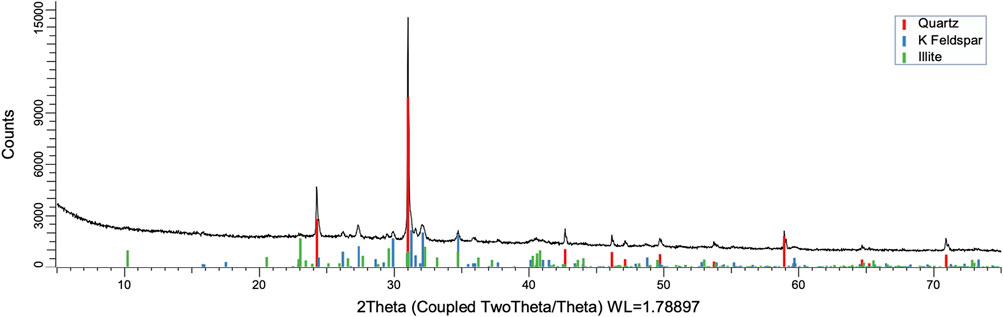
FIGURE 12. XRD pattern of oxidation residue at 120°C and 24 h.
To understand the kinetics of calcite removal more deeply, the ratios of calcite to quartz were obtained via Rietveld analysis and compared (Table 3). Quartz was chosen for its relative inertness toward acid treatment (Zhang et al., 2016), whereas illite (Yeoh and Oades,1981) and feldspar (Kobayashi et al., 2001) are known to undergo chemical changes. According to the data presented in Table 3, the calcite-to-quartz ratio can be used as a definitive indicator for the progress of the reaction only when experiments were conducted at 120°C. At lower temperatures, the concentration of relative abundance of calcite remained significant. Another possibility to gain understanding on chemical composition of solid residue is to use ATR–FTIR, which is uniquely suitable for solid powdered samples and is relatively straightforward to use (Washburn and Birdwell, 2013). The representative spectrum of oil shale used in the current work is displayed in Figures 3, 4, 5, along with spectra obtained from reaction residues at 80, 100, and 120°C, respectively. FTIR spectra revealed the presence of carbonates and silicates in the oil shale sample as described previously (Palayangoda and Nguyen, 2012; Washburn and Birdwell, 2013). Calcium oxalate minerals are evident (Conti et al., 2010) in the products formed. All in all, FTIR results corroborate with XRD Rietveld analysis, showing the increase of organic carbon to the residual solids through oxalate salt precipitation.
Morphology and Surface Composition
The morphology of oil shale and the respective products was studied using SEM. Heterogeneity was evident in all cases (see figures in Supplementary Material), which was further corroborated via EDX surface composition analysis. For the starting material, six different regions in the sample were probed to reveal silicon-rich regions (region 1), calcite-rich regions (regions 2 and 3), and kerogen-rich regions (region 4). Kerogen-rich regions appear in the micrograph as dark areas as opposed to whitish gray areas for mineral matter. Closer examination of micrographs from samples taken after 3 h shows significant differences between different temperatures; for example, at 80°C, there is a clear visual indication of kerogen-rich regions present, whereas in the samples processed at 100 and 120°C, that distinction is less pronounced, though still clearly visible, and after 24 h, the kerogen-rich regions are absent, and the sample exhibits more homogeneous appearance (see Supplementary Material). The particle shape did not change significantly during the extraction unless examined at high magnification (50–100 k), in which case the formation of a flake-like structure was observed alongside the increase of the void space between the particles (see Supplementary Material), regardless of the reaction temperature.
Particle Size Distribution and Specific Surface Area
The particle size and morphology of solid particles in solid–liquid reactions are crucial parameters for the reaction kinetics and thus also for process design (Grénman et al., 2011a; 2011b; Russo et al., 2020; Salmi et al., 2013). The kinetics of the overall reactions are significantly influenced by the available reactive surface area of the solid, as are the possible internal mass transfer limitations encountered in the processing (Carletti et al., 2015; 2016; Russo et al., 2017). Moreover, the evaluation of the kinetic results obtained from the processing is practically impossible to be reliably interpreted without knowledge of the behavior of the solid during the reaction (Salmi et al., 2011; 2017). Additionally, knowledge of the particle size distribution is important for designing the following process steps, such as separation processes (Kavanaugh et al., 1980). This is highly important and should not be overlooked in the further development stages of the project, when pilot scale equipment is required, for example, processing and separation, as it influences the requirements in both ends of the overall process. This is what motivated us to investigate these factors in more detail than has been reported thus far in the literature (Walter and Morse 1984; Goodman et al., 2000).
The particle size of a solid is expected to be reduced during active participation in a reactive extraction. In our case, the particle size did indeed reduce until the 4th hour of the reaction at 80°C (Supplementary Figure S1) and until the 2nd hour of the reaction at 100°C (Supplementary Figure S2). After these points in time, the particle size distribution broadened, which at 120°C was observed already after 1 h (Supplementary Figure S3), indicating aggregation of solid particles during oxidation. The median particle size of the starting material was 66 μm, which on average did not change at 80°C; however, it was reduced to 49 μm at 100°C, but increased to 76 μm at 120°C during the experiments.
As surface area and porosity of a particle also have an influence on particle reactivity (Thiele, 1939), the specific surface area of the solid residues was measured. In the course of the experiments, the specific surface area increased in 24 h from 7 m2/g (starting material) to 40 m2/g at 80°C, to 62 m2/g at 100°C, and to 55 m2/g at 120°C (Table 1, Supplementary Figure S4), which constitutes at least a sevenfold increase on average. The lower surface area at 120°C could be explained by increased aggregation of solid residue observed also in the particle size distribution data.
The results clearly show that the very high reaction order of the extraction process exhibited in Figures 1, 2 cannot be solely explained by the chemical reactivity of the organic phase in the oil shale, as the typical reaction order of a reactive solid ranges between 2/3 (sphere) and 1 (porous solid), depending on the morphology of the particles. The reaction orders observed in Figures 1, 2 are clearly higher than one, which can be mainly explained by the shift in particle size distribution presented in Supplementary Figures S1–S3 and the increase in specific surface area presented in Supplementary Figure S4.
Conclusion
Oxidation of Estonian oil shale with HNO3 was performed, and the kinetics and behavior of the solid phase during the extraction were studied. It was shown that up to 96% of carbon present in the initial material could be extracted under favorable conditions (24 h at 120°C), and already 94% after 3 h of reaction at 120°C. According to XRD, most of the calcite was removed during the first hour of the reaction even at 80°C, and the residue consisted mostly of silicon-based minerals—quarts, feldspar, and illite. Evidence of oxalate formation was also provided by the presence of whewellite and weddellite. Thus, one can assess the extent of carbon extraction from kerogen based on the analysis of solid residue. Morphological changes were visible in sub-micrometer scale, and formation of flake-like structures was observed. Particle size distribution showed signs of broadening during the extraction, whereas the average median particle size did not change at 80°C, while it diminished at 100°C and increased at 120°C. Size distribution broadening indicated aggregate formation, which was more pronounced at 120°C and was corroborated by an increase in median size at the same temperature. The changes in the specific surface area and the related changes in the particle size distribution during the process were clearly correlated with the extraction kinetics, which can be used as a tool in planning further process development steps. The results show clearly that high yields can be obtained in the oxidative leaching of Estonian oil shale with process optimization, which enables the utilization of this valuable raw material for higher value added chemical production compared to energy production, which is its main current use.
Data Availability Statement
The raw data supporting the conclusion of this article will be made available by the authors, without undue reservation.
Author Contributions
All authors listed have made a substantial, direct, and intellectual contribution to the work, and approved it for publication. KM, KK, and VM have contributed to performing the experiments and analysis, Grénman has contributed to the experimental planning and manuscript writing/editing, ML has contributed to planning the research strategy and manuscript editing, AN has contributed to the experimental planning, project coordination, and manuscript writing.
Funding
Smart specialization project was funded by the EU regional development program in partnership of OÜ Kerogen. This work was a part of the activities at the Johan Gadolin Process Chemistry Centre at Åbo Akademi University. We thank the Centre of Excellence in Molecular Cell Engineering grant no. 2014-2020.4.01.15-0013 and European Regional Development fund grant no. 2014-2020.4.02.16-0050 for financial support.
Conflict of Interest
The authors declare that the research was conducted in the absence of any commercial or financial relationships that could be construed as a potential conflict of interest.
Publisher’s Note
All claims expressed in this article are solely those of the authors and do not necessarily represent those of their affiliated organizations, or those of the publisher, the editors, and the reviewers. Any product that may be evaluated in this article, or claim that may be made by its manufacturer, is not guaranteed or endorsed by the publisher.
Acknowledgments
Toivo Kallaste, Siim Pajusaar, and the Department of Geology are thanked for providing Rietveld analysis of XRD difractograms.
Supplementary Material
The Supplementary Material for this article can be found online at: https://www.frontiersin.org/articles/10.3389/fceng.2022.590115/full#supplementary-material
Footnotes
1Minerals present according to XRD analysis, except illite, were quantified and normalized, thus giving weight ratios of mineral components.
References
Benning, A. (1955). The Importance of Nitric Acid Oxidation in Clarification of the Constitution of Coal. Brennstoff-Chemie 36, 38–43.
Bondar, E., and Koel, M. (1998). Application of Supercritical Fluid Extraction to Organic Geochemical Studies of Oil Shales. Fuel 77 (3), 211–213. doi:10.1016/S0016-2361(97)00188-9
Broi-Karre, G. V., and Proskuryakov, V. A. (1965). Oxidation of Oil Shales by Atmospheric Oxygen. V. Kinetics of Oxidation of Kerogen Shale in an Aqueous Alkaline Medium. Zhurnal Prikladnoi Khimii (Sankt-Peterburg, Russ. Federation) 38, 2779–2786.
Brower, F. M., and Graham, E. L. (1958). Some Chemical Reactions of Colorado Oil Shale Kerogen. Ind. Eng. Chem. 50, 1059–1060. doi:10.1021/ie50583a043
Carletti, C., Grénman, H., De Blasio, C., Mäkilä, E., Salonen, J., Murzin, D. Y., et al. (2016). Revisiting the Dissolution Kinetics of Limestone - Experimental Analysis and Modeling. J. Chem. Tech. Biotech. 91 (5), 1517–1531. doi:10.1002/jctb.4750
Carletti, C., De Blasio, C., Grénman, H., and Westerlund, T. (2015). On Modelling the Roles Played by Diffusive and Convective Transport in Limestone Dissolution for Wet Flue Gas Desulphurisation. Chem. Eng. Trans. 43, 2131–2136. doi:10.1016/B978-0-444-63234-0.50051-8
Conti, C., Brambilla, L., Colombo, C., Dellasega, D., Gatta, G. D., Realini, M., et al. (2010). Stability and Transformation Mechanism of Weddellite Nanocrystals Studied by X-Ray Diffraction and Infrared Spectroscopy. Phys. Chem. Chem. Phys. 12 (43), 14560–14566. doi:10.1039/C0CP00624F
Degtereva, Z. A., Fomina, A. S., and Nutre, E. O. (1960). Dicarboxylic Acids from Kerogen, U.S.S.R. patent No SU127,653.
Degtereva, Z. A., and Fomina, A. S. (1959a). Production of C4-10 Dibasic Acids from Oil Shade Kukersite. Eesti NSV Teaduste Akadeemia Toimetised. Tehniliste Ja Füüsikalis-matemaatiliste Teaduste Seeria 8, 122–135. doi:10.3176/tech.phys.math.1959.2.07
Degtereva, Z. A., and Fomina, A. S. (1959b). The Action of Concentrated Nitric Acid on the Kerogens of Shale Kukersite at Room Temperature. Goryuchie Slantsy, Khim. I Tekhnol., Akad. Nauk Eston. S.S.R., Inst. Khim. 5–14.
Fomina, A. S., and Degtereva, Z. A. (1956). Action of Nitric Acid on the Kerogen of Slate-Kukersite. Goryuchie Slantsy., Khim. I Tekhnol. Eston. Gosudarst. Izdatel., Tallin, 7–16.
Fomina, A. S., and Pobul, L. J. (1955). The Separation and Identification of Saturated Dibasic Acids. III. Oxidative Degradation of Kukersite Kerogen. Eesti NSV Teaduste Akadeemia Toimetised 4, 48–56. doi:10.3176/toimetised.1955.1.04
Fomina, A. S., Veski, R., and Mannik, A. (1977). “Technology of the Chemical Treatment of Kerogen from Sapropelite Type Bituminous Shales,” in Khimiya Tverdogo Topliva (Moscow: Russian Federation), 170–174.
Goodman, A. L., Underwood, G. M., and Grassian, V. H. (2000). A Laboratory Study of the Heterogeneous Reaction of Nitric Acid on Calcium Carbonate Particles. J. Geophys. Res. 105 (D23), 29053–29064. doi:10.1029/2000JD900396
Grénman, H., Salmi, T., and Murzin, D. Y. (2011). Solid-liquid Reaction Kinetics - Experimental Aspects and Model Development. Rev. Chem. Eng. 27, 53–77. doi:10.1515/revce.2011.500
Grénman, H., Ingves, M., Wärnå, J., Corander, J., Murzin, D. Y., and Salmi, T. (2011). Common Potholes in Modeling Solid-Liquid Reactions - Methods for Avoiding Them. Chem. Eng. Sci. 66, 4459–4467. doi:10.1016/j.ces.2011.04.022
Groves, M. C. E. (2020). “Nitric Acid,” in Kirk‐Othmer Encyclopedia of Chemical Technology. 5th ed. (Hoboken: John Wiley & Sons), 27. doi:10.1002/0471238961.1409201803120118.a01.pub3
Kavanaugh, M. C., Tate, C. H., Trussell, A. R., Trussell, R. R., and Treweek, G. (1980). Use of Particle Size Distribution Measurements for Selection and Control of Solid/Liquid Separation Processes. Adv. Chem. Particulates Water 189, 305–328. doi:10.1021/ba-1980-0189.ch014
Kobayashi, M., Sawada, A., Tani, Y., Soma, M., Tanaka, A., Honma, T., et al. (2001). Acid Dissolution of Olivines, Feldspars and Dunite. Water Air Soil Pollut. 130 (1), 757–762. doi:10.1023/A:1013845804654
Lindsay, A. F. (1954). Nitric Acid Oxidation Design in the Manufacture of Adipic Acid from Cyclohexanol and Cyclohexanone. Chem. Eng. Sci. 3, 78–93. doi:10.1016/S0009-2509(54)80008-X
Nebe, E., and Boehm, O. (1955). Isolation of Nitric Acid Oxidation Products of Aliphatic and Cycloaliphatic Compounds. issued September 27, 1955.
Nordlinger, H. (1887). Oxidation of Pure Myristic Acid with Nitric Acid. Berichte Der Deutschen Chemischen Gesellschaft 19, 18930000.
Palayangoda, S. S., and Nguyen, Q. P. (2012). An Atr-Ftir Procedure for Quantitative Analysis of mineral Constituents and Kerogen in Oil Shale. Oil Shale 29 (4), 344–356. doi:10.3176/oil.2012.4.05
Pobul, L. Ya., Fomina, A. S., Mannik, E., and Bondar, E. B. (1974). Oxidative Degradation of Boltysh Shale by Alkaline Potassium Permanganate. Leningrad: Khimiya Tverdogo Topliva, 53–60.
Russo, V., Grénman, H., Cogliano, T., Tesser, R., and Salmi, T. (2020). Advanced Shrinking Particle Model for Fluid-Reactive Solid Systems. Front. Chem. Sci. Eng. 11. doi:10.3389/fceng.2020.577505
Russo, V., Salmi, T., Carletti, C., Murzin, D. Y., Westerlund, T., Tesser, R., et al. (2017). Application of an Extended Shrinking Film Model to Limestone Dissolution. Ind. Eng. Chem. Res. 56 (45), 13254–13261. doi:10.1021/acs.iecr.7b01654
Salmi, T., Grénman, H., Warnå, J., and Murzin, D. Y. (2011). Revisiting Shrinking Particle and Product Layer Models for Fluid-Solid Reactions - From Ideal Surfaces to Real Surfaces. Chem. Eng. Process. 50, 1076–1084. doi:10.1016/j.cep.2011.05.015
Salmi, T., Grénman, H., Warnå, J., and Murzin, D. Y. (2013). New Modelling Approach to Liquid-Solid Reaction Kinetics: From Ideal Particles to Real Particles. Chem. Eng. Res. Des. 91 (10), 1876–1889. doi:10.1016/j.cherd.2013.08.004
Salmi, T., Russo, V., Carletti, C., Kilpiö, T., Tesser, R., Murzin, D., et al. (2017). Application of Film Theory on the Reactions of Solid Particles With Liquids: Shrinking Particles With Changing Liquid Films. Chem. Eng. Sci. 160, 161–170. doi:10.1016/j.ces.2016.11.026
Thiele, E. W. (1939). Relation between Catalytic Activity and Size of Particle. Ind. Eng. Chem. 31 (7), 916–920. doi:10.1021/ie50355a027
Veski, R., and Veski, S. (2019). Aliphatic Dicarboxylic Acids from Oil Shale Organic Matter ‒ Historic Review. Oil Shale 36 (1), 76. doi:10.3176/oil.2019.1.06
Walter, L. M., and Morse., J. W. (1984). Reactive Surface Area of Skeletal Carbonates during Dissolution: Effect of Grain Size. Sepm Jsr 54 (4), 1081–1090. doi:10.1306/212F8562-2B24-11D7-8648000102C1865D
Washburn, K. E., and Birdwell, J. E. (2013). Multivariate Analysis of ATR-FTIR Spectra for Assessment of Oil Shale Organic Geochemical Properties. Org. Geochem. 63 (October), 1–7. doi:10.1016/j.orggeochem.2013.07.007
Yeoh, N., and Oades, J. (1981). Properties of Soils and Clays after Acid Treatment. I. Clay Minerals. Soil Res. 19 (2), 147. doi:10.1071/SR9810147
Keywords: oil shale, kerogen, oxidation, nitric acid, dissolution, particle size distribution, specific surface area, solid separation
Citation: Niidu A, Grénman H, Muldma K, Kaldas K, Mikli V and Lopp M (2022) Behavior of Estonian Oil Shale in Acidic Oxidative Conditions. Front. Chem. Eng. 4:590115. doi: 10.3389/fceng.2022.590115
Received: 31 July 2020; Accepted: 19 January 2022;
Published: 28 February 2022.
Edited by:
Rosa Turco, University of Naples Federico II, ItalyReviewed by:
Martino Di Serio, University of Naples Federico II, ItalyOsvalda Senneca, National Research Council (CNR), Italy
Copyright © 2022 Niidu, Grénman, Muldma, Kaldas, Mikli and Lopp. This is an open-access article distributed under the terms of the Creative Commons Attribution License (CC BY). The use, distribution or reproduction in other forums is permitted, provided the original author(s) and the copyright owner(s) are credited and that the original publication in this journal is cited, in accordance with accepted academic practice. No use, distribution or reproduction is permitted which does not comply with these terms.
*Correspondence: Allan Niidu, YWxsYW4ubmlpZHVAdGFsdGVjaC5lZQ==