 Afreenuzzaman Badruzzaman
 Seckin Karagoz
 Fadwa Eljack
- Department of Chemical Engineering, College of Engineering, Qatar University, Doha, Qatar
The growing interest in hydrogen as an alternative fuel has stimulated research into methods that enable the global shift to sustainable, green energy. One promising pathway is the production of green hydrogen via electrolysis, particularly when coupled with renewable energy sources like solar power. Integrating a proton exchange membrane (PEM) electrolyzer with solar energy can aid this transition. Using treated sewage effluent, instead of deionized water, can make the process more economical and sustainable. Thus, the objective of this research is to demonstrate that an integrated electrolysis-water treatment-solar energy system can be a viable candidate for producing green hydrogen in a sustainable manner. This study assesses different combinations of water pretreatment (RO and UF) and solar energy input (PV, ST, and PTC), evaluating their techno-economic feasibility, efficiencies, environmental impact, and sustainability. The study shows that CSP scenarios have the highest CAPEX, roughly fourfold that of PV cases and sevenfold that of national grid cases. Using solar energy sources like PV, ST, and PTC results in high material efficiency (94.87%) and environmental efficiency (98.34%), while also reducing CO2 emissions by approximately 88% compared to the national grid. The process’s economic sustainability averages 57%, but it could reach 90% if hydrogen production costs fall to $2.08-$2.27 per kg. The outcome of this study is to provide a green hydrogen production pathway that is technically feasible, environmentally sustainable, and economically viable.
1 Introduction
The widespread dependence on fossil fuels for energy generation poses severe environmental issues. Consequently, the reduction of carbon emissions has emerged as an urgent issue (Pichardo et al., 2019). In this context, hydrogen is gaining global attention due to its enormous potential, such as becoming the leading energy carrier and its mobile/stationary energy applications (Figure 1), of offering an alternative solution to the aforementioned challenge (Karagöz et al., 2018; Karagöz et al., 2019). A notable decrease in hydrogen production costs is essential for achieving widespread adoption, as this is a crucial element for the ongoing advancement and expansion of the hydrogen economy (Karagoz, 2018).
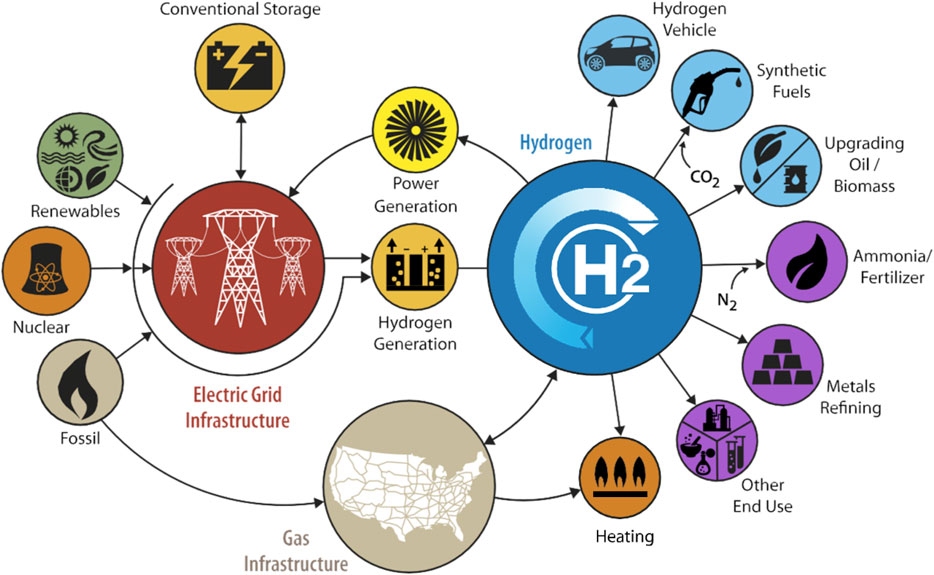
Figure 1. The role of hydrogen technologies in future energy systems (Guerra et al., 2019).
The global demand for hydrogen is around 70 million metric tons per year, with nearly all of it produced from fossil fuels. Approximately half of hydrogen production comes from the reforming of natural gas and refinery gas, with approximately 30% generated as a byproduct of chemical synthesis. Furthermore, coal gasification accounts for around 18% of global hydrogen production, whereas electrolysis accounts for only 4% (Kumar and Lim, 2022). Hybrid hydrogen production combines various techniques to generate hydrogen, often integrating renewable energy sources and traditional methods to enhance efficiency and reduce environmental emissions.
The overall emission of conventional H2 production pathways (e.g., such as steam reforming natural gas and coal gasification). Financial considerations influence technology selection; hydrogen production from natural gas costs around $2 per kg, resulting in lifecycle emissions of 10–16 kg CO2 (eq) for each kg of H2 produced. Renewable energy resources include solar, wind, geothermal and others combined with green technologies like Electrolysis can offer great environmental benefits compared to the exciting production methods. Hydrogen production from renewable energy resources ranges between 0 and 3 kg of CO2 (eq) per kilogram of hydrogen produced and the current estimate for the cost of hydrogen production using electrolysis is between $5 and $6 per kilogram. Achieving cost parity with steam methane reforming (SMR) at all sizes requires lowering the cost of hydrogen production via electrolysis to between $2.08 and $2.27 per kg7.
Access to renewable energy depends mostly on geographical location. European nations have access to wind and geothermal energy; while the Middle East and North Africa (MENA) regions are a prime location for solar energy development due to its abundant sunlight, high solar irradiance levels, and vast arid land suitable for large-scale projects. Key commercially viable and scalable solar technologies in the MENA region include photovoltaic (PV) technology (especially silicon-based panels), concentrated solar power (CSP), and hybrid solar systems. Silicon-based PV panels dominate the market due to their reliability and cost-effectiveness. Efficiency improvements have reached over 22% for monocrystalline silicon cells, and further advancements are being made in manufacturing processes to enhance scalability and reduce costs (Aghahosseini et al., 2020; Razi et al., 2022; Abdeladim et al., 2018). Globally, the photovoltaics (PV) industry has achieved remarkable cost reductions by enhancing efficiency in both manufacturing and deployment processes. A decade ago, the price of utility-scale PV systems was $4,000 per kW, and today, this cost has decreased by a factor of five, resulting in electricity production at $0.04 per kWh. The target set by the United States Department of Energy for the unsubsidized levelized cost of electricity for utility-scale PV is $0.03 kWh-1 by 2025 and $0.02 kWh-1 by 2030 (Ginsberg et al., 2022). CSP plants are gaining traction due to their ability to integrate with thermal storage, allowing power generation even after sunset. Efficiencies in CSP systems typically range between 35%–40%, and projects like the Noor Ouarzazate Solar Complex in Morocco exemplify successful deployments (Aghahosseini et al., 2020; Razi et al., 2022).
Water electrolysis is an electrochemical method for water splitting aimed at producing green hydrogen through electricity, potentially representing an emission-free technology if powered from renewable energy sources. Since the 18th century, water electrolysis technologies have undergone continuous development and application in industrial contexts, influenced by various trends that can be categorized into approximately five generations. Figure 2 illustrates the various generations of water electrolysis and their associated challenges, technological advancements, and significance.

Figure 2. Advancements in water electrolysis across generations (Kumar and Lim, 2022).
During the development stages, four categories of water electrolysis technologies were introduced based on their electrolyte, operational conditions, and ionic agents (OH−, H+, O2−): (i) Alkaline water electrolysis, (ii) AEM water electrolysis, (iii) PEM water electrolysis, and (iv) Solid oxide water electrolysis. Nonetheless, the operational concepts remain the same across all instances. The choice between these technologies depends on specific application needs, including cost, scalability, integration with renewables, and purity requirements. Among these, Proton Exchange Membrane (PEM), Anion Exchange Membrane (AEM), and Solid Oxide (SO) electrolyzer are notable. AEM systems are still in their early stages of development, and they confront problems in terms of adaptability and efficiency (Hassan et al., 2024). SO electrolyzer, on the other hand, uses thermal energy more efficiently (80%–90%) but still requires high and stable temperatures. This would make them less suitable for integration with renewable energy since they face issues of variable power due to possible damage from temperature variations. Moreover, it faces challenges in cost, durability, and start-up flexibility (Wang et al., 2024). Proton Exchange Membrane (PEM) water electrolysis is an advanced commercialized technology for producing hydrogen through water electrolysis, leveraging the unique properties of a proton-conducting membrane. PEM electrolyzer differs primarily from AEM and SO technologies by their flexibility and adaptability to variable power sources. This technology is gaining prominence in the quest for sustainable hydrogen production due to its efficiency (60%–90%), scalability, and versatility. They are also capable of quickly responding to variations in power and, therefore, can be combined with renewable power sources such as solar and wind, whose output can change significantly. PEM is best suited for applications requiring high hydrogen purity, dynamic operation, and renewable energy integration, despite higher costs (Luo et al., 2023; Sin et al., 2024; Wang et al., 2022).
Despite the obvious advantages of PEM electrolysis, challenges remain, including the high cost of membranes and catalysts. Several factors influence the operational cost of PEM, including energy input, electrolyzer efficiency, water purity, system design and scalability, durability, operating pressure, maintenance and reliability, integration with hydrogen storage and distribution, policy and market factors, and environmental and regional considerations. The efficiency of PEM is influenced by a variety of factors electrochemical factors (catalyst performance, membrane conductivity, overpotential), operating conditions (temperature, pressure, water purity), system-level factors (cell design, stack Efficiency, balance of plant), integration with renewable energy (energy Source and load management) and scale-up considerations (heat and mass transfer, manufacturing and material costs) (Kumar and Lim, 2022).
Optimizing PEM electrolyzers for large-scale green hydrogen production involves a holistic approach and depends on advancements in electrochemical performance, system design, and integration with renewable energy sources. Continuous innovation in materials, operational strategies, and scalability will be essential to optimize efficiency and reduce costs, making PEM electrolyzers a cornerstone of the green hydrogen economy. Leveraging technological innovations, system designs, and favorable market conditions will be key to achieving competitive green hydrogen production. Several global manufacturers, including Nel., Cummins, Siemens, ITM Power, Plug Power, and Elogen, have developed large-scale PEM water electrolyzers for industrial and transportation applications (Kumar and Lim, 2022). For example, the Siemens Silyzer portfolio grows by a factor of ten every four to 5 years, driven by market demand. First, Silyzer 100 was developed with a capacity of 0.1 MW in 2011 and a planned capacity of 1000 MW by 2028+. Currently, the Silyzer 300 full module array (24 modules) has a plant power demand of 17.5 MW, a plant efficiency of more than 75.5%, and a hydrogen production rate of 335 kg per hour (Pfennig et al., 2024). Thus, green hydrogen production through electrolysis is challenging (IEA, 2024).
Integrating Proton Exchange Membrane (PEM) electrolysers with renewable energy sources is a promising approach to green hydrogen production, but several technological and economic challenges must be overcome before large-scale deployment is feasible. Technological limitations include intermittent and variable renewable energy, durability and degradation, efficiency losses at partial loads, water quality, and integration challenges. Economic limitations include high capital costs, the cost of renewable electricity, energy conversion efficiency, maintenance and replacement costs, as well as market and policy challenges. To overcome the technological and economic constraints of integrating PEM electrolyzers with renewable energy, efforts must be focused on technological advancement, cost reduction, policy development, and market expansion (Colella et al., 2014).
In 2024, the share of hydrogen production capacity investment via electrolysis is nearly 20 GW (GW); 40% of these investments are made by China with European investment in a close second. These nations are blessed with abundant water and renewable energy resources. Although MENA countries are blessed with abundant solar energy resources, they are mostly arid regions with limited to non-existing freshwater resources (Zhang Xiang et al., 2019). With the increasing demand for water, there is a corresponding need to manage the substantial volume of wastewater generated. Proper treatment and disposal of this wastewater requires significant energy and financial resources. In arid regions such as the Gulf Cooperation Council (GCC) countries, the primary water source comes from desalination, another energy intensive process. Hence, identifying methods to reuse treated wastewater for industrious purposes could represent a transformative approach economically and in terms of sustainability.
The state of Qatar (a GCC country) has been able to manage the treated wastewater with a focus on sustainability, setting a good example to other GCC nations (He et al., 2021). As per environmental statistics report by planning and statistics authority of Qatar (Qureshi, 2020), in 2021, treated sewage effluent (TSE) accounted for 16% of the main water source for the country. TSE is the effluent of residential wastewater treatment plants. With 27 wastewater treatment plants, 99.7% of the collected wastewater, about 253.21 million m3, is treated. According to the National Action Plan for Climate Change (Kamal et al., 2021), the goal of the Ministry of Environment and Climate Change is 100% reutilization of the treated wastewater. The integration of water treatment, electrolysis, and solar energy is a promising pathway toward sustainable green hydrogen production. Considering the use of TSE (wastewater) with Electrolysis can be a promising sustainable mean for clean energy production.
Incorporating sustainability into process design is crucial in reaching this goal by reducing or mitigating adverse impacts. Measuring sustainability performance and decision-making are essential yet complex procedures for assessing sustainability levels. Therefore, establishing a methodological approach is essential for effectively gathering and abstracting the complicated operations of processes. This will facilitate clear analysis, communication, and the necessary sustainability indicators (Karagöz, 2023).
Developing sustainable production frameworks that incorporate techno-economic, environmental, and methodological sustainability assessments is an effective tool for any process scale, supporting the designer in achieving a thorough performance evaluation. The key components of sustainability used to assess sustainable performance levels are economics, energy, the environment, and material efficiency. These frameworks offer the ability and flexibility to be implemented at various process scales, such as equipment, process units, or the complete process, by allowing for direct comparison of numerous alternative processes that target the same product but use different designs. The added value of using such a framework is it gives the designer or researcher a tool to assess sustainability performance following process changes (Karagöz, 2023; Gonza et al., 2003).
In this context, the main contributions of this study are as follows: (i) It proposes a novel integrated framework combining water treatment (using Reverse osmosis and Ultrafiltration), PEM electrolysis, and renewable energy sources (Photovoltaic, Concentrated Solar Power, and Parabolic Trough Collector) for sustainable hydrogen production using treated sewage effluent; (ii) It conducts a comprehensive techno-economic, environmental, and exergy analysis of alternative process scenarios; (iii) It assesses the sustainability of each scenario using a multi-dimensional set of indicators covering economic, environmental, energy, and material aspects; and (iv) It demonstrates that using treated wastewater and solar energy can make green hydrogen production more viable in arid regions.
The remainder of this paper is organized as follows: Section 2 (Description of the Conceptual Framework) describes the conceptual framework of the integrated system combining water treatment, electrolysis, and solar energy, along with the scenario definitions and process assumptions. Section 3 (Systematic Methodology) presents the methodology, including mass calculations, CAPEX/OPEX analysis, exergy evaluations, environmental impact assessments, and sustainability analysis. Section 4 (Results and Discussion) discusses the results for the scenarios, comparing technical, economic, environmental, and sustainability performance metrics. Comparisons are made to identify the most cost-effective and environmentally beneficial configurations. Section 5 (Conclusions) concludes the study by summarizing the main findings, advantages of integrating treated wastewater with PEM electrolysis powered by solar energy for sustainable hydrogen production and highlighting future research directions.
2 Description of the conceptual framework
This section aims to develop a sustainable production framework for green hydrogen. The developed framework utilizes available wastewater, integrating electrolysis, water treatment, and solar energy to produce clean hydrogen. This involves synthesizing integrated systems that consider the water pretreatment method and energy source pathways to improve the overall efficiency, sustainability, and cost-effectiveness of the green hydrogen production process. The results of the study offer valuable insights for the large-scale implementation of green or semi-green hydrogen production within existing industrial clusters. However, when incorporating technologies such as PEM electrolyzers, solar energy systems, and wastewater treatment systems, scalability emerges as a crucial element influencing total performance, efficiency, and environmental effect. Each of these systems possesses distinct capacities for scaling, operating within defined parameters influenced by size, energy requirements, and environmental conditions. Given these disparities, the integration of these systems should take into account their performance at various sizes. Each technology’s capacity must be addressed, and system optimization may not be applicable at all sizes.
Figures 3, 4 illustrate the proposed integrated wastewater to Green H2 production. The feed water required for the Proton exchange electrolyzer (PEM) is sourced from the water treatment plant, treated sewage effluent (TSE). In this study, the possible paths for water treatment are reverse osmosis (RO) and ultrafiltration (UF), and the energy required for PEM is provided by the following options: National grid, photovoltaic plant (PV) and concentrated solar power plant (CSP) (Solar tower (ST) and parabolic trough collector (PTC)). According to the chosen options, 8 scenarios are analyzed (see Table 1).
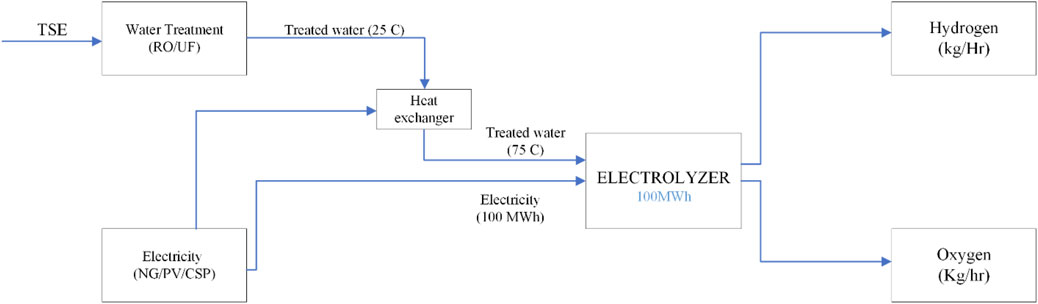
Figure 3. Proposed process description.
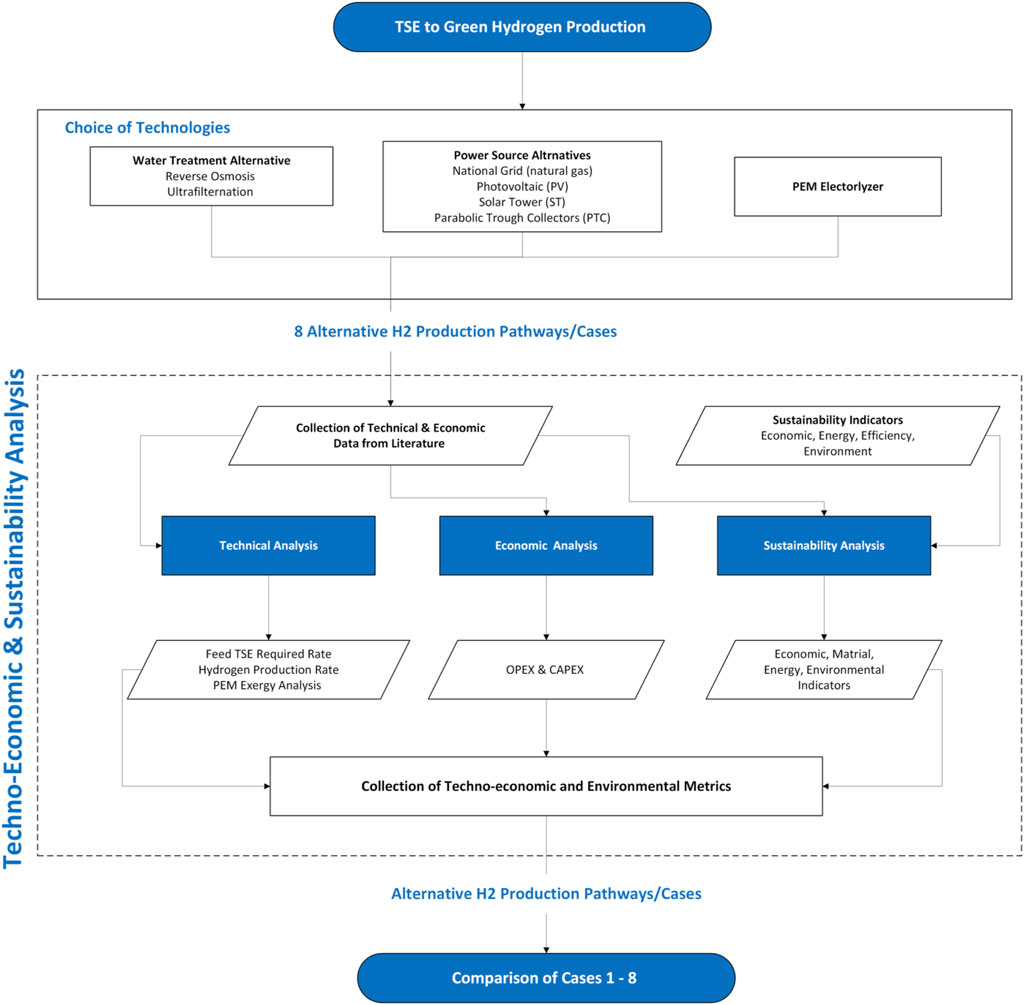
Figure 4. Approach methodology - techno-economic and sustainability analysis.
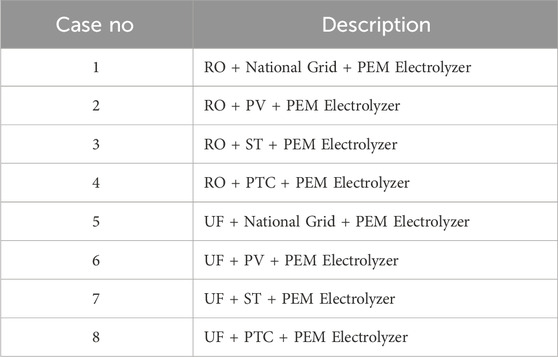
Table 1. TSE to hydrogen production pathways/scenarios.
The following are the parameters and assumptions used for the generated eight pathways:
1) Electrolyzer capacity is 100 MWh.
2) Two possible paths for water pretreatment: Reverse osmosis and Ultrafiltration.
3) Standards for TSE quality is shown in table 2. Data of sample collected from a treatment plant in Qatar is also shown for reference.
Potential effects of TSE on PEM performance and longevity are membrane fouling, catalyst degradation, corrosion of components, reduced efficiency and gas purity issues. To mitigate these negative impacts, a robust and advanced such as RO and UF water pretreatment process is essential. As shown in table 2, the TSE quality (used in this) obtained from the Municipal Wastewater Treatment Plant, Doha North, is within safe operating conditions.
4) Three potential paths for energy input selection: National grid, photovoltaic and concentrated solar power.
5) In exergy calculations, kinetic and potential exergy are considered negligible.
6) Rate of thermal energy input for the PEM electrolyzer,
7) Rate of Exergy of heat by the PEM electrolyzer,
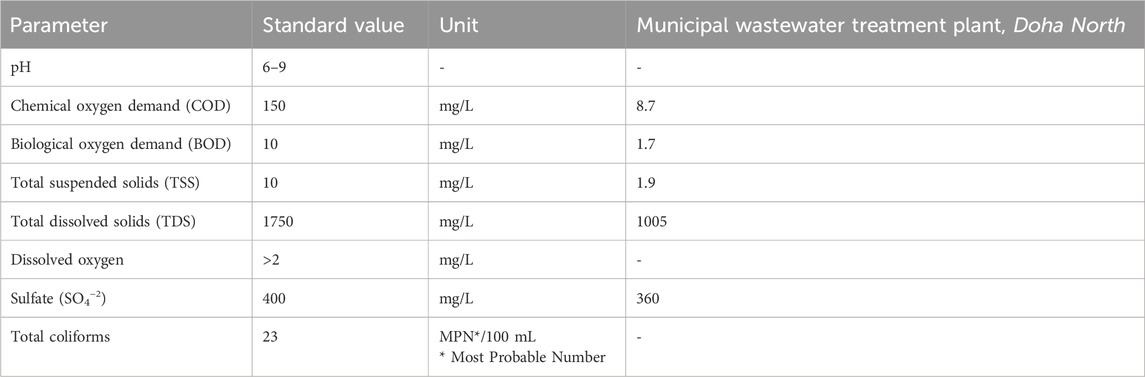
Table 2. Standards for TSE (Lahlou et al., 2020).
Since,
To = Reference environment temperature.
T = PEM electrolyzer temperature.
8) Considering the high heating value of hydrogen energy density for hydrogen production calculation (39.39 kWh/kg)
9) Properties of feed water to PEM electrolyzer:
a. Feed water temperature is kept at 75 C (The usual range comes between 50°C and 80°C. Elevated temperature improves performance by accelerating the kinetic reaction of the catalyst layer and reducing the ohmic resistance of the membrane) (Zhou et al., 2022; Bonanno et al., 2024).
b. Quality of Feed water is per the suggestion of the American Society for Testing and Materials either Type I ASTM Deionized water or Type II ASTM Deionized water (Wang et al., 2024).
c. Density of Feed water is 997 kg/m3).
3 Systematic Methodology
3.1 Mass calculations
Water electrolysis is an electrochemical method for water splitting aimed at producing green hydrogen through the application of electricity. The basic reaction of water electrolysis is as follows in Equation 1.
For the above equation, the theoretical thermodynamic cell voltage required to electrolyze water into hydrogen and oxygen at room temperature is 1.23 V. Experimental results indicate that the optimal cell voltage for effective water splitting is 1.48 V. Additional voltage is necessary to surmount the kinetics and ohmic resistance associated with the electrolyte and cell components of the electrolyzer.
For an ideal 100 MWh PEM electrolyzer, the hydrogen generation rate is 100,000 (kW)/39.39 (kWh/kg) = 2538.715 kg/h. Assuming a conversion efficiency of 75% (for the Siemens Silyzer 300), the hydrogen production rate is 2538.715 kg/h x 0.75 = 1904.036 kg/h. Equation 1 clearly states that 1 mol of H2O is required to make 1 mol of H2 gas. The molar mass of H2 is about 2 g/mol. The molar mass of H2O is about 18 g/mol. To make 1 kg of hydrogen, we require 9 kg of H2O. Therefore, the amount of water needed to make 1904.036 kg/h hydrogen is (1904 kg/h) x 9 = 1714 kg/h H2O. The amount of water required to make 1904 kg/h hydrogen is 1714 kg/h. H2O The density of H2O is assumed to be 997 kg/m3. Thus, the total volume of H2O required = 17,140/997 = 17.19 m3/h (412.5 m3/day). Literature validation (Bellotti et al., 2019; Nguyen et al., 2019) indicates that a 75% 100 MW electrolyzer yields a hydrogen production rate of around 1900 kg/h.
3.2 CAPEX/OPEX
The data collected from literature for the capital (CAPEX) and operational (OPEX) costs estimation for water treatment, PEM electrolyzers and power generation options are presented in Table 3, Table 4, 5, respectively.
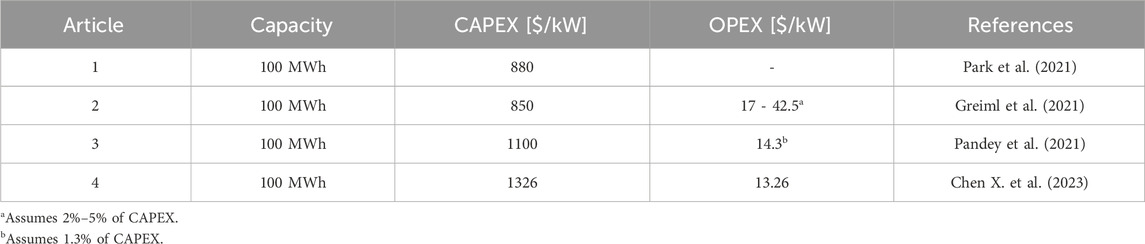
Table 3. CAPEX and OPEX values for PEM electrolyzer as reported in the literature.
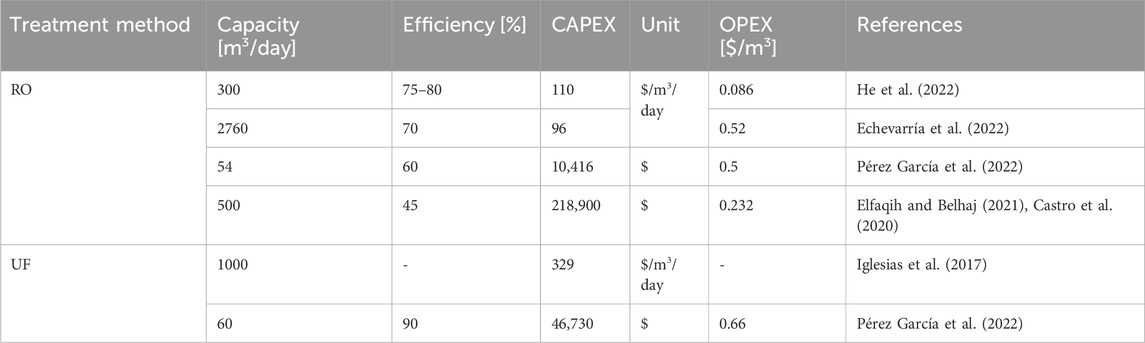
Table 4. CAPEX and OPEX values for water treatment as reported in the literature.
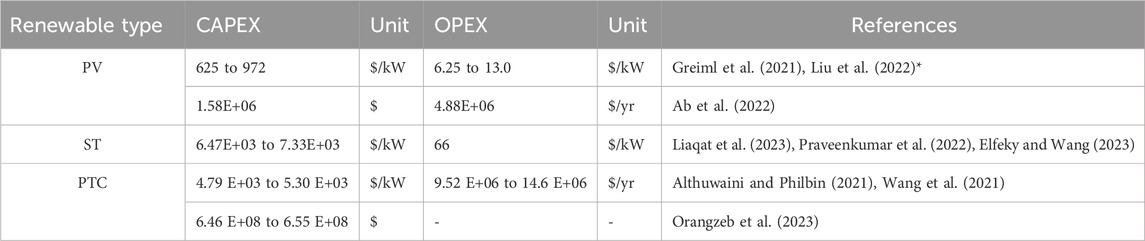
Table 5. CAPEX and OPEX values for solar power as reported in the literature.
The range of CAPEX for PEM electrolyzer in the literature depends on various factors like, operating conditions, high catalyst and membrane cost, manufacturing techniques, high ohmic resistance, and high overpotential of oxygen evolution reaction (Capuano et al., 2021; Escobar-Yonoff et al., 2021; Ayers et al., 2024; Nizami and Purwanto, 2022).
Table 3 indicates that CAPEX and OPEX values in the literature range from 880 to 1326 $/kW and from 1% to 5% of CAPEX $/kW, respectively. The electrical and exergy efficiencies of PEM range from 60% to 80% and from 56.34% to 72.5% in the literature (Luo et al., 2023; Sin et al., 2024; Wang et al., 2022; T. International Renewable Energy Agency, 2020; Incer-Valverde et al., 2023), respectively.
The reported capacity for RO (Table 4) ranges from 54 to 2760 m3/day, with CAPEX between $10,416 and $218,900, and OPEX between $0.50 and $0.232 per m3. Exergy efficiency varies from 4% to 27.3% (without renewable) (Al Ghamdi and Mustafa, 2022) and from 37.67% to 54% (with renewable energy) (Kupcu et al., 2023; El Mansouri et al., 2020).
The reported capacity for UF (Table 4) varies from 60 to 2800 m3/day, with CAPEX between $46,730 and $138,020, and OPEX ranging from $0.66 to $0.04 per m3. The efficiency and exergy efficiency range from 80% to 90% (Gonzalez-Ca et al., 2023) and 75.47% (Kupcu et al., 2023), respectively. In this study, the first energy source investigated is the national grid. And natural gas-generated electricity costs $37/MW, bringing the total energy cost for a 100 MW electrolyzer to $3700 per hour.
Subsequently, solar energy is examined as a renewable energy source, with Table 5 presenting the CAPEX and OPEX values for solar power (PV, ST, PTC) as reported in the literature.
3.3 Exergy calculations
Exergy is the maximum useful work obtainable as a system moves to equilibrium with its environment, unlike energy, which is always conserved. Exergy analysis evaluates energy quality and identifies inefficiencies due to irreversibility’s, leading to entropy generation (Jorgensen and Fath, 2008; Rosen, 2004).
5 types of Exergies are majorly used for exergy analysis of a system (Chitsaz et al., 2019), they are:
• Physical Exergy: Exergy from temperature and pressure changes.
• Chemical Exergy: Exergy from chemical reactions.
• Thermal Exergy: Exergy in heat interactions.
• Kinetic Exergy: Exergy when the system is in motion.
• Potential Exergy: Exergy when the system is at an elevation or has gravitational impact on it.
A PEM electrolyzer, used for hydrogen production, involves energy and exergy input to drive water electrolysis. The total energy demand includes electrical and thermal components. Exergy efficiency measures how effectively energy is converted to useful work, highlighting losses due to ohmic resistance, activation overpotentials, and heat dissipation (Ni et al., 2008). In our case we consider Kinetic and potential exergy to be negligible since we assume the electrolyzer is kept horizontally without any movement involved.
Exergy analysis helps pinpoint areas of inefficiency and guides improvements in system design and operation. It shows that while energy and exergy efficiencies are related, exergy analysis provides a more comprehensive view of energy quality and irreversibility, aiding the development of more efficient hydrogen production systems.
3.3.1 Proton exchange membrane (PEM)
The exergy efficiency of PEM can be calculated (Fellaou et al., 2021; Lee et al., 2022) by Equations 2-7 below. The main assumptions that have been made are: the kinetic and potential energy flows are negligible, the properties at the reference state are To = 298.15 K, Po = 1 atm, steady state, Q (heat, PEM) = 0 (Since there is no addition of heat to the PEM electrolyzer) and E (heat, PEM) = 0.
In this equation,
Total exergy flow rate of stream j is given by:
In this equation,
Then:
where
OR
where
Finally, exergy of heat is given by:
where
3.3.2 Reverse osmosis (RO)
The exergy efficiency of reverse osmosis can be determined (Delpisheh et al., 2021) using Equation (8) provided below.
where E is the rate of energy content, F is feed water, P is permeate water, and C is concentrate.
3.3.3 Solar power
The photovoltaic geographical information system by the European Commission gave insight into the irradiation data needed for the CSP and PV plants. For the selected location of Qatar:
Data from Figure 6 is utilized to ascertain the potential for electricity generation from solar energy in the state of Qatar. Upon evaluating the radiation data from Figure 6A, the maximum irradiation value was determined to be 7.008 kWh/m2/day, the minimum value 5.732 kWh/m2/day, and the average irradiation value 6.473 kWh/m2/day. Combined with an average daylight duration of 12 h (Figure 6C), these values suggest high potential for PV power generation. Also, there isn’t much variation between monthly in-plane irradiation. Figure 6C provides a detailed summary of technical inputs and simulation outputs from the Photovoltaic Geographical Information System (PVGIS). The Amizuth angle and Slope angle were adjusted to get the maximum yearly in-plane irradiation. We can see a −11.31% losses due to high temperatures in Qatar. Figure 6C gives a clear picture of the expected performance and limitations of the PV system.
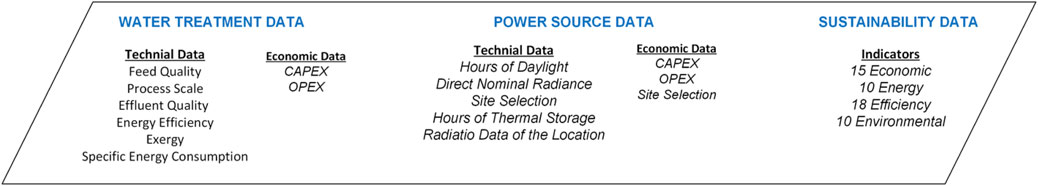
Figure 5. Technical and economic data collected from literature.
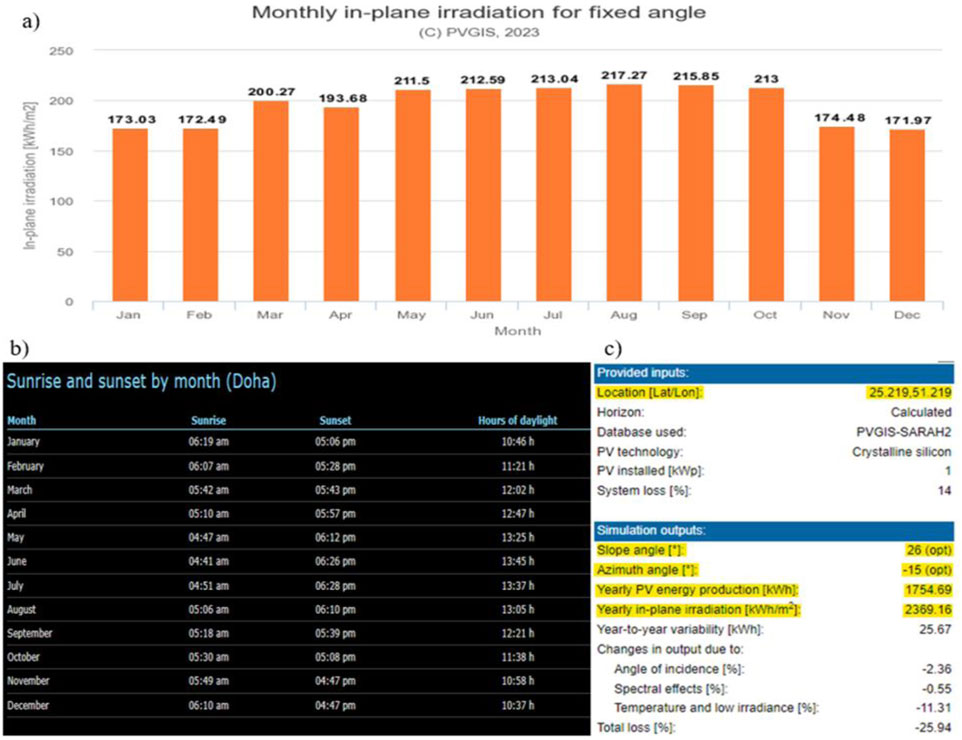
Figure 6. (a) Monthly in-plane irradiation data for fixed angle and fixed coordinates, (b) Hours of daylight month wise for State of Qatar, (c) Summary of technical data from Photovoltaic Geographical Information System (PVGIS).
3.3.3.1 Photovoltaic (PV)
Exergy efficiency of the PV can be written as (Equations 9-16) (Saloux et al., 2013; Kuczynski and Chliszcz, 2023; Nosratabadi et al., 2021):
Inlet exergy (Saloux et al., 2013; Kuczynski and Chliszcz, 2023; Nosratabadi et al., 2021):
where
where
Output exergy (Saloux et al., 2013; Kuczynski and Chliszcz, 2023; Nosratabadi et al., 2021):
where
where
where
where
The exergy efficiency of PV systems typically ranges from 10% to 20% under standard conditions. This is lower than their energy efficiency (which can exceed 20% for high-performance panels) because exergy efficiency takes into account not only the total energy output but also the quality of the energy and the irreversibilities that occur during energy conversion. For monocrystalline and polycrystalline silicon panels, typical exergy efficiencies range between 12% and 15%. These systems are commonly used due to their relatively high energy efficiency, but their exergy efficiency is impacted by thermal losses and the inherent inefficiencies in converting sunlight into electricity.
3.3.3.2 Parabolic trough collector (PTC)
Exergy balance of PTC is given by (Equations 17, 18) (Bamisile et al., 2019; Ghazouani et al., 2020; Kumar et al., 2020):
Exergy efficiency is given by (Bamisile et al., 2019; Ghazouani et al., 2020; Kumar et al., 2020):
Where
The exergy efficiency of Solar Tower (ST) systems, particularly for power generation, typically falls in the range of 20%–30%, depending on system design, thermal integration, and location-specific factors. The exergy efficiency of Parabolic Trough Collector (PTC) systems typically ranges between 15% and 20% under optimal conditions. This efficiency can be influenced by factors such as the receiver design, heat transfer medium, and environmental conditions like wind speed. Exergy destruction in PTC systems occurs primarily due to thermal losses, frictional losses in the heat transfer fluid, and temperature gradients within the system components.
3.4 Environmental assessment
The environmental assessment for CO2 emissions entails estimating greenhouse gas (GHG) emissions in CO2 equivalents (CO2e), accounting for all phases of a product or system’s life cycle. These stages often encompass manufacture, operation, and end-of-life phases. The scope of the environmental assessment is often organized around the three major stages of a product’s or system’s life cycle: (1) Direct emissions from owned or controlled sources (e.g., fuel burning transportation). (2) Indirect emissions result from the use of purchased power, steam, heating, and cooling. (3) Other indirect emissions, which encompass the full product value chain, such as supply chain emissions (for example, raw material extraction, transportation, and waste disposal).
The boundaries of the environmental assessment delineate the life cycle phases and the activities to be evaluated within each phase. These generally encompass manufacture, operation, and end-of-life phases. Manufacturing encompasses raw material extraction, material processing, assembly, and transportation. CO2e emissions encompass energy utilized in manufacturing, alongside methane (CH4) and nitrous oxide (N2O) emissions from production processes, as well as emissions from energy-intensive machinery, manufacturing facilities, and transportation. During the operational phase, energy consumption associated with the typical use of the product or system, including electricity, fuel, or gas, is taken into account. The CO2e emissions accounted for include those from fuel combustion, energy consumption resulting in indirect emissions (such as from power generation), and emissions from refrigerant leakage or other gases during utilization. The end-of-life phase encompasses decommissioning, recycling, and waste management. The CO2e emissions accounted for include those from energy utilized in disposal or recycling, methane emissions from landfills, and emissions associated with trash transportation.
The CO2 equivalent emissions from electricity generated by natural gas generally range from 0.4 to 0.6 kg of CO2 equivalent per kilowatt-hour (kg CO2e/kWh) (Hardisty et al., 2012). The CO2 equivalent footprint of power generated from photovoltaic (PV) solar panels typically varies from 0.02 to 0.1 kg of CO2 equivalent per kilowatt-hour (kg CO2e/kWh) over the system’s lifespan (Peng et al., 2013). The carbon dioxide equivalent footprint of energy generated from concentrated solar power (CSP) systems and parabolic trough collectors (PTC) often varies from 0.03–0.1 and 0.03–0.09 kg of CO2 equivalent per kilowatt-hour (kg CO2e/kWh) over the system’s lifespan (Timilsina, 2021; Shahabuddin et al., 2021), respectively. The CO2 equivalent footprint of RO and UF water treatment generally varies from 0.5 to 2.5 and 0.1–1 kg of CO2 equivalent per cubic meter (kg CO2e/m3) of processed water, respectively. The fluctuation within this range may be influenced by factors including the energy sources utilized for operation, system efficiency, and local conditions (Zhou et al., 2011).
3.5 Sustainability assessment
Measuring sustainability performance and making decisions are crucial and difficult tasks. As a result, it is necessary to develop/implement a systematic approach that assures the ability to collect and abstract complex process operations, as well as provide straightforward analysis and communication using relevant sustainability indicators. Considering the aforementioned elements, this study proposes the conceptual framework as a powerful tool for any process scale, supporting the designer in getting a full performance evaluation. This technique has the ability and flexibility to be applied at various process sizes, such as equipment, process units, or the complete process, by allowing for direct comparison of viable alternative processes that target the same result but use different designs. Furthermore, designers and researchers can easily apply this approach to assess the sustainability performance following process changes.
Proper and sufficient indicators need to be selected (directly can be adapted or modified from the literature) or developed. This phase is very critical since the selected indicators require measuring sustainability performance and making decisions. For sustainability assessment, the classified indicators are used for the alternative proposed processes’ designs to determine process potential which is defined as “a metric’s maximum level of improvement, over a technology’s current state of the art, that can be attained by any conceivable design employing the same technology”. The ratings of sustainability indicators lack relevance without the provision or selection of reference states. At present, the majority of sustainability indicator outcomes are articulated in terms of total quantities of materials or energy utilized by the process or per unit of product. This technique for existing processes is implemented by comparing current outcomes with prior trials or by evaluating other procedures yielding the same product. Nonetheless, this technique will become more challenging when the analysis is conducted across varying process design scales and boundaries. A system for identifying and selecting a sustainability scale for each indicator, framed by two scenarios reflecting optimal (100% sustainability) and minimal (0% sustainability) targets, was presented to address this issue. This sustainability scale facilitates the conversion of any indicator score into a dimensionless format by employing the worst and best situations, as delineated in Equation 19. This equation facilitates the visualization and comparison of sustainability assessment outcomes for each indicator across the four domains: Energy, Efficiency, Environment, and Economic.
Supplementary Tables 1–4 in the Supplementary Material defines the sustainability indicators—efficiency, energy, environmental, and economic—used in this study.
4 Results and Discussion
Since the efficiency and power of the electrolyzer remain constant, the amount of feed TSE required for the electrolyzer, and Hydrogen production rate remains the same for all the cases. (we have not considered the oxygen production rate in this study). For the TSE to hydrogen production pathways (listed in Table 1), Table 6 summarizes the final calculated/literature-based high and low values for each scenario to identify the best- and worst-case scenarios regarding CAPEX, OPEX, energy/exergy efficiency, and emissions.

Table 6. The summary of the high and low values of CAPEX, OPEX, Energy Efficiency, Exergy Efficiency and CO2e for 8 scenarios.
The following sections will focus on the main conclusions of the paper for the analysis of CAPEX, OPEX, emissions, and sustainability assessment.
4.1 CAPEX
Table 6; Figure 7 indicate that PEM, ST, and PTC technologies necessitate significant capital investment, with worst-case and best-case scenarios ranging from 132.63 to 88.03 million dollars, 732.521 to 646.76 million dollars, and 655.7 to 646.1 million dollars, respectively. In the comparison of the eight cases (Figure 7), Case 1 and Case 5 exhibit the lowest capital cost investment, both averaging approximately 110 million dollars in CAPEX. This is attributed to their reliance on grid electricity, eliminating the need for direct capital investment. Cases 3, 4, 7, and 8 demonstrate the highest capital investment due to incorporating technologies requiring significant capital, specifically PEM, ST, and PTC, with an average CAPEX value of approximately 750 million dollars. CAPEX values for concentrated solar power cases are relatively higher than those for photovoltaic cases (Approximately four–4.4 times).
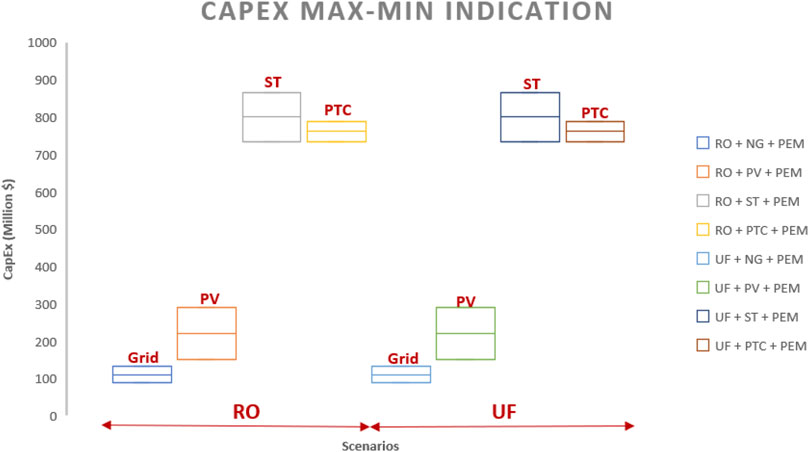
Figure 7. CAPEX for 8 scenarios.
4.2 OPEX
Table 6; Figure 8 indicate that PEM and PV technologies exhibit the highest operational costs, with worst-case and best-case scenarios ranging from 6.63 to 0.88 million dollars and 1.3 to 0.625 million dollars, respectively. Operating expenses (Figure 8) for photovoltaic cases are significantly higher than those for concentrated solar power. CAPEX and OPEX remain unaffected by the type of water treatment employed, whether RO or ultrafiltration (Figures 7, 8).
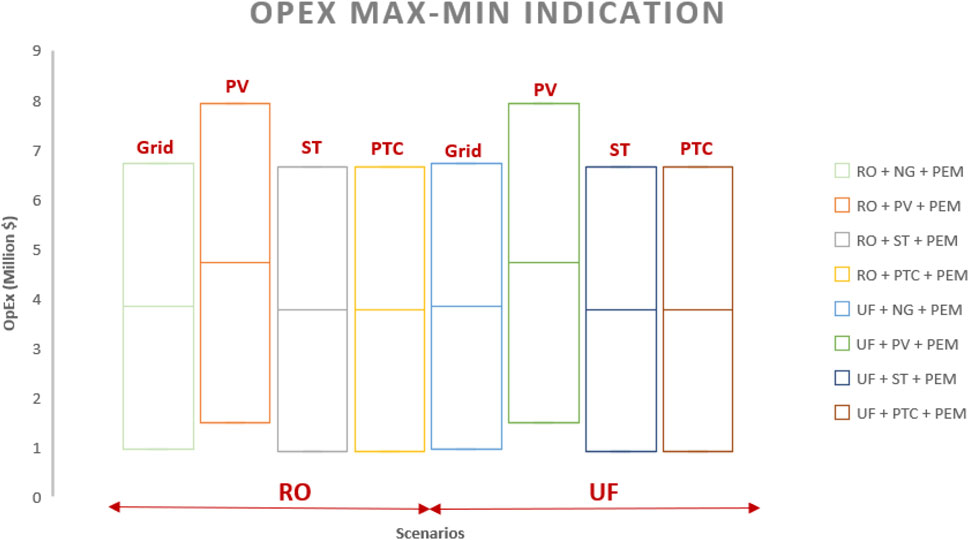
Figure 8. OPEX for 8 scenarios.
4.3 Emissions
Table 6; Figure 9 present the calculation of CO2 equivalent emissions per kg of H2 produced via PEM, derived by aggregating the contributions from the energy source and the water treatment method. This calculation includes factors such as direct emissions from combustion and indirect emissions associated with the extraction, processing, and transportation of natural gas, as well as the manufacturing, installation, operation, and decommissioning of solar panels, operational efficiency, and local conditions. Substituting grid-based energy with PV, ST, and PTC technologies significantly reduces the kg CO2e/kg H2 (appromitaly averaged %88).
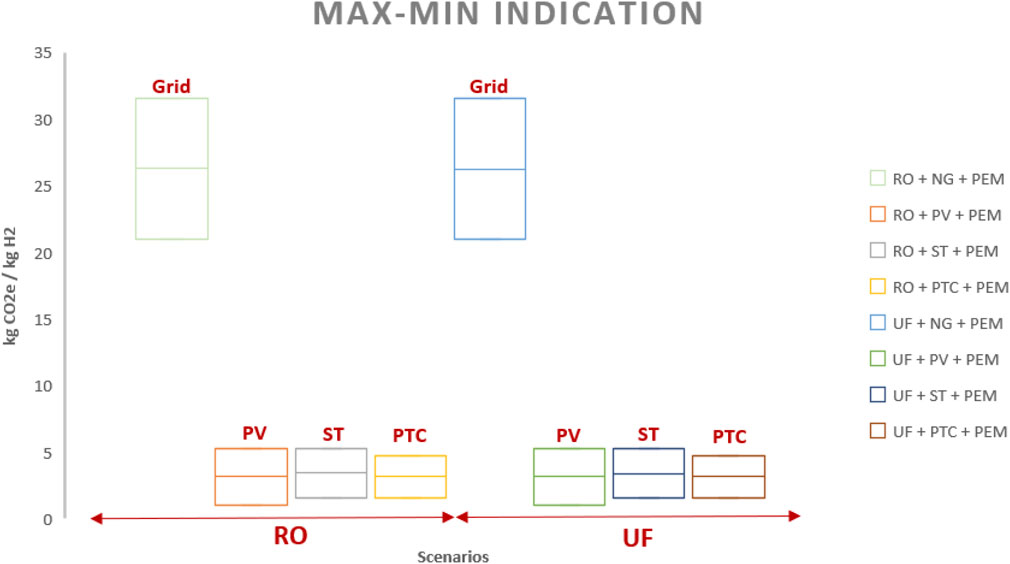
Figure 9. CO2e/kg H2 values for the scenarios.
4.4 Sustainability assessment
This study assesses the sustainability of the Siemens Silyzer 300 PEM (100 MWh) with an emphasis on renewable energy sources. The first step is to calculate the exergy efficiency of the aforementioned electrolyzer to use in the energy efficiency calculation regarding its impact on overall sustainability. Then, the overall sustainability assessment results are represented in the following paragraphs as explained in the previous section (3.5. Sustainability Assessment).
4.5 Exergy efficiency calculation for the Siemens Silyzer 300 PEM
For the base case, the hydrogen production rate is 1904 kg/h or 944.5 kmol/h, the electrical efficiency of the electrolyzer is 75%, and the water temperature is 75°C.
The rate of energy content of H2 stream:
The rate of electric energy input:
The rate of thermal energy input for the PEM electrolyzer:
The rate of thermal energy input to the heat exchanger for heating up the H2O from 25°C to 75°C;
The exergy efficiency:
Figure 10 illustrates the sustainability assessment for the integration of PEM, RO/UF, and a renewable energy source, considering material efficiency, energy efficiency, environmental impact, and economics. The efficiency of a process or unit operation is indicated by the quantity of materials and services needed to produce the desired product or accomplish a specific task. Mass transfer operations significantly affect energy demand, equipment size, costs, raw materials, and emissions. Efficiency indicators offer sustainability assessments that are valuable for identifying opportunities in process design during the conceptual stages, significantly impacting all aspects of process sustainability. The integrated process exhibits an average material efficiency of 94.866%, which can be deemed successful concerning sustainability objectives.
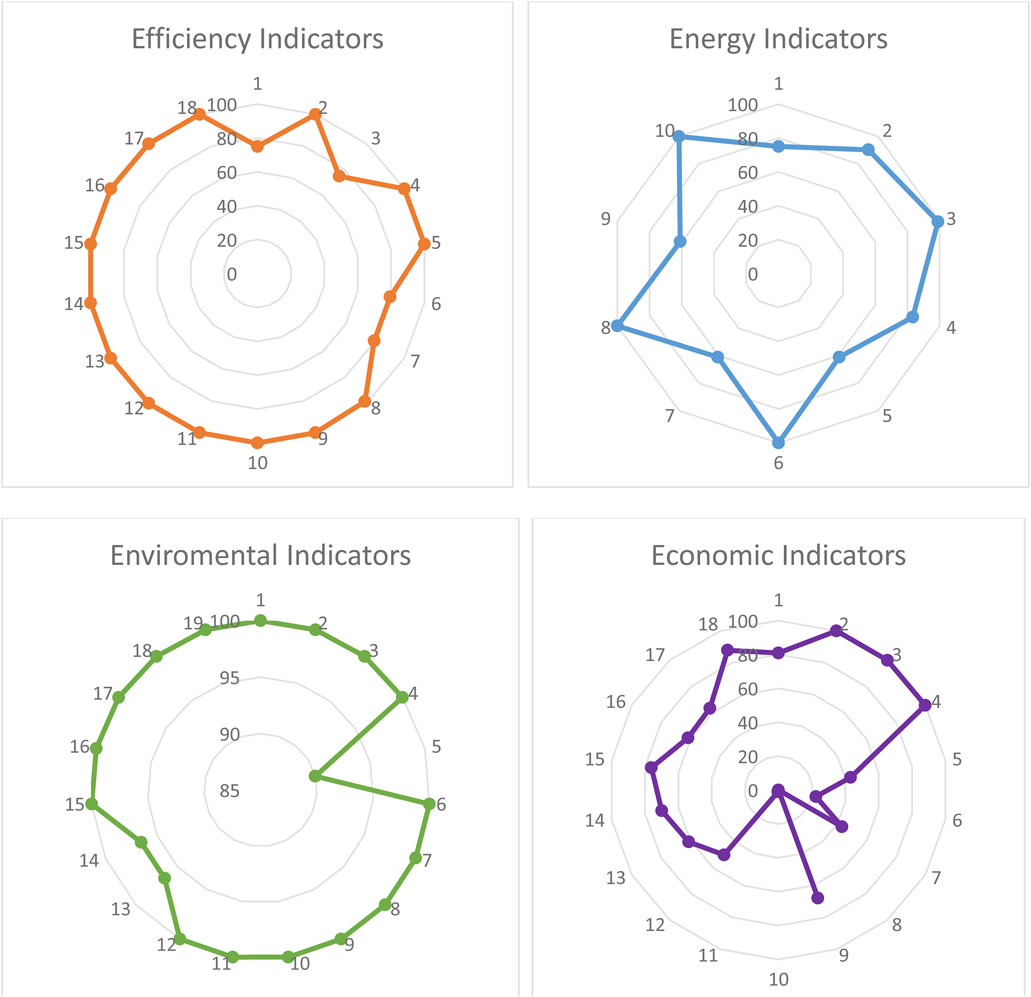
Figure 10. Sustainability assessment for the integration of PEM, RO/UF, and a renewable energy source.
The primary significance of this study is to suggest an integrated method that mitigates adverse environmental impacts, including global warming. The attainment of these environmental impact minimization goals should start from the process input, such as considering the nature of the raw material and energy sources. Figure 10 illustrates that the suggested process integration achieves an average environmental efficiency of 98.34% through the utilization of renewable energy sources. Utilizing grid-based energy in the process diminishes the average environmental efficiency to 62.59% due to its significant global warming potential.
The demand for energy significantly impacts the sustainability performance of a chemical process or equipment, as shown in overall product costs, energy goods and services, and heat emissions. Like other indicators of process sustainability, energy indicators must be scientifically valid, easily calculable, and consistent, as the computation of thermodynamic characteristics relies on many data and reference states that should be accessible, particularly for novel chemical processes. The average energy sustainability is 83.06% due to an exergy efficiency of roughly 61%.
Enhancing PEM efficiency can augment the average energy sustainability. Improving the efficiency of PEM electrolyzers is essential to reducing the cost of green hydrogen and expanding its role in the energy transition. Key strategies and technologies such as advanced catalyst materials, improved membrane materials, enhanced electrode structures, optimized operating conditions, innovative system designs and integrating artificial intelligence and machine learning are implemented to enhance their efficiency. Catalysts are crucial for improving reaction kinetics in PEM electrolyzers. Current advancements focus on iridium-based catalysts, non-noble metal catalysts and core-shell structures (Carmo et al., 2013). Membrane properties significantly influence the efficiency and durability of PEM electrolyzers. Advances in perfluorosulfonic acid (PFSA) membranes have improved proton conductivity while maintaining mechanical and chemical stability. Hybrid structures combining PFSA with additives such as inorganic oxides enhance conductivity, reduce gas crossover, and improve thermal stability. Efficient electrode design improves the utilization of catalyst materials and facilitates better mass transport. Catalyst-coated membranes (CCMs) and porous transport layers (PTLs) are primary focal points (Haider et al., 2021). Improvements in system-level design, including modular systems and system heat recovery, enhance the overall efficiency and scalability of PEM electrolyzers (Lange et al., 2024). AI tools are increasingly being used to optimize PEM electrolyzer performance: Predictive maintenance analyzes operational data to predict and prevent failures and machine learning models identify optimal operating conditions to minimize energy consumption (Lange et al., 2024).
Finally, modifying operational parameters to optimize efficiency while ensuring durability involves dynamic operation and elevated operating temperatures. Especially, optimizing its operational temperature and integrating waste heat recovery are crucial for improving its efficiency and overall system performance. The operational temperature of PEM electrolyzers has an effect on reaction kinetics and membrane conductivity. Higher temperatures improve reaction kinetics by reducing activation energy barriers for the hydrogen evolution reaction (HER) and oxygen evolution reaction (OER). This leads to increased electrochemical performance and lower overpotentials. Proton conductivity of the PEM increases with temperature, reducing ohmic losses. However, excessive temperatures can degrade the membrane and other components, such as the catalyst layer and gas diffusion layers. PEM electrolyzers typically operate within a range of 50°C–80°C. Balancing temperature within this range ensures enhanced performance without compromising the durability of components. However, Future research focuses on developing high-temperature membranes that operate efficiently above 80°C, enhancing the potential for waste heat utilization. Advanced thermal management systems using sensors and controllers are deployed to maintain optimal operating temperatures and minimize fluctuations during variable power inputs, especially when integrated with renewable energy sources (Lange et al., 2024; Mao et al., 2024). PEM electrolyzers generate waste heat during operation, which can be recovered and utilized to improve overall energy efficiency. Electrochemical reactions in the cell produce heat as a byproduct and heat losses occur through electrical resistance in the membrane, electrodes, and external circuitry. Waste heat can be used to preheat the feedwater for electrolysis, reducing the energy required to reach operational temperatures. Heat recovery techniques such as heat exchangers and thermal storage systems can be used. Heat exchangers transfer waste heat from the electrolyzer stack or coolant systems to a secondary process. Captured heat can be stored in phase-change materials or insulated tanks for later use, enabling more flexible operation (Carmo et al., 2013; Chen Y. et al., 2023).
Nevertheless, the most challenging aspect of the proposed integrated process is the economic factor due to having high production costs (the current estimate for the cost of producing hydrogen via electrolysis is between $5 and $6 per kilogram). To achieve cost parity with steam methane reforming (SMR) at all capacities involves lowering the cost of hydrogen production via electrolysis to between $2.08 and $2.27 per kg. We need to further study profitability analysis for green hydrogen production from wastewater at varying scale that considers the generated income from oxygen production as well as other costs such infrastructure, conditioning and storage. Such detailed study can quantify the actual production cost of green hydrogen for the integrated system. Currently, the average economic sustainability of the process is approximately 57%. Reducing the production cost to $2.08 and $2.27 per kg can enhances sustainability to approximately 89.65%.
5 Conclusion
This study highlights the potential of an integrated system combining electrolysis, water treatment, and renewable energy sources, such as solar power, to produce sustainable green hydrogen. Through a comparative analysis of eight scenarios involving different combinations of water treatment technologies and energy inputs, the research demonstrates the following results:
5.1 Capital and Operational Costs
a) CSP scenarios show the highest CAPEX, approximately 4 times higher than PV cases.
b) PV cases have higher OPEX, though the type of water treatment has little impact on CAPEX and OPEX.
c) Grid-based electricity scenarios have the lowest capital investment ($110million), while CSP scenarios have the highest ($750 million)
5.2 Sustainability Indicators
a) The integrated process achieved high average material efficiency (94.87%) and high average environmental efficiency (98.34%) when using renewable energy, as opposed to lower environmental efficiency when using grid electricity(62.59%).
b) The system’s average Energy sustainability (83.06%) can be further enhanced by augmenting the PEM efficiency. Additionally, applying waste heat and heat integration to the proposed system (water treatment-solar energy-PEM) can enhance its energy sustainability performance.
c) Renewable energy sources such as PV, solar tower (ST), and parabolic trough collector (PTC) reduce CO2 emissions by approximately 88% compared to national grid.
5.3 Economic Challenges
a) Hydrogen production via electrolysis currently costs $5 to $6 per kg, which is higher than SMR.
b) The process’s average economic sustainability stands at 57% but could rise to 90% if hydrogen production costs are lowered to $2.08-$2.27 per kg.
These findings emphasize the need for further research to improve efficiency and reduce the costs of the integrated system. With advancements in technology, green hydrogen can be a cornerstone in the transition toward sustainable energy systems, especially in regions like GCC that are rich in solar energy but limited in fresh water. Also, the conclusions highlight that although the integration of PEM electrolyzers, solar energy, and wastewater systems presents significant opportunities for clean energy and resource recovery, the scalability of each technology constrains the validity of the findings. The results and conclusions are valid for specific ranges of scale and may not be generalized to very small or very large systems without further optimization studies.
Data availability statement
The original contributions presented in the study are included in the article/Supplementary Material, further inquiries can be directed to the corresponding author.
Author contributions
AB: Conceptualization, Data curation, Formal Analysis, Investigation, Methodology, Validation, Visualization, Writing – original draft, Writing – review and editing. SK: Conceptualization, Data curation, Formal Analysis, Investigation, Methodology, Supervision, Validation, Visualization, Writing – original draft, Writing – review and editing. FE: Conceptualization, Data curation, Formal Analysis, Funding acquisition, Investigation, Methodology, Project administration, Resources, Software, Supervision, Validation, Visualization, Writing – original draft, Writing – review and editing.
Funding
The author(s) declare that financial support was received for the research and/or publication of this article. The authors acknowledge the paper was made possible by grant QUHI-CENG-22/23–465 from Qatar University. The statements made herein are solely the responsibility of the author[s]. Open Access funding provided by the Qatar National Library.
Conflict of interest
The authors declare that the research was conducted in the absence of any commercial or financial relationships that could be construed as a potential conflict of interest.
The author(s) declared that they were an editorial board member of Frontiers, at the time of submission. This had no impact on the peer review process and the final decision.
Generative AI statement
The author(s) declare that no Generative AI was used in the creation of this manuscript.
Publisher’s note
All claims expressed in this article are solely those of the authors and do not necessarily represent those of their affiliated organizations, or those of the publisher, the editors and the reviewers. Any product that may be evaluated in this article, or claim that may be made by its manufacturer, is not guaranteed or endorsed by the publisher.
Supplementary material
The Supplementary Material for this article can be found online at: https://www.frontiersin.org/articles/10.3389/fceng.2025.1526331/full#supplementary-material
References
Abas, N., Rauf, S., Saleem, M. S., Irfan, M., and Hameed, S. A. (2022). Techno-economic feasibility analysis of 100 MW solar photovoltaic power plant in Pakistan. Technol. Econ. Smart Grids Sustain. Energy 7 (1), 16. doi:10.1007/s40866-022-00139-w
Abdeladim, K., Bouchakour, S., Arab, A. H., Amrouche, S. O., and Yassaa, N. (2018). Promotion of renewable energy in some MENA region countries. IOP Conf. Ser. Earth Environ. Sci. 154, 012003. doi:10.1088/1755-1315/154/1/012003
Aghahosseini, A., Bogdanov, D., and Breyer, C. (2020). Towards sustainable development in the MENA region: analysing the feasibility of a 100% renewable electricity system in 2030. Energy Strategy Rev. 28, 100466. doi:10.1016/j.esr.2020.100466
Al Ghamdi, A., and Mustafa, I. (2022). Exergy analysis of a seawater reverse osmosis plant in Jeddah, Saudi Arabia. Desalination Water Treat. 264, 1–11. doi:10.5004/dwt.2022.28595
Althuwaini, Y. E. Y. Y. E., and Philbin, S. P. (2021). Techno-economic analysis of solar power plants in Kuwait: modelling the performance of PV and CSP systems. Int. J. Renew. Energy Res. (IJRER) 11 (4), 2009–2024. doi:10.20508/ijrer.v11i4.12525.g8358
Ayers, K., Motz, A., Capuano, C., and Mauger, S. (2024). Advanced electrode manufacturing to enable low cost PEM electrolysis. Prot. Energy Syst. doi:10.2172/2371044
Bamisile, O. O., Dagbasi, M., and Abbasoglu, S. (2019). Energy and exergy analyses of a novel solar PTC assisted multi-generation system. Int. J. Exergy 28 (2), 158–182. doi:10.1504/ijex.2019.097978
Bellotti, D., Sorce, A., Rivarolo, M., and Magistri, L. (2019). Techno-economic analysis for the integration of a power to fuel system with a CCS coal power plant. J. CO2 Util. 33, 262–272. doi:10.1016/j.jcou.2019.05.019
Bonanno, M., Müller, K., Bensmann, B., Hanke-Rauschenbach, R., Aili, D., Franken, T., et al. (2024). Review and prospects of PEM water electrolysis at elevated temperature operation. Adv. Mater. Technol. 9 (2), 2300281. doi:10.1002/admt.202300281
Capuano, C., Ayers, K. E., Manco, J., Errico, S., Keane, A., and Wiles, L. (2021). “Manufacturing challenges, opportunities, and successes for PEM electrolysis at scale.” in Electrochemical society meeting abstracts 240 41 1260. (The Electrochemical Society, Inc.)
Carmo, M., Fritz, D. L., Mergel, J., and Stolten, D. (2013). A comprehensive review on PEM water electrolysis. Int. J. hydrogen energy 38 (12), 4901–4934. doi:10.1016/j.ijhydene.2013.01.151
Castro, M., Alcanzare, M., Esparcia, J., E., and Ocon, J. (2020). A comparative techno-economic analysis of different desalination technologies in off-grid islands. Energies 13 (9), 2261. doi:10.3390/en13092261
Chen, X., Pang, Z., Zhang, M., Jiang, S., Feng, J., and Shen, B. (2023). Techno-economic study of a 100-MW-class multi-energy vehicle charging/refueling station: using 100% renewable, liquid hydrogen, and superconductor technologies. Energy Convers. Manag. 276, 116463. doi:10.1016/j.enconman.2022.116463
Chen, Y., Liu, C., Xu, J., Xia, C., Wang, P., Xia, B. Y., et al. (2023). Key components and design strategy for a proton exchange membrane water electrolyzer. Small Struct. 4 (6), 2200130. doi:10.1002/sstr.202200130
Chitsaz, A., Haghghi, M. A., and Hosseinpour, J. (2019). Thermodynamic and exergoeconomic analyses of a proton exchange membrane fuel cell (PEMFC) system and the feasibility evaluation of integrating with a proton exchange membrane electrolyzer (PEME). Energy Convers. Manag. 186, 487–499. doi:10.1016/j.enconman.2019.03.004
Colella, W. G., James, B. D., Moton, J. M., Saur, G., and Ramsden, T. (2014). “Techno-economic analysis of PEM electrolysis for hydrogen production,” in Electrolytic hydrogen production workshop (Golden, CO: NREL), 27.
Delpisheh, M., Haghghi, M. A., Athari, H., and Mehrpooya, M. (2021). Desalinated water and hydrogen generation from seawater via a desalination unit and a low temperature electrolysis using a novel solar-based setup. Int. J. hydrogen energy 46 (10), 7211–7229. doi:10.1016/j.ijhydene.2020.11.215
Echevarría, C., Pastur, M., Valderrama, C., Cortina, J. L., Vega, A., Mesa, C., et al. (2022). Techno-economic assessment of decentralized polishing schemes for municipal water reclamation and reuse in the industrial sector in costal semiarid regions: the case of Barcelona (Spain). Sci. Total Environ. 815, 152842. doi:10.1016/j.scitotenv.2021.152842
Elfaqih, A. K., and Belhaj, S. O. (2021). “Economic evaluation of SWRO desalination plants using ERD powered by Off-Grid PV system,” in 2021 IEEE 1st International Maghreb Meeting of the Conference on Sciences and Techniques of Automatic Control and Computer Engineering MI-STA (IEEE), 458–462.
Elfeky, K. E., and Wang, Q. (2023). Techno-economic assessment and optimization of the performance of solar power tower plant in Egypt's climate conditions. Energy Convers. Manag. 280, 116829. doi:10.1016/j.enconman.2023.116829
El Mansouri, A., Hasnaoui, M., Amahmid, A., and Hasnaoui, S. (2020). Feasibility analysis of reverse osmosis desalination driven by a solar pond in Mediterranean and semi-arid climates. Energy Convers. Manag. 221, 113190. doi:10.1016/j.enconman.2020.113190
Escobar-Yonoff, R., Maestre-Cambronel, D., Charry, S., Rincón-Montenegro, A., and Portnoy, I. (2021). Performance assessment and economic perspectives of integrated PEM fuel cell and PEM electrolyzer for electric power generation. Heliyon 7 (3), e06506. doi:10.1016/j.heliyon.2021.e06506
Fellaou, S., Ruiz-Garcia, A., and Gourich, B. (2021). Enhanced exergy analysis of a full-scale brackish water reverse osmosis desalination plant. Desalination 506, 114999. doi:10.1016/j.desal.2021.114999
Ghazouani, M., Bouya, M., and Benaissa, M. (2020). Thermo-economic and exergy analysis and optimization of small PTC collectors for solar heat integration in industrial processes. Renew. Energy 152, 984–998. doi:10.1016/j.renene.2020.01.109
Ginsberg, M., Zhang, Z., Atia, A. A., Venkatraman, M., Esposito, D. V., and Fthenakis, V. M. (2022). Integrating solar energy, desalination, and electrolysis. Sol. Rrl 6 (5), 2100732. doi:10.1002/solr.202100732
Gonzalez, M. A., and Smith, R. L. (2003). A methodology to evaluate process sustainability. Environ. Prog. 22 (4), 269–276. doi:10.1002/ep.670220415
Gonzalez-Camejo, J., Morales, A., Peña-Lamas, J., Lafita, C., Enguídanos, S., Seco, A., et al. (2023). Feasibility of rapid gravity filtration and membrane ultrafiltration for the removal of microplastics and microlitter in sewage and wastewater from plastic industry. J. Water Process Eng. 51, 103452. doi:10.1016/j.jwpe.2022.103452
Greiml, M., Fritz, F., and Kienberger, T. (2021). Increasing installable photovoltaic power by implementing power-to-gas as electricity grid relief–A techno-economic assessment. Energy 235, 121307. doi:10.1016/j.energy.2021.121307
Guerra, O. J., Eichman, J., Kurtz, J., and Hodge, B. M. (2019). Cost competitiveness of electrolytic hydrogen. Joule 3 (10), 2425–2443. doi:10.1016/j.joule.2019.07.006
Haider, R., Wen, Y., Ma, Z. F., Wilkinson, D. P., Zhang, L., Yuan, X., et al. (2021). High temperature proton exchange membrane fuel cells: progress in advanced materials and key technologies. Chem. Soc. Rev. 50 (2), 1138–1187. doi:10.1039/d0cs00296h
Hardisty, P. E., Clark, T. S., and Hynes, R. G. (2012). Life cycle greenhouse gas emissions from electricity generation: a comparative analysis of Australian energy sources. Energies 5 (4), 872–897. doi:10.3390/en5040872
Hassan, N. S., Jalil, A. A., Rajendran, S., Khusnun, N. F., Bahari, M. B., Johari, A., et al. (2024). Recent review and evaluation of green hydrogen production via water electrolysis for a sustainable and clean energy society. Int. J. Hydrogen Energy 52, 420–441. doi:10.1016/j.ijhydene.2023.09.068
He, C., Fang, K., Wang, W., Wang, Q., Luo, J., Ma, J., et al. (2022). Techno-economic feasibility of “membrane-based pre-concentration+ post-treatment” systems for municipal wastewater treatment and resource recovery. J. Clean. Prod. 375, 134113. doi:10.1016/j.jclepro.2022.134113
He, C., Liu, Z., Wu, J., Pan, X., Fang, Z., Li, J., et al. (2021). Future global urban water scarcity and potential solutions. Nat. Commun. 12 (1), 4667. doi:10.1038/s41467-021-25026-3
IEA (2024). Global hydrogen review 2024. Paris: IEA. Available online at: https://www.iea.org/reports/global-hydrogen-review-2024.
Iglesias, R., Simón, P., Moragas, L., Arce, A., and Rodriguez-Roda, I. (2017). Cost comparison of full-scale water reclamation technologies with an emphasis on membrane bioreactors. Water Sci. Technol. 75 (11), 2562–2570. doi:10.2166/wst.2017.132
Incer-Valverde, J., Mörsdorf, J., Morosuk, T., and Tsatsaronis, G. (2023). Power-to-liquid hydrogen: exergy-based evaluation of a large-scale system. Int. J. Hydrogen Energy 48 (31), 11612–11627. doi:10.1016/j.ijhydene.2021.09.026
Kamal, A., Al-Ghamdi, S. G., and Koç, M. (2021). Assessing the impact of water efficiency policies on Qatar’s electricity and water sectors. Energies 14 (14), 4348. doi:10.3390/en14144348
Karagoz, S. (2018). Multi-scale modeling and simulation of intensified reactive-separation processes for hydrogen production and CO2 capture via the water-gas shift reaction (WGSR). Los Angeles: University of California.
Karagöz, S. (2023). A methodological sustainability assessment to process intensification (MSAtoPI) by reactive-separation systems. Fuel 348, 128562. doi:10.1016/j.fuel.2023.128562
Karagöz, S., da Cruz, F. E., Tsotsis, T. T., and Manousiouthakis, V. I. (2018). Multi-scale membrane reactor (MR) modeling and simulation for the water gas shift reaction. Chem. Eng. Processing-Process Intensif. 133, 245–262. doi:10.1016/j.cep.2018.09.012
Karagöz, S., Tsotsis, T. T., and Manousiouthakis, V. I. (2019). Multi-scale modeling and simulation of a novel membrane reactor (MR)/adsorptive reactor (AR) process. Chem. Eng. Processing-Process Intensif. 137, 148–158. doi:10.1016/j.cep.2019.01.012
Kuczynski, W., and Chliszcz, K. (2023). Energy and exergy analysis of photovoltaic panels in northern Poland. Renew. Sustain. Energy Rev. 174, 113138. doi:10.1016/j.rser.2022.113138
Kumar, A., Sharma, M., Thakur, P., Thakur, V. K., Rahatekar, S. S., and Kumar, R. (2020). A review on exergy analysis of solar parabolic collectors. Sol. Energy 197, 411–432. doi:10.1016/j.solener.2020.01.025
Kumar, S. S., and Lim, H. (2022). An overview of water electrolysis technologies for green hydrogen production. Energy Rep. 8, 13793–13813. doi:10.1016/j.egyr.2022.10.127
Kupcu, Y., Ince, M., and Bayramoglu, M. (2023). Exergy analysis of purified water plant in a pharmaceutical industry. Int. J. Exergy 40 (1), 34–43. doi:10.1504/ijex.2023.128520
Lahlou, F. Z., Mackey, H. R., McKay, G., Onwusogh, U., and Al-Ansari, T. (2020). Water planning framework for alfalfa fields using treated wastewater fertigation in Qatar: an energy-water-food nexus approach. Comput. and Chem. Eng. 141, 106999. doi:10.1016/j.compchemeng.2020.106999
Lange, H., Klose, A., Beisswenger, L., Erdmann, D., and Urbas, L. (2024). Modularization approach for large-scale electrolysis systems: a review. Sustain. Energy and Fuels 8, 1208–1224. doi:10.1039/d3se01588b
Lee, J. M., Lee, S. H., Baik, J. H., and Park, K. (2022). Techno-economic analysis of hydrogen production electrically coupled to a hybrid desalination process. Desalination 539, 115949. doi:10.1016/j.desal.2022.115949
Liaqat, K., Ordonez, J. C., Schaefer, L., and Zolan, A. J. (2023). “Design and techno-economic analysis of a 150-MW hybrid CSP-PV plant,” in 2023 IEEE Conference on Technologies for Sustainability (IEEE), 218–224. doi:10.1109/sustech57309.2023.10129553
Liu, T., Yang, J., Yang, Z., and Duan, Y. (2022). Techno-economic feasibility of solar power plants considering PV/CSP with electrical/thermal energy storage system. Energy Convers. Manag. 255, 115308. doi:10.1016/j.enconman.2022.115308
Luo, L., Cristofari, C., and Levrey, S. (2023). Cogeneration: another way to increase energy efficiency of hybrid renewable energy hydrogen chain–A review of systems operating in cogeneration and of the energy efficiency assessment through exergy analysis. J. Energy Storage 66, 107433. doi:10.1016/j.est.2023.107433
Mao, J., Li, Z., Xuan, J., Du, X., Ni, M., and Xing, L. (2024). A review of control strategies for proton exchange membrane (PEM) fuel cells and water electrolysers: from automation to autonomy. Energy AI 17, 100406. doi:10.1016/j.egyai.2024.100406
Nguyen, T., Abdin, Z., Holm, T., and Mérida, W. (2019). Grid-connected hydrogen production via large-scale water electrolysis. Energy Convers. Manag. 200, 112108. doi:10.1016/j.enconman.2019.112108
Ni, M., Leung, M. K., and Leung, D. Y. (2008). Energy and exergy analysis of hydrogen production by a proton exchange membrane (PEM) electrolyzer plant. Energy Convers. Manag. 49 (10), 2748–2756. doi:10.1016/j.enconman.2008.03.018
Nizami, M., and Purwanto, W. W. (2022). Solar PV based power-to-methanol via direct CO2 hydrogenation and H2O electrolysis: techno-economic and environmental assessment. J. CO2 Util. 65, 102253. doi:10.1016/j.jcou.2022.102253
Nosratabadi, S. M., Hemmati, R., Bornapour, M., and Abdollahpour, M. (2021). Economic evaluation and energy/exergy analysis of PV/Wind/PEMFC energy resources employment based on capacity, type of source and government incentive policies: case study in Iran. Sustain. Energy Technol. Assessments 43, 100963. doi:10.1016/j.seta.2020.100963
Orangzeb, S., Qaisrani, M. A., Shafiq, M. B., Ahmed, N., Sahar, M. S. U., Ullah, S., et al. (2023). Potential assessment and economic analysis of concentrated solar power against solar photovoltaic technology. Int. J. Energy Res. 2023 (1), 1–26. doi:10.1155/2023/3611318
Pandey, A. K., Kumar, R. R., Kalidasan, B., Laghari, I. A., Samykano, M., Kothari, R., et al. (2021). Utilization of solar energy for wastewater treatment: challenges and progressive research trends. J. Environ. Manag. 297, 113300. doi:10.1016/j.jenvman.2021.113300
Park, S., Choi, K., Lee, C., Kim, S., Yoo, Y., and Chang, D. (2021). Techno-economic analysis of adiabatic four-stage CO2 methanation process for optimization and evaluation of power-to-gas technology. Int. J. Hydrogen Energy 46 (41), 21303–21317. doi:10.1016/j.ijhydene.2021.04.015
Peng, J., Lu, L., and Yang, H. (2013). Review on life cycle assessment of energy payback and greenhouse gas emission of solar photovoltaic systems. Renew. Sustain. energy Rev. 19, 255–274. doi:10.1016/j.rser.2012.11.035
Pérez García, G., Gómez Rodríguez, P. M., Ortiz Uribe, I., and Urtiaga Mendia, A. M. (2022). Techno-economic assessment of a membrane-based wastewater reclamation process.
Pfennig, M., Schiffer, B., and Clees, T. (2024). Thermodynamical and electrochemical model of a PEM electrolyzer plant in the megawatt range with a literature analysis of the fitting parameters. Int. J. Hydrogen Energy 104, 567–583. doi:10.1016/j.ijhydene.2024.04.335
Pichardo, P. A., Karagöz, S., Manousiouthakis, V. I., Tsotsis, T., and Ciora, R. (2019). Techno-economic analysis of an intensified integrated gasification combined cycle (IGCC) power plant featuring a combined membrane reactor-adsorptive reactor (MR-AR) system. Industrial and Eng. Chem. Res. 59 (6), 2430–2440. doi:10.1021/acs.iecr.9b02027
Praveenkumar, S., Agyekum, E. B., Kumar, A., Ampah, J. D., Afrane, S., Amjad, F., et al. (2022). Techno-economics and the identification of environmental barriers to the development of concentrated solar thermal power plants in India. Appl. Sci. 12 (20), 10400. doi:10.3390/app122010400
Qureshi, A. S. (2020). Challenges and prospects of using treated wastewater to manage water scarcity crises in the Gulf Cooperation Council (GCC) countries. Water 12 (7), 1971. doi:10.3390/w12071971
Razi, F., and Dincer, I. (2022). Renewable energy development and hydrogen economy in MENA region: a review. Renew. Sustain. Energy Rev. 168, 112763. doi:10.1016/j.rser.2022.112763
Saloux, E., Teyssedou, A., and Sorin, M. (2013). Analysis of photovoltaic (PV) and photovoltaic/thermal (PV/T) systems using the exergy method. Energy Build. 67, 275–285. doi:10.1016/j.enbuild.2013.08.012
Shahabuddin, M., Alim, M. A., Alam, T., Mofijur, M., Ahmed, S. F., and Perkins, G. (2021). A critical review on the development and challenges of concentrated solar power technologies. Sustain. Energy Technol. Assessments 47, 101434. doi:10.1016/j.seta.2021.101434
Sin, P. S., Wai, S., Ota, Y., Nishioka, K., and Suzuki, Y. (2024). Performance recovery of proton exchange membrane electrolyzer degraded by metal cations contamination. Int. J. Hydrogen Energy 53, 86–92. doi:10.1016/j.ijhydene.2023.12.049
Timilsina, G. R. (2021). Are renewable energy technologies cost competitive for electricity generation? Renew. Energy 180, 658–672. doi:10.1016/j.renene.2021.08.088
T. International Renewable Energy Agency (2020). GREEN HYDROGEN COST REDUCTION SCALING UP ELECTROLYSERS TO MEET THE 1.5°C CLIMATE GOAL H 2 O 2. Available online at: www.irena.org/publications.
Wang, J., Wen, J., Wang, J., Yang, B., and Jiang, L. (2024). Water electrolyzer operation scheduling for green hydrogen production: a review. Renew. Sustain. Energy Rev. 203, 114779. doi:10.1016/j.rser.2024.114779
Wang, Q., Pei, G., and Yang, H. (2021). Techno-economic assessment of performance-enhanced parabolic trough receiver in concentrated solar power plants. Renew. Energy 167, 629–643. doi:10.1016/j.renene.2020.11.132
Wang, T., Cao, X., and Jiao, L. (2022). PEM water electrolysis for hydrogen production: fundamentals, advances, and prospects. Carbon Neutrality 1 (1), 21. doi:10.1007/s43979-022-00022-8
Zhang Xiang, Z. X., Chen NengCheng, C. N., Sheng Hao, S. H., Ip, C., Yang Long, Y. L., Chen YiQun, C. Y., et al. (2019). Urban drought challenge to 2030 sustainable development goals. Sci. Total Environ. 693, 133536. doi:10.1016/j.scitotenv.2019.07.342
Zhou, H., Meng, K., Chen, W., and Chen, B. (2022). 3D two-phase and non-isothermal modeling for PEM water electrolyzer: heat and mass transfer characteristic investigation. Int. J. Energy Res. 46 (12), 17126–17143. doi:10.1002/er.8375
Keywords: sustainable hydrogen, solar energy, water treatment, PEM electrolyzer, green hydrogen
Citation: Badruzzaman A, Karagoz S and Eljack F (2025) Sustainable-green hydrogen production through integrating electrolysis, water treatment and solar energy. Front. Chem. Eng. 7:1526331. doi: 10.3389/fceng.2025.1526331
Received: 11 November 2024; Accepted: 24 June 2025;
Published: 21 July 2025.
Edited by:
Yusuf Bicer, Hamad bin Khalifa University, QatarReviewed by:
Elnaz Sohani, University of Nottingham, United KingdomHassan Ouabi, Université Hassan II de Casablanca, Morocco
Burin Yodwong, King Mongkut’s University of Technology North Bangkok, Thailand
Copyright © 2025 Badruzzaman, Karagoz and Eljack. This is an open-access article distributed under the terms of the Creative Commons Attribution License (CC BY). The use, distribution or reproduction in other forums is permitted, provided the original author(s) and the copyright owner(s) are credited and that the original publication in this journal is cited, in accordance with accepted academic practice. No use, distribution or reproduction is permitted which does not comply with these terms.
*Correspondence: Seckin Karagoz, c2thcmFnb3pAcXUuZWR1LnFh