 Ankur Kapil
 Claire Wombwell2
 Laurel L. Kegel
 Michael D. Hamlin
- 1Veranova, Devens, MA, United States
- 2Veranova, Cambridge, United Kingdom
Spray drying efficiently generates fine, dried powders used in the pharmaceutical, food, and chemical industries. However, industry-wide challenges in optimization and scale-up of spray drying processes require further research due to the large number of interacting parameters that impact product yield and particle characteristics. The work presented herein demonstrates a novel, model-aided workflow to optimize yield and transfer the spray-drying process to different equipment and scales that would otherwise demand large experimental costs. This study achieves a comprehensive understanding of spray drying dynamics through a hybrid modeling approach that utilizes a commercial mechanistic model (gFormulate®) to capture critical process parameters and integrates it with modified open-source computational fluid dynamics software (OpenFOAM©). Modelling the age of droplets using OpenFoam® provided deeper insights into residence time and wall interactions. This study highlights the significance of droplet age modelling on moisture content and wall agglomeration. Additionally, this work addresses the challenge of sticky materials adhering to the equipment wall. Case studies presented here demonstrate how this combined approach improves tech transfer and scale-up for spray drying processes from lab to manufacturing scales, reduces experimental effort, and mitigates potential risks such as wall adhesion and low yield. Optimized yields of 61%–89% for a sticky product were achieved for 5–400 g with suitable dryness (1%–5% residual solvent). The workflow enabled up to an 80% increase in yield and was applied to complex situations at all scales (lab to production) with minimal experimentation.
Introduction
Spray drying technologies offer promising particle engineering solutions to widespread development issues in diverse industries. In pharmaceutical production, inadequate bioavailability and solubility currently affect over 40% of new chemical entities (NCEs) on the market (Price and Patel, 2022; Savjani et al., 2012). Spray drying can improve these issues for solid-dosage drugs through amorphous solid dispersion and forming fine powders as well as efficiently drying the product and controlling particle size. The spray drying process may also incorporate drug encapsulation, targeted delivery characteristics, and/or formulation combinations (Arpagaus et al., 2018; Marante et al., 2020). Further discussion of these characteristic controls is provided in the Supporting Information. Each application must undergo careful consideration of the specific formulation and process parameters to optimize the desired bioavailability-enhancing effects. However, the process is challenging to optimize and scale up due to the properties of some challenging materials and the high number of parameters. The work presented herein aims to investigate these parameters holistically and efficiently and demonstrate a novel model-aided workflow for an otherwise inefficient development process by purely heuristic approaches.
This study presents the development of a critical information pathway from hybrid mechanistic and computational fluid dynamics (CFD) modelling with experimental verification of challenging material. The material exhibits several complicating factors and serves as a case study to demonstrate the model-aided process development. The workflow was developed to comprehensively understand spray drying conditions and the resulting yield using two primary software platforms: 1) a commercial mechanistic model (gFormulate®) with customized inputs for three different spray dryers and 2) an open-source computational fluid dynamics (CFD) model (OpenFOAM©) with modifications for spray drying. Mechanistic models provide a robust framework for simulating key process variables such as heat and mass transfer, droplet drying rates, and particle morphology. Complementarily, CFD offers detailed insights into the dynamic airflow patterns, temperature distributions, and droplet trajectories within the drying chamber. The OpenFoam© model is based on Diesel spray in aachenBom and was modified to model spray dryer gas flow and liquid droplet interactions.
The general spray drying process produces dried powder by dispersing a solution of the target substance(s) into a chamber with heated gas flow. The feed solution for active pharmaceutical ingredients (APIs) or drug substances generally consists of the target substance, solvent, and if applicable, a co-dispersion material. Generally, organic solvent is used for API dissolution. A polymer may be used for co-dispersion and amorphous solid dispersion stabilization. The solution is passed through a nozzle to atomize it into fine droplet sizes. Spray droplets (5–100 μm) are produced by atomization and flowed through the chamber with hot drying gas thereby producing particles with low solvent content at the dryer exit. The outlet from the spray dryer is collected by separation in a cyclone and/or a filter. Then the drying gas is recycled by passing through a condenser that reduces the solvent content prior to re-entering the spray dryer.
Equipment design variations must be considered for process development and scale-up where design components may vary based on efficiencies and cost at scale. Variations to the general equipment include nozzle type and geometry, gas flow pattern, and collection type (cyclone or filter). For example, the diverse nozzle types affect droplet size, spray angle, and spray velocity. Refer to the Supporting Information for more detailed information regarding nozzle design considerations toward droplet size, gas requirements, cost, viscosity capabilities, and homogeneity.
In addition to varying equipment design, the spray drying process has many parameters that render it an inherently multiparameter, multiscale problem. The spray process parameters include drying gas flow rate, droplet size populations, temperature, and nozzle operating conditions that all must be considered to optimize the product yield, residual solvent content, particle size, and particle morphology. The dimension and time scales range over several orders of magnitude: a) The droplets are micron scale, and the equipment is meter scale. b) The overall timescale within the spray dryer is seconds, whereas nozzle droplet formation and skinned droplet formation occur in less than a second. The numerous parameters and scales must be assessed for successful optimization and scale-up. Process development approaches must also consider the desired product characteristics and unique characteristics of input material such as potential stickiness leading to wall yield loss. Wall adherence occurs when droplets contact the chamber walls and stick to the surface instead of being collected as dried particles. Inherently sticky substances may adhere to the wall surface due to high hygroscopicity, high thermoplasticity, and/or low glass transition temperature (Tg). Products with a low Tg may become sticky at temperatures used in spray drying. The temperature where a material forms soft particles with a sticky surface is called the sticky temperature (Tsticky). Tsticky is directly related to the Tg (Tsticky ∼= Tg + 20°C (Du et al., 2014; Muzaffar, 2015)), but is also affected by residual solvent content. Tg and Tsticky are evaluated here for optimizing material interaction with the spray dryer system.
The equipment design and process parameters affect the wall yield loss of sticky substances. Design factors, including the chamber shape, chamber surface, gas flow pattern, and wall coatings or treatments, can all impact the droplet adherence to the walls (Francia et al., 2016a; 2016b; Jubaer et al., 2019). Various operating parameters, such as inlet temperature, drying gas flow rate, and feed flow rate, can affect wall yield loss. For instance, a high gas flow rate or high temperature can cause droplets to forcefully impinge on the walls and increase the likelihood of adherence (Francia et al., 2016a; 2016b; Jubaer et al., 2019). Additionally, the size and distribution of the droplets sprayed into the drying chamber can influence wall yield loss. Smaller droplets and a narrower droplet size distribution are associated with increased wall contact and potential adhesion.
For the sticky material of interest, inefficient yields were optimized using a model-aided approach to achieve acceptable yield and dryness that otherwise may not have been attainable. Spray drying is generally a challenging process to optimize and scale-up and is further complicated when addressing difficult sticky materials. Traditional scale-up process development has been primarily empirical (experiential, one factor at a time (OFAT), or design of experiments (DOE)) which requires a large amount of material and time to fully optimize and understand the spray drying process for difficult materials (Dobry et al., 2009). There have been advances, including one-dimensional (1D), Single Droplet Drying, and computational fluid dynamics (CFD) models, but these have limited use that targets a single product, requires improvements for ease of use, does not involve scale-up, and/or is not experimentally verified (Refer to examples in Table 1). Experimental data, such as droplet size measurements (Boel et al., 2020) and drying kinetics (Putranto et al., 2011), are often used to validate and refine mathematical models, but many studies for spray drying omit experimental verification. For example, Dobry et al. (2009) described a model-aided approach to spray drying process development that addresses scale-up, but does not include experimental verification, direct pharmaceutical application, nor consideration of several factors for a comprehensive approach (drying kinetics, droplet scale equations, droplet agglomeration/coalescence, and wall deposition). The model selection herein is integrated within a clear workflow that leverages measured data input and critical process parameters to inform scalable process optimization in drug substance isolation.
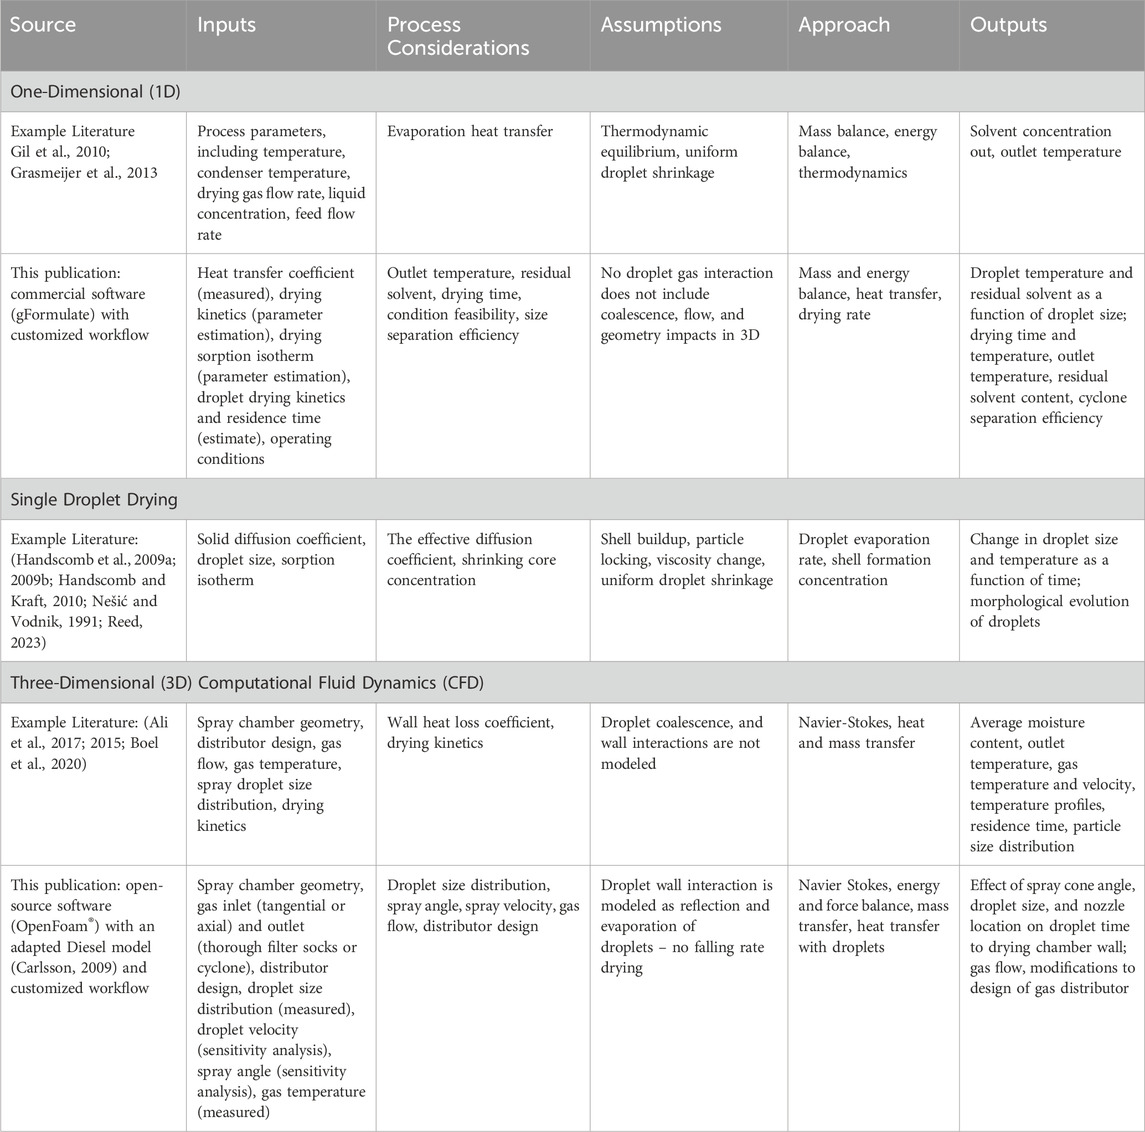
Table 1. Spray drying process model details from precedent examples in literature and this publication.
This study demonstrates an experimentally verified, scalable, holistic, innovative workflow to include mathematical modeling of droplet dynamics for spray drying a sticky product. The workflow enables process development that would otherwise be difficult to reach acceptable yields using standard nozzles and scale-up heuristics. The modeling describes droplet interactions with gas flow and droplet drying based on inputs of operating conditions and droplet size using gPROMS FormulatedProducts© and computational fluid dynamics using OpenFOAM© (Table 1). The mechanistic model in gFormulate considers the drying kinetics and heat loss from the wall. However, it does not consider the droplet residence time distribution, wall deposition, agglomeration, nor coalescence in the spray dryer. These are particularly critical parameters for the target substance produced in this work due to its sticky nature and susceptibility to wall loss. Therefore, to supplement the mechanistic model and understand these critical parameters, CFD models have been developed using OpenFoam© to solve simultaneous heat and mass transfer between the droplets and the drying gas medium. These mathematical models were used to understand and optimize the impact of operating conditions on the product yield across three different scales.
Materials and methods
Spray dryer equipment and sample preparation
The spray drying for this product has been scaled up from 5 g to 400 g using three different equipment types fit with an inert loop and condenser for organic solvents (e.g., acetone) and a thermocouple for measurement of outlet temperature: a) Buchi B-290 b) Procept 4M8Trix c) FluidAir. There are notable differences in each spray dryer, including the scale, gas flow, collection mode, and nozzle (Table 2). The spray drying samples were prepared by dissolution of 5–100 g in acetone to concentrations of 25%–50% w/w.
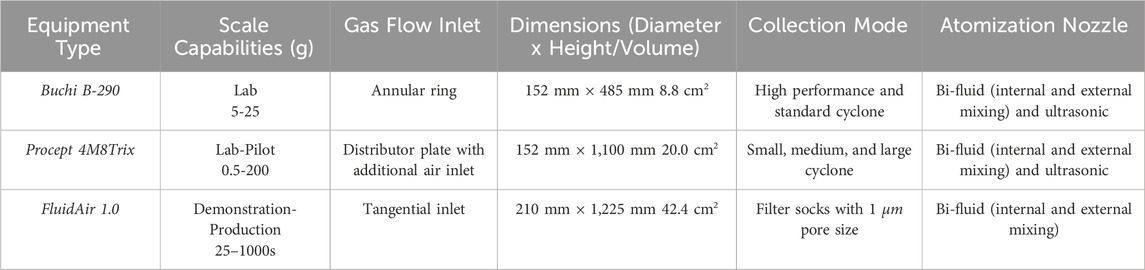
Table 2. Equipment model parameters; Buchi, Procept, FluidAir.
Spray drying process development workflow
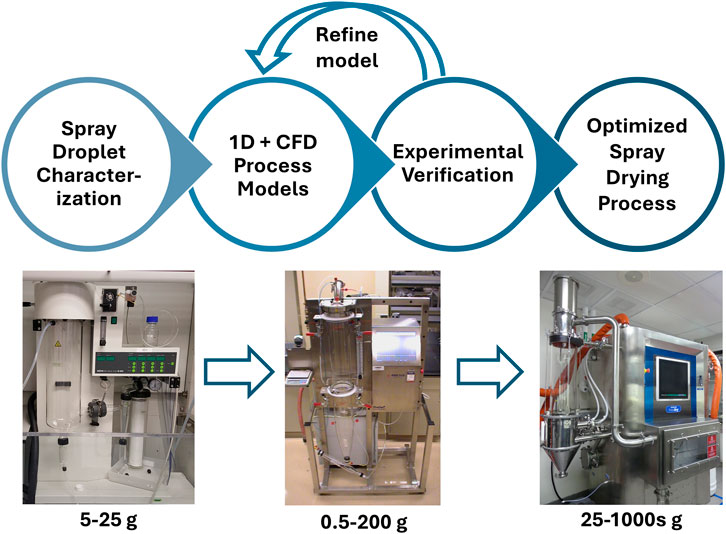
The developed process development workflow as shown in Figure 1 was used to optimize and transfer the spray drying method across scales. This workflow involves multiple experimental and modeling tools which will be discussed in detail in the next sections. A model-aided approach avoids a purely experimental approach that would require an infeasible amount of material and time in complex situations. For spray drying of amorphous dispersions with known material properties, a purely experimental approach to optimization may require only a few experiments. Contrastingly for complex situations, modeling may be used to reduce the experimental design space to a similarly feasible number. A spray dryer experiment requires a few hours including the cleaning time, and with 1000s of condition combinations possible, optimization may require extensive costs. Alternatively, this workflow leverages control of a subset of conditions (droplet size and nozzle angle) to predict the full set of conditions and reduce the required trials. Rapid ex-situ measurement of the droplet size distribution and cone angle for the different operating conditions and nozzle designs were measured outside the spray dryer. Droplet size was measured for 2,278 different combinations of the nozzle, spray angle, and atomization conditions. This data set was used to develop a machine learning model to predict the droplet size for nozzle designs and operating conditions that were not directly measured. However, this is outside the scope of this article and will be presented in a separate article for publication to follow. The droplet size measurements (or predictions from the machine learning model in future work) are used with mechanistic + CFD models to screen conditions and reduce the required experimentation for optimization.
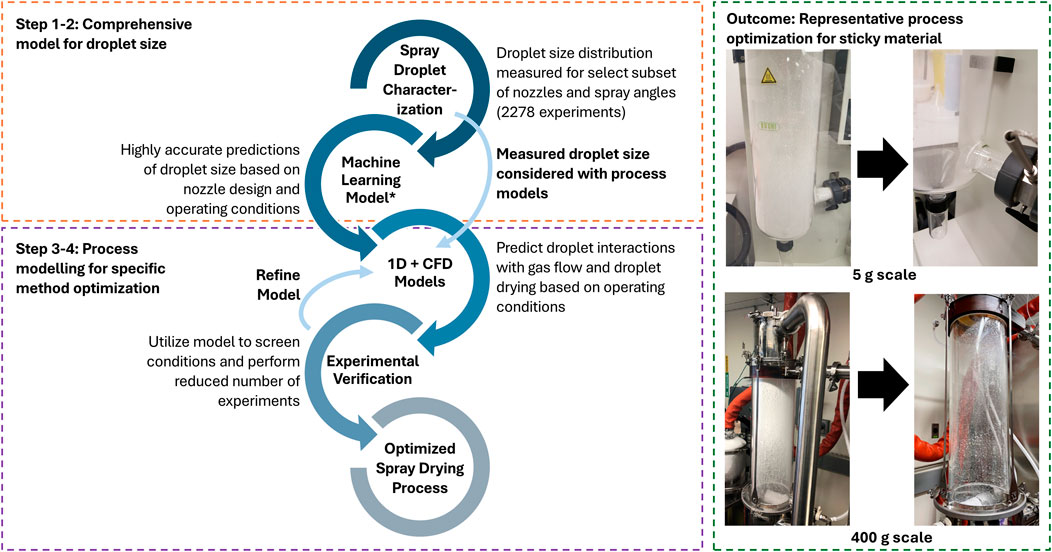
Figure 1. Spray drying process development workflow and representative outcome. 1D + CFD models and experimental verification are specific to the equipment and operating conditions set, but optimized conditions from one set may be transferred to a different set/scale as an initial condition basis. *The machine learning (ML) model option is not used in this work and will be presented in a separate publication.
1D models
1D modeling was developed using gPROMS FormulatedProducts© for spray drying process optimization and scale-up. The detailed equations are provided in the Supporting Information, and the overall workflow is described as follows.
1. Establish material and equipment parameters by measurement or known values: spray dryer chamber volume, chamber surface area, and cyclone dimensions were measured. Droplet size distribution from atomization is measured by laser diffraction as described below. Solid and solvent properties were specified (heat capacity, skeletal density, thermal conductivity, dynamic viscosity, latent heat of vaporization, diffusivity in vapor).
2. 1D Model parameter estimation: System temperatures were measured for parameter estimation. Specifically, the outlet temperature over time for drying gas with different inlet temperature conditions was measured. Wall heat loss values are necessary for the overall heat balance in a spray dryer. The heat transfer coefficient of the spray dryer equipment was estimated from the measured spray dryer outlet temperature vs. time curve at various gas inlet temperatures in the absence of the droplet spray. Sorption isotherms for a given sample and solvent system were estimated by modeling in this case, due to the incompatibility of the dynamic vapor sorption (DVS) instrumentation with acetone. The drying kinetics parameters (critical and equilibrium moisture content) were estimated from the spray drying experiments and are an intrinsic property of the material. Critical and equilibrium moisture content were estimated from the drying rate inflection point where the constant rate changes to a decreasing rate and the point where equilibrium moisture content remains at a constant level.
3. Global sensitivity analysis: Modeling was developed to evaluate the impact of operating conditions such as inlet temperature, drying gas flow rate, and droplet size distribution on the outlet moisture content, i.e., residual solvent content, and outlet temperature.
4. Model transfer between spray dryer equipment types and scale: The equipment-specific heat loss coefficient, dimensions, droplet size distribution, and any necessary change in operating conditions are updated for transfer between various equipment.
5. Droplet Drying Kinetics: The individual droplet drying kinetics (time and moisture content) from detailed droplet flow dynamics obtained from 1D modeling were combined with the time required for droplets to reach the wall from CFD.
CFD models
Additional 3D CFD modeling was required to assess process complexities that are not accessible using gPROMS Formulated Products©. Potential issues, such as wall agglomeration, imbalanced droplet agglomeration, or particle breakage, may be mitigated through modeling of spray and gas flows. A CFD model was developed to model the droplet time to the wall for the spray based on the operating conditions and the nozzle location/angle and type. Opensource tools (OpenFoam©) were used for CFD simulations of the spray dryers. An OpenFoam© tutorial simulation (aachenBomb (Pandian Muthuramalingam, 2016)) was used as a starting point for the Spray Drying, and the OpenFoam© solver for spray evaporation in diesel engines was modified accordingly. The model development included modifications to the following.
1. System geometry
2. Inlet and outlet boundary conditions
3. Removal of reaction terms from the hydrocarbon reaction model
4. Evaporation kinetics
5. Solvent change from hydrocarbon and water to acetone
A three-dimensional multi-phase Lagrangian-Eulerian steady-state CFD model was built in OpenFoam© to predict the droplet drying and fluid dynamics within the spray dryer system. The basic equations governing fluid flow, heat transfer, and mass transfer are defined in the Supporting Information. These equations include the Navier-Stokes equations for fluid flow, energy equations for heat transfer, and species transport equations for mass transfer. The spray is modeled as evaporating Lagrangian droplets. The Lagrangian spray droplets approach can be used to track the individual droplets and their trajectories within the flow field. Evaporation models are employed to predict the drying behavior of the droplets based on their size, temperature, etc. The turbulence gas flow is modeled using the k–ε turbulence. Heat, mass, and momentum balance are bidirectionally coupled between the gas and dispersed droplets. CFD provides detailed interactions between the gas flow and the spray. Key points for the CFD modeling are summarized as follows. The model:
• Evaluates detailed interactions between droplet size, nozzle location, spray angle, and drying gas flow.
• Identifies conditions that could reduce wall agglomeration.
• Does not consider agglomeration/coalescence of droplets.
• Includes evaporation of droplets, however detailed drying kinetics including falling rate is not considered in this work.
The SprayFoam solver module within OpenFoam© CFD is used in this work. This solver couples turbulence models for drying gas with mass and heat transfer with evaporating droplets. The spray is modeled as parcels with a parcel flow rate of 100,000 parcels/s. The injection method of the disk is used to describe the flow. The spray cone angle is between 5–20°, while spray velocity is 5–15 m/s. Droplet size is described as a Rosin-Rammler log with a mean diameter of 5–100 µm and a spread of 1.5 µm. Minimum and maximum diameters are changed accordingly to adjust the distribution.
Spray drying simulations in OpenFOAM generate detailed flow field data, including velocity, temperature, and droplet trajectories, which are effectively analyzed using ParaView. ParaView enables detailed post-processing of spray drying simulations allowing visualization of both the Eulerian fluid phase (airflow, turbulence, temperature) and the Lagrangian particle phase (droplets). The droplet locations, particle trajectories, and evaporation behavior are illustrated using various filters. Additionally, ParaView provides multiple options to export data for further analysis in Python. Selected variables (e.g., velocity, temperature, droplet size, droplet age) are exported as CSV files, which are loaded into Python using Pandas or NumPy for statistical analysis and visualization. The entry and exit times of each droplet are extracted to compute individual residence times. By analyzing these values, statistical trends such as the droplet age distribution can be determined. This droplet age distribution data is analyzed in the radial location close to the wall to determine the droplet time to wall.
Material characterization techniques
Glass transition temperature by differential scanning calorimetry (DSC)
The glass transition temperature was measured using a TA Instruments Q2000 DSC equipped with a refrigerated cooling system. The calorimeter head was flushed with pure nitrogen gas. Temperature and enthalpy readings were calibrated using pure indium at the same scan rates as used during sample measurement. In the modulated temperature mode, the amplitude and the period of modulation were set to 1°C and 60 s, respectively. The samples were placed in hermetically sealed pans and heated to 200°C at 2 °C/min under nitrogen (50 mL/min).
Residual solvent by headspace gas chromatography (GC)
Residual solvent analysis was performed using a Perkin Elmer Clarus 580 GC system equipped with a FID detector, Perkin Elmer Turbo Matrix 40 autosampler headspace unit, and TotalChrom software control. The method conditions are as follows:
• Test solution: 50 mg/mL in dimethyl sulfoxide (DMSO)
• Column: J&W DB-1, 60 mm length X 0.32 mm ID 3.0 µm film, Part Number 123-1,064
• H2 flow: 40 mL/min
• Air flow: 450 mL/min
• Detector temperature: 260 °C
• Inlet temperature: 140°C
• Split ratio and flow: 10:1, 21 mL/min
• Linear velocity (cm/s): 40 mL/min Helium, 500 mL/min split flow
• Temperature gradient: Start = 40°C, hold 5 min. Ramp at 5°C/min to 105°C, 10°C/min to 165°C, 20°C/min to 245°C. Hold for 2 min.
Water content by Karl Fischer titration (KF)
The water content of each sample was measured with an 851 Titrano Coulometer (Tiamo software) using Hydranal Coulomat AG oven reagent, nitrogen purge, and Metrohm 874 Oven Sample Processor at 150°C. Approximately 10 mg solid samples were introduced into a sealed sample vial. Duplicate determinations were made and are presented as an average value.
Scanning electron microscope (SEM) imaging and optical microscopy
SEM imaging of dried particles was performed using a Phenom Pheros Scanning Electron Microscope. The sample was mounted on an aluminum stub using conductive double-sided tape, and the sample was sputter coated with a thin gold layer. Microscope images were obtained using an Olympus BX53 optical microscope with Leica K3C digital camera.
Droplet and particle size measurements by laser diffraction
The droplet size was measured for combinations of nozzle and spray angle by laser diffraction. The atomization/nozzle system was setup external to the spray dryer for droplet measurements. Dried particle size for select spray dry samples were measured using dry dispersion in the Malvern MasterSizer or HELOS Sympatec. Instrument software was used to determine the size distribution by % volume where, d90 represents the value where 90% of particles/droplets are smaller than this size, d50 represents the value where 50% of particles/droplets are smaller than this size, and d10 represents the value where 10% of particles/droplets are smaller than this size.
Results and discussion
Material stickiness evaluation
The sticky temperature (Tsticky) for inherently sticky materials, including materials with low glass transition temperatures (Tg), must be considered to reduce wall yield loss. Sticky temperature is ∼20°C higher than glass transition temperature (Du et al., 2014; Muzaffar, 2015). Therefore, the Tg is used as an indicator of Tsticky and considered toward system operating temperature selection. The moisture content of amorphous material can impact the Tg as well, so maximum sample drying is preferred for accurate intrinsic value determination. Tg was measured for five different spray dried samples by DSC and ranged from 52°C to 53°C at different concentrations of acetone and water. Refer to Table 3 for values and the Supporting Information for DSC heat flux curves. The first sample did not have a clear inflection point to determine Tg, likely due to higher acetone content.
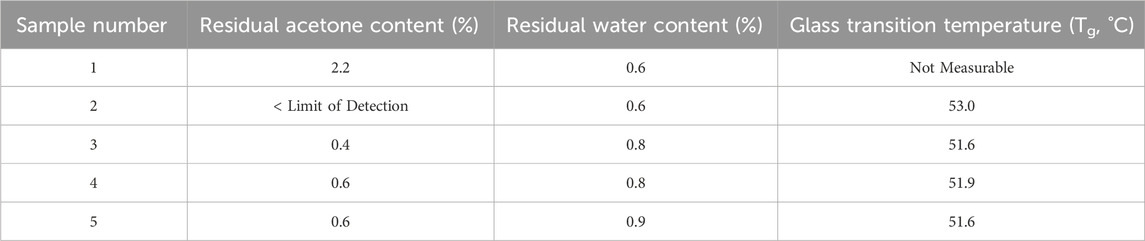
Table 3. Glass transition temperature and residual acetone and water content for Samples one to five.
Spray drying scale-up considerations
The spray drying process modeling, optimization, and experimental verification was scaled up from 5 g (Buchi) to 400 g (FluidAir) as described in Figures 1, 2, and the following discussion sections. 1D modeling was performed Figure 2 to predict the residual solvent, outlet temperature, drying time, size separation efficiency/collection yield, and condition feasibility. The residual solvent content must be low enough to reduce stickiness and excessive agglomeration. An ideal target for acetone content is <1%. However, secondary drying is generally implemented after spray drying, so low solvent content is targeted primarily to reduce agglomeration and stickiness during spray dryer. The system temperatures are predicted here to compare to Tsticky and reduce wall yield loss. Temperatures at 20°C lower than the material Tg are ideal; however, systems using solvents with higher evaporation temperatures (e.g., water) may not afford simple temperature reduction and must depend more heavily on modeling to assess method feasibility and drying times at lower temperatures. These model predictions aided the optimization at each scale herein. Yet, additional complexities at larger scales must be considered, which also affect collection efficiency and yield. Therefore, CFD modeling was used to understand the gas flow, solution spray flow, and droplet formation to improve the more complex processes at scale-up.
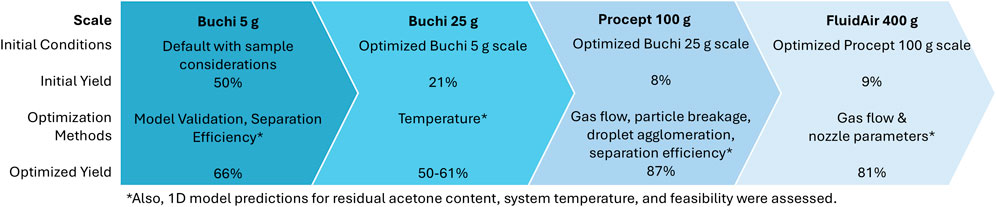
Figure 2. Summary of scale-up and optimization of spray drying process.
Scale-up process optimization also involved mitigating issues such as particle breakage, sub-micron formation, and excessive droplet agglomeration. Broken particles or sub-micron sized particles may pass through the cyclone or filter membrane and cause reduced yield. Particle collisions and high shear in the cyclone may cause particle breakage and finer particles that are not collected. Finer particles may persist due to inefficient droplet agglomeration or coalescence and be lost as sub-micron particles. Conversely, if the droplets are too large, it may cause excessive agglomeration and lead to reduced drying and increased stickiness. These complex issues must be assessed for process optimization of each scale through additional testing and CFD modeling.
Comparison of gas flow using CFD
CFD modeling was used to visualize the flow patterns and to analyze the fluid dynamics to optimize process efficiency and product quality. It can elucidate regions of poor heat transfer, recirculation, or potential particle deposition and aid in method transfer between spray dryer equipment types and scales. CFD modeling of drying gas and solution spray flow was developed across lab to demonstration scales (Figure 3). The flow in the Buchi spray dryer utilizes an annular nozzle which leads to increased turbulence between the droplets and gas flow in the center of the spray dryer. This causes increased coalescence of droplets and improved recovery of sub-micron droplets. The Procept spray dryer utilizes a gas distributor to ensure a smooth downward flow of the gas resulting in reduced wall agglomeration but reduced droplet coalescence and loss of sub-micron particles. It also has an added air inlet which increases gas flow rate and improves separation efficiency. The flow profile in the FluidAir spray dryer is a spiral pattern, which increases the droplet coalescence and increases the collection of sub-micron particles. However, the spiral flow pattern also reduces the time for droplets to contact the wall (<1 s) and should be considered alongside drying time. CFD simulations of Procept spray drying demonstrate a more uniform gas distribution compared to the Buchi spray dryer. Understanding the coalescence and wall adherence tradeoffs of each spray dryer chamber aid in process optimization and method transfer between models.
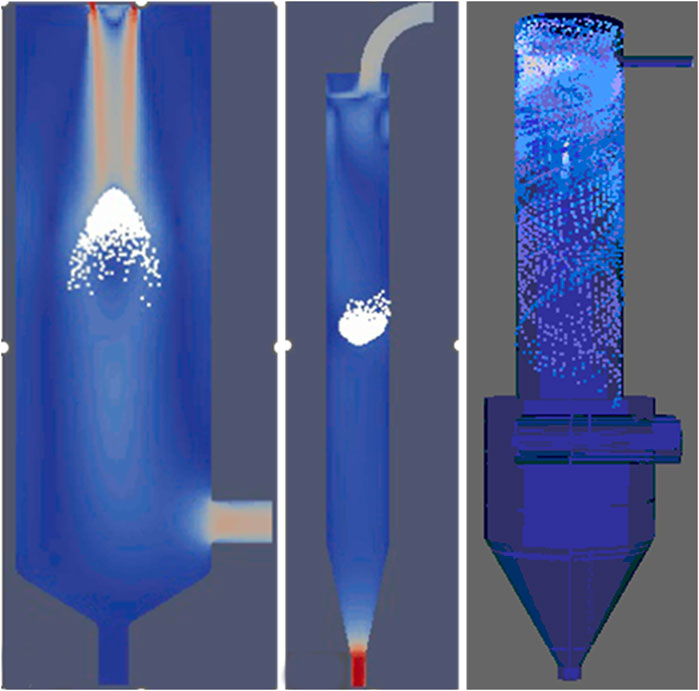
Figure 3. Comparison of drying gas and solution spray flow visualized in ParaView between (Left) Buchi, (Middle) Procept, and (Right) FluidAir1.0 spray dryers.
1D model validation on Buchi spray dryer
A flowsheet 1D model was developed and validated for the spray drying process for the Buchi spray dryer. The 1D model was validated by comparison of predicted and measured values for output temperature and acetone content in the Buchi. The substance was spray dried under various operating conditions, including temperature, air flow rate, and nozzle conditions, as shown in Table 4. The initial conditions were selected based on experience and known material/solution characteristics. Additional conditions were selected based on 1D model predictions for acetone content and feasibility. The experimental and predicted values for outlet temperature and residual acetone content are shown in Table 4; Figure 4. The acetone content of the product is <1% which confirms that the product is completely dried under these conditions and agrees with the predicted outcomes. The mathematical model fits the experimental conditions well, i.e., significant correlation (R2 > 0.80) between measured and predicted values is supported (R2 = 0.83 and 0.93 for acetone content and outlet temperature). The measured error for acetone content and outlet temperature are set to established measurement variation; ±0.2% and ±1.0°C, respectively. Considering the residual solvent values are relatively low (<1%), the goodness of fit for linear regression of measured vs. predicted acetone content is reasonable. The 1D model predictions are considered validated for this system.
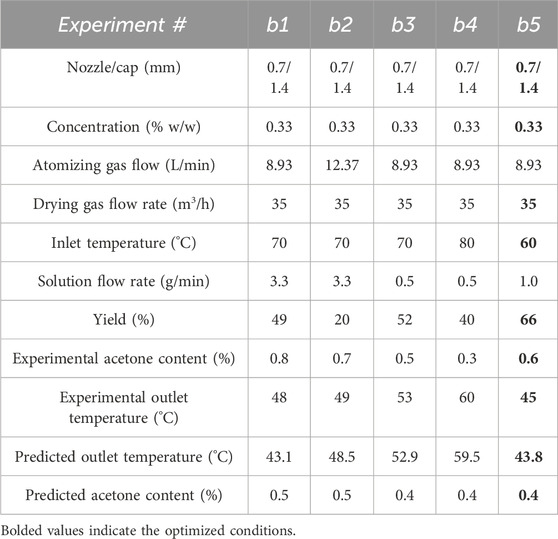
Table 4. Operating conditions, measured values, and model predictions for model validation experiments on Buchi spray dryer (5 g scale). Initial and optimized conditions are experiment numbers b1 and b5, respectively. Optimized conditions are bolded.
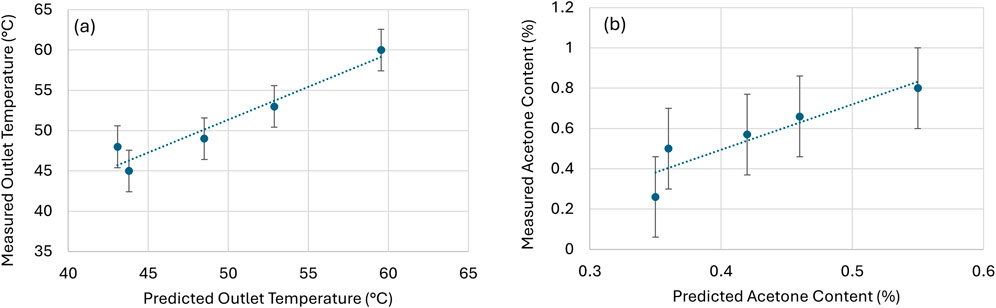
Figure 4. Model validation for outlet temperature and acetone content; Linear regression fit to measured vs. predicted values for (a) Outlet temperature, y = 0.82x + 10.6, R2 = 0.93 and (b) acetone content, y = 2.2x – 0.41, R2 = 0.83.
The 1D model was also used to predict the separation efficiency (i.e., collection yield) of the different cyclone designs for Buchi (standard and high-performance) based on the operating conditions of the spray dryer. The gPROMS FormulatedProducts© software enables an integrated flow-sheet model combining the spray dryer with a cyclone and filter, and the efficiency of the cyclone can be optimized by changing the gas flow rate and the droplet size from the spray dryer nozzle. The model predicts full collection (i.e., 100% yield) by the standard cyclone only for particles larger than 30 μm at the selected drying gas flow rate of 35 m3/h (Figure 5). Experiments with 18 µm particles confirmed that the standard cyclone collected negligible material, i.e., low yield. Therefore, all the development work on the Buchi presented here was performed using high-performance cyclones where 100% collection is expected for particles >18 μm, i.e., full collection of the particle sizes as measured for given conditions. The separation efficiency predictions justified the experimentally observed yields for 18 µm particle size and aided the cyclone selection.
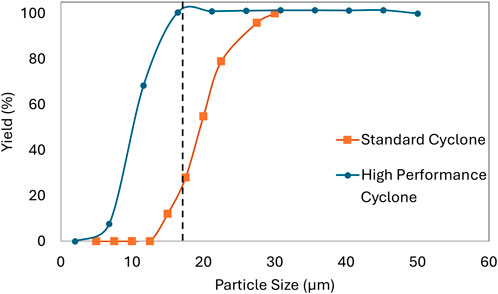
Figure 5. Modeled values for collection yield (%) in standard and high-performance cyclones as a function of droplet/particle size. The average particle size is 18 µm for selected experimental conditions.
Scale-up optimization on Buchi spray dryer
Scale-up of the optimized conditions for the 5 g scale to 25 g on the Buchi spray dryer yielded low recovery (21%) and led to investigation of material stickiness at initial operating temperatures. The transfer tube was visibly blocked and material on the wall was observed (refer to Figure 1 for images), indicating increased agglomeration and sticking. The validation experiments were performed at higher inlet temperatures (60-80°C) which may cause system temperatures near the Tsticky (∼57–77°C). Reduced inlet temperatures of 40°C and 30°C were evaluated using the 1D model to determine feasibility. The model predicted that the material could be dried at the lower temperatures, and the conditions were feasible for spray drying. In cases where solvents with higher evaporation temperatures are used (e.g., water), modeling will be even more valuable to determine feasible conditions using system temperatures that balance efficient solvent removal and product stickiness.
Spray dryer experiments were performed at reduced inlet temperatures (40°C and 30°C), and the yield was drastically improved from 21% to 50% under these conditions (Table 5). The product was still sufficiently dry (<1% residual acetone), as predicted by the model. Further optimization by removing the collection vessel and performing apportioned product collections increased the product yield to 61%. However, some material was still observed adhered to the bottom of the cyclone and within the cyclone-chamber connection. The model-aided experiments substantially increased the yield from 21% to 50%–61% (refer to Figure 1 for images). However, the added step to remove product portions would be difficult to implement following good manufacturing practices. The improved yield was acceptable for process transfer to larger scale.
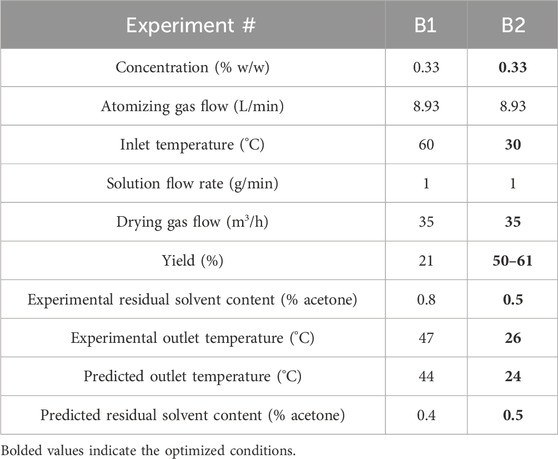
Table 5. Operating conditions, measured values, and model predictions for scaled-up experiments (25 g) on Buchi spray dryer (0.2 mm bi-fluid nozzle). Initial and optimized conditions are experiment numbers B1 and B2, respectively. Optimized conditions are bolded.
Scale-up and transfer to Procept spray dryer
The optimized Buchi 25 g scale conditions were transferred to the Procept (5–100 g). Some parameters required adjustment according to equipment variation (Table 6 compared to Table 5), but the low drying gas inlet temperature condition (30°C) was maintained to reduce stickiness and mitigate wall yield loss. Compared to the Buchi spray dryer conditions, the default drying gas rate is lower, and the liquid flow rate is increased to improve throughput for larger batches. The 1D model for the product was modified to the Procept spray dryer according to the details described in the experimental section. The model predicted values matched experimental values for outlet temperature, however the experimental residual solvent content was high relative to the predicted values. The initial low yield and model inaccuracies in residual solvent indicated system complexities, including particle breakage and droplet agglomeration. Microscopy images of the product confirmed the presence of broken particles (refer to Figure 5 in the supporting information). Additionally, agglomerate formation is indicated by high solvent content measurements arising from the reduced drying efficiency of large agglomerates (residual acetone content was 0.7%–3.8%, Table 6). The 1D model does not include agglomeration/coalescence and cannot predict the droplet size based on the atomization conditions (i.e., atomizing gas flow rate and liquid flow rate). Therefore, CFD modeling of droplet size and agglomeration was performed to further improve yield.
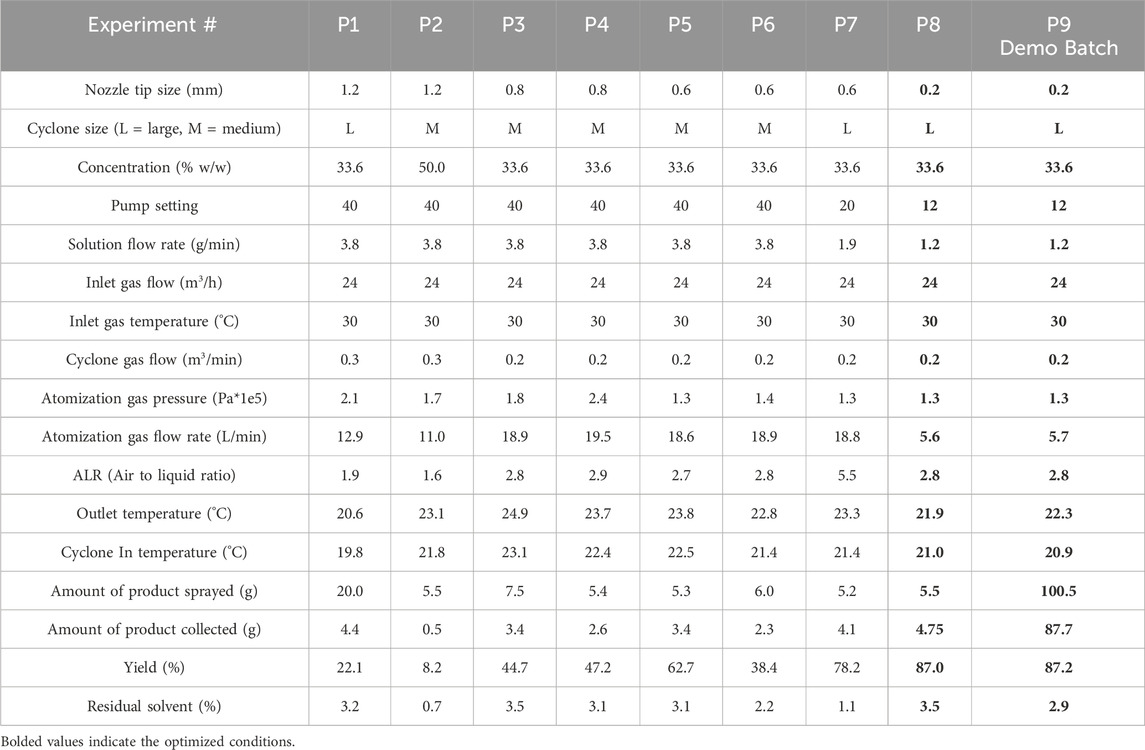
Table 6. Operating conditions and measured values for Procept spray dryer (5–100 g scale, bifluid atomizer). Initial and optimized conditions are experiment numbers P1 and P8/P9, respectively. Optimized conditions are bolded. P10 is demonstration scale.
CFD modeling was used to understand the differences between the Procept and Buchi and optimize the droplet agglomeration conditions on the Procept. The straight-down, laminar drying gas flow in the Procept provides uniform residence time for droplets but limits the agglomeration that is essential for the collecting sub-micron droplets in the cyclone (Figure 3). Therefore, the cyclone and nozzle type were carefully considered. Procept has four different kinds of cyclones (small, medium, large, and extra-large), and the smaller cyclones produce more shear due to high centrifugal forces. Additionally, droplet size is a function of the nozzle size, nozzle type, and fluid flow rate and must balance droplet size between too large droplets with greater breakage and too small droplets with lower collection. The expected droplet size is considered with each cyclone where the approximate cutoff values are 1.5 µm (small), 3 µm (medium), 5 µm (large) and 10 µm (extra-large) (Procept, 2012). The balance between particle breakage and collection efficiency was resolved by using larger cyclones with smaller nozzles to provide the highest yield.
The Procept spray drying process was primarily optimized through considering particle breakage, droplet agglomeration, and separation efficiency modeling. The initial experiments had low yield, and the scale was reduced to conserve material. After optimized yield of 87% was observed at 5 g scale, the conditions were tested at 100 g scale and demonstrated comparable yield (87%). The model-aided optimization resulted in yield improvement from ≤22% in initial experiments to 87% in the final demonstration experiment (Table 6).
Scale-up and transfer to FluidAir
The optimized Procept 100 g scale conditions were transferred to FluidAir (30–400 g) and initial conditions yielded low recovery (8.6%). The 1D model for the product was modified according to the details described in the experimental section. Table 7 lists the operating condition modifications (compared to Table 6). The predicted values matched experimental values for outlet temperature, but like the Procept experiments, the experimental residual solvent content was high relative to the predicted values due to droplet agglomeration. Further optimization was performed using CFD modeling of gas flow, solution spray flow, and droplet age to investigate potential sub-micron particle loss and wall agglomeration in the FluidAir as detailed below.
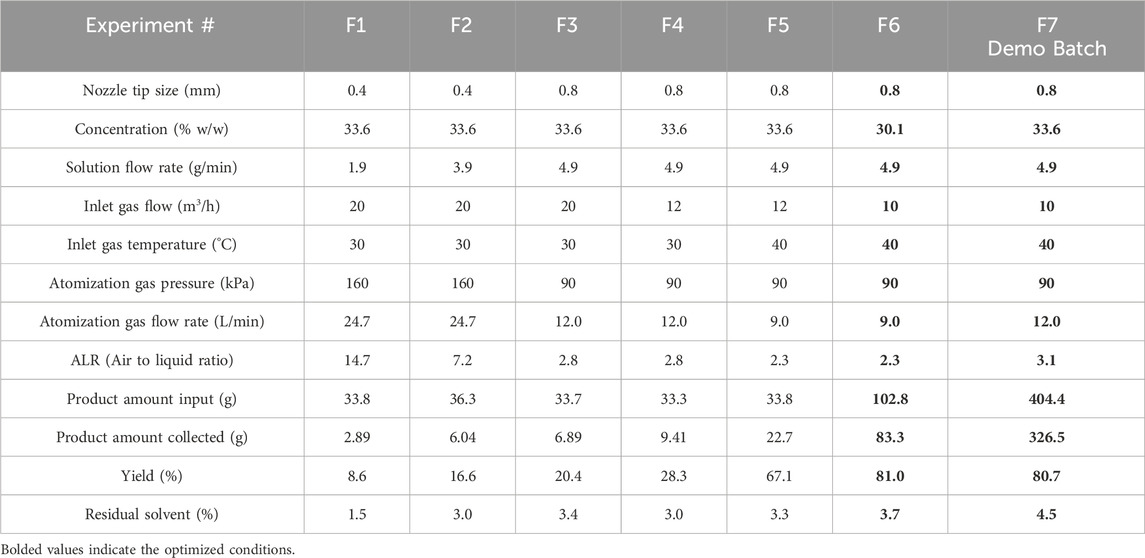
Table 7. Operating conditions and measured values for FluidAir spray dryer (30–400 g scale). Initial and optimized conditions are experiment numbers F1 and F6/F7, respectively. Optimized conditions are bolded. F7 is demonstration scale.
CFD modeling was used to understand fluid dynamics as well as droplet lifetime in the FluidAir spray dryer. The gas flows through a tangential top inlet → chamber → bottom outlet → two filter socks. CFD simulation of gas flow and solution inside the spray dryer chamber demonstrates a spiral pattern as shown in Figures 3, 6. This flow pattern enhances droplet coalescence, increases droplet size, and improves collection, but reduces the droplet time to wall.
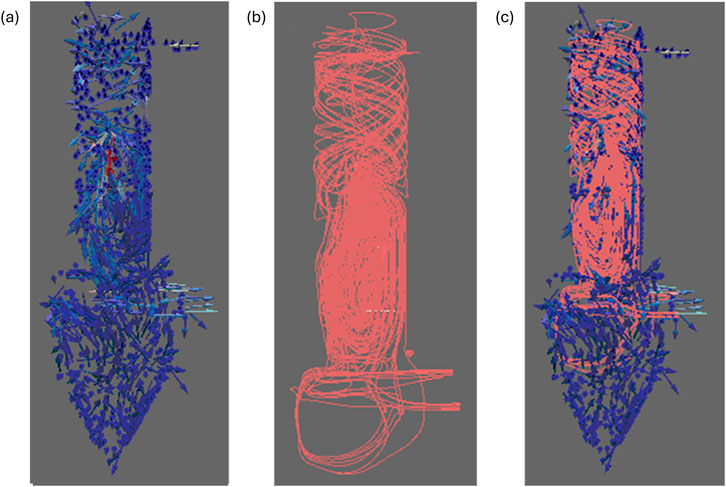
Figure 6. Fluid dynamics simulation inside the FluidAir spray drying chamber using Paraview; (a) Drying gas velocity glyphs (blue vectors), (b) Liquid solution spray streamlines (i.e., paths tracked by liquid droplets as they move through the drying gas medium) (pink lines), and (c) Combined drying gas glyphs and liquid spray streamlines.
Wall loss was reduced using CFD modeling to optimize nozzle parameters for droplet drying prior to wall contact. Reduced droplet time to wall (i.e., drying chamber residence time for the droplet before wall contact) results in increased solvent content leading to increased stickiness, adherence, and yield loss. Therefore, optimally, the droplet time to wall is long enough to dry prior to wall contact. The ex-situ nozzle data set, including droplet size, cone angle, and spray velocity information, was fed into the CFD to evaluate the droplet age within the FluidAir spray dryer. The droplet size measured for most of the nozzles under the given conditions was < 40 µm (d90). The 1D model has shown that droplets <40 µm can be dried within 400 ms, i.e., a critical zone should be avoided for <40 µm sized droplets with age <400 ms. Droplet time to wall vs. droplet size was compared for various conditions, including nozzle operating conditions, spray flow rate, nozzle type, and nozzle location. The most impactful condition is cone angle and was optimized through CFD modeling. Refer to Figure 7 for results from cone angle of 9.5°, 14°, and 19°. A cone angle of 14° was selected given the operating conditions and <40 μm droplet size, because it increases the age for the <40 µm droplets and is furthest from predictions falling within the critical zone.
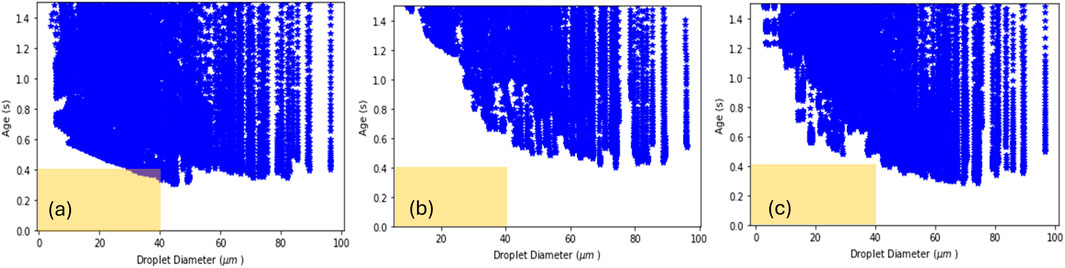
Figure 7. Nozzle cone angle impact on droplet time to wall. Predicted droplet time to wall for cone angles of (a) 9.5°, (b) 14°, (c) 19°. Optimized parameters avoid droplets with predictions falling within the critical zone of <400 ms (= predicted drying time) and <40 µm (= average droplet size) which is illustrated as a yellow box overlay here.
Additional considerations toward sub-micron particles were investigated for potential loss using filter collection with micron pore size. Sub-micron particles were observed (Figure 8), which are smaller than the filter membrane pores (1 µm). Therefore, the filter sock in FluidAir cannot collect the sub-micron particles, and this material is lost to the filters. The initial droplet size range (d10 to d90) for the given nozzle conditions ranges from ∼1 to 20 µm (d10 = 1–4 μm, d90 = 7–20 µm), but breakage and coalescence change the resulting particle size range (d10 to d90) to ∼1–200 µm (d10 = 1–3 μm, d90 = 47–200 µm). The smaller droplets may coalesce with bigger droplets, grow larger than the cutoff size, and be collected by the filter. Thereby, droplet coalescence improves product collection and increases yield. The FluidAir experiences increases droplet coalescence due to higher turbulence in the spray region of the spray dryer as compared to Buchi and Procept.
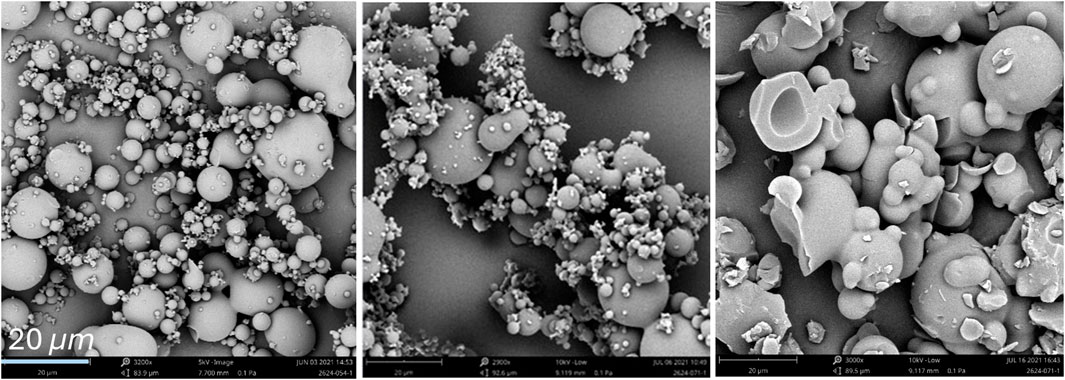
Figure 8. SEM images of spray-dried particles with sub-micron to large particle sizes arising from breakage, initial droplet formation, and droplet coalescence in FluidAir samples.
Further modifications were investigated toward reducing wall loss by adding custom gas flow distributor plates that reduce the area of wall contact. The spiral flow pattern visualized by CFD modeling elucidated potential for wall contact, whereas a straight flow may have relatively reduced impingement. The additional plate causes the flow to enter the chamber in a straight trajectory prior to forming a spiral pattern; therefore, the spiral flow region is adjusted deeper into the chamber and may reduce wall contact and material loss. However, no significant improvement in yield was observed, which is likely due to accumulation of material on the distributor plate offsetting any reduction in wall loss at the top of the chamber. This may be investigated in future work for further improvement.
The FluidAir spray drying process was primarily optimized through gas flow modeling and droplet modeling as a function of nozzle parameters. The initial experiments had low yield, and the scale was reduced to conserve material. After optimized yield of 81% was observed at 100 g scale, the conditions were tested at 400 g scale and demonstrated the same yield. The model-aided optimization resulted in yield improvement from 9% in initial experiments to 81% in the final demonstration experiment (Table 7). Overall, the process optimization workflow achieved an increase in yield from 9% to 81% at both lab and demonstration scale in the FluidAir (refer to Table 7 for values; Figure 1 for images).
Spray drying of a sticky material poses a complex process optimization problem, dependent on the API. Generally, higher yield can be achieved by increasing the drying rate to thoroughly dry the droplets before contact with the wall. The drying rate can be increased by increasing temperature or increasing turbulence with a higher gas flow rate. However, due to its low glass transition temperature, this API provides a unique challenge as the product would become stickier at higher temperatures. Therefore, this causes an optimization problem where a yield >80% was found to be acceptable. In this case, the specified goals were achieved for time efficiency and yield. Further optimization approaches, including wall coatings, static charge dissipators, modified distributor plate geometry, and different nozzle types, were also utilized with no significant improvements in the yield.
Conclusion
Diverse industries, including food, pharma, and chemical, extensively use spray drying to produce particles with required characteristics such as particle size distribution, solvent content, density, amorphous dispersion, and flowability. Spray drying presents a challenge for modeling; therefore, optimization and scale-up has traditionally been performed through resource consuming empirical approaches. The spray drying scale-up challenge is further exacerbated for a sticky product with low Tg. In this work, a novel model-aided optimization workflow has been demonstrated for the spray drying process of a sticky product at lab to demonstration scale.
A combined approach using 1D and CFD modeling informed process parameter feasibility and optimization to efficiently achieve improved yields. A 1D model was developed using gPROMS FormulatedProducts© with considerations for discretized droplet size populations and heat and mass balance transfers between droplets and gas. The model has been used to predict the outlet temperature, residual solvent content in the product, size separation, and droplet drying time. Lagrangian-Eulerian 3D CFD models were developed in OpenFoam© and helped optimize the nozzle conditions and visualize the drying gas flow. This study highlighted the importance of droplet age modelling in CFD combined with the mechanistic model to provide a more nuanced understanding of the process. A large dataset of spray droplet size distribution was generated for a subset of nozzles and spray angles. This information was directly fed into the models here; however, future work from our lab is currently underway to develop machine learning predictions for additional nozzle conditions that are beyond a feasible experimental scope. Additionally, future work may explore fully coupled CFD and mechanistic models using a zonal approach.
The model screening enabled rational condition selection and greatly reduced the number of experiments required for a complex spray drying process. Additionally, the models provided insight to resolve issues regarding stickiness, agglomeration, particle breakage, and sub-micron particle formation. The model-aided approach achieved yields of 61%–87% with suitable dryness (1%–5% residual solvent) for three different scale spray dryers (5–400 g in Buchi, Procept, and FluidAir spray dryers). This approach achieved yield that otherwise may not reach acceptable levels without optimization (only ∼9% yield at 400 g or 21%–50% yield at g scale) and/or require impractical experimental efforts.
Data availability statement
The original contributions presented in the study are included in the article/Supplementary Material, further inquiries can be directed to the corresponding author.
Author contributions
AK: Conceptualization, Data curation, Investigation, Methodology, Software, Validation, Visualization, Writing – original draft, Writing – review and editing. CW: Data curation, Project administration, Resources, Writing – review and editing. LK: Data curation, Visualization, Writing – review and editing. MH: Data curation, Funding acquisition, Project administration, Supervision, Writing – review and editing.
Funding
The author(s) declare that no financial support was received for the research and/or publication of this article.
Acknowledgments
The authors thank Nikita Soni, Jeane Chen, and Rachel Lee for spray drying experiments, and Darpandeep Aulakh and Subhodh Karkala for reviewing the article. The authors would also like to thank Li Liu and Hugh Stitt from Johnson Matthey Technology Centre for the initial CFD model development.
Conflict of interest
Authors AK, LK, CW, and MH were employed by Veranova.
Generative AI statement
The author(s) declare that no Generative AI was used in the creation of this manuscript.
Publisher’s note
All claims expressed in this article are solely those of the authors and do not necessarily represent those of their affiliated organizations, or those of the publisher, the editors and the reviewers. Any product that may be evaluated in this article, or claim that may be made by its manufacturer, is not guaranteed or endorsed by the publisher.
Supplementary material
The Supplementary Material for this article can be found online at: https://www.frontiersin.org/articles/10.3389/fceng.2025.1565916/full#supplementary-material
References
Ali, M., Mahmud, T., Heggs, P. J., Ghadiri, M., Bayly, A., Ahmadian, H., et al. (2015). CFD simulation of a counter-current spray drying tower with stochastic treatment of particle-wall collision. Procedia Eng., New Paradigm Part. Sci. Technol. Proc. 7th World Congr. Part. Technol. 102, 1284–1294. doi:10.1016/j.proeng.2015.01.259
Ali, M., Mahmud, T., Heggs, P. J., Ghadiri, M., Bayly, A., Ahmadian, H., et al. (2017). CFD modeling of a pilot-scale countercurrent spray drying tower for the manufacture of detergent powder. Dry. Technol. 35, 281–299. doi:10.1080/07373937.2016.1163576
Arpagaus, C., Collenberg, A., Rütti, D., Assadpour, E., and Jafari, S. M. (2018). Nano spray drying for encapsulation of pharmaceuticals. Int. J. Pharm. 546, 194–214. doi:10.1016/j.ijpharm.2018.05.037
Boel, E., Koekoekx, R., Dedroog, S., Babkin, I., Vetrano, M. R., Clasen, C., et al. (2020). Unraveling particle formation: from single droplet drying to spray drying and electrospraying. Pharmaceutics 12, E625. doi:10.3390/pharmaceutics12070625
Carlsson, P. (2009). Tutorial dieselFoam. Available online at: https://www.tfd.chalmers.se/∼hani/kurser/OS_CFD_2008/PerCarlsson/PC_Tutorial_dieselFoam_peered_NL_HN.pdf.
Dobry, D. E., Settell, D. M., Baumann, J. M., Ray, R. J., Graham, L. J., and Beyerinck, R. A. (2009). A model-based methodology for spray-drying process development. J. Pharm. Innov. 4, 133–142. doi:10.1007/s12247-009-9064-4
Du, J., Ge, Z.-Z., Xu, Z., Zou, B., Zhang, Y., and Li, C.-M. (2014). Comparison of the efficiency of five different drying carriers on the spray drying of persimmon pulp powders. Technol 32, 1157–1166. doi:10.1080/07373937.2014.886259
Francia, V., Martín, L., Bayly, A. E., and Simmons, M. J. H. (2016a). Agglomeration in counter-current spray drying towers. Part B: interaction between multiple spraying levels. Powder Technol. 301, 1344–1358. doi:10.1016/j.powtec.2016.05.010
Francia, V., Martín, L., Bayly, A. E., and Simmons, M. J. H. (2016b). Agglomeration in counter-current spray drying towers. Part A: particle growth and the effect of nozzle height. Powder Technol. 301, 1330–1343. doi:10.1016/j.powtec.2016.05.011
Gil, M., Vicente, J., and Gaspar, F. (2010). Scale-up methodology for pharmaceutical spray drying. Chim. Oggi 28, 5.
Grasmeijer, N., Waard, H. de, Hinrichs, W. L. J., and Frijlink, H. W. (2013). A user-friendly model for spray drying to aid pharmaceutical product development. PLOS ONE 8, e74403. doi:10.1371/journal.pone.0074403
Handscomb, C. S., and Kraft, M. (2010). Simulating the structural evolution of droplets following shell formation. Chem. Eng. Sci. 65, 713–725. doi:10.1016/j.ces.2009.09.025
Handscomb, C. S., Kraft, M., and Bayly, A. E. (2009a). A new model for the drying of droplets containing suspended solids. Chem. Eng. Sci. 64, 628–637. doi:10.1016/j.ces.2008.04.051
Handscomb, C. S., Kraft, M., and Bayly, A. E. (2009b). A new model for the drying of droplets containing suspended solids after shell formation. Chem. Eng. Sci. 64, 228–246. doi:10.1016/j.ces.2008.10.019
Jubaer, H., Xiao, J., Chen, X. D., Selomulya, C., and Woo, M. W. (2019). Identification of regions in a spray dryer susceptible to forced agglomeration by CFD simulations. Powder Technol. 346, 23–37. doi:10.1016/j.powtec.2019.01.088
Marante, T., Viegas, C., Duarte, I., Macedo, A. S., and Fonte, P. (2020). An overview on spray-drying of protein-loaded polymeric nanoparticles for dry powder inhalation. Pharmaceutics 12, 1032. doi:10.3390/pharmaceutics12111032
Muzaffar, K. (2015). Stickiness problem associated with spray drying of sugar and acid rich foods: a mini review. J. Nutr. Food Sci. s12. doi:10.4172/2155-9600.S12-003
Nešić, S., and Vodnik, J. (1991). Kinetics of droplet evaporation. Chem. Eng. Sci. 46, 527–537. doi:10.1016/0009-2509(91)80013-O
Pandian Muthuramalingam, V. (2016). Implementation of soot model for aachenBomb tutorial. Gothenburg, Sweden: Chalmers University of Technology. Available online at: https://www.tfd.chalmers.se/∼hani/kurser/OS_CFD_2015/VigneshPandian/Report_Vignesh_revised.pdf.
Price, G., and Patel, D. A. (2022). “Drug bioavailability,” in StatPearls (Treasure Island (FL): StatPearls Publishing).
Putranto, A., Chen, X. D., Devahastin, S., Xiao, Z., and Webley, P. A. (2011). Application of the reaction engineering approach (REA) for modeling intermittent drying under time-varying humidity and temperature. Chem. Eng. Sci. 66, 2149–2156. doi:10.1016/j.ces.2011.02.025
Reed, M. A. (2023). Mechanistic understanding of spray dried active pharmaceutical ingredients (APIs) (phd+master). Leeds, West Yorkshire, England: University of Leeds. Available online at: https://etheses.whiterose.ac.uk/id/eprint/33610
Keywords: spray drying, bioavailability, amorphous solid dispersion, mechanistic modeling, computational fluid dynamics (CFD), scale-up, tech transfer, wall agglomeration
Citation: Kapil A, Wombwell C, Kegel LL and Hamlin MD (2025) Model-aided process development for scalable spray drying of sticky substances. Front. Chem. Eng. 7:1565916. doi: 10.3389/fceng.2025.1565916
Received: 23 January 2025; Accepted: 07 April 2025;
Published: 29 April 2025.
Edited by:
Zhixing Cao, East China University of Science and Technology, ChinaReviewed by:
Haifeng Lu, East China University of Science and Technology, ChinaCheng Li, Technion Israel Institute of Technology, Israel
Copyright © 2025 Kapil, Wombwell, Kegel and Hamlin. This is an open-access article distributed under the terms of the Creative Commons Attribution License (CC BY). The use, distribution or reproduction in other forums is permitted, provided the original author(s) and the copyright owner(s) are credited and that the original publication in this journal is cited, in accordance with accepted academic practice. No use, distribution or reproduction is permitted which does not comply with these terms.
*Correspondence: Ankur Kapil, YW5rdXIua2FwaWxAdmVyYW5vdmEuY29t