 Nikhil Sharma1
 Kannan M. Moudgalya
- 1Department of Chemical Engineering, IIT Bombay, Mumbai, Maharashtra, India
- 2ModeliCon InfoTech LLP, Bengaluru, India
Reactive distillation is a process intensification technique that merges reaction and separation in one unit, reducing equipment count and energy use. It boosts conversion by continuously removing products, making it ideal for equilibrium-limited systems. Reactive distillation is predominantly used for industrial processes such as esterification, etherification, hydrolysis, etc. Start-up of reactive distillation columns is difficult, owing to possibility of multiple steady states and runaway reactions resulting in increased start-up times and associated environmental impact. This work addresses optimal start-up of a methanol esterification by reactive distillation to reduce start-up time and energy. Novel scheduling framework developed by the authors is leveraged to manage variable structure of the model equations required for simulating and optimizing the start-up operation. The startup process is validated with experimental studies in a pilot plant. This method is compared with the traditional start-up process. Environmental impact associated with the start-up phase of methanol esterification in reactive distillation is assessed using a detailed cradle-to-gate LCI and applying the ReCiPe 2016 Mid-point (H) methodology. The optimal start-up demonstrates a 64% reductions in start-up time compared to traditional start-up, which significantly reduces environmental impacts. Key improvements in emissions included a 68% decrease in GWP, 56% reduction in fossil depletion, and 69% reduction in human toxicity when compared with the traditional method. These benefits were driven by reduced energy consumption and elimination of raw material loss during transient operation. The results highlight the environmental and operational advantages of optimal RD startup strategies and emphasize the need to include transient phases in LCA models. This approach supports sustainable process design and aligns with decarbonization goals in chemical manufacturing.
1 Introduction
Start-up operations in chemical process industries are critical transient phases that significantly impact plant economics, safety, and environmental performance. Despite their importance, the literature on start-up operation modeling remains limited due to the inherent complexity of transient behavior, including phase transitions and equipment behavior changes that require different mathematical formulations. These complexities lead to replacing rigorous dynamic models with simplified assumptions that compromise accuracy. For example, assuming uniform composition profiles throughout distillation columns and treating reactors as perfectly mixed systems overlooks complex flow patterns during transient periods. Such assumptions often fail to capture true process behavior during start-up operations. In particular, start-up in reactive distillation (RD) systems presents unique challenges. RD integrates chemical reaction and component separation within a single unit, making its dynamics more complex than those of traditional distillation columns. It is commonly used in processes such as esterification, transesterification, etherification, and alkylation. Unlike traditional distillation, RD should not be operated under total reflux during start-up, as the reactions are often equilibrium-controlled. A given start-up strategy in RD can lead to drastically different outcomes, including multiple steady states or even runaway reactions (Ruiz et al., 1988; Bisowarno and Tadé, 2000). Furthermore, RD systems typically require significant time to reach steady-state, with some industrial cases reporting start-up durations of up to 72 h or more.
Reepmeyer et al. (2003) developed the first comprehensive startup model using gPROMS, demonstrating that total reflux policies suitable for conventional distillation are inadequate for reactive systems due to reaction-separation interactions. Wu et al. (2006a) investigated equipment design impacts, showing that increased condenser liquid holdup volume significantly reduces startup time, while Wu et al. (2006b) applied artificial neural networks for startup time prediction, though model accuracy remains dependent on data quality and system-specific training requirements.
Reepmeyer et al. (2004) introduced systematic time-optimal strategies including off-spec product recycling and initial product charging, and Lopez and Flores (2007) demonstrated that optimal control policies can achieve energy savings of one order of magnitude compared to conventional startup approaches. Recent work by Forner et al. (2008) validated the critical influence of decanter charging on startup behavior, Lai et al. (2008) confirmed the importance of initial holdup composition through experimental studies, and Vahidi Ferdowsi et al. (2023) developed decentralized PID control configurations using Reactive Residue Curve Maps analysis.
While recent studies have explored start-up strategies for conventional and complex distillation columns (e.g., dividing wall columns, cryogenic ASUs) using dynamic optimization and robust modeling (Hoffmann et al., 2020; Quarshie et al., 2023; Waibel et al., 2024), little attention has been given to reactive distillation (RD) start-up. Existing literature focuses on non-reactive systems, addressing challenges like phase discontinuities, energy efficiency, and time optimization. However, RD introduces additional complexities (e.g., stoichiometric feed ratios, and reaction kinetics), yet no systematic studies on its start-up dynamics are available. This gap highlights the need for tailored strategies to address RD-specific challenges, such as maintaining optimal reactant ratios in reactive zones during transient phases.
Despite these advances, significant research gaps persist that limit optimization effectiveness. In all the above-mentioned optimal start-up policies, the first step, termed discontinuous phase by Ruiz et al. (1988), is not considered for the optimization. Discontinuous phase is an early startup stage characterized by phase transitions and equipment behavior changes that fundamentally affect the entire startup trajectory. Additionally, minimal attention is given to environmental impact assessment of different startup strategies, despite demonstrated potential for substantial energy and material savings.
Life Cycle Assessment (LCA) has become a vital tool for evaluating the environmental impacts of chemical processes, spanning cradle-to-grave boundaries (Hellweg and Milà i Canals, 2014). LCA studies have been conducted for extractive distillation (Yang et al., 2022b), reactive-extractive configurations (Yang et al., 2022a), and recompression based RD systems (Chen et al., 2020), typically focusing on steady-state performance, energy demand, and process intensification. However, very limited attention has been given to the transient environmental impacts during startup or shutdown phases. This omission is significant, as such events can recur frequently in industrial settings due to maintenance, process transitions, or unforeseen stoppages, adding considerable, yet unquantified, environmental burdens (Im-Orb et al., 2021). None of the LCA work related to RD has taken into account the start-up operation. The absence of integrated approaches that simultaneously address discontinuous phase modeling and environmental optimization represents a key opportunity for advancing reactive distillation startup research.
To address this gap, the present work develops and assesses an optimal startup strategy for a methanol esterification process via reactive distillation, starting from a cold and empty state, termed discontinuous phase by Ruiz et al. (1988). A two-step optimal policy is designed to reduce the startup time significantly compared to a traditional approach. The process is first modeled and validated through simulation and experiments, and subsequently evaluated for its environmental performance through LCA. By incorporating the startup phase into environmental analysis, the study offers insights into how early-stage process decisions can influence broader sustainability outcomes, especially in systems with recurring transient operations.
The key contributions of this work are:
1. This study develops a generalized framework for the startup process in reactive distillation, starting from a cold and empty system, and captures both the discontinuous and continuous phases.
2. An important contribution of this work is the experimental validation of the model to account for the vapor ascending up the trays and condensing, eventually enabling the reflux operation during the start-up from the cold and empty state, thereby significantly reducing environmental impacts.
3. A two-step optimal startup policy is proposed and demonstrated to reduce the startup time from 12.5 h to 4.5 h, improving energy efficiency and reducing raw material loss.
4. A cradle-to-gate LCA is carried out to compare the environmental impacts of traditional and optimal startup strategies, with all inputs and outputs quantified until steady-state operation is achieved.
2 Traditional start-up
The steady state experimental conditions are obtained from the DWSIM simulation for the experimental set-up Methyl acetate kinetics is modeled using a pseudo-homogeneous approach (Tang et al., 2005). The description of reaction chemistry, experimental set-up and DWSIM simulation are given in appendix. Table 1 shows the experimentally achieved steady state, which will be required in an optimization run in Section 3. These results match the values given in the Table for DWSIM simulation in the appendix as well. Table 2 presents the conversion results for pilot scale plant.
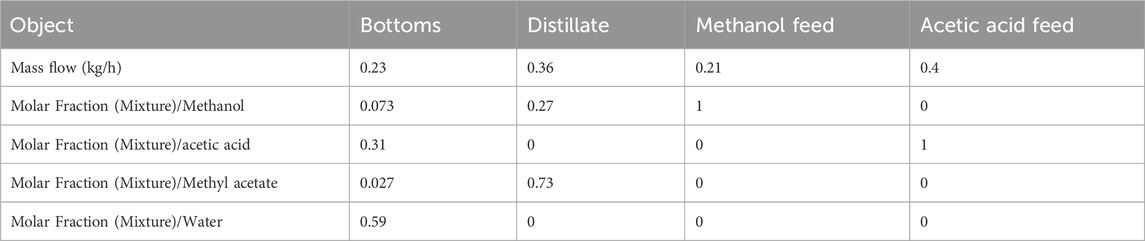
Table 1. Experimentally achieved steady-state.
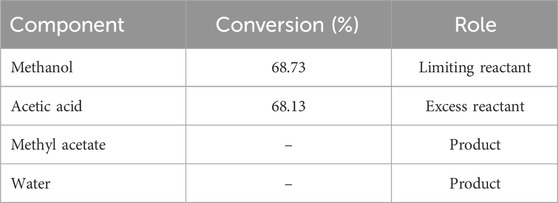
Table 2. Reaction analysis and conversion results.
2.1 Experimental run
The steps for the experimental run following the traditional start-up strategy are illustrated in Figure 1. Based on the reaction stoichiometry, an equimolar amount of reactants is used for the esterification reaction. Initially, an equimolar mixture of methanol and acetic acid is charged into the reboiler, while the column remains empty, as shown in Figure 1a. As heating progresses, vapor-liquid traffic is gradually established within the column, and the trays along with the reflux drum become completely filled, as depicted in Figure 1b. Once vapor-liquid traffic is completely established, methanol and acetic acid are continuously fed from the bottom and top of the reactive zone, respectively, and simultaneous product withdrawal from the top and bottom is initiated, as shown in Figure 1c.
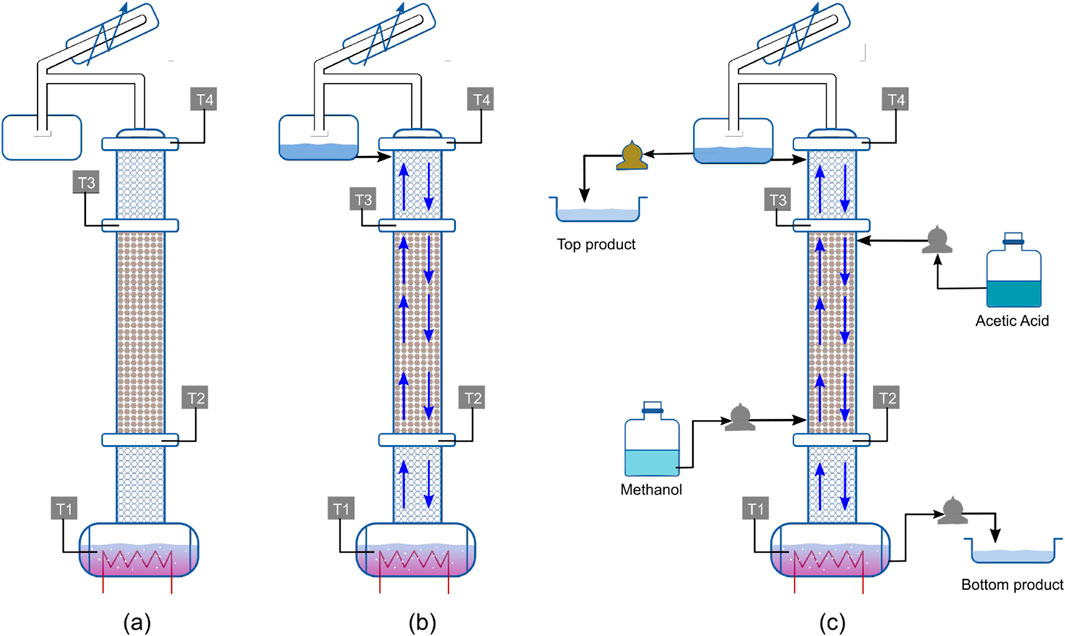
Figure 1. Visualization of experimental procedure for traditional start-up: (a) Equimolar feed charged to empty column; (b) Establishment of VLE; (c) Continuous feed inlet and product withdrawals.
The results of this experimental run are discussed in Section 2.3, where they are compared with the corresponding simulation results.
2.2 Scheduler for start-up simulation
The start-up of a continuous distillation column is inherently a batch-wise process, similar in behavior to that of traditional batch distillation. The optimal start-up of batch distillation has been previously studied by Sharma et al. (2024), where a rigorous methodology is proposed and validated. In the present study, the same OpenModelica-based scheduler is employed to model the start-up of a reactive distillation column. The mathematical model describing these transitions is presented below:
The feed is charged to the reboiler, and heat is supplied to initiate the start-up process. The applied heat increases the temperature of both the liquid feed and the glass wall of the reboiler. The corresponding mathematical equation for this step is given in Equation 1 as:
Where
Component Balance:
Overall Balance:
Energy Balance:
Equilibrium:
When the vapor reaches the tray just above the reboiler, the corresponding mathematical equation is given by Equation 8:
On a tray, once the bubble point is reached, vapor ascends, condenses upon contact with the surface of the tray above, and flows downward as liquid. The vapor-liquid equilibrium (VLE) model for the
For the reactive zone, overall and component balance on the
Energy Balance:
Equilibrium:
Finally, the vapor reaches the condenser and begins to fill the reflux drum. Once the hold-up capacity is reached, the liquid starts returning to the column as reflux, and the system operates under total reflux conditions. The governing equations for the condenser and reflux drum under total reflux are given by Equations 17–21:
Balance around the reflux drum:
Once the column is completely filled and vapor-liquid traffic is stabilized, continuous feed and product withdrawals are initiated under steady-state operating conditions. The steady-state achieved through dynamic simulation performed by OpenModelica matches exactly with the experimental results reported in Table 1. The operating parameters used in the simulation, such as flow rates, temperature, and pressure, are identical to those used in the experimental setup, and are obtained from the DWSIM steady-state simulation, as reported in Table 1 and the appendix.
2.3 Validation of simulation results with experimental data
Figure 2 illustrates the temperature profiles for different sections of the column during the start-up. Except for the reboiler, the temperature profiles in other sections do not begin from the start of the simulation. This is because a component is simulated only when it becomes active, i.e., when liquid or vapor is present in that section. At the beginning of the simulation, the temperature increases abruptly, which is attributed to the tray-wise modeling approach. The sudden removal of the more volatile component leads to an increase in the bubble point, thereby raising the tray temperature. As vapor condenses on the wall of the next tray and falls back, a sudden drop in temperature is observed; the initiation of liquid flow from trays settles the abrupt change in temperature shown initially.
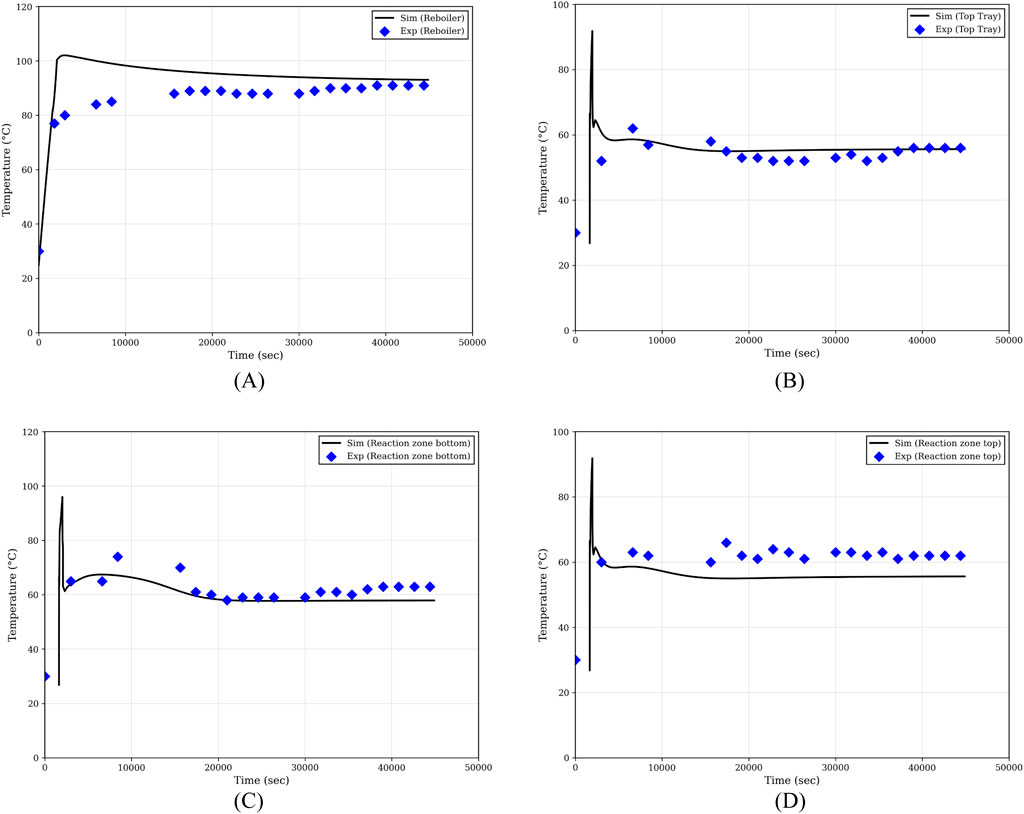
Figure 2. Temperature profiles in different sections of the column during start-up. (A) Bottom; (B) Top; (C) Bottom of the reaction zone; (D) Top of the reactive zone.
The simulation and experimental results show close agreement. The observed deviations are mainly due to the modeling approach: while the simulation uses a tray-wise model, the experimental column is packed. In the tray-wise model, thermal inertia due to packing is not accounted for. Both the simulation and the experimental setup take approximately 12.5 h to reach steady-state under the traditional start-up strategy.
The composition of samples is analyzed using gas chromatography, as described in appendix. Figure 3 presents the composition profiles of all components at the bottom of the column during the start-up phase. Initially, an equimolar mixture of methanol and acetic acid is charged into the reboiler. As the operation proceeds, methanol, being the more volatile component, moves toward the top of the column, resulting in an increase in the acetic acid concentration in the reboiler. As the reaction progresses and products begin to form, water accumulates at the bottom, leading to a subsequent decrease in the acetic acid concentration.
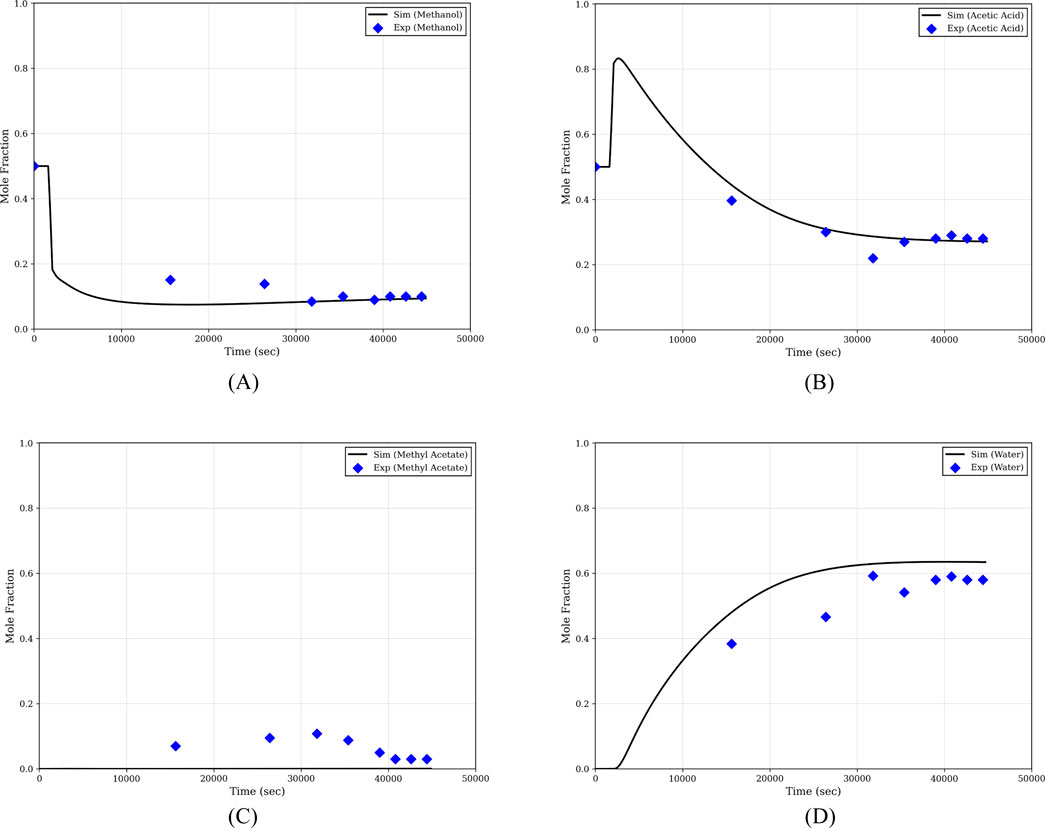
Figure 3. Composition profiles at the bottom of the column during start-up. (A) Methanol; (B) acetic acid; (C) Methyl acetate; (D) Water.
Figure 4 shows the composition profiles of all components at the top of the column. Initially, unreacted methanol and a small amount of acetic acid rise to the top. As the reaction progresses and a considerable quantity of products is formed, methyl acetate, being the lightest component, starts dominating at the top. Consequently, the concentration of methanol at the top gradually decreases.

Figure 4. Composition profiles at the top of the column during start-up. (A) Methanol; (B) acetic acid; (C) Methyl acetate; (D) Water.
Table 3 presents the quantitative error analysis between simulation and experimental data to substantiate model accuracy.

Table 3. Quantitative error analysis between simulation and experimental data.
3 Simulation of optimal start-up
As described by Ruiz et al. (1988), start-up involves three major steps:
1. Development of vapor-liquid traffic in the empty column after charging the reboiler with the feed (step-1).
2. After establishing vapor-liquid traffic, continuous addition of feed and withdrawal of products (step-2).
3. Operating the column at the steady state (step-3).
In this work, step-1 and step-2 are optimized to reach the steady state quickly. The process is governed by stoichiometry, which requires the reactants to be supplied in equimolar proportions. However, because the reactive zone is located in the middle of the column, a conventional startup, where an equimolar feed is introduced into the reboiler, fails to deliver the optimal reactant ratio to the reactive zone due to differences in relative volatilities. Furthermore, if the heavier component reaches the top of the column, the process becomes highly inefficient.
To overcome this issue, we adopt a non-conventional startup strategy. Instead of charging an equimolar feed to the reboiler, only the more volatile component (MVC) is introduced there, while the other reactant (in this case, acetic acid) is fed at the top of the reactive zone.
In step 11, the heat duty and internal reflux ratio prior to the withdrawal phase are adjusted to achieve maximum conversion within the reactive zone and to prevent the heavier component from escaping to the top. In step-2, the steady-state operating points and parameter values are already known. Using this information, a reflux ratio profile is developed to achieve steady state in the shortest possible time.
Optimization is performed through the integration of Scipy’s COBYLA algorithm with OpenModelica as shown in Figure 5. COBYLA (Constrained Optimization BY Linear Approximations) is a function based optimization method for complicated systems wherein the evaluation of derivatives and Jacobians is difficult or inconvenient Powell (1994). The integration allows communication between OpenModelica and Scipy through the use of a text file. This file serves as an intermediary, where decision variables are defined and exchanged between the two platforms. The tolerance and the maximum number of iterations used in the solver settings are set to

Figure 5. Integration of OpenModelica with scipy.
Table 4 provides the comparison of traditional and optimal start-up strategies.

Table 4. Comparison of traditional and optimal start-up strategies.
3.1 Optimal policy for the step-1 of the start-up procedure
A tray column is considered for the modeling and simulation of an optimal start-up policy. The state transitions for a tray column during start-up are described in Section 2.2. The following policy is proposed for the optimal start-up of step-1:
1. Pure methanol is fed to the reboiler and heated. Figure 6a represents this step.
2. As soon as methanol vapor reaches the top of the reactive zone indicated by the temperature sensor, the acetic acid feed is started, as shown in Figure 6b.
3. Until reflux starts, which happens when the vapor reaches the top of the column, trays remain partially filled. This is because the vapor does not condense on the wall of the tray if it is above the bubble point. In this start-up, it is observed that trays reach bubble point before the condensed liquid fills the trays completely. Since there is no liquid flow from downcomers, vapor flow is dominant, as shown in Figure 6C. At this point, the column is operated optimally without any withdrawals. The optimization problem is as follows:
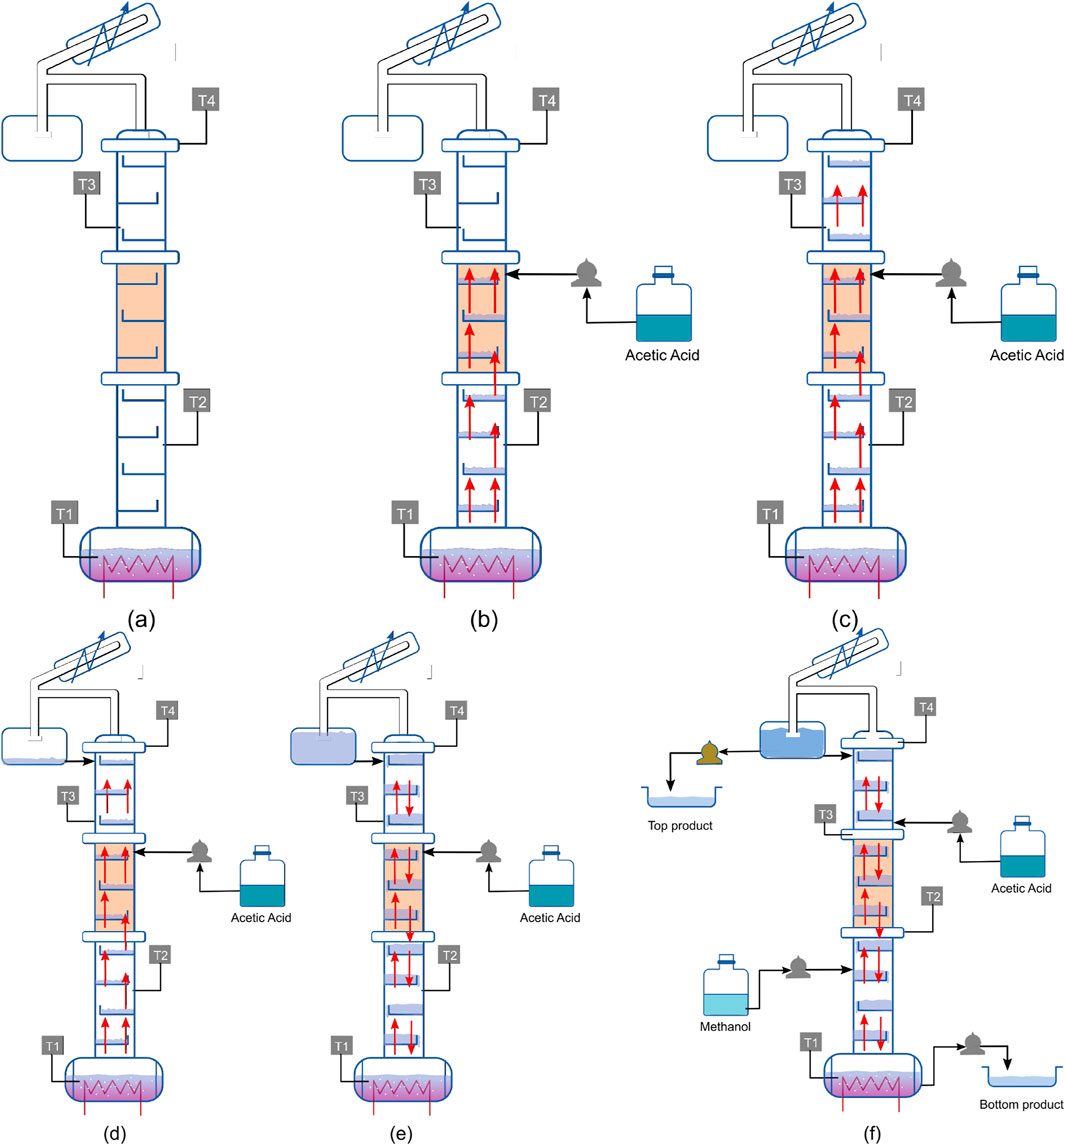
Figure 6. Visualization of optimal start-up policy: (a) Methanol charged to the reboiler; (b) Initiation of continuous acetic acid feed when vapor reaches the top of the reactive zone; (c) Vapor reaches top of the column; (d) Internal reflux starts; (e) Column is filled and VLE is established; (f) Continuous feed inlet and product withdrawal.
subject to constraints:
where,
Internal reflux and the heat duty of the reboiler act as decision variables to fill the column so that maximum reaction conversion occurs. Figure 6d represents the initiation of optimal operation with internal reflux starting to fill the partially filled trays.
The first term in the objective function minimizes the batch time. The other two terms ensure maximum conversion in this step. The term
Since most hazards occur during the start-up and shut-down phases, Step 1 operation is kept simple by keeping the reflux ratio
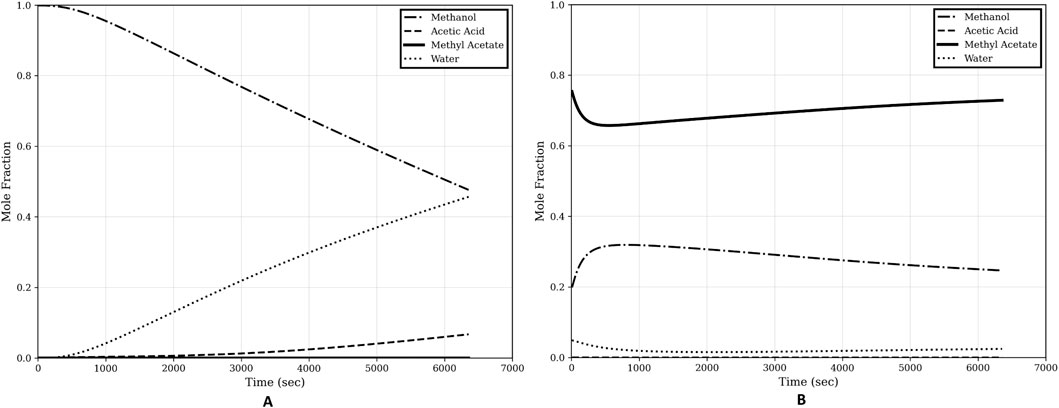
Figure 7. Composition profiles of step-1 of the optimal start-up procedure. (A) Bottom composition; (B) Top composition.
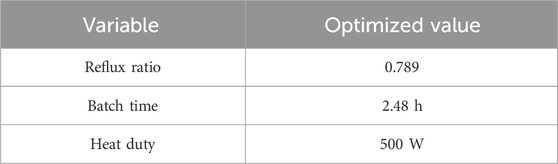
Table 5. Results of step-1 optimization.
3.2 Optimal policy for the step-2 of the start-up procedure
After completing step 1 of the optimal operation, which involves filling the trays and condenser as well as establishing vapor-liquid traffic, we begin a continuous feed of methanol. This is in addition to the ongoing continuous feed of acetic acid, along with withdrawals from both the top and bottom, as illustrated in Figure 6f. At this stage, the optimal reflux ratio profile is obtained to achieve the desired composition in the minimum time while maintaining constant heat duty, by solving the following problem:
subject to constraints
where,
The values of the constraints have been obtained from the experimentally achieved steady state, reported in Table 1.
Composition profiles of the top and the bottom, and optimal reflux profile are shown in Figures 8, 9 respectively.
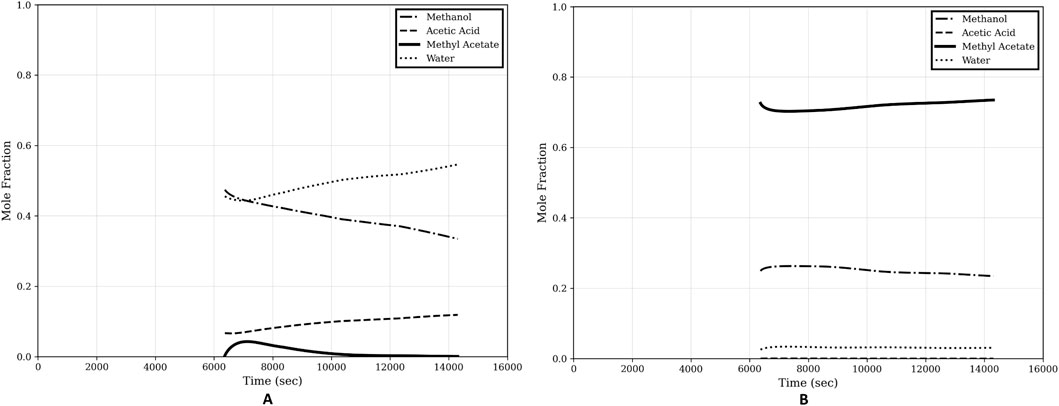
Figure 8. Composition profiles of step-2 of the optimal start-up procedure. (A) Bottom composition; (B) Top composition.
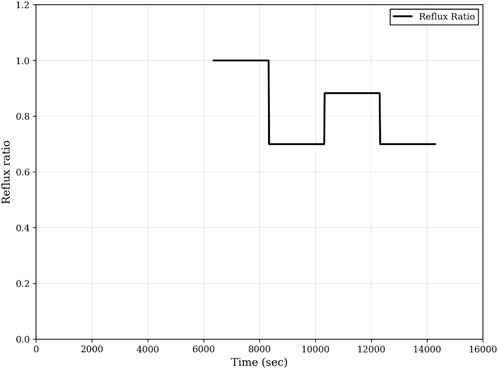
Figure 9. Internal reflux ratio profile for step-2 of optimal start-up procedure.
The steady state is achieved in approximately 4.5 h. This is much shorter than the traditional operation, which takes 12.5 h to reach the steady-state, as reported in Section 2.
Figure 10 shows the overall composition profiles of the bottom and the top, respectively.
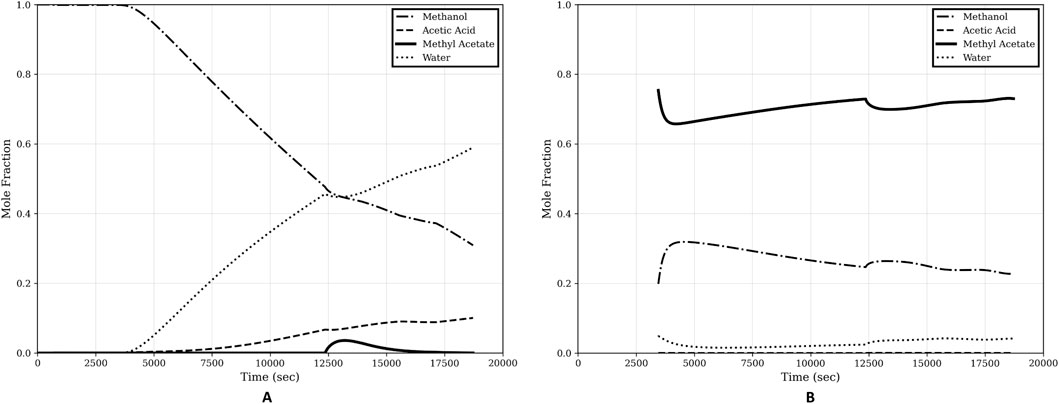
Figure 10. Overall composition profiles of start-up procedure. (A) Bottom composition; (B) Top composition.
4 Life cycle assessment
In this section, LCA is compared for both traditional and optimal start-up. The system boundary is cradle-to-gate, encompassing all relevant upstream and on-site processes required to initiate and achieve steady-state operation in the methanol esterification system. The primary objective is to evaluate and compare the environmental performance of different startup strategies, particularly focusing on the energy and emissions associated with the transition phase from process initiation to steady-state production. The included processes are as follows:
The functional focus of this study is the startup phase, including three stages as described by Ruiz et al. (1988), defined as the operational period between system activation and attainment of steady-state thermodynamic and compositional profiles in the distillation column. Two startup scenarios, described in Section 2 and Section 3 as traditional and optimal start-up, are analyzed. The following processes are excluded from the system boundary:
This boundary delineation enables a focused comparison of environmental impacts from startup strategies, isolating transient operational improvements from steady-state production behavior.
4.1 Goal and scope
The goal of this LCA is to evaluate and compare the environmental impacts of the startup phase of a methanol esterification process under two operational strategies: a traditional 12.5-h startup and an optimized 4.5-h startup. The findings are intended to support process optimization decisions and promote more sustainable startup practices in industrial chemical operations.
The functional unit is defined as the achievement of steady-state operation, capturing all material and energy flows necessary to transition the system from cold start to stable production. This study adopts a cradle-to-gate system boundary, including feedstock production (methanol and acetic acid), energy use (electricity and thermal), and unit operations involved in startup, namely, the reboiler, distillation column, and condenser as shown in Figure 11. Further details on system assumptions, exclusions, and modeling framework are presented in subsequent sections.

Figure 11. Goal and scope of study for the system.
4.2 Life cycle inventory
The life cycle inventory (LCI) for the startup phase of the methanol esterification process is constructed by analyzing unit-wise energy and material flows. The system is disaggregated into three primary operational segments: reboiler, tray/packed column, and condenser. Each unit’s resource demands during the startup period are quantified separately for the baseline (traditional) and optimal configurations.
4.2.1 Reboiler
The reboiler is a central component of the esterification startup system, supplying the thermal energy required to initiate vapor-liquid equilibrium and begin reactive distillation. During the startup phase, this unit consumes chemical feedstocks and energy inputs critical to process performance.
In the traditional startup configuration, the reboiler receives 4.84 kg of methanol and 9.07 kg of acetic acid as initial feed. These reagents are introduced in predefined stoichiometric proportions to initiate the esterification reaction. The reboiler is also responsible for generating sufficient thermal energy to drive phase change and maintain column operation. The total heat duty for this stage is
The process conditions are modified to enhance startup efficiency in the optimal startup configuration. The reboiler is fed with 9.612 kg of methanol, while no fresh acetic acid is introduced during this phase. The absence of acetic acid suggests a possible modification in feed sequencing, such as delayed acid injection or internal recycle of unreacted components. The total reboiler heat duty in this case is
4.2.2 Column section
The distillation column in the methanol esterification system serves as both a separation and reactive zone, facilitating the simultaneous reaction of methanol with acetic acid and the removal of the resulting ester product. A packed column configuration is employed in both the traditional and optimal systems to provide an extended contact area between the liquid and vapor phases, enhancing mass transfer efficiency. A fixed bed of Amberlyst-15, a strongly acidic ion exchange resin, is used as the heterogeneous catalyst, with 200 gm of catalyst packed into the reactive section of the column. The catalyst remains in place throughout the operation and does not contribute to input or output flows but plays a crucial role in the esterification reaction kinetics.
In the traditional startup configuration, the distillation column consumes 2.088 kg of methanol and 4.65076 kg of acetic acid during the transient phase leading up to steady-state operation. These values represent feed material input specific to the column section during the 12.5-h startup window. In addition to material flows, fluid pump operation supports column circulation, reflux control, and feed delivery, resulting in an electricity demand of 1304.98 W-hours (Wh).
In the optimal configuration, the startup duration is reduced to 4.5-h, and the associated feed material requirements are correspondingly lower. During this period, the methanol input to the column is 0.42804 kg, and the acetic acid input is 1.7613 kg. Electrical consumption by the pumps in this configuration is also reduced to 340.33 Wh, reflecting changes in fluid volume, operating time, or flow dynamics during startup.
4.2.3 Condenser
The condenser unit plays a critical role during the startup phase of reactive distillation by facilitating the condensation of overhead vapors and establishing the internal reflux ratio necessary for column stabilization. Effective condenser performance ensures that vaporized reactants and products are returned to the column, maintaining separation efficiency and supporting consistent reactive conditions.
In the traditional startup configuration, the total cooling energy required by the condenser during the 12.5-h startup period is approximately
In the optimal startup configuration, the condenser is operated over a reduced startup window of 4.5 h. During this period, the cooling duty is measured at
All values reported are based on process simulation results and engineering calculations specific to the startup phase and do not include steady-state operation. The corresponding inventory entries are compiled in Table 6.
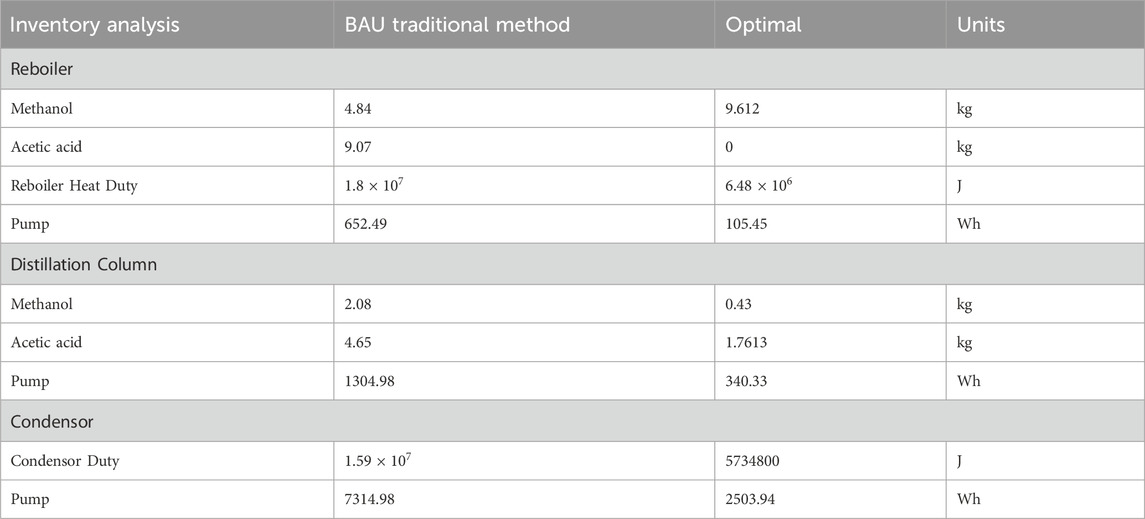
Table 6. Inventory analysis for traditional and optimal.
To ensure a consistent and fair comparison between the traditional and optimized startup scenarios, the impact of the Amberlyst-15 catalyst is also excluded from the LCI. This is justified by the fact that both systems utilize the same quantity (200 g) of catalyst under identical operating conditions, and the catalyst remains unchanged throughout the startup phase. Likewise, the distillation column hardware specifications, including column dimensions, internals, and packing configuration, are identical in both configurations. As such, any embedded emissions or performance variations related to equipment design are normalized across both scenarios and not considered in the impact calculations.
The LCA was conducted using openLCA version 2.1, with background data sourced from the ecoinvent 3.11 database. Where Indian context-specific data were unavailable, Rest-of-World (RoW) datasets were used to complete the inventory.
Environmental impacts were evaluated using the ReCiPe 2016 Midpoint (H) method, covering 18 impact categories under the hierarchist perspective, which is widely accepted in LCA literature (Huijbregts et al., 2016). Midpoint indicators were prioritized due to their lower uncertainty relative to endpoint metrics (Bare et al., 2000).
To ensure comparability, both scenarios used identical equipment specifications, Amberlyst-15 catalyst (200 g), and column design. The study complies with ISO 14040 and 14,044 standards, and emphasizes the importance of modeling the transient startup phase, often neglected in traditional LCAs, to better reflect real-world environmental performance in chemical processes.
4.3 Impact assessment
This section presents the environmental impact assessment of the methanol esterification process under two startup configurations: the traditional 12.5-h startup and the optimal 4.5-h startup. The analysis evaluates both scenarios individually using the ReCiPe 2016 Midpoint (H) methodology and concludes with a comparative assessment to quantify improvements and highlight key environmental trade-offs.
4.3.1 Environmental impact assessment of the traditional startup process
LCA reveals substantial environmental burdens attributable to prolonged transient operations, which are energy and resource-intensive in nature. Among the assessed impact categories, the most significant is climate change, with a total emission of 51.26 kg
Human toxicity is another prominent category, with a total of 23.06 kg 1,4-dichlorobenzene (1,4-DCB) equivalents. Most of this impact arises from upstream chemical synthesis processes, particularly those involving volatile organic compounds (VOCs), solvent manufacturing, and emissions linked to catalyst and solvent handling during startup. Fugitive emissions, thermal degradation of reagents, and minor leaks under elevated temperatures may also contribute to these values during early-stage operations.
Ecological toxicity impacts are observable but lower in absolute magnitude. Freshwater and marine ecotoxicity values are reported as 0.67 and 0.57 kg 1,4-DCB-eq, respectively. These effects are largely due to trace emissions of hazardous organic intermediates and heavy metals from upstream refining and chemical processes, and potential losses from off-spec product venting during column stabilization. Similarly, metal depletion, measured at 1.70 kg iron-equivalent, can be attributed to the material intensity of producing and transporting metallic components such as process-grade aluminium and steel for utilities, infrastructure, and catalyst support materials. Water depletion, recorded at 0.18 cubic meters, arises from the combined water demand of chemical manufacturing, steam generation, and utility systems associated with the energy supply.
Air pollution-related categories, including terrestrial acidification and particulate matter formation, are also noteworthy. The startup process results in 0.33 kg sulfur dioxide-equivalent emissions due to acidifying precursors such as NOx and SOx, primarily from electricity production. Photochemical oxidant formation, recorded at 0.188 kg non-methane VOC-equivalents, is indicative of potential smog formation linked to methanol evaporation and unreacted volatile compounds released during early feed injection.
Other impact categories, such as ionizing radiation (3.80 kg U235-eq), reflect the background energy mix used to model the electricity supply, which includes nuclear power. Land occupation impacts, including
The traditional startup configuration presents a high environmental burden across multiple LCI categories. The prolonged 12.5-h startup duration intensifies cumulative material and energy flows, which are reflected in elevated global warming, fossil depletion, and human toxicity impacts. These outcomes are consistent with the known inefficiencies of chemical process startup, wherein large quantities of thermal and electrical energy are required to stabilize reactive and separation units under non-steady-state conditions.
The high thermal demand of the reboiler, combined with the continuous operation of pumps and the need for extensive cooling through the condenser, results in elevated electricity consumption and related emissions. Moreover, the large mass flow of reactants such as methanol and acetic acid during startup, some of which may be lost or degraded before product quality stabilization, are a further source of upstream environmental pressure. These raw materials have energy and emissions-intensive production pathways, compounding their ecological footprint when used inefficiently.
These results underscore the importance of addressing transient operational phases in life cycle assessments. They also highlight the potential environmental gains achievable through startup optimization. In the subsequent section, the optimized configuration, featuring a reduced startup time of 4.5-h, is analyzed using the same framework, directly comparing environmental performance across all midpoint impact categories.
4.3.2 Environmental impact assessment of the optimal start-up process
The optimal startup configuration for the methanol esterification process incorporates several process modifications aimed at reducing the duration of the startup phase from 12.5 h to 4.5 h. This reduction directly affects the quantity of thermal energy supplied to the reboiler, the electricity consumed by auxiliary pumps, and the feedstock required to reach steady-state operation. The same ReCiPe 2016 Midpoint (H) methodology is applied to this configuration, enabling direct comparison with the traditional baseline system across all environmental midpoint indicators. The impact assessment results for the optimal startup are summarized in Table 7. Overall, the optimal configuration exhibits consistently lower environmental burdens across all 18 midpoint categories. These reductions can be traced to diminished energy consumption, shorter operating time, and reduced feed loss during the transient phase.
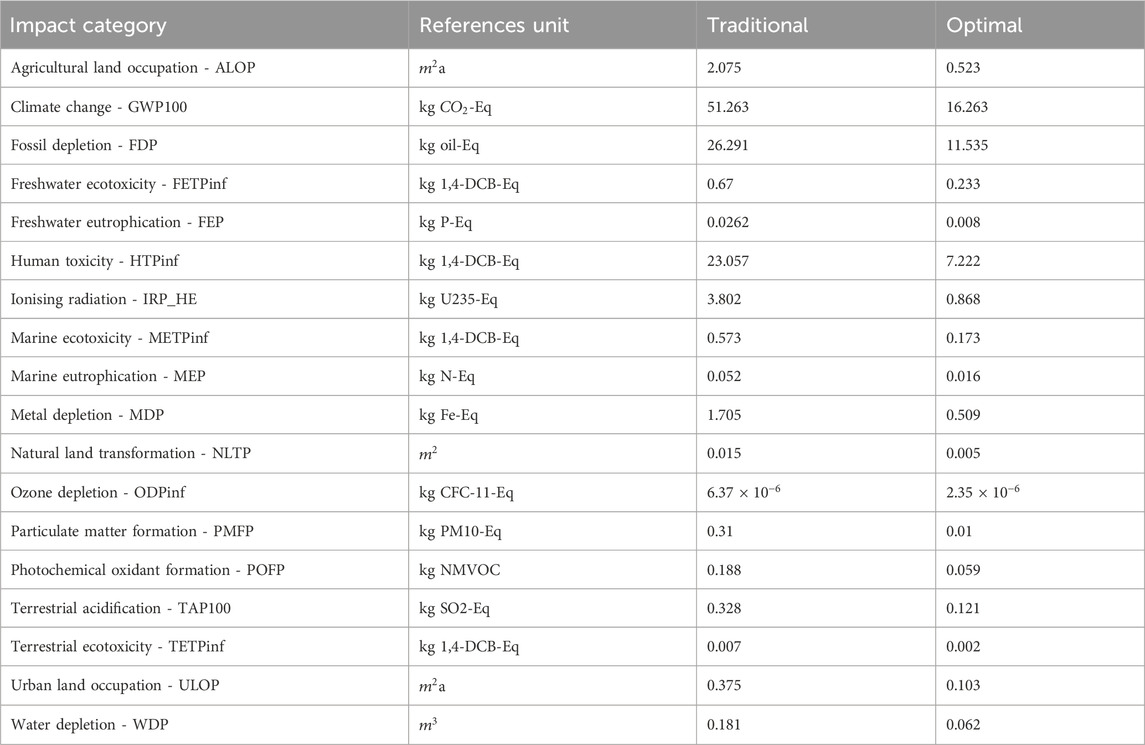
Table 7. Impact assessment comparison for traditional and optimal start-up.
One of the most prominent reductions is observed in the climate change impact category (GWP100), which decreases to 16.26 kg
With respect to air quality and acidification-related categories, the optimal startup records 0.0995 kg of PM10-equivalent in particulate matter formation and 0.0588 kg NMVOC for photochemical oxidant formation. These categories are sensitive to combustion-related emissions and volatile feed losses, which are diminished in the shorter, more controlled startup scenario. The terrestrial acidification potential, primarily influenced by emissions of sulfur dioxide and nitrogen oxides during energy production, is recorded at 0.1210 kg
Land use and ionizing radiation impacts are also reduced in the optimal system. Agricultural land occupation decreases to
The LCI data presented in Table 6 indicates that the reboiler is the dominant hotspot in both the traditional and optimized startup configurations. In the conventional strategy, the reboiler heat duty reaches
These results demonstrate that the optimal startup configuration exhibits reduced environmental burdens across all impact categories assessed as shown in Table 7. The lower values are directly tied to reduced thermal and electrical energy requirements, shortened operating time, and more efficient utilization of feedstocks, particularly methanol and acetic acid. By improving startup control and process integration, the system achieves material and energy savings that extend upstream, thereby lowering life cycle impacts associated with raw material production, emissions, and resource depletion.
The radar chart shown in Figure 12 illustrates a multi-criteria comparison of environmental impacts between the traditional and optimal start-up scenarios, focusing on six key impact categories. The optimal scenario achieves notable reductions in all selected indicators, with the most significant improvement observed in freshwater eutrophication (FEP, 94%), followed by ionising radiation (IRP_HE, 77%) and agricultural land occupation (ALOP, 75%). Substantial decreases are also achieved in climate change potential (GWP100, 68%), water depletion (WDP, 66.0%), and fossil depletion (FDP, 56%). In all cases, the optimal scenario’s polygon lies well within that of the traditional scenario, indicating consistently lower impacts. This performance demonstrates the optimal start-up’s potential as a more sustainable alternative, offering strong benefits in climate mitigation, resource conservation, and ecosystem protection.
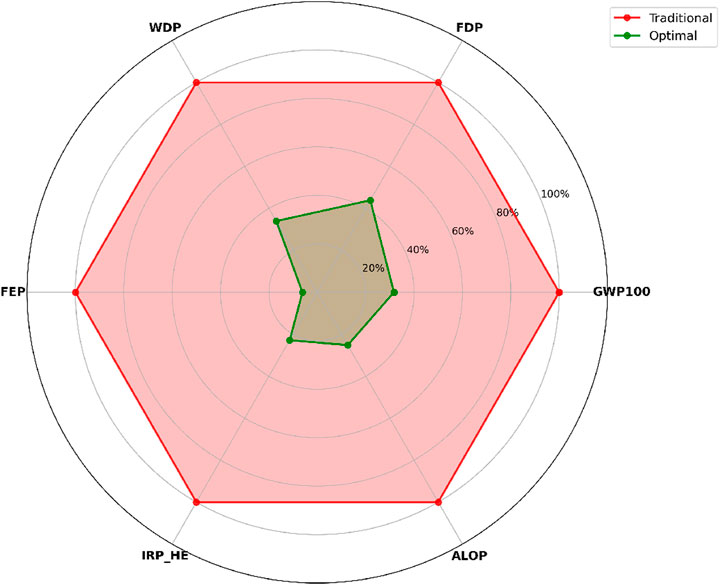
Figure 12. Multi-criteria environmental impact assessment comparing traditional and optimal start-up scenarios across six key categories: Water Depletion (WDP), Fossil Depletion (FDP), Climate Change Potential (GWP100), Agricultural Land Occupation (ALOP), Ionising Radiation (IRP_HE), and Freshwater Eutrophication (FEP). Taditional values are normalized to 100% (outer red polygon), while optimal values (inner green polygon) indicate the relative performance. Values closer to the center represent lower environmental impact, confirming the superior sustainability performance of the optimal scenario.
The following section provides a comparative discussion of both startup configurations to quantify relative environmental performance and examine implications for sustainable process design and operational strategy.
5 Comparative discussion and insights of LCA studies
This section deals with a comparative assessment between traditional and optimized startup configurations.
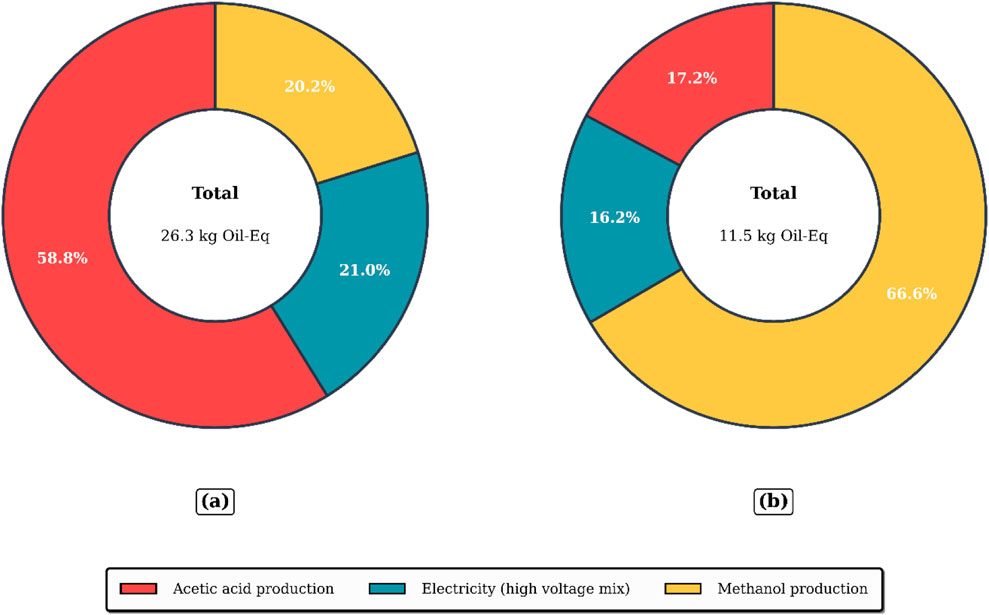
Figure 13. Comparative fossil depletion impact (a) Traditional start-up (b) Optimized start-up.
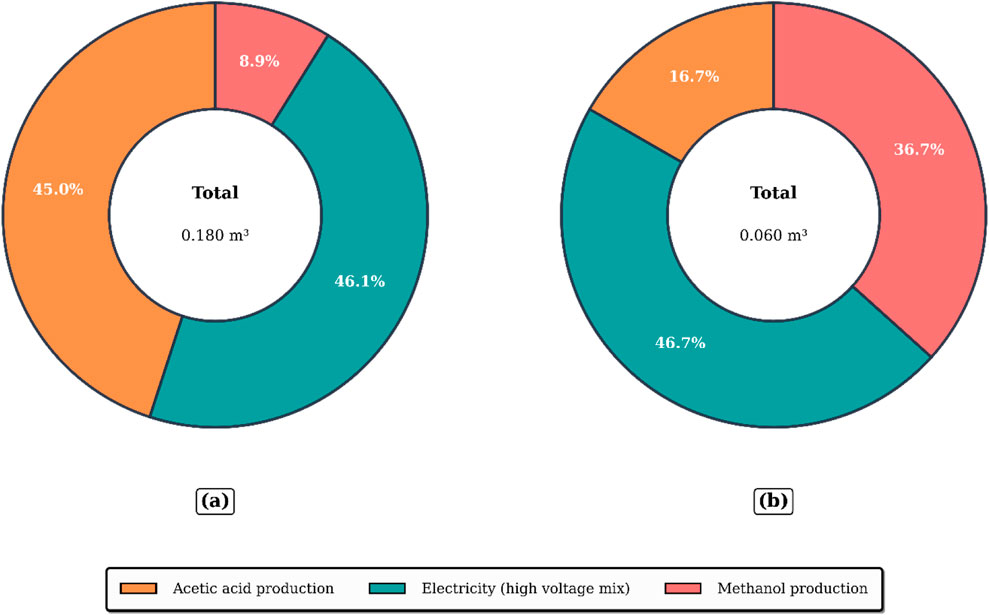
Figure 14. Comparative water depletion impact (a) Traditional startup (b) Optimized startup.

Figure 15. Comparative climate change impact (GWP100) impact (a) Traditional startup (b) Optimized startup.
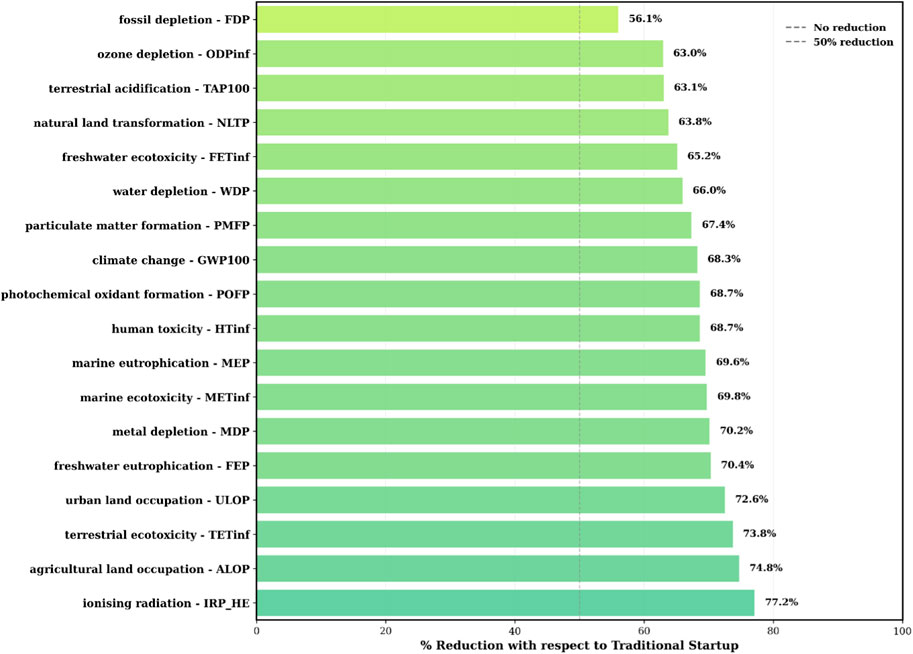
Figure 16. Environmental impact reduction chart for optimized start-up with reference to traditional start-up.
These findings have important implications for the broader integration of sustainability principles in chemical manufacturing. Life cycle assessments that exclude dynamic process behavior may underestimate total emissions and misrepresent the environmental efficiency of a system. Incorporating transient phases, particularly in systems with frequent operational changes, can improve the accuracy of impact evaluations and help align them with real-world process conditions. Moreover, the improvements demonstrated here support ongoing industry trends toward process intensification, advanced control systems, and resource minimization. Enhanced startup protocols, combined with predictive control and real-time monitoring, have the potential to improve both environmental and operational performance. The integration of digital tools such as dynamic simulation, digital twins, and lifecycle modeling platforms could further support continuous improvement and emissions reduction targets under evolving regulatory and market-based frameworks.
From a sustainability perspective, the optimized startup strategy developed in this study represents an important step toward decarbonizing reactive-separation processes. Cutting the transient period from 12.5 h to 4.5 h yields pronounced reductions in climate-change potential (68%), fossil depletion (56%), and water depletion (67%), confirming that short, well-controlled startups can mitigate the hidden environmental burdens that accumulate during frequent plant transitions. The results align with industrial decarbonization roadmaps and directly support United Nations SDG 12 (Responsible Consumption and Production) and SDG 13 (Climate Action) by lowering energy demand and raw-material losses while maintaining product quality. To amplify these gains, three future directions are proposed. (i) Renewable-energy integration: coupling the reboiler and condenser loads to on-site solar or biomass-based steam could eliminate grid-related emissions that remain the dominant contributors after optimization. (ii) Digital-twin–enabled predictive control: real-time monitoring of temperature, holdup, and composition combined with machine-learning surrogates trained on the validated dynamic model, can further shorten startups, prevent off-spec batches, and provide continuous LCA feedback for operators. (iii) Circular feedstock strategies: implementing internal recovery loops for methanol and valorizing by-products as secondary raw materials would close material cycles and reduce upstream impacts even at steady state. Collectively, these measures would transform the optimized startup protocol into a fully sustainable, low-impact operational paradigm that meets forthcoming regulatory pressures while enhancing economic resilience through energy and material savings.
6 Conclusion
This study presents a comprehensive approach to modeling, optimizing, and assessing the environmental performance of the startup phase in a reactive distillation (RD) system for methanol esterification. The novelty of this work is the detailed analysis of the discontinuous phase of operation during the start-up, resulting in an evolving structure of model equations as the trays of the distillation column start functionally participating in the process. This approach has been validated with experimental studies. The traditional startup strategy, requiring 12.5 h to reach steady-state, is reduced to 4.5 h with the help of the rigorous models and the optimal start-up policy. This results in 64% reduction in transient operation duration. In addition to operational enhancements, the study also quantified the environmental benefits of the optimal configuration through a cradle-to-gate LCA. Results demonstrated substantial reductions across all impact categories in the optimal startup scenario. Key impacts include 68% reduction in global warming potential (GWP100), 56% reduction in fossil depletion, 67% reduction in water depletion. These benefits were attributed not only to lower energy and electricity requirements but also to a reduction in raw material losses, notably the elimination of acetic acid feed during startup in the optimal case. The environmental performance gains illustrate the broader importance of considering transient phases in LCA models, particularly for systems that undergo frequent startups and shutdowns due to maintenance, cleaning, or product switching. The findings are of practical significance to chemical manufacturing industries where energy-intensive startup operations represent a hidden environmental burden. The proposed optimization framework offers a low-cost, high-impact strategy for improving both operational efficiency and sustainability metrics. Moreover, this approach complements broader decarbonization and process intensification goals, supporting alignment with ISO 14040/44 standards. The rigorous model developed can also be deployed as a digital twin of the process that can be used for real-time performance monitoring of the process. Future work can extend this methodology to other RD systems and hybrid separation processes, integrate techno-economic analysis (TEA) to assess cost-benefit trade-offs, and explore digital twin-based real-time optimization for adaptive and intelligent startup control. By addressing the often-overlooked startup phase, this study contributes to more complete and realistic environmental evaluations in chemical process design and operation.
Data availability statement
The original contributions presented in the study are included in the article/Supplementary Material, further inquiries can be directed to the corresponding author.
Author contributions
NS: Methodology, Investigation, Validation, Formal Analysis, Data curation, Software, Writing – original draft, Conceptualization. ShS: Formal Analysis, Data curation, Methodology, Conceptualization, Investigation, Writing – original draft, Software. KM: Visualization, Supervision, Project administration, Funding acquisition, Resources, Formal Analysis, Writing – review and editing. SuS: Writing – review and editing, Supervision.
Funding
The author(s) declare that financial support was received for the research and/or publication of this article. The authors thank the National Mission on Education through ICT, Ministry of Education, Government of India, for funding this work through the FOSSEE project at IIT Bombay.
Acknowledgments
The authors thank the Ministry of Education (previously MHRD), Government of India, for funding this work through the FOSSEE project at IIT Bombay.
Conflict of interest
Author SS was employed by ModeliCon InfoTech LLP.
The remaining authors declare that the research was conducted in the absence of any commercial or financial relationships that could be construed as a potential conflict of interest.
Generative AI statement
The author(s) declare that Generative AI was used in the creation of this manuscript. During the preparation of this work the authors used ChatGPT (OpenAI) in order to improve the language of the paper. After using this tool/service, the authors reviewed and edited the content as needed and take full responsibility for the content of the published article.
Any alternative text (alt text) provided alongside figures in this article has been generated by Frontiers with the support of artificial intelligence and reasonable efforts have been made to ensure accuracy, including review by the authors wherever possible. If you identify any issues, please contact us.
Publisher’s note
All claims expressed in this article are solely those of the authors and do not necessarily represent those of their affiliated organizations, or those of the publisher, the editors and the reviewers. Any product that may be evaluated in this article, or claim that may be made by its manufacturer, is not guaranteed or endorsed by the publisher.
Supplementary material
The Supplementary Material for this article can be found online at: https://www.frontiersin.org/articles/10.3389/fceng.2025.1628799/full#supplementary-material
References
Bare, J. C., Hofstetter, P., Pennington, D. W., and De Haes, H. A. U. (2000). Midpoints versus endpoints: the sacrifices and benefits. Int. J. Life Cycle Assess. 5, 319–326. doi:10.1007/bf02978665
Bisowarno, B. H., and Tadé, M. O. (2000). Dynamic simulation of startup in ethyl tert-butyl ether reactive distillation with input multiplicity. Industrial and Eng. Chem. Res. 39, 1950–1954. doi:10.1021/ie9906417
Chen, H., Li, X., He, L., and Cong, H. (2020). Energy, exergy, economic, and environmental analysis for methyl acetate hydrolysis process with heat integrated technology used. Energy Convers. Manag. 216, 112919. doi:10.1016/j.enconman.2020.112919
Forner, F., Brehelin, M., Rouzineau, D., Meyer, M., and Repke, J.-U. (2008). Startup of a reactive distillation process with a decanter. Chem. Eng. Process. Process Intensif. 47, 1976–1985. doi:10.1016/j.cep.2007.09.005
Hellweg, S., and Milà i Canals, L. (2014). Emerging approaches, challenges and opportunities in life cycle assessment. Science 344, 1109–1113. doi:10.1126/science.1248361
Hoffmann, C., Weigert, J., Esche, E., and Repke, J.-U. (2020). A pressure-driven, dynamic model for distillation columns with smooth reformulations for flexible operation. Comput. and Chem. Eng. 142, 107062. doi:10.1016/j.compchemeng.2020.107062
Huijbregts, M. A., Steinmann, Z. J., Elshout, P. M., Stam, G., Verones, F., Vieira, M., et al. (2016). Recipe 2016: a harmonized life cycle impact assessment method at midpoint and endpoint level report i: characterization
Im-Orb, K., Arpornwichanop, A., and Simasatitkul, L. (2021). Process intensification approach for design and optimization of biodiesel production from palm fatty acid distillate. Biotechnol. Rep. 30, e00622. doi:10.1016/j.btre.2021.e00622
Lai, I.-K., Liu, Y.-C., Yu, C.-C., Lee, M.-J., and Huang, H.-P. (2008). Production of high-purity ethyl acetate using reactive distillation: experimental and start-up procedure. Chem. Eng. Process. Process Intensif. 47, 1831–1843. doi:10.1016/j.cep.2007.10.008
Lopez, R., and Flores, A. (2007). Optimal start-up and product transition policies of a reactive distillation column. Industrial and Eng. Chem. Res. 46, 2092–2111. doi:10.1021/ie061312z
Powell, M. J. (1994). A direct search optimization method that models the objective and constraint functions by linear interpolation. Springer.
Quarshie, A. W., Swartz, C. L., Cao, Y., Wang, Y., and Flores-Cerrillo, J. (2023). Dynamic optimization of multiproduct cryogenic air separation unit startup. Industrial and Eng. Chem. Res. 62, 10542–10558. doi:10.1021/acs.iecr.3c00578
Reepmeyer, F., Repke, J.-U., and Wozny, G. (2003). Analysis of the start-up process for reactive distillation. Chem. Eng. and Technol. Industrial Chemistry-Plant Equipment-Process Engineering-Biotechnology 26, 81–86. doi:10.1002/ceat.200390012
Reepmeyer, F., Repke, J.-U., and Wozny, G. (2004). Time optimal start-up strategies for reactive distillation columns. Chem. Eng. Sci. 59, 4339–4347. doi:10.1016/j.ces.2004.06.029
Ruiz, C. A., Cameron, I., and Gani, R. (1988). A generalized dynamic model for distillation columns—iii. study of startup operations. Comput. and Chem. Eng. 12, 1–14. doi:10.1016/0098-1354(88)85001-4
Sharma, N., Moudgalya, K. M., and Shah, S. (2024). Variable structure simulation and optimization of start-up of batch distillation columns. Comput. Aided Chem. Eng. (Elsevier) 53, 1009–1014. doi:10.1016/b978-0-443-28824-1.50169-1
Tang, Y.-T., Chen, Y.-W., Huang, H.-P., Yu, C.-C., Hung, S.-B., and Lee, M.-J. (2005). Design of reactive distillations for acetic acid esterification. AIChE J. 51, 1683–1699. doi:10.1002/aic.10519
Vahidi Ferdowsi, M., Fanaei, M. A., and Karimpour, A. (2023). Providing a practical method for automatic start-up of reactive distillation column using decentralized control of cvs trajectory based on residue curve maps (rcm) analysis: the methyl acetate case. Iran. J. Chem. Chem. Eng. Res. Article 42.
Waibel, Y., Ränger, L.-M., Fischer, M., and Grützner, T. (2024). The start-up of a multiple dividing wall column–a theoretical and experimental study. Chem. Eng. Processing-Process Intensif. 201, 109798. doi:10.1016/j.cep.2024.109798
Wu, H.-X., Tang, Z.-G., Gao, H.-B., Hu, H., Lu, X.-C., and Li, S.-Y. (2006a). Effects of liquid holdup in condensers on the start-up of reactive distillation columns. Chem. Eng. and Technol. Industrial Chemistry-Plant Equipment-Process Engineering-Biotechnology 29, 1316–1322. doi:10.1002/ceat.200600030
Wu, H.-X., Tang, Z.-G., Hu, H., Quan, C., Song, H.-H., and Li, S.-Y. (2006b). Predictions for start-up processes of reactive distillation column via artificial neural network. Chem. Eng. and Technol. Industrial Chemistry-Plant Equipment-Process Engineering-Biotechnology 29, 744–749. doi:10.1002/ceat.200500345
Yang, A., Su, Y., Sun, S., Shen, W., Bai, M., and Ren, J. (2022a). Towards sustainable separation of the ternary azeotropic mixture based on the intensified reactive-extractive distillation configurations and multi-objective particle swarm optimization. J. Clean. Prod. 332, 130116. doi:10.1016/j.jclepro.2021.130116
Yang, A., Wang, W., Sun, S., Shi, T., Ren, J., Bai, M., et al. (2022b). Sustainable design and multi-objective optimization of eco-efficient extractive distillation with single and double entrainer (s) for separating the ternary azeotropic mixture tetrahydrofuran/ethanol/methanol. Sep. Purif. Technol. 285, 120413. doi:10.1016/j.seppur.2021.120413
Keywords: LCA, reactive distillation, start-up simulation, optimal start-up, variable structure modeling
Citation: Sharma N, Sonkusare S, Moudgalya KM and Shah S (2025) Greening the start-up of reactive distillation: A combined experimental and LCA study from cold and empty state. Front. Chem. Eng. 7:1628799. doi: 10.3389/fceng.2025.1628799
Received: 14 May 2025; Accepted: 21 August 2025;
Published: 17 September 2025.
Edited by:
Siang-Piao Chai, Monash University Malaysia, MalaysiaReviewed by:
Cher Pin Song, Monash University Malaysia, MalaysiaAdrian Chun Minh Loy, The University of Melbourne, Australia
Copyright © 2025 Sharma, Sonkusare, Moudgalya and Shah. This is an open-access article distributed under the terms of the Creative Commons Attribution License (CC BY). The use, distribution or reproduction in other forums is permitted, provided the original author(s) and the copyright owner(s) are credited and that the original publication in this journal is cited, in accordance with accepted academic practice. No use, distribution or reproduction is permitted which does not comply with these terms.
*Correspondence: Kannan M. Moudgalya, a2FubmFuQGlpdGIuYWMuaW4=