 Lindsay E. Johnson
 Hatim M. E. Geli
 Michael J. Hayes
 Kelly Helm Smith
- 1School of Natural Resources, University of Nebraska, Lincoln, NE, United States
- 2Animal and Range Science Department, New Mexico State University, Las Cruces, NM, United States
- 3New Mexico Water Resources Institute, New Mexico State University, Las Cruces, NM, United States
- 4National Drought Mitigation Center, University of Nebraska, Lincoln, NE, United States
Drought is a familiar climatic phenomenon in the United States Southwest, with complex human-environment interactions that extend beyond just the physical drought events. Due to continued climate variability and change, droughts are expected to become more frequent and/or severe in the future. Decision-makers are charged with mitigating and adapting to these more extreme conditions and to do that they need to understand the specific impacts drought has on regional and local scales, and how these impacts compare to historical conditions. Tremendous progress in drought monitoring strategies has occurred over the past several decades, with more tools providing greater spatial and temporal resolutions for a variety of variables, including drought impacts. Many of these updated tools can be used to develop improved drought climatologies for decision-makers to use in their drought risk management actions. In support of a Food-Energy-Water (FEW) systems study for New Mexico, this article explores the use of updated drought monitoring tools to analyze data and develop a more holistic drought climatology applicable for New Mexico. Based upon the drought climatology, droughts appear to be occurring with greater frequency and magnitude over the last two decades. This improved drought climatology information, using New Mexico as the example, increases the understanding of the effects of drought on the FEW systems, allowing for better management of current and future drought events and associated impacts.
Introduction
Since 2000, 16 drought events classified as “Billion Dollar Disasters” have occurred across the United States (U.S.) according to a national web-based archive of these types of disasters for a variety of natural hazards (NOAA NCEI, 2020). The estimated economic losses from the 16 drought-specific events total $133.2 billion. These losses illustrate that drought is a key disaster that can have dramatic local and regional impacts across the U.S. Droughts are different from other hazards in that they can develop slowly, extend over large regions, and have a long duration, making it very difficult for officials to tally both the direct and indirect impacts that result (Ding et al., 2011). Because of their widespread and long-lasting nature, droughts also affect multiple sectors of a region's economy. Therefore, it is important to consider drought impacts when analyzing the dynamics of Food-Energy-Water (FEW) systems in a location.
The complex and costly impacts of the recent drought events across the U.S. highlight the need for a proactive drought risk management approach to help officials be better prepared for future drought events (Wilhite, 2018). Historically, most efforts of drought management have focused on responding to drought impacts after an event, which has often meant that these responses have been uncoordinated and untimely, and little is done to reduce potential impacts in the next events (Wilhite and Pulwarty, 2005; Wilhite et al., 2007). Drought risk management, however, places the attention on improving drought early warning, drought planning, and drought mitigation strategies that will hopefully reduce future drought impacts (Wilhite et al., 2014).
Drought early warning is often considered the foundation of successful drought risk management (Hayes et al., 2018). It consists of both the assessment of current conditions (or drought monitoring) as well as an outlook for future conditions. In the past several decades, there have been remarkable advancements in the capacity of early warning, particularly with new drought monitoring tools, remote sensing technologies, and improved understanding of oceanic-atmospheric interactions to assist with drought outlooks. The advancements have particularly highlighted the improved spatial and temporal resolutions that are now available with many of these tools (Hayes et al., 2012).
An important aspect of drought early warning is having a solid understanding of a location's drought climatology (i.e., historical drought events' frequency, magnitude, duration, and impacts), so that current and future drought conditions are placed into a proper historical perspective and impacts can be anticipated or projected based upon drought severity levels (Steinemann et al., 2015; Svoboda et al., 2015; Martin et al., 2020). Decision-makers often ask specific questions during a drought event that link to the climatology such as how the current severity compares with historical records, how often the current severity has occurred in the past, when was the last time the drought event was this severe, what impacts have occurred, and what does the past record indicate as to what can be expected ahead (Svoboda et al., 2002). These questions relate directly to the decision-makers' understanding drought and having access to drought climatologies. Timely answers with key information derived from an accurate drought climatology, especially when combined with real-time drought early warning information, provide powerful resources for decision-makers to use for improving drought response and drought risk management strategies.
Drought and Food-Energy-Water Systems of New Mexico, U.S.A
This analysis was conducted within the context of providing an improved understanding of how natural hazard events such as drought can affect the sustainability and resilience of New Mexico's FEW systems (Geli et al., 2017). This article thus highlights the value of an updated drought climatology for the state while also investigating the role drought (among other factors) has had, and will have, on the FEW systems across the state. New Mexico is specifically included in 11 of the Billion Dollar drought designations since 2000, and the three-year 2011–13 period that severely affected New Mexico had an estimated $59.6 billion of losses nationally from the direct and indirect impacts that occurred (NOAA NCEI, 2020). For New Mexico, drought impacts affect crop and livestock productivity (Sawalhah et al., 2019; Zaied et al., 2019, 2020; Gedefaw et al., 2020); water supplies for public and ecosystem consumption; human, animal, and wildlife health; forests and wildfires; and recreation and tourism. These sectors have also become more vulnerable to natural hazards (i.e., droughts and wildfires) given changes occurring in the climate (NMOSE and NMWRRI, 2018). Figure 1 is a time series that highlights drought has been a regular feature in New Mexico since the beginning of the U.S. Drought Monitor (USDM) record in 2000 (USDM, 2019), and the recent 2018–2019 drought reached the “extreme” (D3) and “exceptional” (D4) categories for parts of the state. In addition to this recent drought, parts of New Mexico were in the exceptional category during 2002, 2003–2004, 2006, 2011–2012, and 2013.
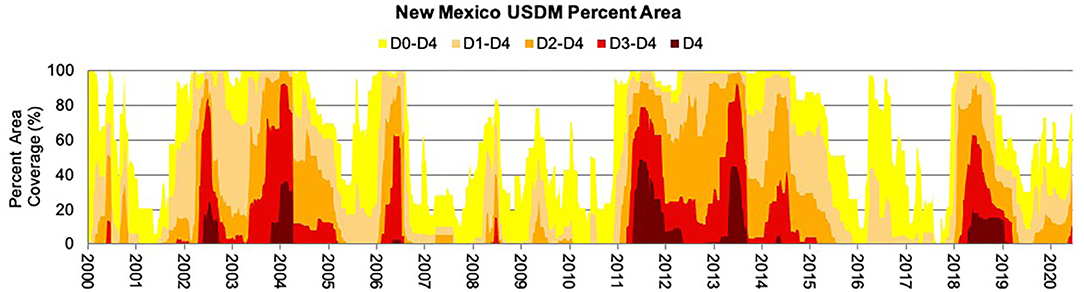
Figure 1. A time series of the weekly percent area of the USDM spatial coverage by severity category across New Mexico for the 2000–2020 period (NDMC, 2020). The colors represent the five USDM drought categories.
These recent droughts in New Mexico, and the availability of new drought early warning tools and information for use by decision-makers, emphasize the importance of building a strong drought climatology. This article provides a historical drought perspective for New Mexico within the context of providing an improved understanding of FEW systems response during drought, and how a drought climatology can potentially improve drought risk management. Updating the state's drought history is also important for using drought early warning information to establish a baseline that can also be helpful for multiple other applications, such as developing indicators and thresholds of resiliency for FEW systems monitoring shifts in the dynamic equilibrium of these systems, and can serve as a model (and provide guidelines) for other states and regions on how to update the drought climatology in their locations (Svoboda et al., 2015). The New Mexico case study will also support ongoing efforts in the state to evaluate the response of state's FEW systems under drought. FEW systems are extremely important for New Mexico because they are highly interconnected and they collectively support the well-being and livelihood of New Mexicans (Geli et al., 2017).
New Mexico is diverse in its topography, climate, and economic sectors. Its economy is driven by a number of principal sectors that include energy, agriculture, mining, and recreation (USDA NASS, 2018, 2019; NMDA, 2019; NMSU, 2019; USDA – FSA, 2020). The state has abundant land resources suitable for grazing of livestock and to some extent for crop production as well as large reserves of crude oil and natural gas.
However, the state is challenged by limited and variable water supplies that affect the sustainability of its interconnected FEW systems. The World Resources Institute (WRI, 2020), for example, identifies much of New Mexico in the “extremely high” category for current water quantity risks. This challenge is highlighted by the fact that the state of New Mexico has been in at least “Moderate Drought” (D1) for 999 weeks since January 2000 (93%), as designated by the USDM, more than any other state in the U.S. (USDM, 2020a).
Therefore, the goals of this article are to: (1) highlight how the availability of data and tools have rapidly advanced over the past two decades; (2) demonstrate how these data and tools can now be leveraged to build improved drought climatologies using a New Mexico example; and (3) illustrate how these drought climatologies can support drought risk management.
Data
Tremendous progress in drought early warning strategies has occurred over the past two decades, with more tools providing greater spatial and temporal resolution for a variety of variables, including drought impacts. For a considerable amount of time, the Palmer Drought Severity Index (PDSI) (Palmer, 1965) was nearly the only drought monitoring indicator available for decision-makers to use. The Standardized Precipitation Index (SPI) (McKee et al., 1993) was introduced as an indicator in the mid-1990s, and the USDM product was first available in 1999. These developments, and the increased availability of remote sensing data, were catalysts spurring the rapid growth of products that had both improving spatial and temporal resolutions. That growth continues today with the added capacity of mapping and spatial analysis through Geographic Information Systems (GIS), computing power, and online tools.
This influx of available drought early warning information and data, while advantageous, does come with a suite of corresponding limitations as well (Finnessey et al., 2016). For example, there can actually be so much climate and drought data, tools, and information available for decision-makers that it can be challenging to find the appropriate valid and reliable data to address the particular issue. This can lead to frustration when trying to understand drought information for either building a drought climatology or making current assessments of an evolving event. Because of the importance that decision-makers understand the available resources, Table 1 was developed to provide a comprehensive overview of key sources for climate and drought data that are now available to be used to build a drought climatology. As far as the authors are aware, no similar table exists in the literature and this table can serve as a valuable resource for decision makers.
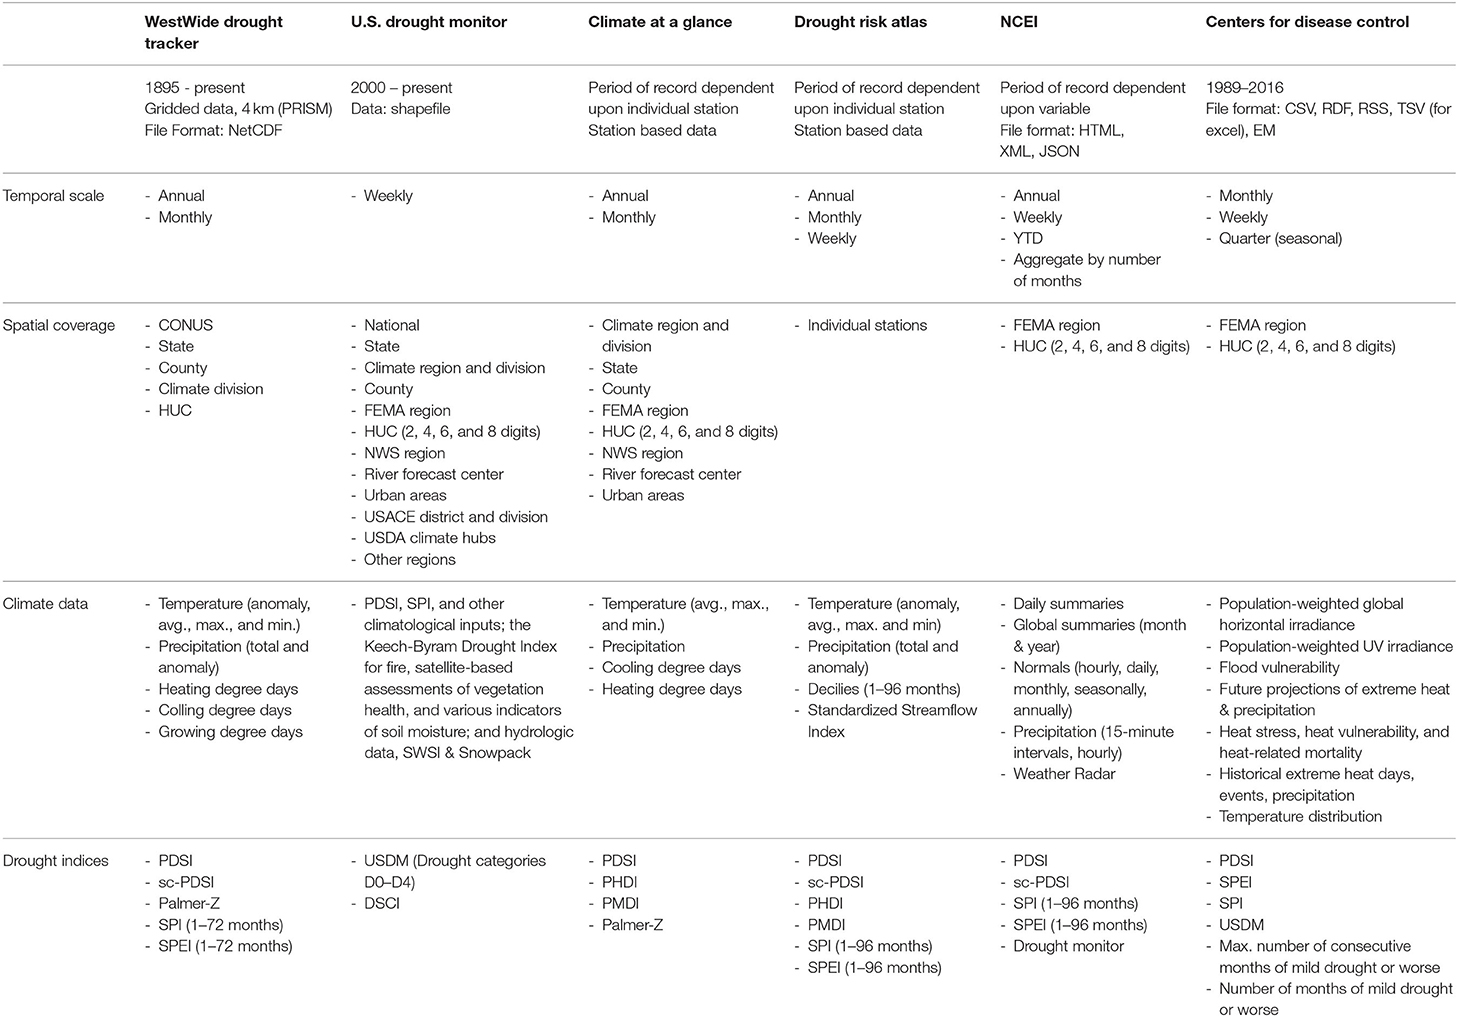
Table 1. Climate and drought data sources.
Enhancement of Existing Drought Monitoring Tools
There are a large number of drought and climate resources that are beneficial in drought monitoring and risk management. Many of the historically popular drought indices and indicators have been improved to incorporate new available data, temporal and spatial scales, and enhanced computing power. The U.S. Drought Monitor (USDM), Drought Risk Atlas (DRA), and Drought Impact Reporter (DIR) are three tools that are continually evolving in order to provide useful and robust data for scientists and decision-makers.
The U.S. Drought Monitor
In the U.S., one of the most widely-used drought monitoring tools is the U. S. Drought Monitor (NDMC, 2020). The USDM is a map-based assessment of drought intensity produced weekly since 1999. The assessment is made using a wide range of inputs representing the entire spectrum of the hydrological cycle, including real-time climate, water, and remotely-sensed data. The responsibility for the operational weekly updates of the product is a partnership between the National Drought Mitigation Center (NDMC), the U.S. Department of Agriculture (USDA), and the National Oceanic and Atmospheric Administration (NOAA) (NDMC, 2020). The product is also unique because it relies heavily on a continuous feedback process based on the interactions from a large number of climate and water experts from around the country (Svoboda et al., 2002). Figure 2 shows a USDM map for 2 October 2018 for New Mexico, which was a time when dryness or drought covered almost the entire state. Exceptional (D4) and extreme (D3) conditions covered northwest New Mexico. There was also extreme (D3) drought in the central Pecos River Basin. Figure 2 also provides a table with statistics related to the percent area of the state in each category of drought, as well as comparisons to what was being experienced in the state the previous week, 3 months ago, the beginning of the calendar year, the beginning of the “Water Year” or October 1, and 1 year ago. These are also the same types of questions that decision-makers might ask that are related to how a current drought compares with previous conditions readily understood by the decision-maker. The map and table in Figure 2, combined with the time series in Figure 1, can be highly valuable as part of a drought climatology and in helping to make drought-related decisions.
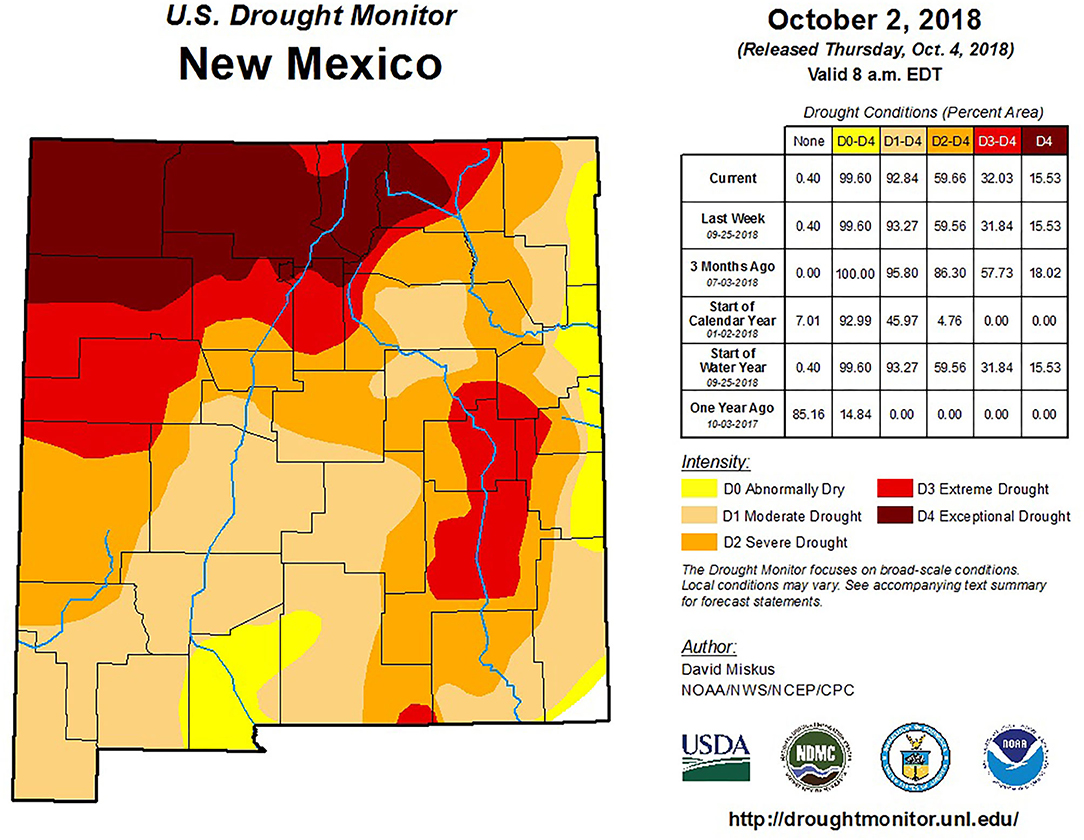
Figure 2. A USDM map of New Mexico for 2 October 2018 and an associated table with relevant statistics comparing the drought coverage with other past time periods (NDMC, 2020).
The USDM's website [http://droughtmonitor.unl.edu] and associated web-based tools include an archive of the weekly maps and a timeline product of the drought intensities for a variety of scales. The maps, data tables, and time series can also be produced at national, county, river basin, and several different climate-related scales. The USDM is used by several government agencies to trigger a variety of drought responses (NDMC, 2020). For example, the Farm Service Agency (FSA) of the USDA uses the USDM to determine its livestock disaster payment program (LFP). The FSA has a tool designed to help livestock producers know if their county is eligible for this drought relief that is also featured on the USDM's website.
The Drought Risk Atlas (DRA)
The Drought Risk Atlas (DRA) tool was developed by the NDMC to provide decision-makers with more details about historical drought events (Svoboda et al., 2015). As with the development of other drought tools, the DRA was inspired by decision-makers' needs to assess their risks related to climate variability and extremes. The current DRA is an evolution from the National Drought Atlas (NDA) developed in 1996 and primarily focused on hydrology and the PDSI data for stations around the country. The updated DRA not only increased the number of observation stations to 4,183 as of 2016, but also the number of calculated indices and indicators available; including the PDSI, SPI and many more. The DRA's goal was to provide usable information and to increase the ability of users and decision-makers to analyze their potential risk to drought at a specific location and time (Svoboda et al., 2015). The DRA has aided in improving the analysis of drought as an extreme event by providing data and visualization tools to help them better understand the drought climatology for different spatial extents (Svoboda et al., 2015). Figure 3 is a screen capture of the Drought Risk Atlas tool showing the recent PDSI record (1988–2017) for Roswell, NM. The heat map display is one feature of the tool that, in this case, provides a visual representation of the PDSI values by month and year in a slightly different format than a more traditional time series, which is also available. The DRA is a continuously evolving tool, with an option to investigate dryness “trends” added in 2020 to the already numerous options for the station data in the tool. Because the DRA focuses on station-based data, its information was not used for this statewide analysis for New Mexico.
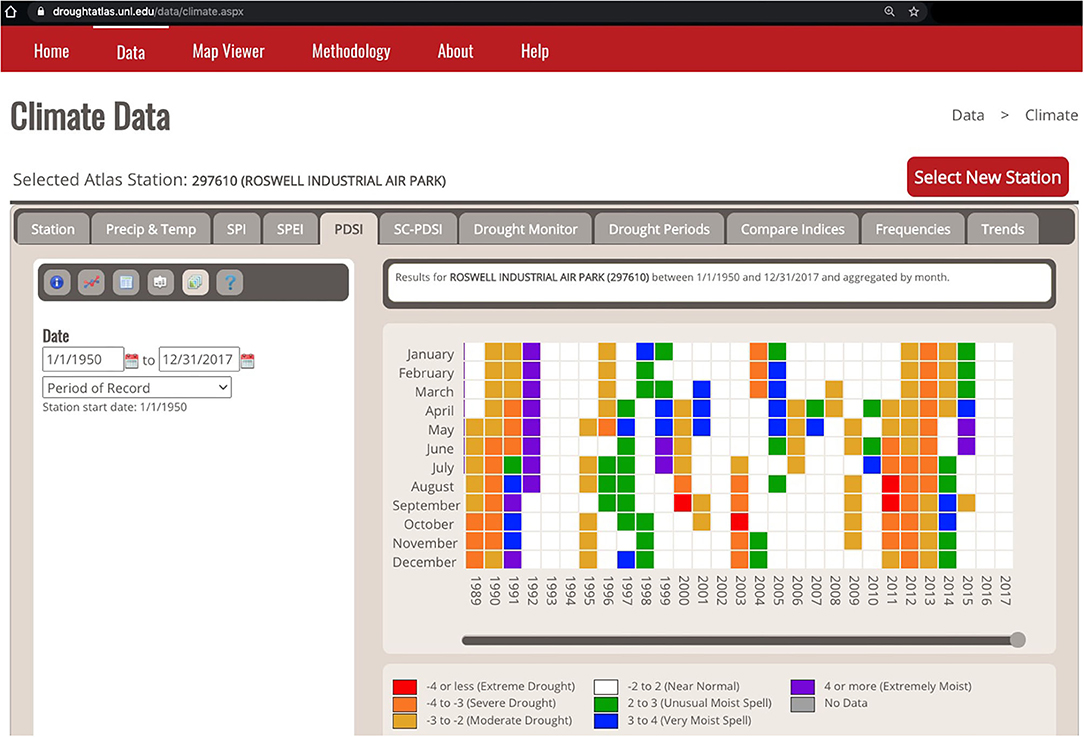
Figure 3. An example of the Drought Risk Atlas [http://droughtatlas.unl.edu/data/climate.aspx] that highlights the monthly PDSI heat map of PDSI values for Roswell, NM, from 1988 to 2017.
Drought Impacts and the Integration of Monitoring Tools
The USDM and DRA are powerful drought monitoring tools that can help in developing drought climatologies, but they lack one key element that is beneficial for improving decision making: drought impacts. Redmond (2002) advocated the importance of defining drought by considering impacts, and because of their unique local nature, monitoring these impacts along with other drought monitoring indicators is critical. Unlike other natural hazards, droughts are often difficult to detect until after impacts have already begun to appear. Drought impacts can also extend past the end point given by many drought indicators. Because of the complexity of possible impacts, drought impact collection and monitoring has always been difficult and usually lacking for use in decision making (Redmond, 2002). This has made the incorporation of impacts difficult in the development of drought climatologies as well.
Given this challenge, the NDMC launched the Drought Impact Reporter (DIR) in 2005 as the nation's first comprehensive, web-based archive of drought impacts. The DIR is a moderated database of events drawn from a variety of sources, documenting the occurrence of drought impacts. Moderators scan daily results of automated news searches for evidence of a quantifiable or observable change at a specific place and time that can be attributed to drought. When they find a report that meets these criteria, they add it to the DIR as an impact (Smith et al., 2015). Impacts are categorized by sectors and can be displayed on a map. Other sources of information on drought impacts are reports from agencies or organizations, and on observations submitted by individuals across the country. These types of sources are now represented in one location at the NDMC [droughtimpacts.unl.edu]. Understanding drought impacts helps decision-makers at all levels identify vulnerabilities so that actions can be taken to address and reduce those vulnerabilities. Impacts can also assist in the early warning system by helping connect drought indicator levels with impact occurrences. As the archive of impacts has grown, the DIR has been used in planning as a historic record highlighting vulnerability to drought [https://drought.unl.edu/archive/plans/Drought/state/SD_2015.pdf]. It provides context and interpretation of U.S. Drought Monitor depictions (Noel et al., 2020). Reports from observers in the national Community Collaborative Rain, Hail, and Snow (CoCoRaHS) network and from other contributors provide near real-time perspectives on what individual producers are experiencing (Smith et al., 2015). Researchers have also experimented with comparing impacts from a European database of drought impact events with physical indicators of drought (Bachmair et al., 2017).
Recent Drought Monitoring Tools for Drought Climatologies
This section features two of the more recently developed tools that can assist decision-makers with building drought climatologies.
The Drought Severity and Coverage Index (DSCI)
The USDM as it is represented in Figures 1, 2 is very helpful illustrating how information on drought severity can be provided at different spatial scales, but the information remains primarily a qualitative comparison of historical drought conditions. It is difficult to compare conditions between two or more separate drought events, either in one location or in multiple locations, and then make a determination regarding which events were more severe (Martin et al., 2020). For example, using Figure 1, it is difficult to quantify how the droughts of 2002, 2003–2004, 2006, 2011–2012, 2013, and 2018–2019 in New Mexico compare with each other. Therefore, to enhance the quantitative capabilities of the USDM to better determine spatial coverage and intensity together, and allow for better comparisons between drought events for locations or between locations, an index called the Drought Severity and Coverage Index (DSCI) was developed as a method for converting categorical USDM drought levels to a single continuous aggregated value for a specified area [https://droughtmonitor.unl.edu/About/AbouttheData/DSCI.aspx] (Akyuz, 2017; Smith et al., 2020). To compute the DSCI using a weighted average, a weight of 1 through 5 is given to each USDM category (D0–D4), and this weight is then multiplied by the categorical percent area for the drought category, and these totals are summed together (Equation 1). This results in a DSCI value that has a continuous scale of 0–500 (Figure 4).
Figure 4 demonstrates the transformation process for New Mexico of the categorical USDM time series (Figure 1) to the continuous DSCI time series using Equation 1. Two advantages can result from converting the percent of an area in each USDM drought category into the DSCI: (1) it provides a single numerical value describing current drought extent and intensity and (2) it allows for drought to be quantified over time. While the USDM provides real-time maps of the spatial extent of drought, it does not provide a simple way to analyze drought over time as do some of the other drought indices. With that in mind, the DSCI is a new tool that increases the capacity of the USDM for further drought monitoring and analysis. The usefulness of the USDM is limited when a long-term historical context is needed since it has only been operational since 2000.
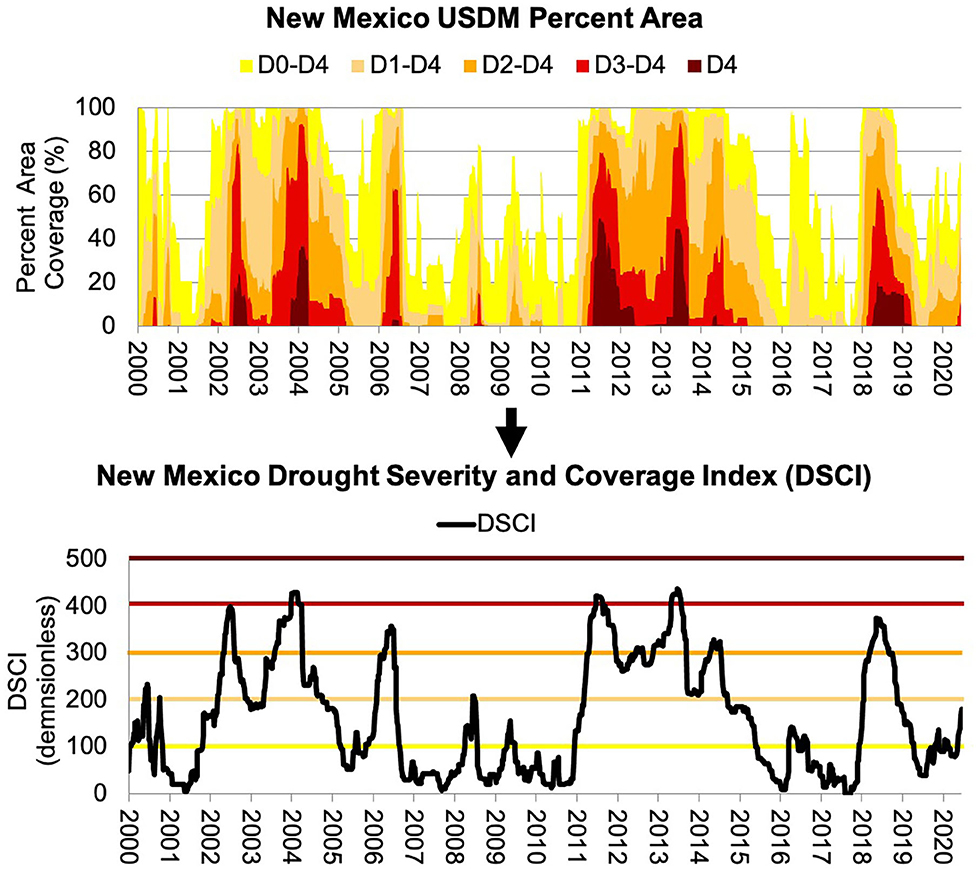
Figure 4. Weekly time series that show how the USDM categorical plot is transformed into the continuous DSCI. The continuous DSCI (USDM) values are 0–99 (None), 100–199 (D0), 200–299 (D1), 300–399 (D2), 400–499 (D3), and 500 (D4).
The West Wide Drought Tracker (WWDT)
Another tool that can be very useful for a decision-makers is the WestWide Drought Tracker [WWDT, https://wrcc.dri.edu/wwdt/] (Abatzoglou et al., 2017). One of the features of the WWDT that is attractive for decision making is that it provides a variety of data options available back to 1895. The tool was designed to provide fine-scale drought and climate data for the states covered by the Western Regional Climate Center (WRCC), including New Mexico. These western states all consist of vast areas of complex terrain where local precipitation and temperature can vary dramatically, affecting local drought conditions (Abatzoglou et al., 2017). The western U.S. is unique in that the geopolitical boundaries are large and consist of diverse land surfaces and topographies, adding to the complexity of an already intricate topic of drought monitoring in these regions. To rectify these drought monitoring challenges, the WWDT is using the PRISM Climate Mapping Program that provides climate and drought data at a 4-km resolution (Table 1) (Abatzoglou et al., 2017). All the data focused on New Mexico applied in this paper, aside from the DSCI, were acquired from the Time Series Tool of the WWDT. These data, and the long historical record, provide an excellent opportunity to build drought climatologies for locations with improved spatial and temporal resolutions that were not available before.
While there are a number of other climate and drought tools that can be used by decision-makers, the tools described here were selected because of the types of available data, the spatial and temporal scales available, and the robustness of the available data. The data and tools discussed happen to be focused on the United States, but significant progress in drought monitoring is also being made around the world, and several examples of these are highlighted in Table 2. The processes described in this article can be applied to any location having historical data available with the appropriate spatial and temporal resolutions.
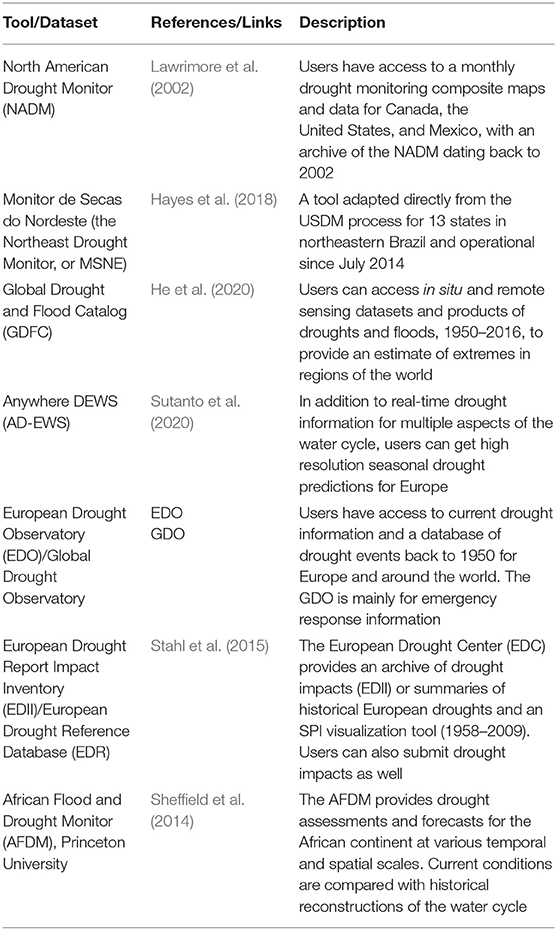
Table 2. International drought monitoring activities.
Methods
The process of building a drought climatology is unique for every location. Ensuring that there are available historical data to provide the appropriate context is a key consideration for highlighting the frequency, magnitude, duration, and impacts of previous drought events. Additional factors to consider in this process include understanding how the drought climatology addresses the drought perspectives and management activities of the decision-makers. It is also important to understand the spatial scale most relevant for the decision-makers. As with a more traditional climatology where both temperature and precipitation are the main components, temperature- and precipitation-related indicators are very important for a drought climatology as they both represent important components of the hydrological cycle and are a good starting point.
For this analysis of New Mexico's drought, all temperature, precipitation, and drought indices data used were taken from the WWDT tool. Although provided for New Mexico on a statewide scale in this case, similar analyses can be conducted for a variety of spatial scales including individual stations, counties, river basins, and climate divisions where historical data are available for more than 30 years. The WWDT data are available for the 1895 through 2019 period, which allows anomalies to be compared to longer averages from 1900 to 1999.
Drought Events Using the Self-Calibrated Palmer Drought Severity Index
One indicator that has been used regularly for assessing drought and building drought climatologies is the PDSI (Palmer, 1965). The PDSI uses both precipitation and temperature data to estimate drought and wetness conditions. Wells et al. (2004) updated the PDSI, called the Self-Calibrated PDSI (sc-PDSI), using a methodology that better incorporates characteristics present at each individual station. This is an important distinction because it accounts for local variability and allows for better comparisons between locations (Wells et al., 2004). Both the PDSI and the sc-PDSI can be calculated back to the beginning of the instrumental record in 1895. Figure 5 illustrates a sc-PDSI time series for New Mexico and provides a general qualitative snapshot of how drought has been a fairly persistent feature in New Mexico.
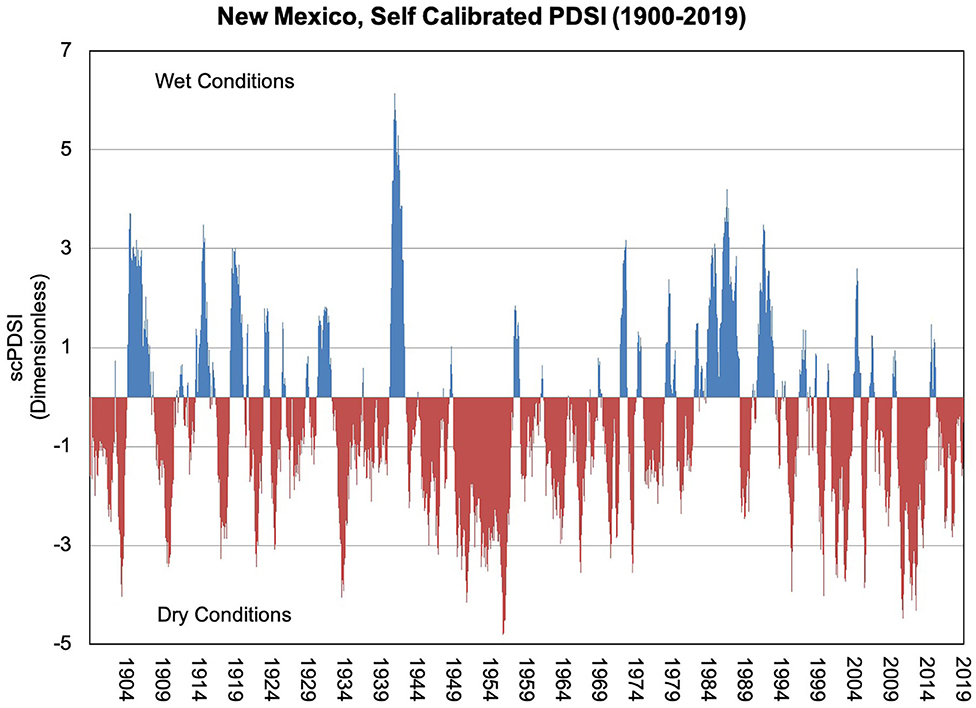
Figure 5. The Self-Calibrating PDSI (sc-PDSC) for the 1900–2019 period. Positive sc-PDSI values (blue) representing wet conditions and negative sc-PDSI values (red) representing dry conditions.
While the sc-PDSI time series itself is valuable, additional analyses can be made on the time series to provide quantitative comparisons of drought events based on their duration, magnitude, and severity. In this study for New Mexico, the method adapted by Nam et al. (2015) is used to calculate the drought severity for the drought events that have occurred during the state's climate history based on the sc-PDSI. The first step is to define a Drought Event (DEP). The subscript “P” represents Drought Events specifically identified by the sc-PDSI. The common threshold of PDSI or sc-PDSI values ≤-2.0 (classified as “Moderate Drought”) was used to define the initiation of a DEP (Palmer, 1965; World Meteorological Organization (WMO) and Global Water Partnership (GWP), 2016). In addition, to provide some consistency and prevent individual 1-month DEPs, a baseline criterion was established that a DEP must have at least two consecutive months of sc-PDSI values ≤-2.0 to be counted.
Using the long-term sc-PDSI time series for New Mexico, the duration of a DEP is the number of consecutive months (two or more) where the sc-PDSI threshold of −2.0 or less was met. The magnitude of a DEP is the absolute value of the sum of the sc-PDSI values for all months within a designated DEP (Equation 2).
Using the duration and magnitude, the severity can be calculated for each DEP using Equation 3. This method is simple and provides a quick and easy way to analyze how droughts compare through history.
Table 3 shows all 31 DEPs as defined by the process described above for New Mexico since 1895. The DEPs in red are designated as the Top 10 events in New Mexico's history. The DEPs for 1895–2019 period were ranked on the calculated drought severity (Equation 3). It is important to note that the 1950s drought, which is often considered New Mexico's worst drought since the beginning of the instrumental record, is broken into two separate drought events using this method. This is because there were 4 months during 1952 when the magnitude threshold was not met. Otherwise, if this gap was not present, the cumulative 1950s drought would rank as the most severe drought event for the state.
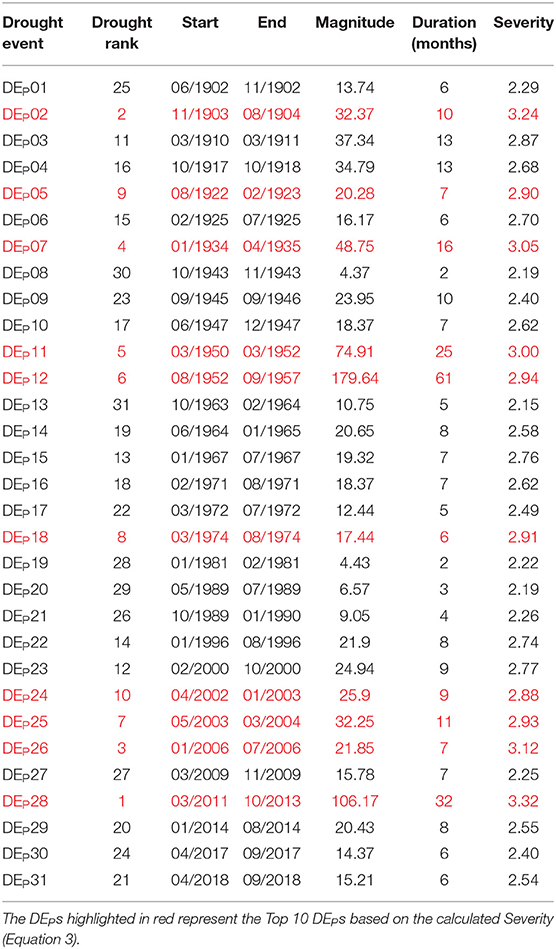
Table 3. New Mexico sc-PDSI identified Drought Events and drought severity since 1895.
However, the method does have one limitation in that duration and magnitude are given the same weight. This means that a drought with a very large magnitude, but short duration can be calculated to have the same severity as a longer drought with moderate magnitude. This is observed comparing DEP02 and DEP12 in Table 3, where DEP02, which only lasted for 10 months, is ranked as more severe than DEP12, which lasted for 61 months.
Drought Events Using the DSCI
As with the sc-PDSI, end-users (i.e., stakeholders, decision-makers, and researchers) can get a time series of the U.S. Drought Monitor for their state or more localized region (Figure 1). This time series record only goes back to 2000, however. To provide a more quantitative perspective of the drought severity categories and the spatial coverage, the Drought Severity and Coverage Index (DSCI) was created and can be used for that current 20-year record. Although the DSCI is available weekly, for this study of New Mexico, monthly averages of the DSCI were used to provide consistency with the sc-PDSI analysis.
Similar to the sc-PDSI analysis, a baseline of two consecutive months reaching the threshold magnitude was established. A DSCI of 200 is equivalent to 100% of an area being in D1 (or Moderate Drought) and a DSCI of 300 is equivalent to 100% of an area being in D2 (“Severe Drought”). Because this study was looking at a statewide DSCI value, and the goal was to set a threshold for drought, the DSCI magnitude threshold was set at 250 to ensure that at least “Moderate Drought” exists for a majority of the state. Table 4 shows 8 DEDs for New Mexico as defined by the temporal step and magnitude threshold described above using Equations 2 and 3. The subscript “D” represents Drought Events specifically identified by the DSCI. The results or the DEDs shown on Table 4 were based on using DSCI instead of sc-PDSI in Equation 2.
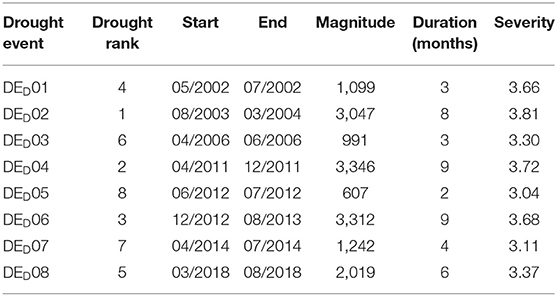
Table 4. New Mexico DSCI identified Drought Events (DEDs) and drought severity since 2000.
Results: Building a New Mexico Drought Climatology
As a good place to begin, the temperature and precipitation records are critical for a New Mexico drought climatology because both represent important components of the hydrological cycle and reveal extremes and trends that provide insights to decision-makers regarding past, present, and potentially future drought events. For New Mexico, Figure 6 shows annual temperature and precipitation anomalies on a statewide scale compared to the 1900–1999 average. Figures 6A,B organizes the historical data into two time series that illustrate distinct warmer/cooler or drier/wetter departures over the period of record from 1895 to 2019. The precipitation record oscillates above and below the long-term average, with the most recent years being generally drier than the 1900–1999 average. The temperature record, however, clearly indicates that there is a warming trend occurring. The annual temperature every year since 2000 in New Mexico has been above the 1900–1999 average according to Figure 6.
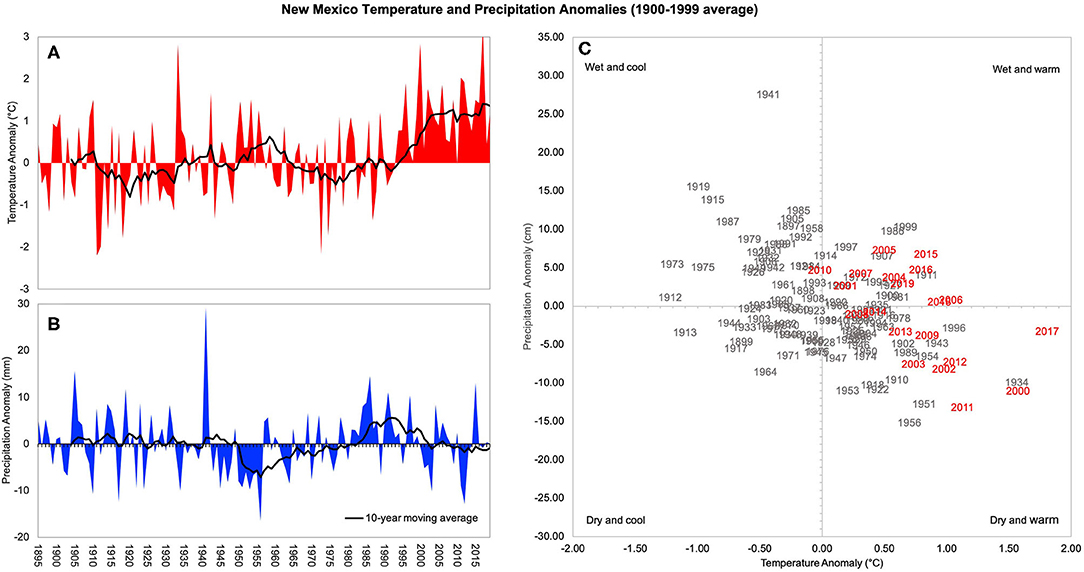
Figure 6. Annual precipitation and temperature anomalies (1900–1999 average) for New Mexico from 1900 to 2019. (A) shows a timeseries of New Mexico's annual temperature anomalies and (B) precipitation anomalies. (C) Compares annual anomalies based on the Water Year (October-September). All 20th century years are gray and 21st century years are red.
Figure 6C provides a different perspective that visually combines the temperature and precipitation record. Providing alternative perspectives with the data is another important method in a drought climatology to enhance the understanding of the historical context. In this case, Figure 6C uses the historical Water Year, which is an annual representation from October through September of the following year to better represent the water availability in regions like the western U.S., including New Mexico. Many decision-makers manage their activities on a Water Year schedule, so this type of representation would make sense for them. The temperature and precipitation averages for each Water Year are displayed for the 1895–2019 period, with the years since 2000 highlighted in red. In this case, all Water Years in the twenty-first century are warmer than the long-term average, except for 2010, with 10 years being above the long-term average in precipitation (and in the “Wet and Warm” quadrant) and 10 years below the long-term precipitation average (the “Dry and Warm'' quadrant).
Figure 6 shows the co-occurrence of hotter and drier conditions, and highlights the importance of considering their interaction. Increasing temperatures, for example, increase evapotranspiration, which decreases the moisture available for humans, animals, plants, and within the soil.
By evaluating all the above-mentioned drought tools, it can be seen that over the last two decades New Mexico is experiencing more extreme dry periods than wet periods (Figures 5, 6, Tables 3, 4). In Figure 5, the sc-PDSI averaged for New Mexico exceeds +2 just one time after 2000, yet regularly falls below −2.0 for the same time period. Based on the data in Table 3, each decade during the 1900–1999 period averaged 2.2 DEPs, and each DEP averaging 23.1 months with an average severity value of 2.68. Meanwhile, the two decades since 2000 are averaging 4.5 DEPs per decade, each DEP averaging 47.5 months with an average calculated severity of 2.75. It is also notable, that based of the sc-PDSI, four of the Top 10 DEPs occurred since 2000 (Table 3).
There have been significant drought events in New Mexico's history, notably DEP07, DEP11, and DEP12 (Table 3). But based upon the sc-PDSI it appears that droughts are becoming more frequent and severe in magnitude. This is also supported by the calculated drought severity in Table 4. This is in part due to the warming trend New Mexico has been experiencing, especially in the last 20 years. The average temperature from 1900 to 1999 was 11.81°C and the average precipitation was 31.23 mm, where the average temperature from 2000 to 2019 was 12.57°C and average precipitation was 29.79 mm. This combination of an increase in temperature and decrease in precipitation may not seem significant, but for a semi-arid and arid climate that New Mexico's FEW system is built upon, it highly sensitive to these changes in temperature and precipitation.
To further highlight the behavior of the two indices (tools) in representing drought events, Figure 7 shows a comparison between the sc-PDSI and the DSCI timeseries for New Mexico for the 2000–2019 period. Although the sc-PDSI and DSCI values are opposite in magnitude due to their different scales (B), they were consistent in tracking each other for the past 20 years of the USDM data (r = −0.76). This demonstrates that both of these tools are detecting similar drought events with slightly different durations and magnitudes, and illustrates the value of looking at more than one drought index to evaluate drought events. Both sources of data confirm key messages and increase the credibility and confidence in the information for the decision-makers. Generally, this also suggest that the use of convergence of evidence approach in drought monitoring is important.
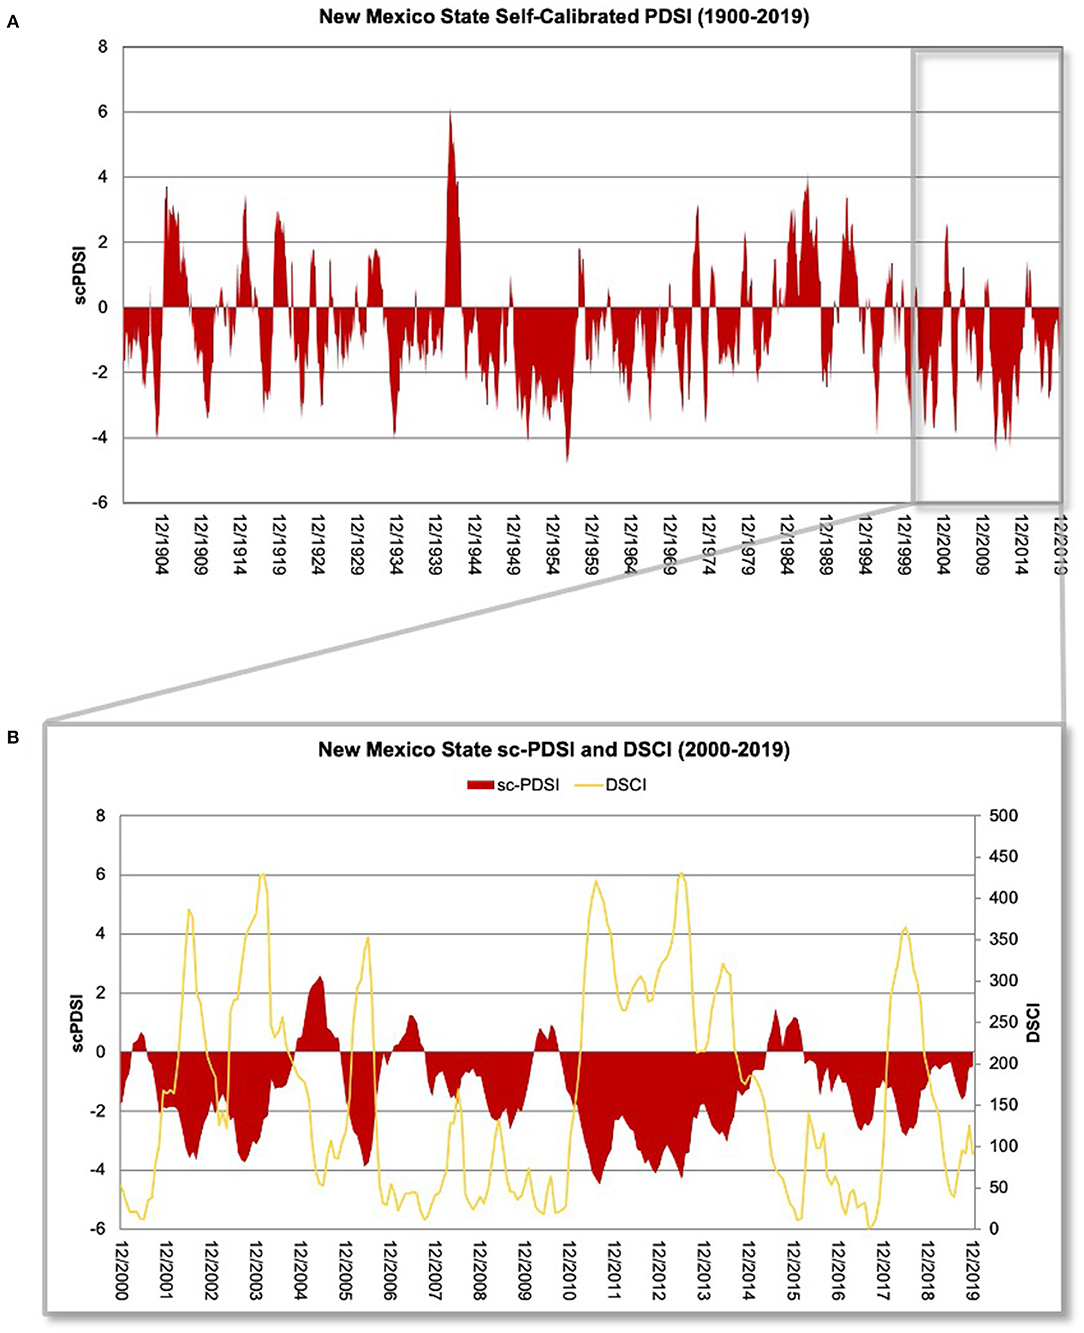
Figure 7. (A) The Self-Calibrating PDSI (sc-PDSC) for the 1900–2019 period and (B) a comparison between the sc-PDSI and the DSCI (r = 0.76) for the 2000–2019 period over New Mexico.
While it is critical to understand historical drought events and how temperature and precipitation have changed over time, a key component for a robust drought climatology is being able to link these drought events with the corresponding drought impacts. The DIR, while a fairly new tool, provides a database that helps to link impacts to different stages of drought events and their magnitude. Understanding this link can help decision-makers understand a drought's progression and anticipate likely future impacts. Figure 8 depicts all impacts recorded for New Mexico by the DIR since 2005 with an overlay of the DSCI for the same time period. The number of impacts follows the same general trend of the DSCI, and tend to be recorded on the leading edge of a prolonged drought. This makes sense in that impacts in the DIR are recorded as one-off events and plotted here by start date, as end dates are generally unknown. This is an indication that monitoring the conditions leading up to impacts may help provide timely early warning of drought itself, and may actually precede other drought monitoring indicators. It may also relate to different time scales of fast-emerging drought or longer-term drought. Additional analysis is needed to investigate if and when impacts manifest and how this information could be used by decision-makers in drought early warning and drought risk management.
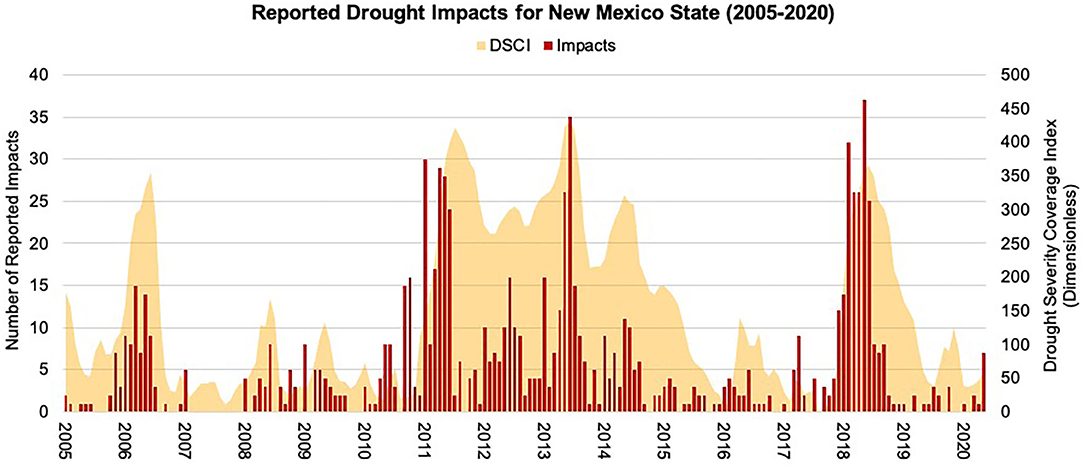
Figure 8. New Mexico monthly drought impacts reported to the DIR and DSCI (2005–2020).
Discussion
New Mexico's economy is highly reliant upon its natural resources. Because of the diverse landscape and arid climate, it is critical for decision-makers to understand the history of previous drought events for effective drought risk management (Finnessey et al., 2016). New Mexico's land cover and land use are characterized by the Chihuahuan Desert in the south and mixed terrains in the west. One of New Mexico's major water resources is the Rio Grande River that runs north-to-south through the center of the state and it supports most of the state's crop production activities through the Elephant Butte Reservoir. A second major river, the Pecos River, originates in the mountains in northern New Mexico and run south, with its basin covering a large part of eastern New Mexico before heading into Texas to eventually join the Rio Grande River.
The agricultural sector brings in ~$2.5 billion per year into the state's economy and the top two commodities are dairy products and cattle and calves (USDA NASS, 2019). Livestock contributes 81% of the agricultural production value for the state, while crops are the remaining 19% (USDA NASS, 2019). New Mexico's mild climate and its vast land resources (~92% can be considered as rangelands) provide suitable conditions for grazing for livestock throughout the year (Allison and Ashcroft, 2011; Sawalhah et al., 2019; WRCC, 2019; USDA-NRCS, 2020). However, during winter, summer, drought, and periods with extreme heat events, rangelands productivity decreases leading to increased demand for forage supplements to limit nutritional deficiency of grazing animals (Holechek et al., 2010; Samuelson et al., 2016). A recent study suggested that there have also been some land use land cover changes over some regions in New Mexico that can negatively affected the availability of suitable grazing rangelands that have been attributed mostly to woody plant encroachment (Gedefaw et al., 2020). These feed supplements are mostly based on irrigated and dryland production consisting mainly of combination of hay, grain sorghum, and corn (Schake et al., 1976; Davis et al., 1977; Holechek et al., 1989; Zaied et al., 2020). Agriculture across New Mexico has adapted to its climate, but it also illustrates how important water is for the state, and how droughts and other climate change-related extreme events (Holechek et al., 2020) can have such a significant impact on its economy and the livelihoods of its people.
In 2018, New Mexico finished updating the seventh iteration of the New Mexico Drought Plan (NMDP) that was first developed in 1998 (NMOSE and NMWRRI, 2018). The current NMDP has developed a drought response system that is adaptive to changing needs and conditions by incorporating updated and new information. The NMDP has noted the value of triggers to define the timing and selection of drought response actions (NMOSE and NMWRRI, 2018). Previous drought plans had identified seven drought stages used to trigger actions by various entities and the working groups associated with the Drought Task Force (DTF). The 2018 NMDP simplifies and streamlines the previous process by having only three stages, with two triggers responsible for determining the Emergency Drought Stage and the Exception Drought Stage. Drought management actions are outlined for these two stages once the triggers are reached.
The NMDP uses the USDM for its two triggers to initiate the management, adaptation, and mitigation procedures described within the NMDP. These responses are based on the spatial extent of the drought severity categories defined by the USDM. One can use the USDM Tabular Data Archive Tool provided on the USDM (USDM, 2020a) to determine how often the two thresholds have been met in New Mexico. The Emergency Drought Stage has a trigger that is reached when 50% of the state reaches the D2 level on the USDM. The Exceptional Drought Stage reaches its trigger when 20% of the state reaches the D4 level on the USDM (NMOSE and NMWRRI, 2018). Since 2000, the trigger for the Emergency Drought Stage has been exceeded 297 weeks (~28% of the time). The longest continuous stretch was for 129 weeks between March 2011 and September 2013. The trigger for Exceptional Drought DEUs has been exceeded 64 weeks since 2000, which is ~6% of the time (Table 5). The subscript “U” represents Drought Events specifically identified by the USDM categories. Figure 9 is a visual representation that highlights when drought conditions met these equivalent triggers. This provides context for how often drought-related management actions take place. It can also provide confidence in the triggers that have been established. The USDM tool allows decision-makers to incorporate similar analyses at a variety of spatial scales for establishing triggers into their decision-making.
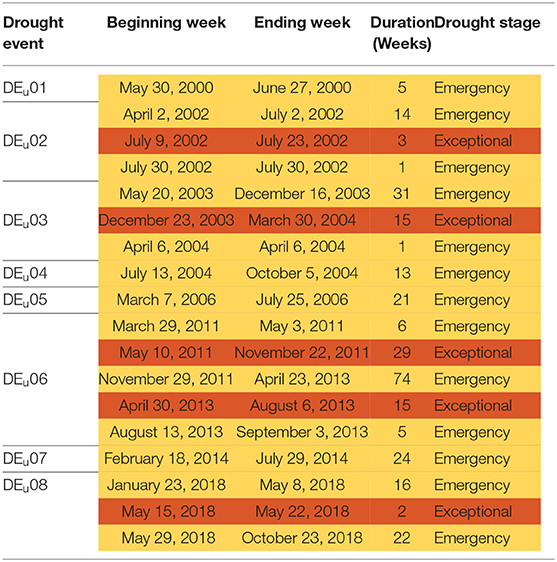
Table 5. Drought Events (DEUs) as designated by the USDM thresholds defined in the 2018 New Mexico Drought Plan.
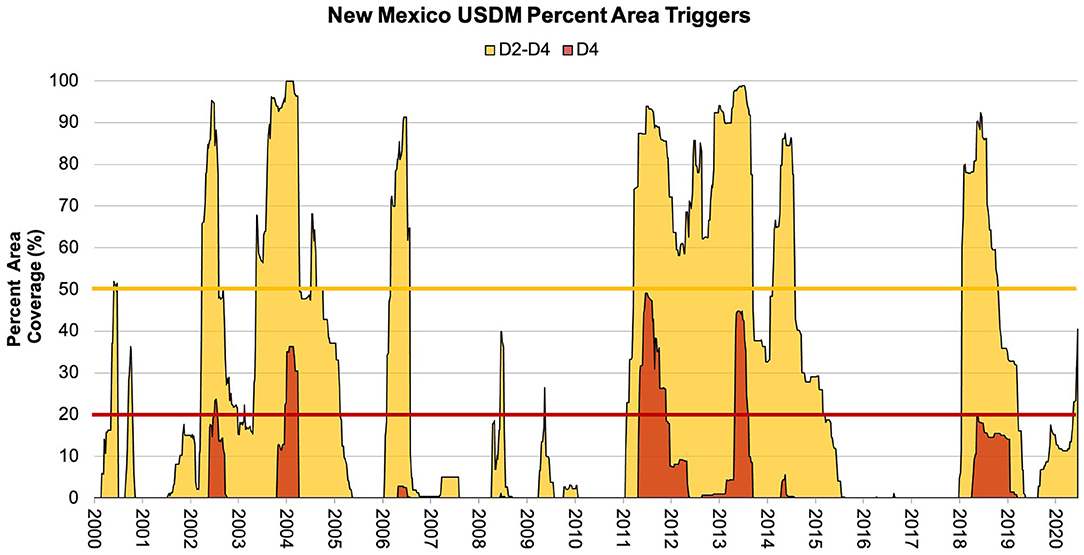
Figure 9. State of New Mexico USDM D2-D4 and D4 categories with the 2018 NMDP equivalent triggers. The yellow line represents the Emergency trigger of 50% area of D2 conditions. The orange line represents the Exceptional trigger of 20% area of D4 conditions.
The Drought Events (DEUs) identified in the NMDP by the USDM triggers in Table 5 are very similar to the Drought Events (DEPs) as depicted by the sc-PDSI in Table 3 and the DSCI (DEDs) in Table 4. The events shown in Table 5 were defined by weekly conditions, while Tables 3, 4 were monthly values. For Tables 5 and 3, the 2011–2013 drought stands out as the most severe drought in New Mexico since 2000 with durations of ~31 and 32 months, respectively. The DSCI threshold for Table 4 was slightly more restrictive so that the 2011–2013 drought was split into three separate Drought Events during the period for a total of 20 months. No other drought since 2000 in Table 4 had a duration close to that length.
Understanding how and when drought impacts evolve can help decision-makers make better drought management decisions. Early in the USDM's evolution, a table was developed that provided an overview of how drought impacts might link to the various USDM severity levels (Svoboda et al., 2002). From the outset, this table was meant to provide some guidance on the possible drought impacts and how they relate to drought severity. The table in Svoboda et al. (2002) became a staple item on the USDM website in spite of the recognition that these linkages would be different for different locations around the country (NDMC, 2020). These are broad impacts that do not take into account the location, climatology, or drought history. More recently, Noel et al. (2020) used the DIR to compile the most common impacts for each drought category. Table 6 displays the most common impacts for each USDM category for the state of New Mexico (USDM, 2020b). The availability of a more tailored table focused on the state or sub-state level will help decision-makers better anticipate impacts associated with emerging drought, and can help inform understanding of historic drought conditions. The combination of Figure 9 with Table 6 accomplishes an important aspect of a drought climatology by providing decision-makers with a general idea of what kind of drought impacts might occur with the different drought severity levels on the USDM as a drought event unfolds.
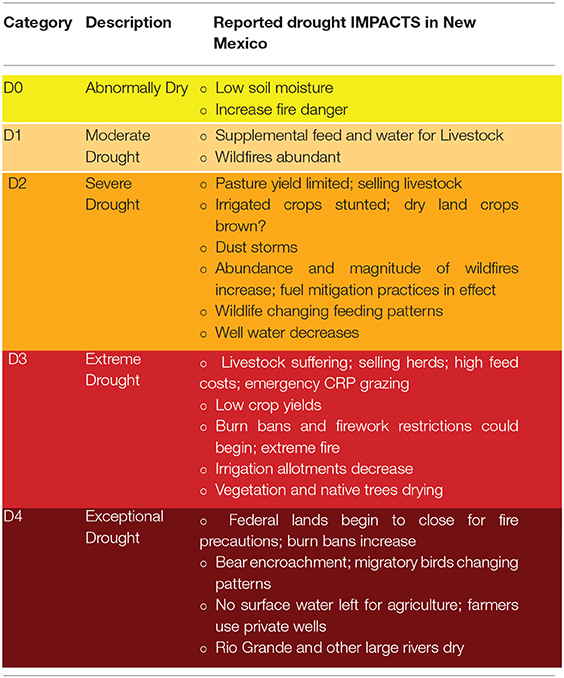
Table 6. SDM categories and associated drought impacts for New Mexico (USDM, 2020b).
Conclusion
New Mexico is highly sensitive to drought conditions due to its variable and limited water supply as well as its normally dry conditions. Climate variability and change increasingly pose significant challenges to the sustainability and resiliency of New Mexico's FEW systems now and into the future, particularly as water resources are further stressed. Drought events and their unique complex human-environment interactions, beyond just the physical drought phenomenon, make them an important climate hazard to focus attention on within the nexus of FEW systems.
Drought early warning and management has advanced significantly over the last 20 years, in large part to the advancement of drought tools. The USDM now has a 20-year history and can be displayed for multiple scales, such as at the state and county levels, and in several different formats. The DSCI is a tool that presents critical information provided by the USDM into a single value for quicker and easier interpretation and response. The simplicity of the DSCI allows decision-makers to use the DSCI as a trigger to initiate drought responses (i.e., NMDP). These advancements in tools lend to more comprehensive drought climatologies to be developed, allowing better understanding how drought has impacted the state of New Mexico in the past and what can be learned from that history. Drought climatologies can be built for any location that has the historical data available, with qualitative (i.e., impacts) and quantitative data providing a more intricate climatology for which more information can be derived by decision-makers.
Until the past few decades, there was not a capability to store and share up-to-date drought impact data. This impact information can elevate already robust drought data, including linking drought indicators with impacts. Our research suggests that monitoring impacts can provide early warning of drought, particularly in conjunction with other drought indicators. Recognizing impacts early can reduce the response time to drought conditions, meaning that decision-makers can take steps to lessen current and future drought impacts.
Drought does not occur in isolation and a state like New Mexico that has an economy heavily dependent upon the land will benefit greatly from having a better understanding of drought and drought impacts throughout the FEW system. Drought climatologies provide valuable information for decision-makers, but there is one limitation that must be considered when building and using historically-derived information, and that is understanding that these climatologies are based upon the assumption of stationarity. Due to climate change, a non-stationarity environment should be taken into consideration when using climatologies to predict future droughts and drought impacts. Regardless, there is still a strong case to understanding how drought has occurred in the past to help with understanding how climate change could influence multiple dimensions of drought.
Another point that was beyond the scope of this study is the discussion about how much the duration of a drought influences the severity, and ultimately the impacts of the drought. A next step is to use the findings from this research and the FEW systems Well-Being Index proposed by Geli et al. (2017) to understand how drought impacts the FEW systems and the well-being of people in New Mexico.
Future research is needed to establish a more detailed link between drought impact information and drought climatologies in New Mexico. Understanding how and when various drought impacts evolve can help prepare decision-makers and stakeholders alike for possible drought impacts in future drought events. Linking drought impacts with drought climatologies will increase the understanding of the effects of drought on FEW systems, allowing for better management of future drought events and the associated impacts.
Data Availability Statement
Publicly available datasets were analyzed in this study. This data can be found at: http://droughtmonitor.unl.edu/; https://wrcc.dri.edu/wwdt/; https://www.fsa.usda.gov/programs-and-services/disaster-assistance-program/index.
Author Contributions
LJ conducted the data analysis, in charge of writing the manuscript, and making most of the figures. MH helped to guide the research and manuscript, and provided ideas and edits. HG helped to provide information about New Mexico and how our research applies to New Mexico and the research he is working on. KS provided information on new drought monitoring tools and provided useful data, including advice on the use of the DSCI, to enhance this project. All authors contributed to the article and approved the submitted version.
Funding
This research was partially funded by the National Science Foundation (NSF), awards #173935 and #IIA-1301346.
Conflict of Interest
The authors declare that the research was conducted in the absence of any commercial or financial relationships that could be construed as a potential conflict of interest.
References
Abatzoglou, J. T., McEvoy, D. J., and Redmond, K. T. (2017). The west wide drought tracker: drought monitoring at fine spatial scales. Bull. Am. Meteorol. Soc. 98, 1815–1820. doi: 10.1175/BAMS-D-16-0193.1
Akyuz, F. A. (2017). Drought Severity and Coverage Index. United States Drought Monitor. (Lincoln, NE: The University of Nebraska-Lincoln). Available online at: https://droughtmonitor.unl.edu/About/AbouttheData/DSCI.aspx (accessed June 24, 2020).
Allison, C. D., and Ashcroft, N. (2011). New Mexico Range Plants Circular 374 Revised by. Available online at: https://aces.nmsu.edu/pubs/_circulars/CR374_SM.pdf (accessed September 16, 2020).
Bachmair, S., Svensson, C., Prosdocimi, I., Hannaford, J., and Stahl, K. (2017). Developing drought impact functions for drought risk management. Nat. Hazards Earth Syst. Sci. 17, 1947–1960. doi: 10.5194/nhess-17-1947-2017
Davis, D., Schalles, R. R., Kiracofe, G. H., and Good, D. L. (1977). Influence of winter nutrition on beef cow reproduction. J. Anim. Sci. 45, 430–437. doi: 10.2527/jas1977.453430x
Ding, Y., Hayes, M. J., and Widhalm, M. (2011). Measuring economic impacts of drought: a review and discussion. Disaster Prev. Manag. 20, 434–446. doi: 10.1108/09653561111161752
Finnessey, T., Hayes, M., Lukas, J., and Svoboda, M. (2016). Using climate information for drought planning. Clim. Res. 70, 251–263. doi: 10.3354/cr01406
Gedefaw, M. G., Geli, H. M. E., Yadav, K., Zaied, A. J., Finegold, Y., and Boykin, K. G. (2020). A cloud-based evaluation of the National land cover database to support New Mexico's food–energy–water systems. Remote Sens. 12:1830. doi: 10.3390/rs12111830
Geli, H. M. E., Hayes, M., Fernald, A., Cibils, A. F., Erickson, C., and Peach, J. (2017). NSF Award#1739835 - INFEWS/T1 Towards Resilient Food-Energy-Water Systems in Response to Drought Impacts and Socioeconomic Shocks. National Science Foundation. Available online at: https://www.nsf.gov/awardsearch/showAward?AWD_ID=1739835&HistoricalAwards=false (accessed September 16, 2020).
Hayes, M. J., Svoboda, M., and Redmond, K. T. (2018). “Drought monitoring and early warning: twenty-first century advancements and challenges,” in Drought and Water Crises: Integrating Science, Management, and Policy, eds D. A. Wilhite and R. S. Pulwarty (Boca Raton, FL: CRC Press), 55–94.
Hayes, M. J., Svoboda, M. D., Wardlow, B. D., Anderson, M. C., and Kogan, F. (2012). “Drought monitoring,” in Remote Sensing of Drought: Innovative Monitoring Approaches, eds B. D. Wardlow, M. C. Anderson, and J. P. Verdin (Back Raton, FL: CRC Press), 1–22.
He, X., Pan, M., Wei, Z., Wood, E. F., and Sheffield, J. (2020). A global drought and flood catalogue from 1950 to 2016. Bull. Am. Meteorol. Soc. 101, E508–E535. doi: 10.1175/BAMS-D-18-0269.1
Holechek, J. L., Geli, H. M. E., Cibils, A. F., and Sawalhah, M. N. (2020). Climate change, rangelands, and sustainability of ranching in the Western United States. Sustainability 12:4942. doi: 10.3390/su12124942
Holechek, J. L., Pieper, R. D., and Herbel, C. H. (1989). Range Management. Principles and Practices, 6th Edn. Englewood Cliffs, NJ: Prentice-Hall.
Holechek, J. L., Pieper, R. D., and Herbel, C. H. (2010). Range Management: Principles and Practices, 6th Edn. London: Pearson. Available online at: https://www.pearson.com/store/p/range-management-principles-and-practices/P100000333785/9780135014165 (accessed February 10, 2020).
Lawrimore, J., Heim, R. R., Svoboda, M., Swail, V., and Englehart, P. J. (2002). Beginning a new era of drought monitoring across North America. Bull. Amer. Meteor. Soc. 83, 1191–1192. doi: 10.1175/1520-0477-83.8.1191
Martin, J. T., Pederson, G. T., Woodhouse, C. A., Cook, E. R., McCabe, G. J., Anchukaitis, K. J., et al. (2020). Increased drought severity tracks warming in the United States' largest river basin. Proc. Natl. Acad. Sci. U.S.A. 117, 11328–11336. doi: 10.1073/pnas.1916208117
McKee, T. B., Doesken, N. J., and Kleist, J. (1993). “The relationship of drought frequency and duration to time scales,” in 8th Conference on Applied Climatology (Boston), 179–183.
Nam, W.-H., Hayes, M. J., Svoboda, M. D., Tadesse, T., and Wilhite, D. A. (2015). Drought hazard assessment in the context of climate change for South Korea. Agric. Water Manag. 160, 106–117. doi: 10.1016/j.agwat.2015.06.029
NDMC (2020). The National Drought Mitigation Center - United States Drought Monitor. The National Drought Mitigation Center. Available online at: https://droughtmonitor.unl.edu/ (accessed June 24, 2020).
NMDA (2019). “Rangeland and grazing issues,” in New Mexico Department of Agriculture. Available online at: https://www.nmda.nmsu.edu/nmda-homepage/divisions/apr/rangeland-and-grazing-issues/ (accessed September 16, 2020).
NMOSE NMWRRI (2018). New Mexico Drought Plan: 2018. New Mexico Office of State Engineer & New Mexico Water Resources Research Institute. Available online at: https://entranosawater.com/documents/711/2018_Drought_Management_Plan__NMDP_Final.pdf (accessed June 6, 2020).
NMSU (2019). Chaves County Agriculture. New Mexico State University. Available online at: https://chavesextension.nmsu.edu/adgandhort.html (accessed June 6, 2020).
NOAA NCEI (2020). U.S. Billion-Dollar Weather and Climate Disasters. National Centers for Environmental Information NCEI. Available online at: https://www.ncdc.noaa.gov/billions/ (accessed June 6, 2020).
Noel, M., Bathke, D., Fuchs, B., Gutzmer, D., Haigh, T., Hayes, M., et al. (2020). Linking drought impacts to drought severity at the state level. Bull. Am. Meteorol. Soc. 101, E1312–E1321. doi: 10.1175/BAMS-D-19-0067.1
Redmond, K. T. (2002). The depiction of drought: a commentary. Bull. Am. Meteorol. Soc. 83, 1143–1148. doi: 10.1175/1520-0477-83.8.1143
Samuelson, K. L., Hubbert, M. E., Galyean, M. L., and Löest, C. A. (2016). Nutritional recommendations of feedlot consulting nutritionists: the 2015 New Mexico State and Texas Tech University survey. J. Anim. Sci. 94, 2648–2663. doi: 10.2527/jas.2016-0282
Sawalhah, M. N., Holechek, J. L., Cibils, A. F., Geli, H. M. E., and Zaied, A. (2019). Rangeland livestock production in relation to climate and vegetation trends in New Mexico. Rangel. Ecol. Manag. 72, 832–845. doi: 10.1016/j.rama.2019.03.001
Schake, L. M., Driedger, A., Riggs, J. K., and Clamme, D. N. (1976). Corn and grain sorghum evaluations for beef cattle. J. Anim. Sci. 43, 959–965. doi: 10.2527/jas1976.435959x
Sheffield, J., Wood, E. F., Chaney, N., Guan, K., Sadri, S., Yuan, X., et al. (2014). A drought monitoring and forecasting system for Sub-Sahara African water resources and food security. Bull. Am. Meteorol. Soc. 95, 861–882. doi: 10.1175/BAMS-D-12-00124.1
Smith, K. H., Svoboda, M., Hayes, M., Reges, H., Doesken, N., Lackstrom, K., et al. (2015). Local observers fill in the details on drought impact reporter maps. Bull. Am. Meteorol. Soc. 95, 1659–1662. doi: 10.1175/1520-0477-95.11.1659
Smith, K. H., Tyre, A. J., Tang, Z., Hayes, M. J., and Akyuz, F. A. (2020). Calibrating human attention as indicator: monitoring #drought in the Twittersphere. Bull. Am. Meteorol. Soc. doi: 10.1175/BAMS-D-19-0342.1
Stahl, K., Kohn, I., Blauhut, V., Urquijo, J., De Stefano, L., Acacio, V., et al. (2015). Impacts of European drought events: insights from an international database of text-based reports. Nat. Hazards Earth Syst. Sci. Discuss. 3, 5453–5492. doi: 10.5194/nhessd-3-5453-2015
Steinemann, A., Iacobellis, S. F., and Cayan, D. R. (2015). Developing and evaluating drought indicators for decision-making. J. Hydrometeorol. 16, 1793–1803. doi: 10.1175/JHM-D-14-0234.1
Sutanto, S. J., Van Lanen, H. A. J., Wetterhall, F., and Llort, X. (2020). Potential of pan-european seasonal hydrometeorological drought forecasts obtained from a multihazard early warning system. Bull. Am. Meteorol. Soc. 101, E368–E393. doi: 10.1175/BAMS-D-18-0196.1
Svoboda, M., LeComte, D., Hayes, M., Heim, R., Gleason, K., Angel, J., et al. (2002). The drought monitor. Bull. Am. Meteorol. Soc. 83, 1181–1190. doi: 10.1175/1520-0477-83.8.1181
Svoboda, M. D., Fuchs, B. A., Poulsen, C. C., and Nothwehr, J. R. (2015). The drought risk atlas: enhancing decision support for drought risk management in the United States. J. Hydrol. 526, 274–286. doi: 10.1016/j.jhydrol.2015.01.006
USDA – FSA (2020). Disaster Assistance - Livestock Forage Disaster Program LFP. LFP - LivestockForage Disaster Program. Available online at: https://www.fsa.usda.gov/Assets/USDA-FSA-Public/usdafiles/FactSheets/livestock_forage_program_lfp-fact_sheet.pdf (accessed September 16, 2020).
USDA NASS (2018). “New Mexico agricultural statistics,” in 2017 Annual Bulletin. (Las Cruces, NM). Available online at: https://www.nass.usda.gov/Statistics_by_State/New_Mexico/Publications/Annual_Statistical_Bulletin/2017/2017-NM-AG-Statistics.pdf (accessed September 16, 2020).
USDA NASS (2019). “New Mexico state and county data,” in 2017 Census of Agriculture. Available online at: https://www.nass.usda.gov/Publications/AgCensus/2017/Full_Report/Volume_1,_Chapter_1_State_Level/New_Mexico/nmv1.pdf
USDA-NRCS (2020). NRI Land Cover Use | NRCS New Mexico. Available online at: https://www.nrcs.usda.gov/wps/portal/nrcs/detail/nm/technical/dma/nri/?cid=nrcs144p2_068841 (accessed January 20, 2020).
USDM (2019). What is the U.S. Drought Monitor? United States Drought Monitor. The United States Drought Monitor. Available online at: https://droughtmonitor.unl.edu/AboutUSDM/WhatIsTheUSDM.aspx (accessed June 6, 2020).
USDM (2020a). United States Drought Monitor - Tabular Data Archive. The United States Drought Monitor. Available online at: https://droughtmonitor.unl.edu/Data/DataTables.aspx (accessed June 24, 2020).
USDM (2020b). United States Drought Monitor - Drought Impacts by State. The United States Drought Monitor. Available online at https://droughtmonitor.unl.edu/Data/StateImpacts.aspx. (accessed September 15, 2020).
Wells, N., Goddard, S., and Hayes, M. J. (2004). A self-calibrating Palmer drought severity index. J. Clim. 17, 2335–2351. doi: 10.1175/1520-0442(2004)017<2335:ASPDSI>2.0.CO;2
Wilhite, D., and Pulwarty, R. S. (2005). “Drought and water crises: lessons learned and the road ahead,” in Drought and Water Crises: Science, Technology, and Management Issues. 389–398. doi: 10.1201/9781420028386.pt4
Wilhite, D. A. (2018). “National drought management policy guidelines: a template for action,” in Drought and Water Crises: Integrating Science, Management, and Policy, eds D. A. Wilhite and R. S. Pulwarty (Boca Raton, FL: CRC Press), 55–94.
Wilhite, D. A., Sivakumar, M. V. K., and Pulwarty, R. (2014). Managing drought risk in a changing climate: the role of national drought policy. Weather Clim. Extremes 3, 4–13. doi: 10.1016/j.wace.2014.01.002
Wilhite, D. A., Svoboda, M. D., and Hayes, M. J. (2007). Understanding the complex impacts of drought: a key to enhancing drought mitigation and preparedness. J Water Resour. Manag. 21, 763–774. doi: 10.1007/s11269-006-9076-5
World Meteorological Organization (WMO) and Global Water Partnership (GWP) (2016). Handbook of Drought Indicators and Indices (M. Svoboda and B.A. Fuchs). Integrated Drought Management Programme (IDMP), Integrated Drought Management Tools and Guidelines Series 2. Geneva: World Meteorological Organization (WMO) and Global Water Partnership (GWP).
WRCC (2019). Climate of New Mexico. Available online at: https://wrcc.dri.edu/Climate/narrative_nm.php (accessed October 22, 2020).
WRI (2020). Aqueduct Water Risk Atlas - World Resources Institute. Aqueduct Water Risk Atlas. Available online at: https://www.wri.org/resources/maps/aqueduct-water-risk-atlas (accessed January 4, 2020).
Zaied, A. J., Geli, H. M. E., Holechek, J. L., Cibils, A. F., Sawalhah, M. N., and Gard, C. C. (2019). An evaluation of historical trends in new mexico beef cattle production in relation to climate and energy. Sustainability 11:6840. doi: 10.3390/su11236840
Keywords: drought, drought monitoring, food-energy-water systems, drought impacts, triggers
Citation: Johnson LE, Geli HME, Hayes MJ and Smith KH (2020) Building an Improved Drought Climatology Using Updated Drought Tools: A New Mexico Food-Energy-Water (FEW) Systems Focus. Front. Clim. 2:576653. doi: 10.3389/fclim.2020.576653
Received: 26 June 2020; Accepted: 09 October 2020;
Published: 04 December 2020.
Edited by:
Chris C. Funk, United States Geological Survey (USGS), United StatesReviewed by:
Jian Peng, University of Oxford, United KingdomLadislaus Benedict Chang'A, Tanzania Meteorological Agency, Tanzania
Copyright © 2020 Johnson, Geli, Hayes and Smith. This is an open-access article distributed under the terms of the Creative Commons Attribution License (CC BY). The use, distribution or reproduction in other forums is permitted, provided the original author(s) and the copyright owner(s) are credited and that the original publication in this journal is cited, in accordance with accepted academic practice. No use, distribution or reproduction is permitted which does not comply with these terms.
*Correspondence: Lindsay E. Johnson, bGluZHNheS5qb2huc29uQGh1c2tlcnMudW5sLmVkdQ==