 Tesfaye Dessu
 Diriba Korecha
 Debela Hunde1
 Adefires Worku
- 1College of Agriculture and Veterinary Medicine, Jimma University, Jimma, Ethiopia
- 2Famine Early Warning Systems Network, Addis Ababa, Ethiopia
- 3Ethiopian Environment and Forest Research Institute (EEFRI), Addis Ababa, Ethiopia
Long-term urban land use land cover change (LULCC) dynamics and climate change trends in Southwest Ethiopia's four urban centers were examined for 60 years. Remote sensing, aerial photos, and Landsat, temperature, and rainfall data were analyzed from a climate change perspective over the Jimma, Bedelle, Bonga, and Sokorru urban centers of southwest Ethiopia from 1953 to 2018. Based on geospatial analysis and maximum likelihood supervised image classification techniques to classify LULCC categories, the Mann-Kendall test was applied to perform trend analyses on temperature and rainfall. The LULCC analysis revealed that built-up areas over the urban centers had shown an increasing trend, with the highest increment by 2,360 hectares over Jimma, while vegetation, wetland, and cropland declined due to conversion of plain lands to built-up areas and other similar zones. The pronounced decline of vegetation coverage was 1,427, 185,116, and 32 hectares in Jimma, Bedelle, Bonga, and Sokorru, respectively. Mann-Kendall test results showed a significant sign of intra-seasonal and inter-annual variability of rainfall while the summer and annual rainfall patterns remained less variable compared to other seasons. This study's findings revealed that when the mean between the two climatic normals of 1953–86 is compared with 1987–2018, the temperature has significantly increased in the latter three decades. The rapid expansion of built-up areas coupled with a sharp decline of green space or vegetation and agricultural/croplands could lead to gradual changes in LULCC classes, which have contributed to the changing of the local climate, especially the surface temperature and rainfall over the urban centers of southwest Ethiopia. Therefore, we recommend that the local urban administrations emphasize sustainable urban development by integrating urban planning policies with land use to protect the environment by adopting local municipal adaptation and national climate change strategies. Restoration of the local environment and creation of climate-smart cities could be critical to the resilience of urban dwellers and ecosystems to the changing climate by enhancing grass-root climate services. To that end, we recommend further advanced research to understand how urban LULC-related changes and other factors contribute to local and regional climates, as urban areas of Southwest Ethiopia are undergoing a rapid transformation of their rural surroundings.
Introduction
Land use land cover (LULC) changes impact weather and climate, both on a local and global spatial scale, which calls for global consideration and continuous monitoring of the changes and subsequent predictions (Mengistie et al., 2013). Changes in the land surface emerge because of both natural and anthropogenic activities. Urbanization leads to changes in the local climate, typically increasing surface air temperature and changing rain patterns and intensity, the magnitude of which varies with season, geographic location, local circulation, climate, and surrounding land cover (Giannaros et al., 2013; Vargo et al., 2013). Using LULC maps based on supervised classification of remote sensing data and local activities offers new possibilities in analyzing effects of LULC due to human activity within the urban area. Indeed, massive changes in LULC patterns significantly affect urban ecosystems (Herold et al., 2003; Patra et al., 2018).
Currently, climate change is accepted as a present reality, and further change is inevitable. For instance, IPCC (2014) documented that between 1906 and 2005, the global average surface temperature rose by 0.7°C. This change occurred in two phases: from the 1910s to the 1940s, and more strongly from the 1970s to the present. The projected global surface warming lies within the range of 0.6 to 4.0°C, while the projected sea level rises are within the range of 0.18 to 0.59 meters by the end of the twenty first century (IPCC, 2014). Urbanization is widely acknowledged to be an upward trend, with 66% of the global population predicted to be living in cities by 2050 (United Nations, 2014). The global urban area estimates, which vary from less than 1–3% of the world's land surface to, are rapidly expanding in different parts of the world, leading to significant changes in other land use land cover types (Liu et al., 2014). Developing countries have begun settlement in urban areas, but they are rapidly urbanizing with unplanned expansion, notably speeding up more than in developed nations (Grimm et al., 2008; Montgomery, 2008). Global climate change is induced by the LULC change because of the considerable effect urban expansion has on the environment, ecosystem, and society (Grimm et al., 2008; Wilson and Chakraborty, 2013).
Ethiopia, the second most populous country in Africa, with an annual population growth rate of 2.3%, has an urban population growth rate of 4.2%. This population growth rate is higher than the average rate (2.2%) for developing countries (United Nations, 2014). In terms of Ethiopian cities' contribution to climate change, cities represent only 15% of Ethiopia's total emissions, although the emission is expected to rise to 35% by 2030 (Cities Alliance, 2017). It is mainly driven by unplanned urban growth, intensive transportation, and energy needs. The country has experienced a significant temperature rise in recent decades, in contrast to a decline in total annual rainfall amounts and recurrent extreme weather events (Cities Alliance, 2017). Various studies were conducted to estimate LULC change in the Ethiopian highlands. However, these studies have shown the dominance of heterogeneity in direction, pattern, type, and magnitude of LULC change in the country (Mengistie et al., 2013). Feyisa et al. (2016), for instance, have analyzed urbanization-induced LULC and surface thermal intensity and its relationship with the biophysical composition in Addis Ababa City using TM and ETM+. The study revealed that the surface temperature around the outskirts of the city has become cooler than urban centers by 3.7°C between 1985 and 2010.
Recent studies have found that there has been an increase in seasonal mean temperatures in many areas of Ethiopia over the last fifty years (Funk et al., 2008). For instance, over the past four decades, the average annual temperature in Ethiopia has increased by 0.37oC per decade, with maximum warming during the second half of the 1990s (EEA, 2008). Studies made on national climate trends since the 1960s showed that mean annual temperatures in the country have increased between 0.5 and 1.3°C (ACCRA, 2012). In contrast, the frequency of cold nights that measure the extent of frost levels during the dry season has decreased significantly in all seasons (McSweeney et al., 2010). In connection to seasonal rainfall trends, Funk et al. (2012) documented that Belg and Kiremt rainfall totals have decreased by 15–20% between 1975 and 2010 in southern, southwestern, and southeastern parts of Ethiopia.
Advances in remote-sensing data improved spatial accuracy and availability of free to less-expensive satellite images coupled with a geographical information system (GIS) that allow quantitative analyses of the rate and pattern of urban LULC change with reasonable cost and better accuracy (Epstein et al., 2002). Information on urban land-use changes is required to visualize growth patterns and improve land use planning and management (Debolini et al., 2015), and allocate services and infrastructure (Witten et al., 2003). Accurate information on urban dynamics is important for predictive urban modeling (He et al., 2008) and assessing ecological changes and their environmental implications on a local scale (Grimm et al., 2008).
Rainfall amounts and distributions in Ethiopia are affected by El Niño-Southern Oscillations (ENSO) and the Indian Ocean Dipole (IOD) phenomena by displacing and weakening rain-producing systems. For instance, Kiremt rain, which accounts for 50–80% of annual rainfall in Ethiopia, has significant contributions to agricultural production and major water reserves, but has been declining in recent decades because of the warming phase of ENSO, and hence is unable to meet the country's agricultural and water resource demands (Korecha and Barnston, 2007; Kassa, 2015). According to Getinet and Woldeamlak (2009), rainfall over southwest Ethiopia showed both high spatial and temporal variability with area-averaged daily rainfall intensity having significantly decreased by 0.44 mm/day per decade. Historically, the southwestern part of Ethiopia is considered the wettest region and the place where tropical rainforest remains clear, and receives moderate to heavy rainfall amounts throughout the year (Korecha, 2013). However, because of ongoing intensive deforestation and expansion of farmland, annual and Kiremt rainfall totals in this part of Ethiopia have shown significant declining trends (Seleshi and Zanke, 2004).
Jimma City, which is the center of this study, is considered one of the major urban centers in southwestern Ethiopia. It is surrounded by steep and hilly topography and subjected to frequent flooding during the main rainy seasons (Getachew and Tamene, 2015). The rapid urban population growth and economic development led to unplanned urban expansion both in Jimma and in other parts of the country, including southwest Ethiopia's urban areas. However, the extent and spatial characteristics of Jimma's long-term expansion and that of surrounding towns and their LULC implications have not been well-documented. Therefore, this paper examines long-term spatio-temporal trends of land use land cover change in urban areas of southwest Ethiopia from the climate change perspective based on observed environmental, atmospheric, social, and economic data. The outcome of this research finding is expected to provide additional scientific evidence to help to understand the influence of LULC change on the urban microclimate to implement climate change adaptation and mitigation schemes in an urban area to combat the challenges of inevitable climate change at a local scale.
Materials and Methods
Description of the Study Area
This study was conducted in southwest Ethiopia's urban area, within the spatial periphery lying between 7°.22'N to 8°.45'N and 36°.23'E to 37°.40' E, representing a grid box of 10 × 10. This area covers the extensive southwestern sector of the country, as depicted in Figure 1. The altitude of southwest Ethiopia ranges from the high plateaus of over 2,000 m to flat and low-lying plains of 600 m. Climatically, this region is classified as a temperate-type climate with a mean annual temperature of 14–20°C and a mean annual rainfall of 1,700–2,000 mm. The study area is characterized by two rainy seasons, with the primary rainy season often extending from May through to the end of October and the short rainy season from late February to the end of April. The study is confined within the southwest of Ethiopia (Table 1; Figure 1), where one of the country's rainfall maxima is located as documented by Getinet and Woldeamlak (2009).
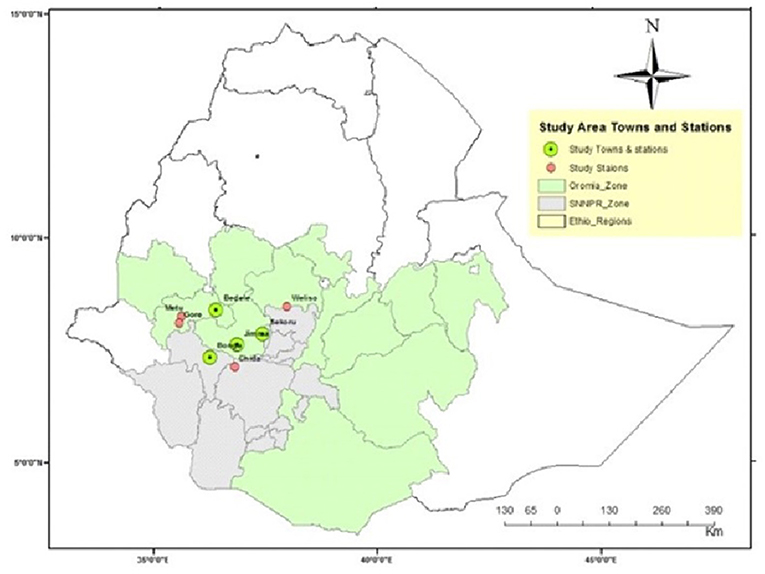
Figure 1. Geographical location of the study area.
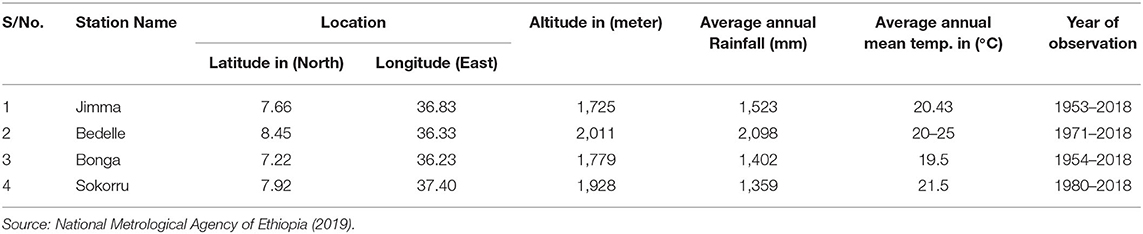
Table 1. Selected study town station and their geographical location of the study area.
The local urban-rural exchange in urban centers and their surroundings has contributed to significant business activity. The main economic activity in this study of urban centers is commerce and manufacturing enterprises. Except for the newly established Jimma Industrial Park in 2018, no large-scale industrial activity was found in the cities, but small–scale cottage industries were available in each town. The current Town Administration of the study depicts towns structured from a city level to the lowest administrative level (kebele) with decentralized functions of a municipality at Kebele level. As per the Central Statistical Authority (CSA, 2007), the total population of Jimma City is 120,600, which was projected to be more than 200,000 by 2017, with diverse ethnic compositions in the city. Also, the total population of Bonga is 20,858 in 2007, and is projected to be 44,046 by 2022; the total population of Bedelle was 19,517 in 2007 and was projected to reach 31,500 by the year 2017, whereas, Sokorru's total population was 6,233 in 2007 and was projected to reach 16,617 by 2017 (CSA, 2007, 2017).
Each of the four urban centers included in this study has its own historical establishment, land use types, structural plan, or master plan to guide development, even if none of them were established in a planned way at the beginning. Among these, Jimma is the oldest city, founded in the 1830s, and the municipality was established in 1942 under decree number 1/1942, with its activity mainly focused on levy taxes (Yonas and Zahorik, 2017). According to the 2008 city revised master plan, the total area of Jimma City has reached 100.2 km2(10,200 hectares), expanding further with the ongoing master plan under revision. In contrast, the current total areas of Bonga, Bedelle, and Sokorru towns are 8,846, 2,878, and 300 hectares, respectively, with the major portions of the land being used for residential, infrastructure, and green areas based on the current master plan under revision. Substantial portions of urban regions are green with trees planted and conserved along the roadside and in the compounds of residences and institutions, such as schools, churches, mosques, health centers, and universities. The altitude of Jimma City ranges from the lowest 1,720 meters above sea level (m.a.s.l) of the airfield (kitto) to the highest 2010 m.a.s.l of Jiren, where Abba Jifar Palace (Masara) is situated. Likewise, Bonga, Bedelle, and Sokorru lie at an elevation of 1,779, 2,011, and 1,928 m.a.s.l, respectively (Jimma City Administration, 2019; NMA, 2019; Table 1).
Data Sources
Land Use Land Cover Change
Next, we discuss producing the spatial map and assessing the dynamics of urban area changes due to urbanization and quantifying the magnitude and spatial patterns of Land Use Land Cover Changes (LULCC) that environments in and around the four urban centers have undergone between 1953 and 2018 using remote sensing and GIS techniques. Topographic maps and aerial photographs for each study area were collected from Ethiopia Geospatial Agency (EGA), depending on historically available high-resolution Google Earth Pro images, and field observation using handheld Garmin Global Positioning System (GPS), which were used for supervised image classification of the Landsat images. Aerial photos of 1957 for Jimma and Sokorru, 1958 for Bedelle, and 1967 for Bonga were extracted from Landsat Thematic Mappers (TMs) for 1987, and Landsat 8 Operational Land Imager (OLI) for 2018 were used to produce the tri decadal LULCC maps. Identification of the LULC types from the spectral response, the image acquisition dates selected based on the availability of cloud-free images of each town Landsat image (path 168, row 51), and the dry season were downloaded freely from the United States Geological Survey (USGS) (Table 2). All images were processed using the ERDAS image processing software version 2015. A change analysis was undertaken by applying a supervised classification and maximum likelihood classifier algorithms change detection procedures. Accuracy of the image classification was assessed using an error matrix, overall accuracy, and kappa coefficient (Table 2).
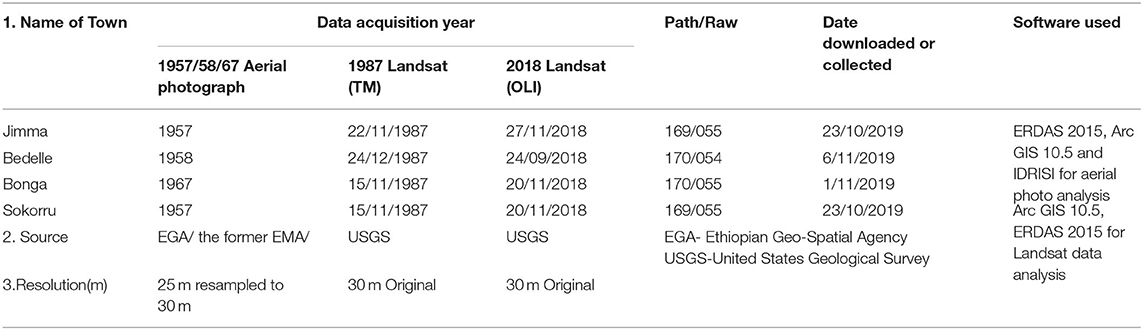
Table 2. Land use land cover data based on satellite observation and their sources.
The overall land use land cover change of classes in terms of built-up, vegetation, agriculture/cropland, and wetlands/open space is because of rapid urban expansion and observed changes presented using each town's images. Rainfall and temperature changes were analyzed in line with urbanization, affecting land use land cover change in urban areas.
Climate Data
Long-term temperature and rainfall data (1953–2018), which were collected from the National Meteorological Agency of Ethiopia (NMA), were aggregated into monthly time series. The study periods were chosen from the period of towns and meteorological station establishments until 2018 in order to increase the quality of data and availability. Quality checks were conducted on available data in order to minimize the errors that could propagate throughout the analysis period and potentially cause bias in the final results. Reliability, accuracy, and homogeneity of these data were checked at 95% significance level using SPSS software. Missing temperature and rainfall data over each meteorological station was filled using the normal ratio method as expressed in Equation (1) below;
Where Px = Missing value of the climate variable under consideration; Nx = Average value of the climate variable for the station in question for recording period; N1….Nn = Average value of the climate variable for the neighboring station; P1….Pn = The neighboring station's climate variable during the missing period; and n = number of stations used in the computation. Before conducting this analysis, the consistency of all climate variables, which are rainfall and temperature, in this case, were checked to see if correction was needed.
Methods of Data Analysis and Presentation
Land Use Land Cover Change Classification
Errors are inevitable in any digitally generated land cover maps obtained from remote-sensing imagery. These errors may occur from the source itself, because of errors incurred during data acquisition, or from classification techniques during image processing. As a result, it requires a robust and thorough assessment test on the classification accuracy to guarantee the result's reliability. One very effective and commonly used method of expressing classification accuracy is the preparation of a classification error matrix or a confusion matrix (Congalton, 1991; Lillesand et al., 2004). After preparing land use, land cover data was made and accuracy of the data were further assessed by collecting ground truth points using GPS coordinates and Google Earth.
Image classification is not complete until the accuracy of the land cover classes is assessed using an error matrix. Error matrix or confusion matrix compares the relationship between known reference data or ground truth and the corresponding results generated from the automated classification process (Lillesand et al., 2015). This matrix helps to validate the accuracy of the classified image, which is usually expressed as a percentage and interpreted using overall accuracy, user's accuracy, producer's accuracy, and sometimes as kappa statistics/coefficient. Kappa statistics measure the difference between the actual agreement between reference data and an automated classifier, and the chance of agreement between the reference data and a random classifier (Lillesand et al., 2015).
It is important to note that the producer's accuracy calculated as the total number of accurate pixels in a group category is divided by the total number of pixels of that category as derived from the reference data. This accuracy measure shows the probability of a reference to the pixel being correctly classified. If the total number of correct pixels in a category is divided by the total number of pixels that are classified in that category, it is said that the user's accuracy is reliable. Kappa coefficient measures the agreement between the classifications on the map and the reference data or GCP.
Land Use Land Cover Change Detection
The change in LULC for the periods under consideration was analyzed using the post-classification change detection technique in a GIS environment. Post-classification change detection is selected as it reduces spectral resolution and sensor differences between the multi-temporal images (Lu et al., 2004).
An important feature of change detection is to determine what is changing to what, i.e., which land-use class is changing to the other. This information also assists as a vital tool in management decisions. This process involves a pixel-to-pixel comparison of the study year images through overlay analysis. The land use land cover change matrix depicts the direction of change and the land use type that remains as it is. To calculate the change of LULC in percentage (%), the initial and final LULC area coverage is compared by applying Garai and Narayana (2018) method, as stated in Equation (2).
The results deduced from this matrix are interpreted as positive and negative percentage values that suggest an increase or decrease in areal coverage.
Climate Data
Quantitative statistical methods were applied to compute the monthly, seasonal, annual, and decadal temperature and rainfall distributions, trends, and variability, taking Jimma as the main hub for urban center, and LULCC and climate change trends for Bedelle, Bonga, and Sokorru towns. Figures, maps, and tables were used to make presentations of the results. It assessed inter-annual and decadal long-term climate variability and changes using Instat, MS Excel, SPSS packages, and other relevant software. GIS software is used for preparing the study area map and analysis.
We computed the mean annual temperature and rainfall based on 30 years+ data record for each station and later aggregated these across the region. In this study, with the rainfall and temperature data, we computed variability using the Standardized Precipitation Anomaly (SPA) and the Coefficient of Variation (CV). Calculating standardized temperature and rainfall anomalies that enable determining the extent of climate variability and change tested for inter-annual and inter-decadal variability and presented the results graphically (Oliver, 1980; Agnew and Chappel, 1999). CV, which is used to test the variability of rainfall, is computed as expressed in Equation (3).
Where CV is the coefficient of variation, s is the standard deviation, and is the mean rainfall. According to Hare (2003), CV is used to classify variability of rainfall events as less (CV < 20), moderate (20 < CV < 30), and high (CV > 30). We calculated a standardized anomaly of rainfall to examine the nature of the trends that enable the effect of determining the dry and wet years in the record and used this to assess the frequency and severity of droughts (Agnew and Chappel, 1999; Conway and Woldeamlak, 2007; Viste et al., 2012; Gebre et al., 2013). We computed standardized Rainfall Anomaly using the Equation (4) below:
Where Z is a standardized Rainfall Anomaly; xi is the annual rainfall total of a particular year; is a long-term mean annual rainfall; and s is the standard deviation of annual rainfall throughout the observation. The inter-annual and decadal temperature patterns, rainfall variability, mean temperature fluctuations, and rainfall are presented graphically for the individual station and for areal averaged value. Linear regression is used to quantify trends, and the non-parametric Kendall-tau test is used to test the statistical significance of trends, which are frequently used to detect trends (Bihrat and Bayazit, 2003).
Since there is potential for outliers to be present in the dataset, the non-parametric Mann-Kendall (MK) test uses a statistic based on the + or – signs, rather than the random variable's values. Thus, the trends determined using MK are less affected by the outliers (Birsan et al., 2005). Trend analysis was carried out on a monthly, seasonal, and annual basis. Each data value was compared with all subsequent data values, using a statistic, S, as expressed using Equation (5). Mann- Kendall (MK) test, a non-parametric, was widely used to detect trends of meteorological variables, as many researchers have well-documented (Seleshi and Zanke, 2004; Mekonnen and Woldeamlak, 2014; Tabari et al., 2015; Gebremedhin et al., 2016). Data analysis was undertaken using the XLSTAT software or excel spreadsheet. The result of the MK test reveals increasing or decreasing trends in the time series data, whereas a value of calculated Z in time series u (t) more than 1.96 shows a positive trend, and a value of u (t) lower than −1.96 reveals a negative trend at the significance level of 95% (Mann, 1945; Kendall, 1975) as expressed in Equation (5).
It is documented that when the number of observations is over 10 (n ≥ 10), the statistic, S, is approximately normally distributed with the mean, and the result value of statistic in the MK test of E(S) becomes 0 (Kendall, 1975). Here, the variance statistic is given as Var (S) and computed using Equation (6).
Where n is the observations number and tj are the ties of the sample time series. The test statistics Zc is expressed using Equation (6).
Theil (1950) and Sen (1968) slope estimator methods predicted the magnitude of the trend. A positive value of β shows an upward trend, which is increasing values with time, while a negative value of β shows a downward trend. Here, the slope (Ti) is of all data pairs computed using the method developed by Sen (1968). It estimated the slope Ti between any two values of a time series x from Equation (8).
Where Xj and Xi are considered as data values at time j and i (j>i), correspondingly. The median of these N values of Ti represented as Sen's estimator of the slope, which computed as Qmed=T (N+1) /2 if N appears odd, and it is considered as Qmed = [TN/2+TN+2)/2)/2] if N appears even. A positive value of Qi shows an upward or increasing trend, and a negative value of Qi gives a downward or decreasing trend in the time series.
Results and Discussions
Analysis of Land Use Land Cover Change
Aerial Photo and Satellite Image Analysis
The aerial photos of 1957, 1958, and 1967 for Jimma and Sokorru, Bedelle, and Bonga with a spatial resolution of 25 m × 25 m were used to prepare land use of the land cover of these towns, respectively. The 1987 land-sat TM and 2018 Landsat OLI image of the dry season were used to prepare land use land cover maps of the study area using ERDAS 2015 image processing software (Table 2). Pre-processing of the satellite image, band composite, and masking the image for the study area was performed, and then images were visually interpreted, pre-processed, and ready for classification (Table 2).
Classification of the satellite images is the process that enables us to classify pixels in the image to the same information, class identification of training points, or signature editor used. Depending on the training point's signature editor value, all the pixel values were classified to the correct class with the parametric rule of a maximum likelihood classification algorithm. The area was classified into four major categories of land use types practiced based on field survey data, which were collected using GPS as well as structural plan data from the land management office of each town, and was referred and cross-checked using the image from Google Earth. Four thematic LULC classes, built-up, vegetation, agriculture or cropland, and wetlands were generated for the years 1957, 1987, and 2018 using supervised image classification (Figure 2). Land uses are classified with a top-level of accuracy. Land use land cover of the study area for Jimma City, Bedelle, Bonga, and Sokorru Towns were mapped through visual interpretation of aerial photographs at a scale of 1:50,000 for 1957, 1958, 1967, and 1957, respectively (Table 3; Figure 2).
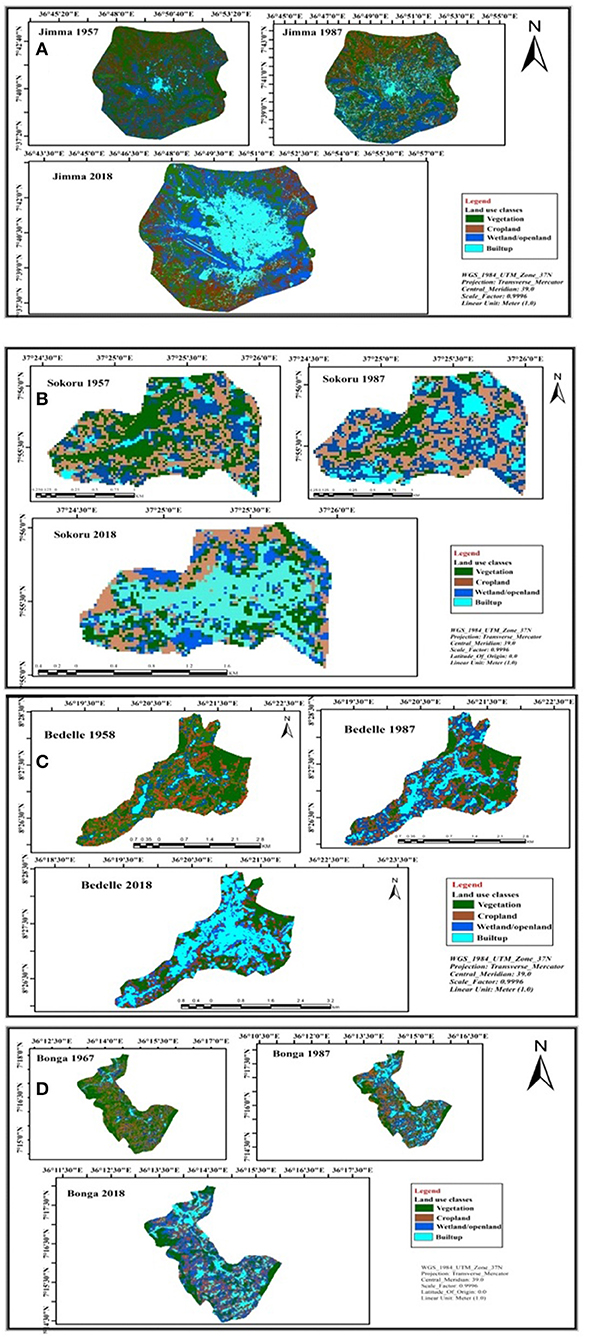
Figure 2. Maps showing land use land cover (LULC) of (A) Jimma, (B) Sokorru, (C) Bedelle, and (D) Bonga urban center as observed in1950s.
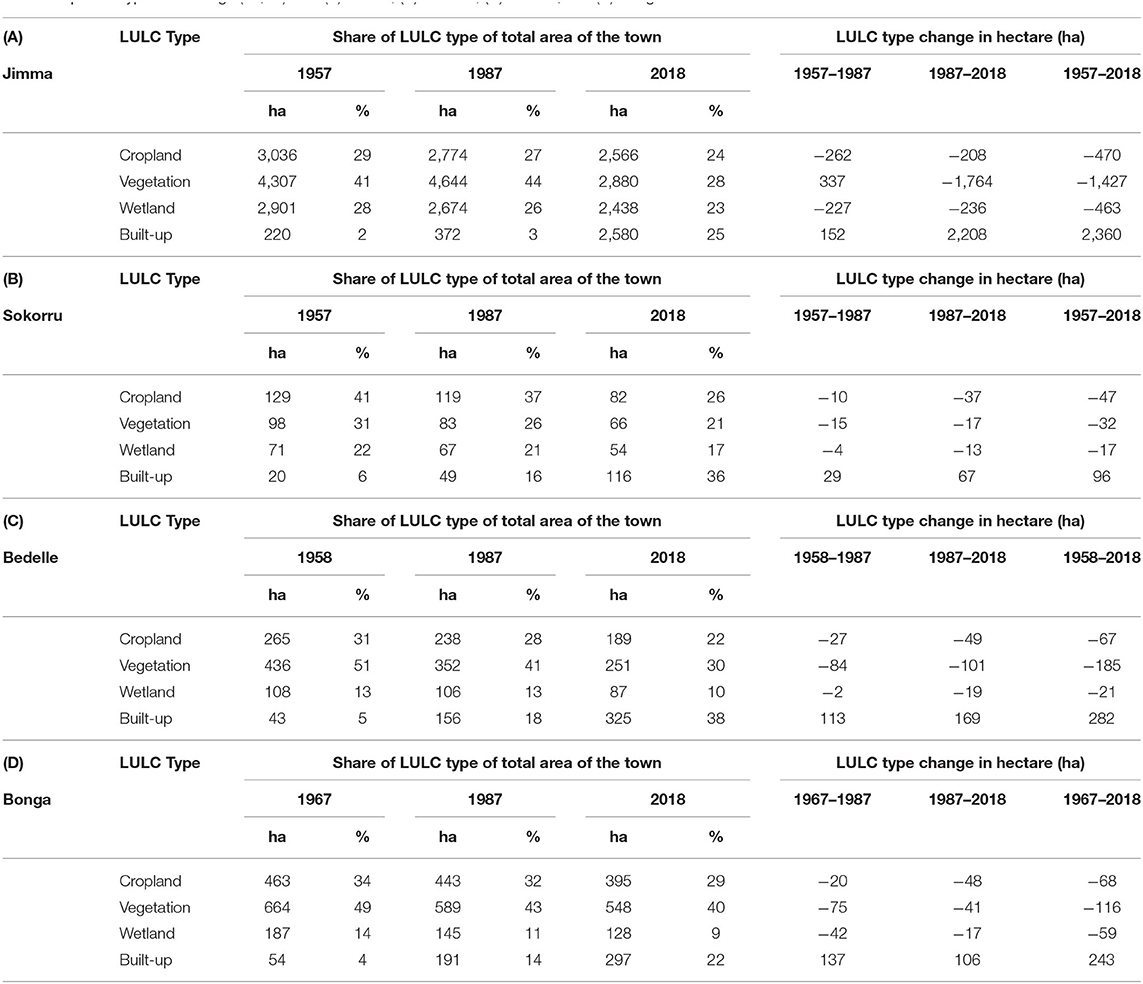
Table 3. LULC type and change (ha, %) over (A) Jimma, (B) Sokorru, (C) Bedelle, and (D) Bonga urban centers from 1957 to 2018.
Land Use Land Cover Change in the Urban Areas
The land use land cover change in urban areas of southwest Ethiopia were analyzed by using classification change detection techniques in GIS environment, and then summarized in tables and illustrated in spatial maps. Land use and type change are considered as any change that occurred from the starting year onwards. LULC change detection findings revealed that all urban centers experienced a change in LULC over the past 60 years, even though there seems to be persistence of land cover classes due to their land size throughout the study period, as summarized in Table 3.
The analysis of land use land cover change showed, in Jimma City for instance, both cropland and vegetation have a decreasing pattern from 1957 to present by 470 and 1427 hectares, whereas the built-up areas have increased by 2,360 hectares (Table 4; Figure 2). The results, therefore, revealed that built-up areas increased from the year 1957 (220 ha) to 1987 (372 ha) and 2018 (2,580 ha). Contrary to the highly urbanized trend, vegetation coverage showed a slight increment from 1957 (4,307 ha) to 1987 (4,644 ha) but significantly decreased in 2018 to 2880 ha. Also, the wetland was highly decreased throughout 1957–2018 by 463 ha. Since 1957, vegetation coverage in Jimma City has declined by 1,427 hectares (Table 2; Figure 2). In contrast, the built-up area of Jimma City has expanded from the central part to eastern and southern directions, with the rate of expansion ranging from 2% in 1957 to 23% in 2018 (Table 3; Figure 2).
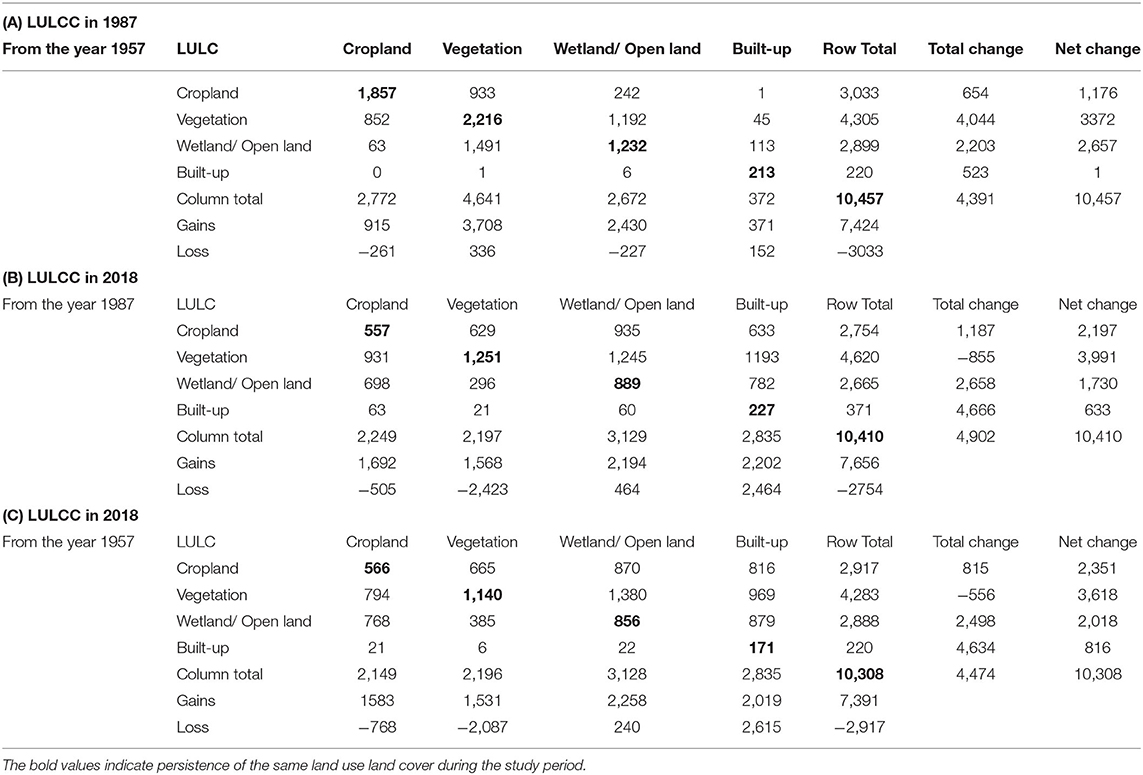
Table 4. Jimma City LULC change matrix as computed between the 1950s, 1980s, and 2010s.
Our findings of a significant increase in built-up areas and a decrease in cropland, wetland, and vegetation in all urban centers under this study are consistent with the previous study as documented by Abebe et al. (2019), which showed that increases in built-up areas resulted because of illegal settlement and transformation of land over the past two decades. The LULC change detection results were also similar to the previous study conducted on green areas of Addis Ababa City by Tesfaye (2017), where vegetation coverage declined, with a significant increase in land surface temperature in the city. The findings we generated for other towns also complied with the results of Herold et al. (2003) and Patra et al. (2018), which identified that the massive changes in LULC patterns had imposed a negative effect on urban environmental conditions.
LULCC Classification Accuracy Assessment and Test
After preparing land use land cover, accuracy assessments were done for LULCC based on ground truth points, which were collected based on GPS coordinates and Google Earth. Error matrix or confusion matrix then were constructed and comparisons were made between known reference data or ground truth and the corresponding results that were generated from the automated classification process as documented by Lillesand et al. (2015). This matrix helps us to validate the classified image's accuracy, which is usually expressed as a percentage and interpreted using Kappa statistics. Based on the Congalton (1991) assessment technique, our findings showed strong agreement between the ground truth and the classified images. The overall accuracy and Kappa statistics (κ) values met the minimum accuracy requirements for LULC change detection studies (Anderson et al., 1976). After applying the above techniques, we summarized the LULC classification accuracy for the Jimma City in the table (Supplementary Table 1A).
The overall accuracy of image classification for Jimma City was 88.71%, and its Kappa index agreement was 0.8472. This implies that the LULC classification process avoided 88% of errors that a random classification generates. The accuracy of individual class (Built-up, Vegetation, Cropland, and Wetland) varies from 76.92 to 94.74% for producer's accuracy and from 84.62 to 90.91% for user's accuracy. Thus, all land use land cover classification was found to be accurate with the computed value of over 75%, which elevated to a better standard. Similarly, the overall accuracy and Kappa Statistic for Bedelle, Bonga, and Sokorru towns were found to be 86.67% and 0.8297, 92% and 0.8923, and 88.33% and 0.8422, respectively (Supplementary Tables 1A–D). The producer's and user's accuracy range from 81.25 to 90% and 85.71 to 88.89% for Bedelle, 88.89 to 95.24%, and 90.91 to 94.12 for Bonga, and 80 to 93.75% and 81.82 to 88.24% for Sokorru, respectively (Supplementary Tables 1A–D).
Land Use Land Cover Change Detection Matrix
This study applied the land change detection assessment technique to individual image classification outputs to identify respective change trajectories of four urban centers under study. The gain, loss, persistence, absolute value of net land change, and total change calculated for all four were classified into image classes (Pontius et al., 2004; Braimoh, 2006). Gain is the amount of land use class i that was added between time t1 and time t2, whereas loss is the amount of land use class j that was lost from time t1 to time t2. Persistence is the land-use class that does not change from time t1 to time t2. Swap is the simultaneous loss and gain of land use class in a landscape, which implied that an area of land use is lost at one location while the same size is gained at a different location. The land use category's total change is the sum of the net change and the swap or the total sum of the gains and losses. Also, the net change is the difference between the gain and losses during the study period.
The major change detection matrix computed between 1957 and 1987 in Jimma City showed that cropland and wetland shrunk from 3,033 ha in 1957 to 2,772 ha in 1987 and from 2,899 ha in 1957 to 2,672 ha in 1987, respectively (Table 4). In contrast, the built-up area has expanded from 220 ha in 1957 to 372 ha in 1987 (Table 4; Figure 3). Parts of the city that were previously covered by vegetation increased from 4,044 ha in 1957 to 4,641 ha in 1987. However, in the following decades, between 1987 and 2018, cropland and vegetation have decreased from 2,754 ha and 4,620 ha in 1987 to 2,249 ha and 2,197 ha in 2018, respectively. Similarly, wetland and built-up land area changed from 2,665 ha and 371 ha in 1987 to 3,129 and 2,835 ha in 2018, respectively, which showed that there is a high transition of land use land cover change in built-up areas because of urbanization and the persistent land use of each class, as shown in bold inside Table 4, during the study period.
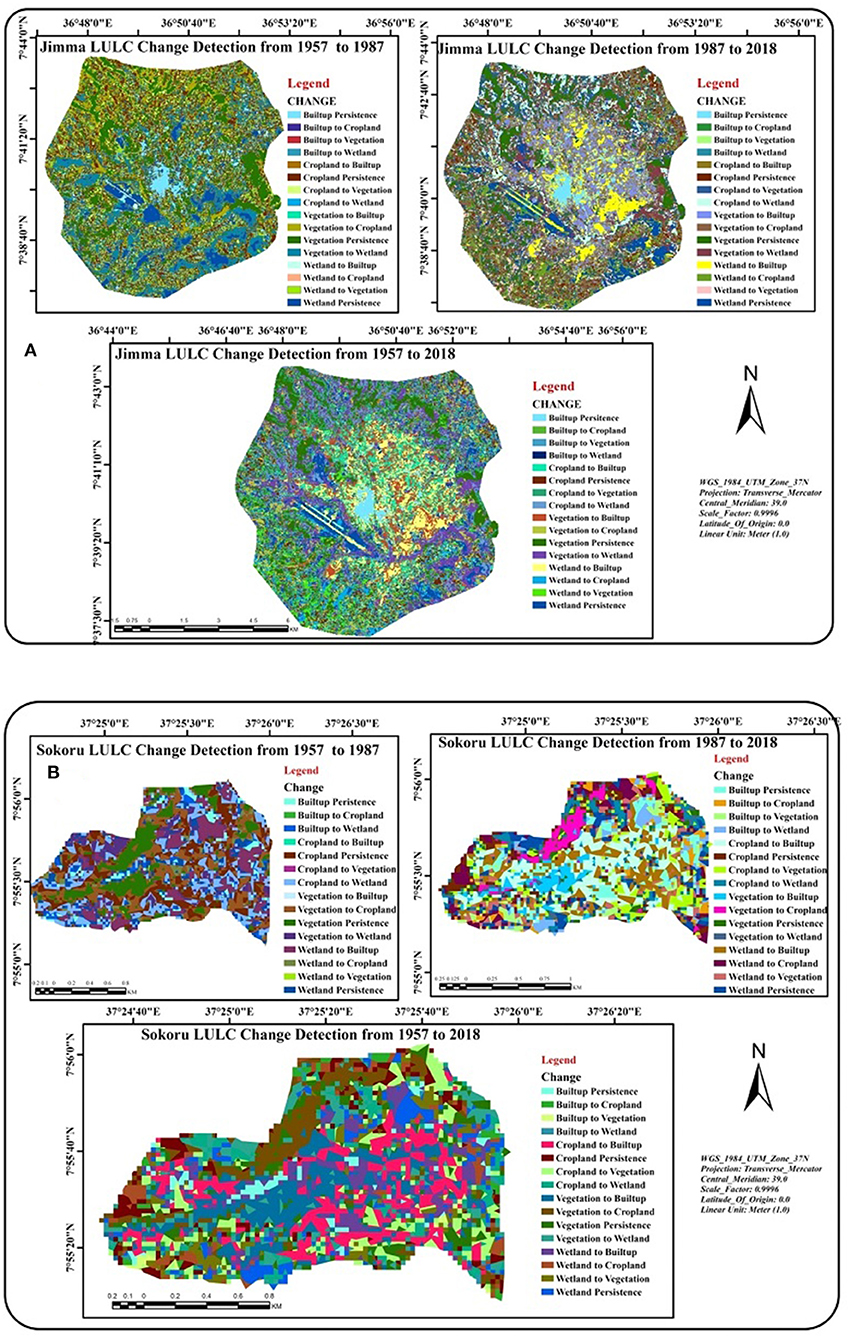
Figure 3. LULC change detection maps of (A) Jimma and (B) Sokorru from 1957 to 1987, 1987 to 2018, and1957 to 2018.
LULC change detection matrix that was computed between the initial (1957) and final (2018) states was calculated to observe the shifts of land cover classes in Jimma City over the past 60 years (Table 4; Figure 3). Similarly, of the 2,917 ha of land that was dedicated to crop farming, 566 ha remained as the same class in 2018, with 794, 768, and 21 ha converted to vegetation, wetland, and built-up areas during this period. From vegetation class, 1,140 ha of the area remained as the same class in 2018 with 665, 385, and 6 ha converted to cropland, wetland, and built-up areas, respectively, in 2018. Likewise, from the wetland/open land in Jimma City, 856 ha remained in this class in 2018 while 870, 1,380, and 22 ha converted into cropland, vegetation, and built-up class, respectively, in 2018 (Table 4).
The major observed land use and type change during the period between 1957 and 1987 in Sokorru Town increased in cropland, wetland, and built-up areas from 108, 69, 19 ha in 1957 to 118, 107, and 48 ha in 1987, respectively, then later decreased in the areas of vegetation coverage from 120 ha in 1957 to 43 ha in 1987 (Figure 4). Between the year 1987 and 2018, cropland and wetland decreased from 103 to 88 ha in 1987 to 55 and 52 ha in 2018, respectively. In contrast, vegetation and built-up areas have increased from 36 to 43 ha in 1987 to 56 and 107 ha in 2018, respectively. This change happened because of the high transition of land use land cover change to built-up areas because of the fast expansion in urbanization. The change detection matrix, computed as the difference between 1957 and 2018 states, was calculated to detect any shift of land cover classes in Sokorru town over the past 60 years (Figure 4).
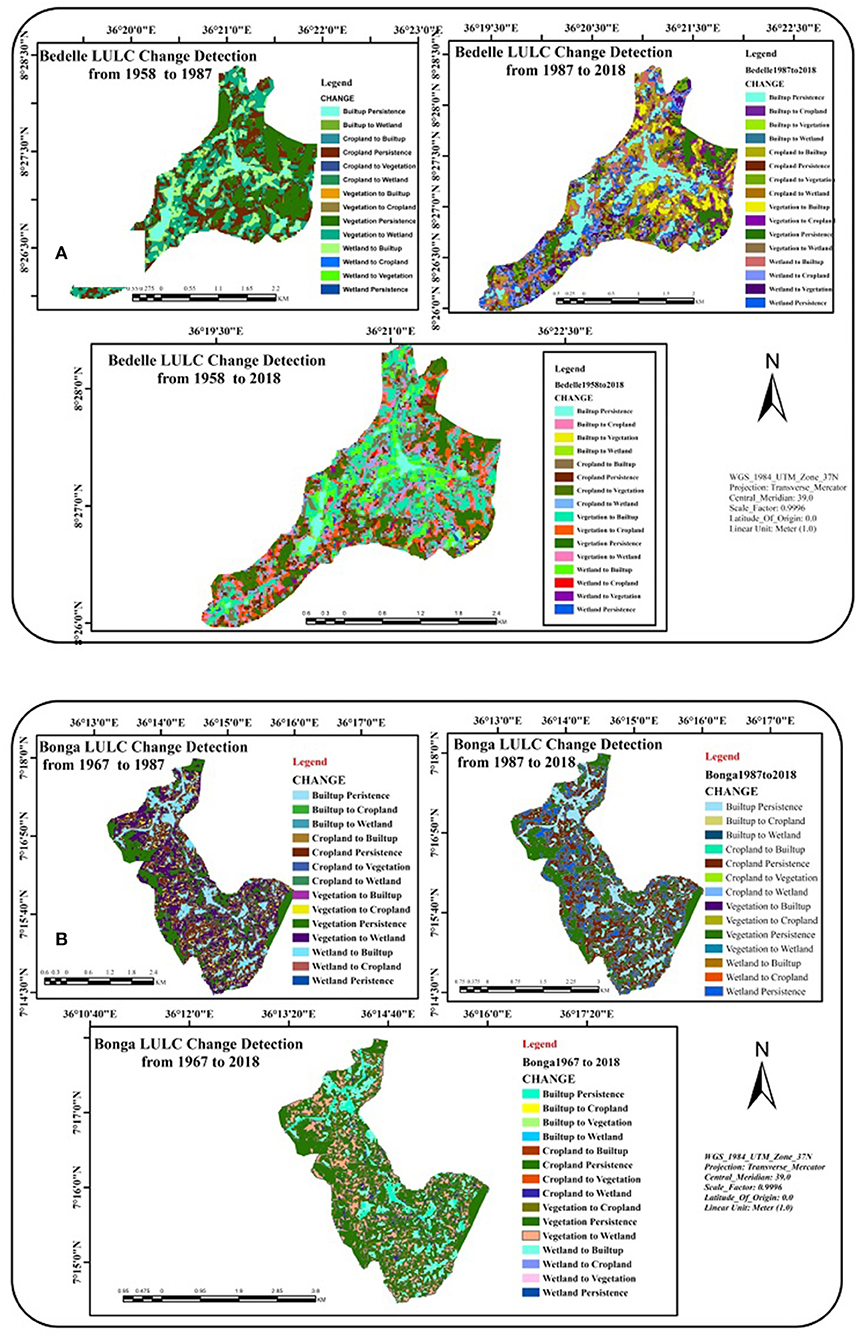
Figure 4. LULC change detection maps of (A) Bedelle, and (B) Bonga Town from 1958/1967 to 1987, 1987 to 2018, and1958/1967 to 2018.
For instance, from an initial 55 ha of cropland, 15 ha remained as the same class in 2018, while 25, 10, and 5 ha of croplands converted into vegetation, wetland, and built-up areas during this period. The vegetation class change showed that 18 ha of the area persisted, while 23, 13, and 3 ha converted into cropland, wetland, and built-up areas in 2018. For the wetland/open land, 16 ha remained as the same type, whereas 16 ha converted to the cropland class, with the rest converted to vegetation and built-up areas. The cropland, vegetation, and wetland areas have significantly shrunk, but the built-up areas have expanded and override other parts of the town previously dedicated to other land types throughout the study period until 2018 (Figure 4).
The major change detection in the period between 1958 and 1987 in Bedelle town displayed an overall area decrease of vegetation from 236 ha in 1958 to 176 ha in 1987 and an increase in cropland, wetland areas, and built-up areas from 213, 107, 42 ha in 1958 to 217, 153, 52 ha in 1987, respectively. Between 1987 and 2018, cropland and vegetation decreased from 211, 430 ha in 1987 to 151, 153 ha in 2018, respectively, whereas wetland and built-up areas increased from 107 to 43 ha in 1987, 163 and 324 ha in 2018, respectively (Figure 4). These findings revealed a high transition of plain land cover change into built-up areas due to urbanization.
Change detection matrix computed between the initial (1958) and final (2018) states were calculated to observe the shifts of land cover classes in Bedelle town over 60 years (Figure 4A; Supplementary Table 1B). Of 152 ha of cropland, 55 ha remained the same class in 2018, 37 ha converted to vegetation, 48 ha to wetland, and 12 ha to built-up areas during this period. The change for vegetation, which was 61 ha of the area, was persistent/remained as the same class in 2018, while 47 ha converted to cropland, 36 ha to wetland, and 36 ha to built-up areas in 2018. For the wetland/open land, 59 ha remained in this class in 2018, 46 ha converted to the cropland class, 32 ha to vegetation class, and 26 ha by the built-up areas. From 324 ha of built-up area, 109 ha remained in this class in 2018, 67 ha converted to the cropland, 44 ha converted to vegetation, and 104 ha converted to wetland/open land through the study period till 2018, which showed a high conversion of land use to built-up areas (Figure 4A; Supplementary Table 1B).
The major change detection matrixes observed in the period between 1967 and 1987 in Bonga town showed an overall area decrease of vegetation from 587 ha in 1967 to 281 ha in 1987 and an increase in the areas of crop land, vegetation, and built-up areas from 363, 33, and 54 ha in 1967 to 413, 413, and 228 ha in 1987, respectively (Figure 4). During the period between 1987 and 2018, cropland and wetland/open land decreased from 433, 425 ha in 1987 to 400, 397 ha in 2018, respectively, whereas, vegetation and built-up areas increased from 281 and 228 ha in 1987 and 303 and 267 ha in 2018, respectively, which showed a transition of land use land cover change from one class to another (Figure 4).
The change detection matrix computed between the initial (1967) and final (2018) states were calculated to observe the shifts of land cover classes in Bonga town over the period (Figure 4). From 380 ha of cropland, 300 ha remained as the same class in 2018, 71 ha converted to vegetation, and the other two to wetland and built-up areas. Vegetation class was the majority with 303 ha of the area remaining as the same class in 2018, with no conversion to other classes observed during the period. For the wetland/open land not in this class in 2018, 29 ha converted to cropland, 68 ha to vegetation, and there was no conversion to built-up areas. From 267 ha of built-up area, 54 ha remained as in this class in 2018, 33 ha was converted to cropland, 2 ha converted to vegetation, and 178 ha converted to wetland/open land through the study period from 1967 to 2018 in Bonga town (Figure 4).
Temperature and Rainfall Trends and Variability in Southwest Ethiopia Urban Centers
The computed annual and seasonal mean, CV, Standardized Rainfall Anomaly, and MK test on time series data of climatic parameters, particularly on temperature (maximum and minimum) and rainfall, were analyzed for the urban centers of southwest Ethiopia. The missing data and outlier values were checked for completeness before analysis, and homogeneity was checked using Pitittis curve. Overall, the results have tended toward normally distributed patterns. In the MK test, parameters like Kendall's tau, S-statistic, and the Z-statistic were analyzed to identify the trend in the time series of climatic parameters. The results are discussed separately for each climate parameter in the subsequent subsections.
Seasonal and Annual Rainfall Trends and Variability
The results generated from the annual rainfall analysis showed a positive trend over time during the years of 1953–2018 in Jimma, Bonga, and Bedelle by 10, 3, and 2 mm/year, respectively, with the highest observed rainfall in Jimma (Table 5; Supplementary Figures 1, 2). This shows an upward trend in annual rainfall in three urban centers, with a declining trend by −30 mm/decade for Sokorru Town, with Kendall tau-b statistically significant at 95% confidence level (Table 5; Supplementary Figures 1, 2). The average areal analysis made over southwestern urban centers revealed that the annual rainfall amount has increased by 25 mm/decade with strong spatiotemporal variations among the urban regions. The average annual rainfall total in the study area was divided into two climatic normals. This enabled us to compare any systematic change in annual rainfall totals between 1953–1986 and 1987–2018 climatic normal periods. We found that southwest urban centers received 1,660 and 1,720 mm of annual rainfall totals during the first and second climatic normals, respectively, with a positive change of rainfall totals by +60 mm. From seasonal time scale analysis, Jimma City, for instance, experienced an increasing rainfall trend during spring, summer, autumn, and winter, with the rate of increment by 40, 34, 29, and 2 mm/decade, respectively (Table 5; Supplementary Figures 1, 2).
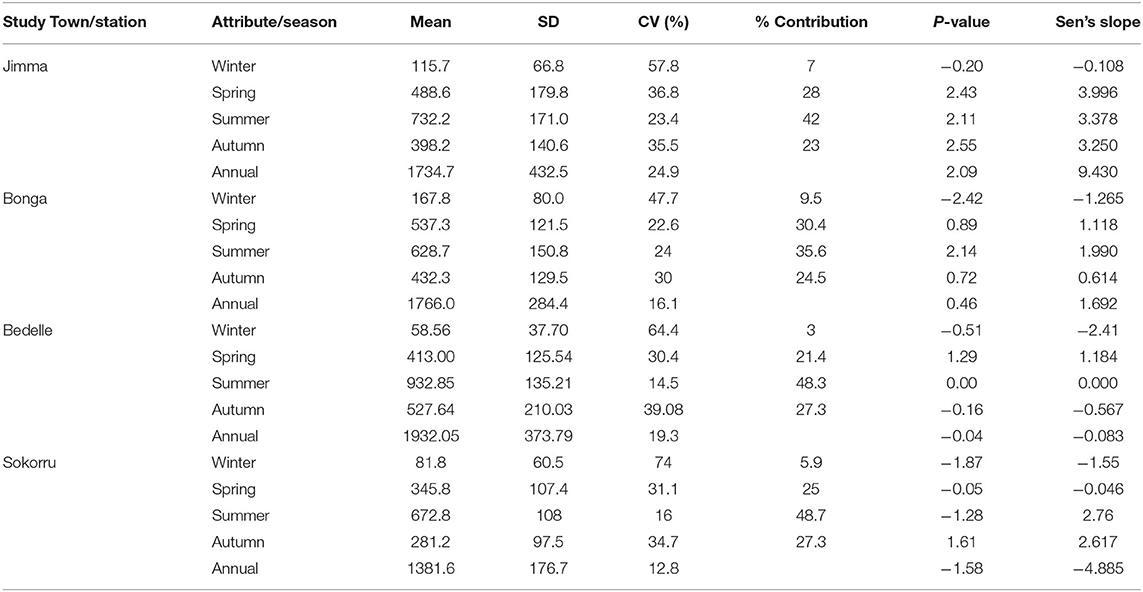
Table 5. Mann-Kendall trend test on observed seasonal and annual rainfall time series of the four urban centers from 1953 to 2018 using (two-tailed test at 0.05 significance level) and Sen's Slope Estimator (mm/year).
The study's findings from the Mann-Kendall test revealed that, during the study period of 66 years in all study towns, winter season rainfall signaled a decreasing trend. However, the summer rainfall contribution for annual rainfall totals is 2-fold compared to spring, and an increase/decrease of rainfall totals during one of these seasons significantly impacts southwest Ethiopia urban centers. The results we summarized in Table 4 are highly comparable with other studies (Korecha and Barnston, 2007; Kassa, 2015), where 50–80% of annual rains fall during Kiremt (summer). Therefore, most severe droughts were related to the failure of Kiremt rain to meet agricultural productivity in Ethiopia. When seasonal rainfall variability was analyzed, the winter, spring, and autumn rainfall were more highly variable than Kiremt rainfall, which implies more inter-seasonal than annual rainfall variability in study towns. Our current results are comparable with the findings of Viste et al. (2013) and Arragaw and Woldeamlak (2017), where more variability in other seasonal rainfall than the Kiremt rainfall in most parts of Ethiopia was disclosed. Philippon et al. (2002) also found a similar finding of a strong interannual variability over the last four decades in equatorial East Africa.
During the study period (1953-2018), the slopes of linear regressions were 10.06, 2.3, and 1.6 mm/year for annual rainfall despite being statistically insignificant over Jimma, Bedelle, and Bonga, respectively (Table 5; Supplementary Figures 1, 2).These findings were similar to earlier studies (Getenet and Bewket, 2009; Mohammed, 2018). These scholars argued that the rainfall trend in Jimma and Bedelle was increasing but then substantially declined over Sokorru.
A Standardized Rainfall Anomaly (SRA) method was also applied to assess how inter-annual rainfall fluctuated in the study region. Although the seasons did not exhibit any persistence in the pattern of wet and dry conditions, the dry years and seasons were more frequent than the wet years and seasons during the 66 year study period (Figure 5; Supplementary Figure 2), with Figure 6 showing a distinct seasonal rainfall trend in Jimma City. This finding correlated with earlier studies (Getenet and Bewket, 2009; Mohammed, 2018), who argued that since there are no consistent patterns or trends in daily rainfall characteristics or seasonal rainfall, it is difficult to conclude whether the climate of the study area is becoming progressively drier or wetter. However, the observed occurrence of dryness in southwest Ethiopia is becoming apparent, which calls for proactive attention of concerned bodies ahead. Our findings were also consistent with the Funk et al. (2012), which documented that Belg and Kiremt rainfall have decreased by 15–20% between 1975 and 2010 over southwestern and southeastern parts of Ethiopia.
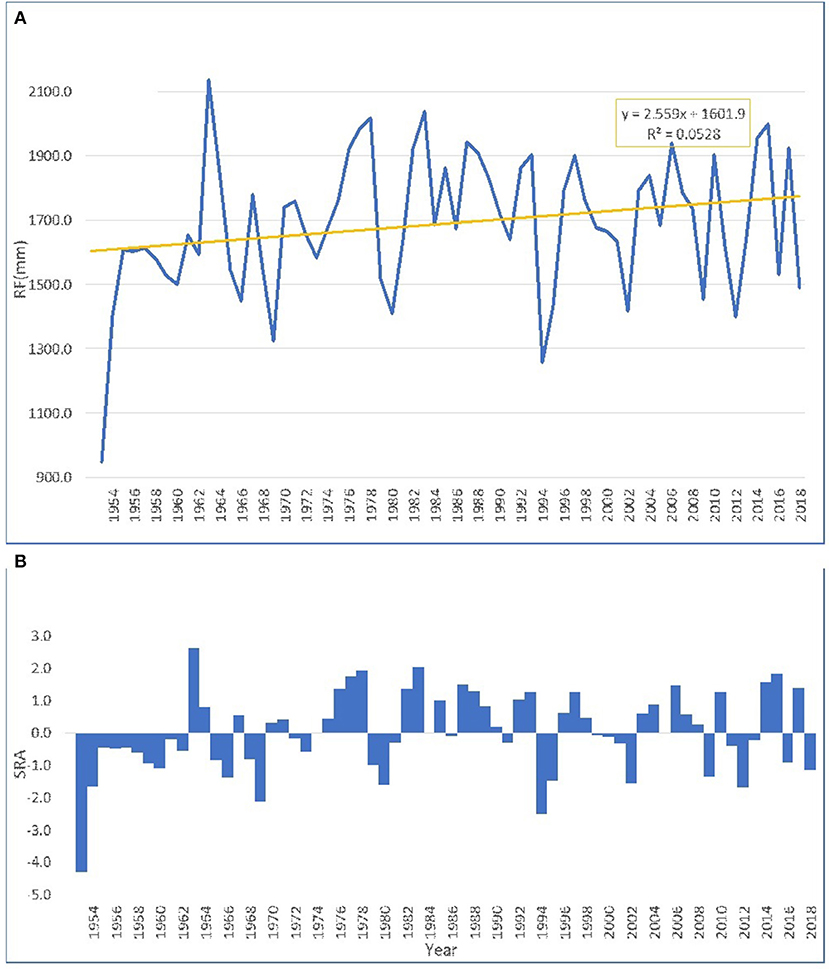
Figure 5. Areal-averaged (A) annual rainfall trend, and (B) standardized rainfall anomaly computed for Southwest urban centers of Ethiopia dining the period 1953–2018.
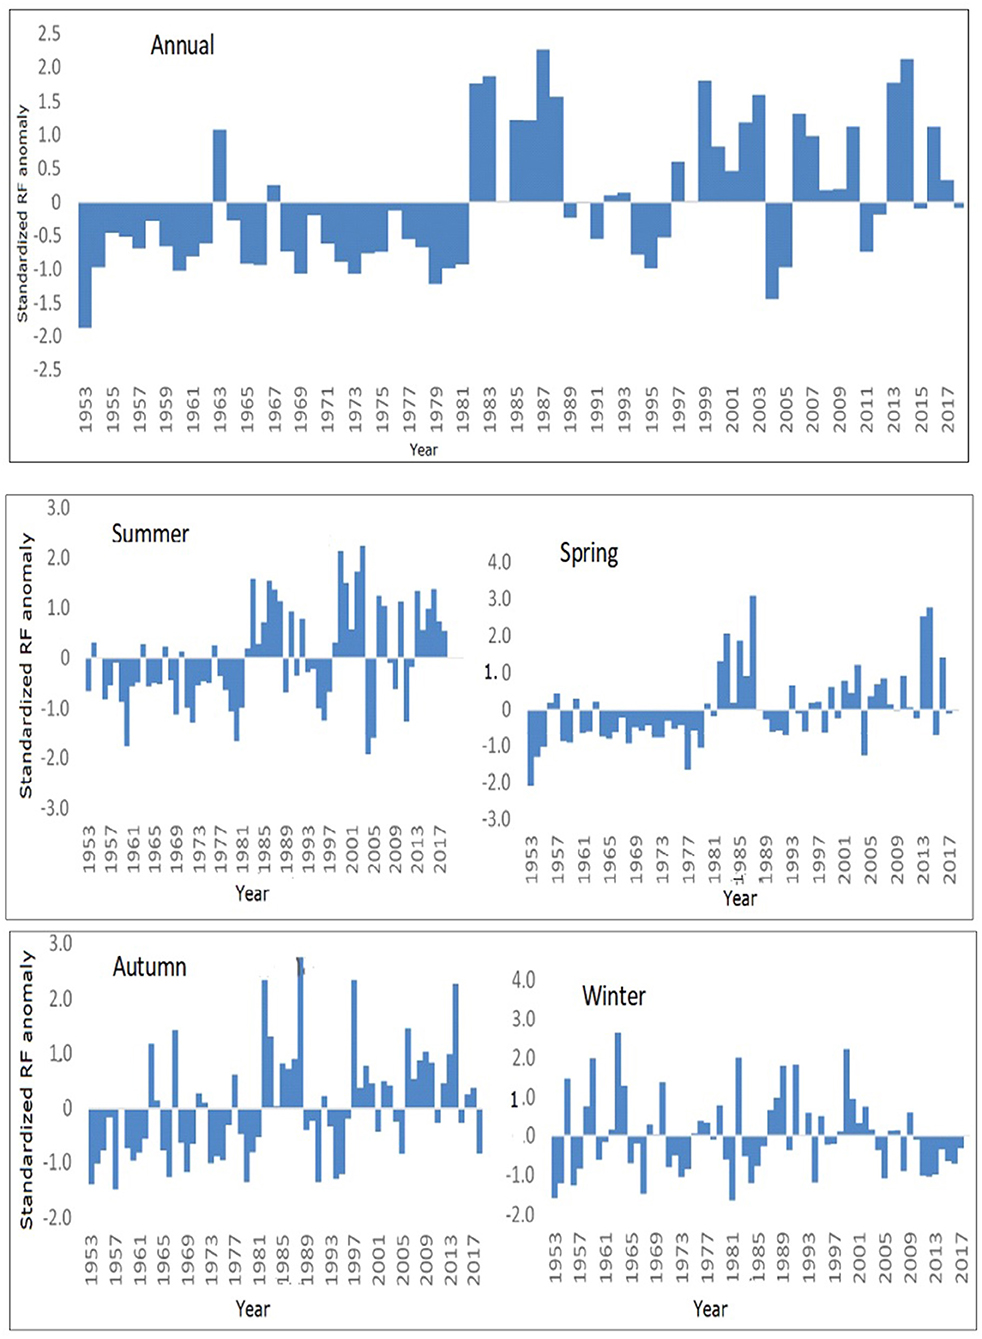
Figure 6. Time series of Standardized annual and seasonal Rainfall Anomaly (SRA) as computed for Jimma urban center during 1953 to 2018.
Monthly, Seasonal, and Annual Temperature Trend Analysis
An increase in temperature is one manifestation of global climate change. To examine the local climate patterns in urban centers of southwest Ethiopia, analysis of monthly, seasonal, and annual temperature was undertaken to detect strong variability and temporal trends in the study area for the periods of 1967–2018. In this study, two climatic normals for maximum, minimum, and mean temperatures from the first period of 1967–1988 were found to be 26. 0, 11.6, and 18.8°C, respectively and for the second period of 1989–2018, 27.0, 12.5, and 19.8°C, respectively. This study further implies that the difference between two consecutive climatic normals resulted in positive changes with the values 1.0, 0.9, and 1.0°C for maximum, minimum, and mean temperatures, respectively. When two climatic normal were compared, the temperature increased in the latter case over the study area, which revealed the global warming footprint in the southwest urban centers of Ethiopia (Figures 7A–C, 8A,B).
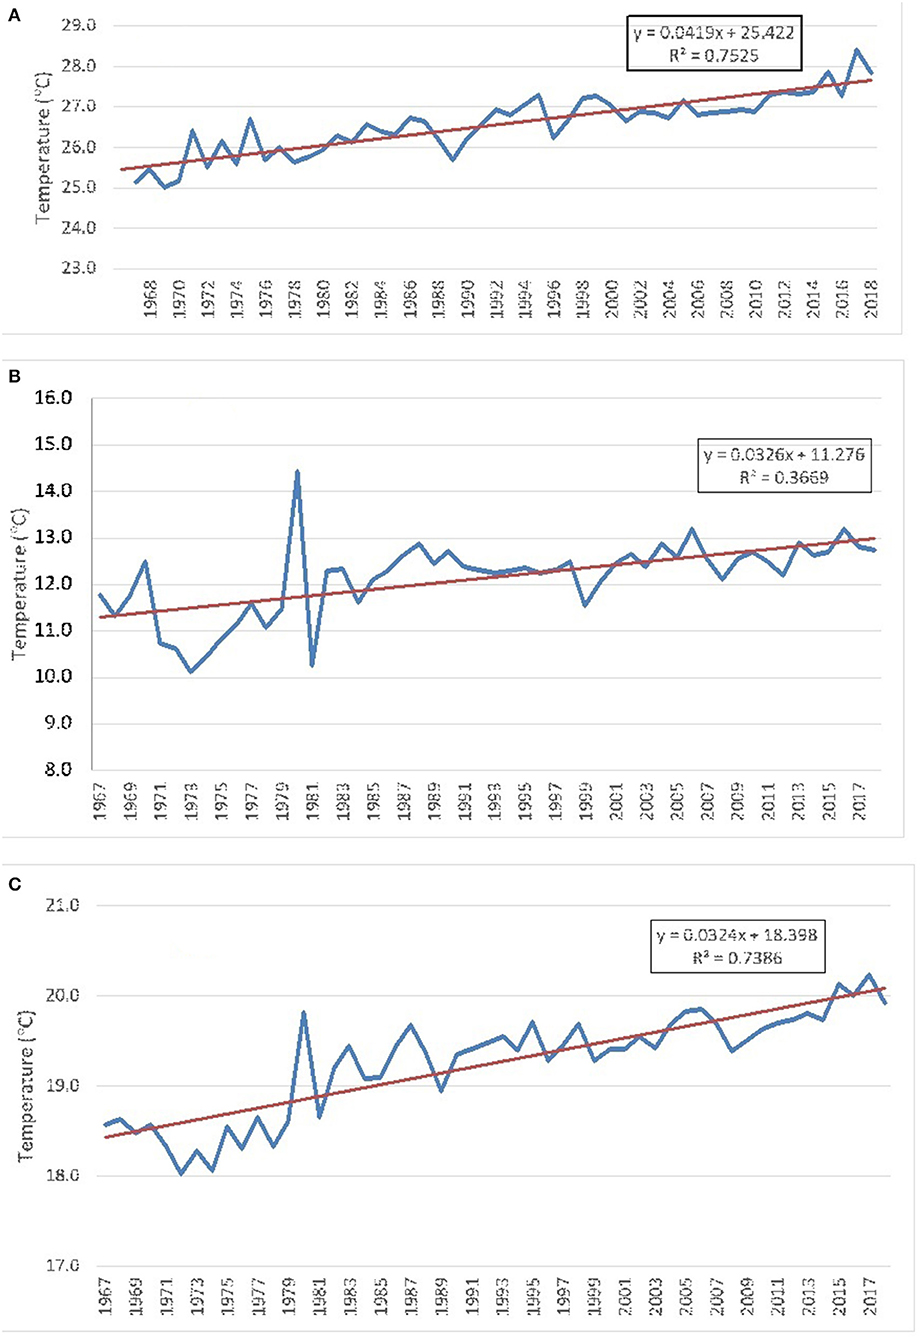
Figure 7. Time series graph showing areal-averaged (A) Maximum, (B) Minimum, and (C) Mean temperature as computed for the southwest urban centers of Ethiopia during the period 1967–2018.
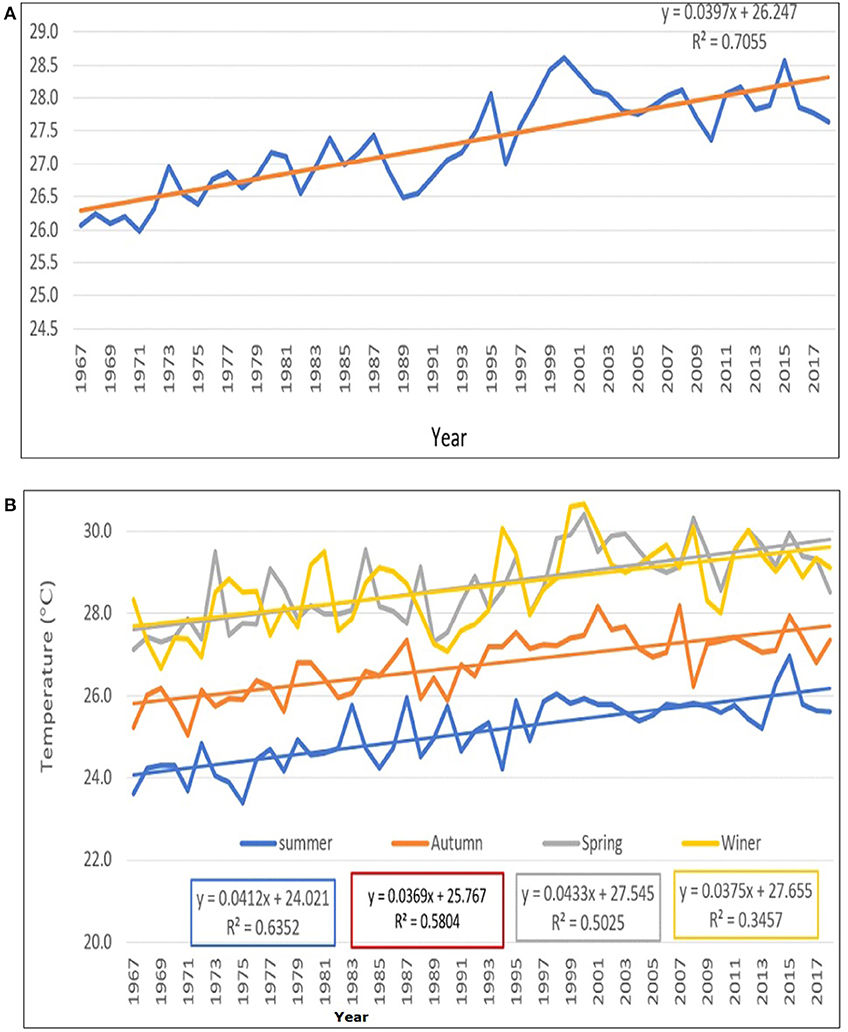
Figure 8. Time series graph showing (A) Annual, (B) Seasonal maximum temperature trend over Jimma urban center during the period 1967–2018.
Table 5 below summarizes monthly, seasonal, and annual temperature (minimum and maximum) patterns for each urban center and temporal trends during the period under examination, as well as trends for each town depicted in Supplementary Figures 3, 4. The mean minimum and maximum temperature in the study area ranges from 17. 6 to 20.5°C with an annual mean temperature of 19.2°C. Using a linear regression model, the rate of temperature changes over the study region is 0.41, 0.32, and 0.32°C per decade for maximum, minimum, and mean temperature, respectively, between 1967 and 2018 (Table 6; Figures 7A–C). The long-term anomalies (Table 7; Figures 7, 8) of mean annual temperature showed there had been recurrent interannual and seasonal variability (the trend after 1988 has been higher than the long-term average) which is evidence of a warming trend since the last three decades of the twentieth century.
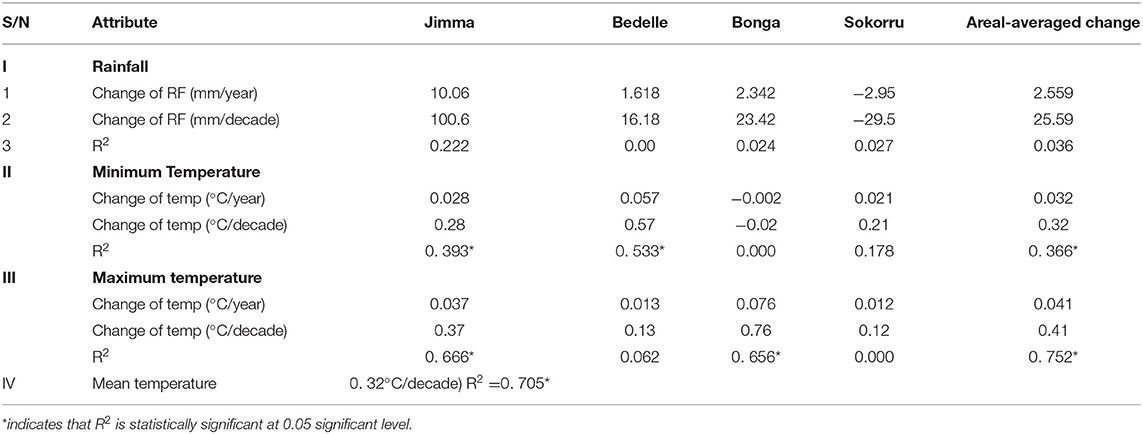
Table 6. Results from linear regression analysis of rainfall (1953–2018) and temperature (1967–2018), and their temporal changes in urban centers of Southwest Ethiopia.
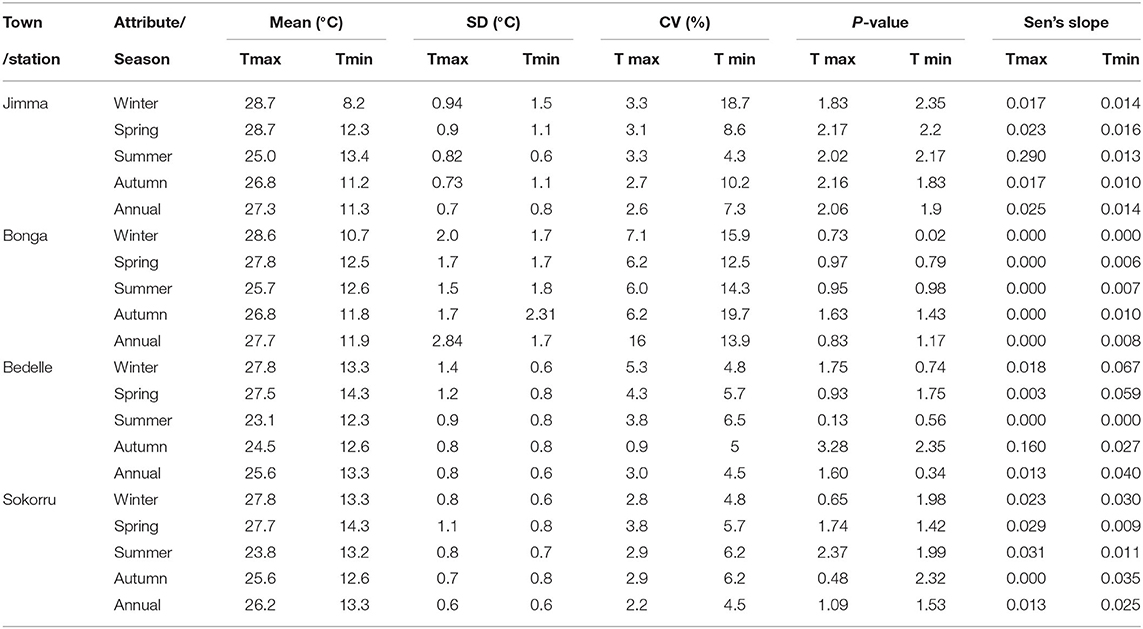
Table 7. Mann-Kendall trend test on seasonal and annual temperature in urban centers of Southwest Ethiopia.
This finding is lower than the global warming rate, which is estimated at 0.6°C, as documented in IPCC (2014) for the past century. Slight differences arose between our findings and a global rate because our study covers only a grid point with only four meteorological observation sites. Besides, we thought that in addition to the presence of vast natural tropical rain forests and 10 months of the rainy period, the region is located far from the country's industrial zones, which might contribute to the low GHGs emissions potential. The results we generated in this study are substantially comparable with previous studies on the average annual temperature of Ethiopia, where the rate of change was documented as +0.37°C per decade (EEA, 2008). Furthermore, as documented by EEA (2008), Ethiopia has been warming for the past four decades, with most warming occurring through the second half of the 1990s. This implies that the warming trend in southwest urban centers of Ethiopia is slower than the rest of the country because of the remnants of natural forests and the presence of better moisture status in the region.
As shown in Table 7, MK trend test results revealed that maximum and minimum average temperatures have increased since the 1950s, and the trend is statistically significant at the 95% level. The monthly maximum temperature has also increased, and for many months the trend is statistically significant at a 95% significance level.
Mann Kendall tests, both seasonal and annual for minimum and maximum temperature, showed to be statistically significant with the increasing trend at α = 0.05 level spatial variations over towns (Table 7). In Jimma City, the maximum temperature increased in all seasons and annually except during the winter, whereas the minimum temperature had a significant increase during winter and summer seasons. For Bedelle town, both minimum and maximum temperatures have an increasing trend during autumn. In Sokorru town, maximum temperature has an increasing trend, but it is not statistically significant for most seasons or annually except during summer when both minimum and maximum temperatures have significantly increased (Table 7; Supplementary Figure 4). Regarding inter-seasonal and annual variability of temperature during the study period, the minimum temperature has higher seasonal variability with the lowest Coefficient of variation (4.3%) in summer over Jimma City and the highest CV (19.7%) during autumn over Bonga, while the maximum temperature showed lower variability (Table 7).
The overall increase in annual temperature observed in the study area was attributed to an increase in the minimum temperature (the minimum temperature increment is more pronounced than the maximum). The empirical result is in agreement with the findings of similar studies conducted in various parts of Ethiopia (Conway et al., 2004; Tabari and Talaee, 2011; Roy and Das, 2013; Daniel et al., 2014; Asfaw et al., 2018), where the increasing trends in the minimum temperature series were higher than those in the maximum temperature. The result generated from our study, which is based in southwest Ethiopia, is consistent with similar research made for Addis Ababa (Feyisa et al., 2016). Therefore, it is apparent that temperatures in urban centers are warmer than the outskirts and its bio-physical conditions are up to 3.7°C, which needs further research in the study area. This study's findings are also complementary to the findings documented in the Cities Alliance (2017). One of the driving forces behind this narrative is that in Ethiopia, cities developed and expanded because of unplanned urban growth, unmanaged old and new vehicles for transportation, and energy needs in cities, which resulted in a temperature rise in recent decades, decline in rainfall totals, and increased incidences of extreme events. It was also found that very low rainfall anomaly values, which correspond to severe drought periods, had links to ENSO events and other global changes. Therefore, it is imperative to adjust the urban development under extreme variation in climate systems because of the changing climate. The data will also help in designing effective urban planning and implementation of climate change adaptation strategies ahead of time and mitigation actions to scale up the adaptive capacity and resilience of southwest Ethiopia's urban centers.
Impacts of Urbanization on LULCC and Local Climate
The rapid increase in built-up areas was the central cause behind various social, economic, and environmental changes throughout the study period. In this study, the results from LULC classification and climate variables, noticeably temperature and rainfall data analyses, showed that urban expansion induced significant impacts on land use land cover changes. Built-up areas expanded at the expense of shrinking of vegetation, cropland, and wetland areas (Table 3). This study has indicated the rapid expansion of anthropogenic influence on the LULC, where urban areas increased highly in the last three decades. Minimum temperature has also increased at a rate higher than that of mean and maximum temperature during the entire study period. Thus, this study revealed that during the early 2000s, the rate of change of areal averaged temperature over entire urban centers was greater than the 1990s, with the mean, minimum, and maximum increased by 0.7, 1.3, and 0.3oC, respectively. In East India, Partha et al. (2019) documented that an increase in areal-averaged temperatures was associated with LULC changes of urbanization, and with spatio-temporal variation, up to half of the warming due to LULC change in urban centers. Similarly, over four urban centers in Southwest Ethiopia, LULCC could possibly be attributed to the areal-averaged observed minimum, maximum, and mean temperature change with the order of 0.32, 0.41, and 0.32oC/decade, respectively (Tables 3, 6; Figure 7; Supplementary Figures 2–4). LULCC, therefore, induced a significant warming in urban centers as a result of changing in vegetation cover. In contrast, a change in rainfall amounts varied from place to place, where it increased over Jimma, but decreased more over Bedelle, Bonga, and Sokorru in the last 30 years than in the first 30 years of the study period.
In Ethiopia, much research has been done to examine the impact of urban expansion on LULCC. For instance, the study carried out in Addis Ababa (Abebe and Megento, 2016); Adama (Sinha et al., 2016); Mekelle (Tahir et al., 2013); Hawassa (Gashu and Gebre-Egziabher, 2018); and Dire Dawa (Taffa et al., 2017) showed that there was a significant increment in built-up areas, while there was a decline in green areas and open spaces. These findings are similar to the results we deduced in this study. Similar studies made for other major towns in Ethiopia also indicated that the temperature increased in recent decades and was projected to increase in the future, with no clear trend on precipitation change. For instance, the temperature change has shown an increasing trend over Mekelle, Bahirdar, Gondar, Adama, Diredawa, Gode, Jigjiga, Batu, Arbaminch, and others (Beyene, 2016; Mulugeta et al., 2017), as well as fluctuations in annual rainfall trends (Abebe, 2016). Climate-related impacts have also been highly reported for urban centers in part due to urban land use land cover change that directly related to a systematic rise in temperature, as well as intensive urban flooding during rainfall seasons. Results that were generated from similar studies resembled our findings, which revealed that urbanization could trigger substantial LULC changes that in turn resulted in local climate changes in urban centers of Southwest Ethiopia. In fact, as this study focused on four heterogenic urban centers, more research is required to understand comprehensive urban LULC changes and other factors linked to local and regional climate change. Nevertheless, as urban areas are currently undergoing rapid transformation due to intensive developmental activities, this could accelerate the rate of climate change in urban areas.
Conclusion
This study adopted a combined method of multi-temporal remote sensing image interpretation and GIS spatial analysis to characterize the dynamics of urban land use land cover change and emerging climatic extremes in the urban area of southwest Ethiopia during the period of 1957 to 2018. The LULCC analysis, which we carried out in four main urban centers, revealed a substantial land use land cover change between 1957 and 2018 due to the use of urban land for different human activities. As a result, the built-up areas showed an increasing trend over the last six decades in all urban centers, in contrast to the decline of vegetation, wetland, and cropland because of the conversion of lands to built-up areas. The rapid increase of built-up areas coupled with the sharp decline of green space because of urban expansion and urbanization led to the fast decline of agricultural and crop lands, which is practiced in many developing countries, leading to the changing of the local microclimate of the urban centers. The urban centers' surface temperature is warmer than the outskirts; the findings coincided with many studies claiming cities are “Heat high lands.” Areal-averaged rainfall totals of southwest Ethiopia urban centers have declined since the 1950s, coupled with recurrent extreme rainfall events with a strong spatial and temporal variation.
Since the early 1950s, annual rainfall totals have somewhat increased by <5 mm/year over parts of the urban centers, although the change is not statistically significant. The Mann Kendal test results showed there is intra seasonal and inter-annual rainfall variability while the summer and annual rainfall is less variable than other seasons. In this study we identified that there is a warming trend in the southwest urban centers and hence the latter half of the study period is warmer than the first half of the period. The local warming trend is accounted for because of the expansion of urbanization with buildings, the use of excessive energy sources, and expansion of new factories, business centers, and vehicles that contribute to localized warming in central parts of urban regions. Therefore, the study results revealed that the maximum, minimum, and mean daily temperatures have increased by 0.3, 1.3, and 0.7°C during 1987–2018 and from 1953 to 1986. Whereas, the results generated from a linear regression model showed an increasing trend of daily mean, minimum, and maximum temperatures by 0.21, 0.24, and 0.18°C per decade, respectively, from 1953 to 2018. These values are relatively comparable with the national (NMSA, 2001) and IPCC (2013) values, which is 0.3°C/decade on average.
Over the second study period, the urban centers of southwest Ethiopia experienced abrupt land use land cover change because of the momentum of urbanization and human activities, which also showed a similar temperature trend over recent decades. Thus, the urban centers of southwest Ethiopia are under the threat of climate change. Similar to other developing countries, urban centers that emerge from unplanned urban expansion and development at the expense of the urban environment and local climate, should devise strategies to comply with sustainable urban development so they can become more livable and resilient cities in the dynamic world of challenging climate change.
For many nations, the heart of politics, technological development, and economic growth lie in their urban centers, which also hosting rampant poverty, inequality, environmental hazards, and communicable diseases. Urban centers in developing countries are hampered by shortages of infrastructure services, and the unplanned development and lack of infrastructural development in urban areas of study towns escalated the effects of climate change.
Climate change is expected to exacerbate several threats to urban dwellers' health and well-being through direct physical injuries from the recurrence of extreme weather events, such as intense heavy rainfall that leads to flooding, often damage trees and infrastructure facilities, and disrupts access to clean water and food. Also, it causes water-borne diseases, food-borne diseases resulting from bacterial growth in foods exposed to higher temperatures, illnesses from a range of vector-borne infectious diseases, respiratory illnesses because of a worsening of poor air quality related to changes in temperature and precipitation resulting in the formation of smog, and vulnerability because of stress from hotter and longer heat waves, which are aggravated by the urban heat island effect. Climate change imposes an additional expense for more energy consumption even for buildings that use air conditioning and other technologies during hot summers. Most of the urban poor live in in environmentally unsuitable neighborhoods of urban regions, for instance along the hillsides, riverbanks, and water basins subject to landslides, flooding, or hazards which favor the spread of communicable and non-communicable diseases, pollution, poor nutrition, and other catastrophes. How much these environmental changes could associate with newly emerging climatic factors, land use land cover change, building, and infectious diseases needs further epidemiological research.
Although extensive urbanization has become an irreversible phenomenon, urban governments have to consider policies that enhance community participation in poverty reduction, addressing proper urban environmental issues, improving rural-urban linkages to improve food security, implementing urban safety net programs for social protection and health services, and increasing the capacity of urban dwellers to adapt to the challenges of climate change while seeking to reduce unplanned urbanization, which reduces the land use land cover change of urban areas.
Data Availability Statement
The raw data supporting the conclusions of this article will be made available by the authors, without undue reservation.
Author Contributions
TD and DK devised the project, the main conceptual ideas, and the proof outline. TD worked out almost all of the technical details, performed the numerical calculations for the manuscript, and wrote the manuscript under the close supervision of DK. DK closely worked out the supervision, involved almost in all technical details, and verified the numerical results of all sections with help from TD. DH and AW contributed to framing the manuscript and made valuable inputs. All authors contributed to the article and approved the submitted version.
Conflict of Interest
The authors declare that the research was conducted in the absence of any commercial or financial relationships that could be construed as a potential conflict of interest.
Acknowledgments
The authors would like to acknowledge the following institutions in the acquisition of necessary data and technical support for this work: United States Geological Survey (USGS), Jimma, Bedelle, Bonga and Sokorru City Administration Offices, Ethiopia Geo-Spatial Agency, and West Oromia Meteorological Services Center. We are also grateful to Jimma University College of Agriculture and Veterinary Medicine for writing supporting letters to study towns and institutions to undertake ethical procedures of the research and those friends who stand on our side during the research work. Finally, we would like to thank Juliet Way-Henthorne of the University of California Santa Barbara, who reviewed language coherency and consistency of this manuscript to the best standard.
Supplementary Material
The Supplementary Material for this article can be found online at: https://www.frontiersin.org/articles/10.3389/fclim.2020.577169/full#supplementary-material
References
Abebe, M. (2016). Remote sensing and geographic information system based suitability analysis of urban green space development in Addis Ababa: a case study of bole sub-city [M.Sc. thesis]. Addis Ababa University, Addis Ababa, Ethiopia.
Abebe, M., and Megento, T. (2016). The city of Addis Ababa from “Forest City” to “Urban Heat Island”: assessment of urban green space dynamic. J. Urban Environ. Eng. 10, 254–262. doi: 10.4090/juee.2016.v10n2.254262
Abebe, M. S., Derebew, K. T., and Gemeda, D. O. (2019). Exploiting temporal, spatial patterns of informal settlements using GIS and remote sensing technique: a case study of Jimma City, Southwestern Ethiopia. Environ. Syst. Res. 8:6. doi: 10.1186/s40068-019-0133-5
Agnew, C. T., and Chappel, A. (1999). Drought in the Sahel. Geojournal 48, 299–311. doi: 10.1023/A:1007059403077
Anderson, J. R., Hardy, E. E., Roach, J., and Witmer, R. E. (1976). A Land Use/Cover Classification System for Use With Remote Sensor Data. Sious Falls, SD: US Geological Survey Professional. Available online at: https://pubs.usgs.gov/pp/0964/report.pdf
Arragaw, A., and Woldeamlak, B. (2017). Local spatio temporal variability and trends in rainfall and temperature in the central highlands of Ethiopia. Geogr. Ann. Phys. Geogr. 99, 85–101. doi: 10.1080/04353676.2017.1289460
Asfaw, A., Simane, B., Hussein, A., and Bantider, A. (2018). Variability and time series trend analysis of rainfall and temperature in north central Ethiopia: a case study in Woleka sub-basin. Weather Clim. Extremes 19, 29–41. doi: 10.1016/j.wace.2017.12.002
Beyene, A. (2016). Precipitation and temperature trend analysis in Mekelle city, Northern Ethiopia, the case of Illala meteorological station. J. Earth Sci. Clim. Change. 7:1. doi: 10.4172/2157-7617.1000324
Bihrat, O., and Bayazit, M. (2003). The power of statistical test for trend detection. Turkish J. Eng. Env. Sci. 27, 247–251. Available online at: https://www.semanticscholar.org/paper/The-Power-of-Statistical-Tests-for-Trend-Detection-%C3%96n%C3%B6z-Bayazit/e05ceac33dcaba5ad8e451009ab8188063ccc4ec
Birsan, M., Molnar, P., Burlando, P., and Pfaundler, M. (2005). Stream Flow Trends in City A. The Climate Change and Energy Debate in Ethiopia. Brussels: Pegasys Institute and Ethio Resources Group.
Braimoh, A. K. (2006). Random and systematic land-cover transitions in northern Ghana. Agric. Ecosyst. Environ. 113, 254–263. doi: 10.1016/j.agee.2005.10.019
Cities Alliance (2017). About CDS [Online]. Available online at: http://www.citiesalliance.org/about-cds (accessed February 6, 2020).
Congalton, R. G. (1991). A review of assessing the accuracy of classifications of remotely sensed data. Remote Sens. Environ. 37, 35–46. doi: 10.1016/0034-4257(91)90048-B
Conway, D., Mould, C., and Woldeamlak, B. (2004). Over one century of rainfall and temperature observations in Addis Ababa, Ethiopia. Int. J. Climatol. 24, 77–91. doi: 10.1002/joc.989
Conway, D., and Woldeamlak, B. (2007). A note on the temporal and spatial variability of rainfall in the drought-prone Amhara region of Ethiopia. Int. J. Climatol. 27, 1467–1477. doi: 10.1002/joc.1481
CSA (2007). Population Statistical Abstract. Addis Ababa: Federal Democratic Republic of Ethiopia, Population Census Commission. Democratic Republic of Ethiopia, Population Census Commission.
Daniel, M., Woldeamlak, B., and Lal, R. (2014). Recent spatiotemporal temperature and rainfall variability and trends over the upper Blue Nile river basin, Ethiopia. Int. J. Climatol. 34, 2278–2292. doi: 10.1002/joc.3837
Debolini, M., Valette, E., and Chery, J. P. (2015). Mapping land use competition in the rural-urban fringe and future perspectives on land policies: a case study of Meknès (Morocco). Land Use Policy 47, 373–381. doi: 10.1016/j.landusepol.2015.01.035
EEA (2008). Climate Change and Development Adaptation Measures. Addis Ababa: Ethiopian Economic Association.
Epstein, J., Payne, K., and Kramer, E. (2002). Techniques for mapping suburban sprawl. Photogr. Eng. Remote Sens. 63, 913–918.
Feyisa, G. L., Meilby, H., Darrel Jenerette, G., and Pauliet, S. (2016). Locally optimized separability enhancement indices for urban land cover mapping: exploring thermal environmental consequences of rapid urbanization in Addis Ababa, Ethiopia. Remote Sens. Environ. 175, 14–31. doi: 10.1016/j.rse.2015.12.026
Funk, C., Dettinger, M. D., Michaelsen, J. C., Verdin, J. P., Brown, M. E., Barlow, M., et al. (2008). Warming of the Indian Ocean threatens eastern and southern African food security but could be mitigated by agricultural development. Proc. Natl. Acad. Sci. U.S.A. 105, 11081–11086. doi: 10.1073/pnas.0708196105
Funk, C., Rowland, J., Eilerts, G., Kebebe, E., Biru, N., White, L., and Galu, G. (2012). A Climate Trend Analysis of Ethiopia, Fact Sheet 2012-3053. U.S. Geological Survey. doi: 10.3133/fs20123053
Garai, D., and Narayana, A. C. (2018). Land use/land cover changes in the mining area of Godavari coal fields of southern India. Egypt J. Remote Sens. Space Sci. 21, 375–381. doi: 10.1016/j.ejrs.2018.01.002
Gashu, K., and Gebre-Egziabher, T. (2018). Spatiotemporal trends of urban land use/land cover and green infrastructure change in two Ethiopian cities: Bahir Dar and Hawassa Kassahun. Environ. Syst. Res. 7:8. doi: 10.1186/s40068-018-0111-3
Gebre, H., Kindie, T., Girma, M., and Belay, K. (2013). Trend and variability of rainfall in Tigray, Northern Ethiopia: analysis of meteorological data and farmers' perception. Acad. J. Environ. Sci. 1, 159–171. doi: 10.15413/ajar.2013.0117
Gebremedhin, K., Shetty, A., and Nandagiri, L. (2016). Analysis of variability and trends in rainfall over northern Ethiopia. Arab J. Geosci. 9:451. doi: 10.1007/s12517-016-2471-1
Getachew, K., and Tamene, A. (2015). Assessment of the effect of urban road surface drainage: a case study at Ginjo Guduru Kebele of Jimma town. Int. J. Sci. Technol. Soc. 3, 164–173. doi: 10.11648/j.ijsts.20150304.20
Getenet, K, and Bewket, W. (2009). Variations in rainfall and extreme event indices in the wettest part of Ethiopia. SINET 32, 129-140.
Giannaros, T. M., Melas, D., Daglis, I. A., Keramitsoglou, I., and Kourtidis, K. (2013). Numerical study of the urban heat island over Athens (Greece) with the WRF model. Atmos. Environ. 73, 103–111. doi: 10.1016/j.atmosenv.2013.02.055
Grimm, N. B., Faeth, S. H., Golubiewski, N. E., Redman, C. L., Wu, J., Bai, X., et al. (2008). Global change and the ecology of cities. Science 319, 756–760. doi: 10.1126/science.1150195
Hare, W. (2003). Assessment of Knowledge on Impacts of Climate Change-Contribution to the Specification of art. 2 of the UNFCCC: Impacts on Ecosystems, Food Production, Water and Socio-Economic Systems. Available online at: https://www.researchgate.net/publication/ (accessed March 12, 2020).
He, C., Okada, N., Zhang, Q., Shi, P., and Li, J. (2008). Modelling dynamic urban expansion processes incorporating a potential model with cellular automata. Landsc. Urban Plann. 86, 79–91. doi: 10.1016/j.landurbplan.2007.12.010
Herold, M., Goldstein, N. C., and Clarke, K. C. (2003). The spatiotemporal form of urban growth. Remote Sens. Environ. 86, 286–302. doi: 10.1016/S0034-4257(03)00075-0
IPCC (2013). “Climate change 2013: the physical science basis,” in Contribution of Working Group I to the Fifth Assessment Report of the Intergovernmental Panel on Climate Change, eds T. F. Stocker, D. Qin, G.-K. Plattner, M. Tignor, S. K. Allen, J. Boschung, A. Nauels, Y. Xia, V. Bex, and P. M. Midgley (Cambridge; New York, NY: Cambridge University Press), 1535.
IPCC (2014). Climate Change 2014: Impacts, Adaptation, and Vulnerability; Part A: Global and Sectoral Aspects. Contribution of Working Group II to the Fifth Assessment Report of the Intergovernmental Panel on Climate Change. Cambridge; New York, NY: Cambridge University Press.
Jimma City Administration (2019). Spatial Planning and Socioeconomic Assessment of the Master Plan Under the Revision Document.
Kassa, F. (2015). Ethiopian seasonal rainfall variability and prediction using canonical correlation analysis (CCA). Earth Sci. 4, 112–119. doi: 10.11648/j.earth.20150403.14
Korecha, D. (2013). Characterizing the predictability of seasonal climate in Ethiopia [Dissertation for the degree philosophiae doctor (PhD) in Meteorology]. University of Bergen, Bergen, Norway.
Korecha, D., and Barnston, A. G. (2007). Predictability of June–September rainfall in Ethiopia. Mon. Weather Rev. 135, 628–650. doi: 10.1175/MWR3304.1
Lillesand, T., Kiefer, R. W., and Chipman, J. (2015). Remote Sensing and Image Interpretation. Hoboken, NJ: John Wiley and Sons.
Lillesand, T. M., Keifer, R. W., and Chipman, J. W. (2004). Remote sensing and image interpretation. 5th ed. (New York: Wiley). Geogr. J. 146. doi: 10.2307/634969
Liu, Z., He, C., Zhou, Y., and Wu, J. (2014). How much of the world's land has been urbanized, really? A hierarchical framework for avoiding confusion. Landscape Ecol. 29, 763-771. doi: 10.1007/s10980-014-0034-y
Lu, D., Mausel, P., Batistella, M., and Moran, E. (2004). Land-cover binary change detection methods for use in the moist tropical region of the Amazon: a comparative study. Int. J. Remote Sens. 26, 101–114. doi: 10.1080/01431160410001720748
Mann, H. B. (1945). Non-parametric tests against trend. Econometrica 13, 245–259. doi: 10.2307/1907187
McSweeney, C., New, M., Lizcano, G., and Lu, X. (2010). Improving the accessibility of observed and projected climate information for studies of climate change in developing countries. Bull. Am. Meteorol. Soc. 91, 157–167. doi: 10.1175/2009BAMS2826.1
Mekonnen, A. D., and Woldeamlak, B. (2014). Variability and trends in rainfall amount and extreme event indices in the Omo-Ghibe River Basin, Ethiopia. Reg. Environ. Change 14, 799–810. doi: 10.1007/s10113-013-0538-z
Mengistie, K., Thomas, S., Demel, T., and Thomas, K. (2013). Land use/land cover change analysis using an object based classification approach in the Munesa Shashemene Landscape of the Ethiopian highlands. Remote Sens. 5, 2411–2435. doi: 10.3390/rs5052411
Mohammed, Y. (2018). Meteorological drought assessment in north east highlands of Ethiopia. Int. J. Clim. Change Strateg. Manag. 10, 142–160. doi: 10.1108/IJCCSM-12-2016-0179
Montgomery, M. R. (2008). The urban transformation of the developing world. Science 319, 761-764. doi: 10.1126/science.1153012
Mulugeta, M., Tolossa, D., and Abebe, G. (2017). Description of long-term climate data in Eastern and Southeastern Ethiopia. J. Data Brief 12, 26–36. doi: 10.1016/j.dib.2017.03.025
NMA (2019). Observed Monthly Rainfall and Temperature data over Ethiopia. Available online at: http://www.ethiomet.gov.et (accessed March 16, 2020).
NMSA (2001). Initial National Communication of Ethiopia to the United Nations Framework Convention on Climate Change (UNFCCC). National Meteorological Services Agency under the GEF supported Climate Change Enabling Activities Project of Ethiopia.
Oliver, J. E. (1980). Monthly precipitation distribution: a comparative index. Prof. Geogr. 32, 300–309. doi: 10.1111/j.0033-0124.1980.00300.x
Partha, P. G., Vinoj, V., Roberts, D. S. G., Dash, J., and Tripathy, S. (2019). Land use and land cover change effect on surface temperature over Eastern India. Natu. Sci. Rep. 9:8859. doi: 10.1038/s41598-019-45213-z
Patra, S., Sahoo, S., Mishra, P., and Mahapatra, S. C. (2018). Impacts of urbanization on land use /cover changes and its probable implications on local climate and groundwater level. J. Urban Manag. 7, 70–84. doi: 10.1016/j.jum.2018.04.006
Philippon, N., Camberlin, P., and Fauchereau, N. (2002). Empirical predictability study of October–December East African rainfall. Q. J. R. Meteorol. Soc. 128, 2239–2256. doi: 10.1256/qj.01.190
Pontius, R. G. Jr., Shusas, E., and McEachern, M. (2004). Detecting important categorical land changes while accounting for persistence. Agricult. Ecosyst. Environ. 101, 251–268. doi: 10.1016/j.agee.2003.09.008
Roy, T. D., and Das, K. K. (2013). Temperature trends at four stations of Assam during the period 1981-2010. Int. J. Sci. Res. Publ. 3, 1–3.
Seleshi, Y., and Zanke, U. (2004). Recent changes in rainfall and rainy days in Ethiopia. Int. J. Climatol. 24, 973–983. doi: 10.1002/joc.1052
Sen, P. K. (1968). Estimates of the regression coefficient based on Kendall's tau. J. Am. Stat. Switzerland. J. Hydrol. 314, 312–329. doi: 10.1080/01621459.1968.10480934
Sinha, P., Verma, N., and Ayele, E. (2016). Urban built-up area extraction and change detection of Adama municipal area using time-series landsat images. Int. J. Adv. Remote Sens. GIS. 5, 1886–1895. doi: 10.23953/cloud.ijarsg.67
Tabari, H., Meron, T. T., and Willems, P. (2015). Statistical assessment of precipitation trends in the upper Blue Nile River basin. Stoch. Environ. Res. Risk Assess. 29, 1751–1761. doi: 10.1007/s00477-015-1046-0
Taffa, C., Mekonen, T., Mulugeta, M., and Tesfaye, B. (2017). Data on spatiotemporal urban sprawl of Dire Dawa City, Eastern Ethiopia. Data Brief 12, 341–345. doi: 10.1016/j.dib.2017.04.008
Tahir, M., Imam, E., and Hussain, T. (2013). Evaluation of land use/land cover changes in Mekelle City, Ethiopia using Remote Sensing and GIS. Comput. Ecol. Softw. 3, 9–16. Available online at: http://www.iaees.org. (accessed March 12, 2020).
Tesfaye, G. A. (2017). Monitoring trends of greenness and LULC (land use/land cover) change in Addis Ababa and its surrounding using MODIS time-series and LANDSAT Data. Lund University GEM thesis series NGEM01 20171, Department of Physical Geography and Ecosystem Science. Available online at: http://lup.lub.lu.se/student-papers/record/8917891
Theil, H. (1950). “A rank invariant method of linear and polynomial regression analysis, i, ii, iii,” in Proceedings of the Koninklijke Nederlandse Akademie Wetenschappen, Series A Mathematical Sciences, Vol. 53, 386–392, 521–525, 1397–1412.
United Nations (2014). World Urbanization Prospects, The 2014 Revision. Available online at: http://esa.un.org/unpd/.
Vargo, J., Habeeb, D., and Stone, B. (2013). The importance of land cover change across urban– rural typologies for climate modeling. J. Environ. Manag. 114, 243–252. doi: 10.1016/j.jenvman.2012.10.007
Viste, E., Korecha, D., and Sorteberg, A. (2013). Recent drought and precipitation tendencies in Ethiopia. Theor. Appl. Climatol. 112, 535-551. doi: 10.1007/s00704-012-0746-3
Viste, E., Korecha, D., and Sorteberg, A. (2012). Recent drought and precipitation tendencies in Ethiopia. Theoret. Appl. Climatol. 2018, 29–41.
Wilson, B., and Chakraborty, A. (2013). The environmental impacts of sprawl: emergent themes from the past decade of planning research. Sustainability 5, 3302–3327. doi: 10.3390/su5083302
Witten, K., Exeter, D. J., and Field, A. (2003). The quality of urban environments: mapping variation in access to community resources. Urban Stud. 40:161–177. doi: 10.1080/00420980220080221
Keywords: image classification, LULCC, climate change, Southwest Ethiopia, trend analysis and projection, urban planning and development
Citation: Dessu T, Korecha D, Hunde D and Worku A (2020) Long-Term Land Use Land Cover Change in Urban Centers of Southwest Ethiopia From a Climate Change Perspective. Front. Clim. 2:577169. doi: 10.3389/fclim.2020.577169
Received: 28 June 2020; Accepted: 01 December 2020;
Published: 23 December 2020.
Edited by:
Dann Mitchell, University of Bristol, United KingdomCopyright © 2020 Dessu, Korecha, Hunde and Worku. This is an open-access article distributed under the terms of the Creative Commons Attribution License (CC BY). The use, distribution or reproduction in other forums is permitted, provided the original author(s) and the copyright owner(s) are credited and that the original publication in this journal is cited, in accordance with accepted academic practice. No use, distribution or reproduction is permitted which does not comply with these terms.
*Correspondence: Diriba Korecha, ZGtvcmVjaGFAZmV3cy5uZXQ=