 Juan A. Rivera
 Elizabeth Naranjo Tamayo1
 Maximiliano Viale
- 1Instituto Argentino de Nivología, Glaciología y Ciencias Ambientales (IANIGLA), Centro Científico Tecnológico CONICET Mendoza, Mendoza, Argentina
- 2Instituto de Geotecnologías (IGEO), Universidad Juan Agustín Maza, Mendoza, Argentina
This study documents the projected changes in several components (precipitation, runoff, snow cover and depth, soil moisture) of the hydrological cycle in Central-Western Argentina (CWA) based on the simulations from the IPSL-CM6A-LR model for the warming levels proposed in the Paris Agreement. These warming levels represent the future increase in mean annual temperature of 1.5 and 2°C compared to pre-industrial conditions. A novel regional approach, that uses a set of low-emissions shared socioeconomic pathways (SSP) compatible with the Paris Agreement goals, has been applied here for the evaluation of the potential impacts of temperature increase in both the mountainous areas of the Andes and the lowlands on the eastern portion of CWA. Our results show that the timing of reaching the 1.5°C warming level would be between 2032 and 2036 in the CWA lowlands east of the Andes, while this warming level in the Andes mountains of CWA would be 10–15 years earlier as result of the stronger warming with elevation. The higher 2°C warming level would be reached before 2050 in the Andes mountains. Even using the more aggressive mitigation pathways available in the scientific literature (SSP1-1.9 and SSP1-2.6), the IPSL-CM6A-LR model ensemble shows a robust drying signal in the wintertime precipitation over the Andes mountains, which is a concerning result because it implies a reduction of the already scarce water resources draining to the adjacent semi-arid foothills. Our results also show that this drying should be linked to the poleward expansion of the Hadley Circulation. In the lowlands farther east from the Andes, the summertime monsoonal precipitation provides the water resources that are projected to increase under the selected emissions pathways. The expected changes in the analyzed components of the hydrological cycle would be strengthened under the 2°C warming level, particularly the decline of snow amount and surface runoff in the Andes. The results of this study provide insights into the expected impacts of the 1.5 and 2°C warming levels in the CWA regional water resources, which may set the stage for the new discussions of possible options to mitigate them at country and regional levels.
Introduction
Global warming is expected to cause widespread changes to the terrestrial water cycle, as a result of variations in large-scale circulation patterns. Changes like the narrowing of the tropical rain belts, the variations in the monsoon systems, the poleward expansion of the Hadley Circulation and its consequent displacement of the extratropical storm tracks, will likely exacerbate water scarcity in some regions and the occurrence of flooding events in others (Byrne and Schneider, 2016; Deng et al., 2018; Ma et al., 2018; Markus et al., 2019; Cook et al., 2020). In particular for the arid to semi-arid regions of the world, the water availability for cities, energy production and agriculture, among other activities, is facing more recurrent reductions (Cai et al., 2012; Herrera-Pantoja and Hiscock, 2015; Donnelly et al., 2017). This is the case of Central-Western Argentina (CWA), a dry region where the interplay between the complex topography and the atmospheric circulation determines a wide range of hydroclimatic features (Camisay et al., 2020). In terms of temperature, the CWA region has experienced since the second half of the twentieth Century a sustained increase in the annual mean temperatures, particularly in the daily minimum temperatures, a reduction in the occurrence of frost days, an increase in the frequency of heat waves and a raising of the zero degree isotherm altitude (Barros et al., 2015; Castex et al., 2015; Rusticucci et al., 2016; Secretaría de Ambiente y Desarrollo Sustentable, 2019). In terms of precipitation, positive trends in the annual rainfall, more frequent extreme precipitation events and hail occurrences were documented in the lowlands sector of the CWA region, where a monsoonal precipitation regime dominates (Barros et al., 2015; Castex et al., 2015; Rivera et al., 2020). Conversely, a sustained precipitation decline is observed over the Andes mountains at the CWA latitudes, where the Mediterranean-like climate faces decreases in snow accumulation, glacier mass balance losses, and streamflow droughts (Rivera et al., 2017; Masiokas et al., 2020; Rivera and Arnould, 2020). The main socio-economic activities over CWA, particularly along the Andean foothills, are only possible through irrigation. The main water source for the irrigated oases of the region depends on streamflow from the main rivers of the region, which have a strong dependency on snowmelt (Masiokas et al., 2006) and glaciermelt, mainly during years with low snow accumulation (Crespo et al., 2020). Thus, winter snow accumulation along the Andes plays a major role in the water availability during summer months, with crucial relevance for agriculture (Viale et al., 2018).
These observed changes in the precipitation patterns and its implications for the hydrological cycle components it the CWA region have been linked to changes in large-scale atmospheric circulation induced by increased greenhouse gases (GHG) emissions and ozone depletion (Staten et al., 2018; Villamayor et al., 2019; Mindlin et al., 2020). In particular, the poleward expansion of the Hadley Circulation has been attributed to play a significant role in the observed long-term precipitation decline along South-Western South America. The position of the descending branch of the Hadley Circulation over the Southern Hemisphere exhibited a trend to a poleward expansion of between 0.2 and 0.5° latitude per decade during the last 40 years, according to different metrics and reanalysis datasets (Staten et al., 2018). This expansion was also identified through the position of the semi-permanent South Pacific anticyclone, with its southern rim reaching higher latitudes (Flores-Aqueveque et al., 2020) and an increase in the sea level pressure along its domain (Rivera and Arnould, 2020). These changes favored the southern shift of the storm tracks, leading to precipitation declines on seasonal and annual time scales.
Considering the future projections based on the Coupled Model Intercomparison Project Phase 5 (CMIP5), most of the available research over CWA focused on the use of climate models forced under moderate to high representative concentration pathways (RCP) emissions scenarios. For example, by looking at the 2075–2099 period under the RCP8.5 scenario, Cabré and Nuñez (2020) found a significant displacement of winegrowing regions of western Argentina toward higher altitudes closer to the Andes foothills. This is consistent with a significant increase in temperatures in the whole CWA region, affecting also the hydroclimate of the region through an early snowmelt peak, a reduction in the albedo and projected glacier mass balance losses (Barros et al., 2015; Zazulie et al., 2018; Hock et al., 2019). The projected changes are strongly dependent on the considered emissions scenario, with substantial differences in the magnitude of the temperature and precipitation changes depending upon the use of moderate emission scenarios as the RCP4.5 or the high-emission scenario RCP8.5, particularly by the end of the Twenty-first Century (Secretaría de Ambiente y Desarrollo Sustentable., 2015). These differences highlights the role of the mitigation strategies to reduce GHG emissions and its associated impacts on the hydroclimate of the region, playing a pivotal role in the socio-economic activities that are dependent on surface runoff and groundwater. From a dynamical perspective, Fahad et al. (2020) have identified a poleward displacement and an increase in the intensity of the South Pacific semi-permanent anticyclone for the second half of the Twenty-first Century using a high emissions scenario. Thus, it is expected that the mechanism favoring the precipitation decline along the western portion of CWA might continue over the next decades.
In order to significantly reduce the risk and impacts of climate change, the 2015 Paris Agreement brought the United Nations Framework Convention on Climate Change (UNFCCC) member states to put forward actions to limit global warming well below 2°C above pre-industrial levels and to pursue further efforts to limit the average temperature increase to 1.5°C compared to pre-industrial levels (United Nations Framework Convention on Climate Change, 2015). To achieve the 2°C goal, the anthropogenic CO2 emissions eventually must cease, including decarbonization options and a massive transformation of the global energy system (Sanderson et al., 2016). For that purpose, nations worldwide pledged emissions reductions and agreed to periodically review these pledges to strengthen their level of ambition (Santos Da Silva et al., 2019). These mitigation alternatives are intended to be performed on the basis of equity, and in the context of sustainable development and efforts to eradicate poverty (Mba et al., 2018). Evaluations of the possible options available in terms of mitigation policy and its implications for the Paris Agreement temperature goals have been discussed extensively in the current scientific literature (Schellnhuber et al., 2016; Schleussner et al., 2016; Robiou du Pont et al., 2017; Larkin et al., 2018; Rogelj et al., 2018).
Global evaluations of the projected impacts of the 1.5 and 2°C goals have shown the potential advantages of limiting warming to 1.5°C, particularly considering ecosystems and human systems (Hoegh-Guldberg et al., 2019). This kind of evaluation has been performed at regional scales, showing a significant reduction in regional and local climate risks as a consequence of limiting the temperature increase to 1.5°C (Mba et al., 2018; Nikulin et al., 2018). In order to understand the impacts of climate change generated by the 1.5 and 2°C warming levels, we investigate here the projected changes in the hydrological cycle over the CWA region, considering the evaluation of precipitation, runoff, snow cover and depth, snow amount, and soil moisture. For this purpose, we selected a range of low emissions shared socioeconomic pathways (SSPs, O'Neill et al., 2016), using the IPSL-CM6A-LR model from the Coupled Model Intercomparison Project Phase 6 (CMIP6). From a dynamical perspective, we also evaluate the future changes in the position of the Southern Hemisphere descending branch of the Hadley Circulation under the selected warming levels. Considering the dependence on scarce water resources for the development of regional socio-economic activities over CWA, this study uses the new generation of emission scenarios to provide insights regarding the future hydroclimate of the region. We aim to provide relevant information for scientific and governmental plans under the Paris Agreement, analyzing the potential options for mitigation both at regional and country levels.
Methods
Study Area
The study area covers the CWA, a region located between the Andes and the Pampas roughly between 30°S and 37°S and 64° to 70°W, comprising the provinces of Mendoza, San Juan, San Luis, the western portion of Córdoba province, the northern part of Neuquén and La Pampa provinces, and the southern part of La Rioja province (Figure 1). This region is characterized by a strong influence of topography on the regional and local climate (Viale et al., 2019). Two distinct sub-regions can be differentiated in terms of precipitation seasonality, the Andes mountains and the Lowlands. This sector of the Andes range is characterized by a narrow width (<200 km), a north-south orientation centered at 70°W, and a mean elevations of ~4,500 m with peaks that can exceed 6,000 m.a.s.l. (Garreaud, 2009). The precipitation over this mountainous region has a Mediterranean regime (Viale and Nuñez, 2011), with precipitation concentrated mostly during the cold season (April to September) and a dry warm season (October to March) in response to the seasonal displacement of the Southeastern Pacific High (Rivera et al., 2017). On the other hand, the Lowlands region is characterized by a monsoonal precipitation regime, with a more marked seasonality near the Andean foothills (Doyle, 2020). Due to the marked rain shadow effect, the climate in the Lowlands is arid to semi-arid in the west and sub-humid in the east, with convective warm-season rainfalls favored by moist air masses from the Amazon and Atlantic basins (Garbarini et al., 2019; Viale et al., 2019; Camisay et al., 2020). The agroindustrial activities depend mainly on grape and olive production on the plains near the Andes (Cabré and Nuñez, 2020), while cattle production and crops as peanuts, maize and soybean are more relevant in the eastern portion of CWA (east of 67°W).
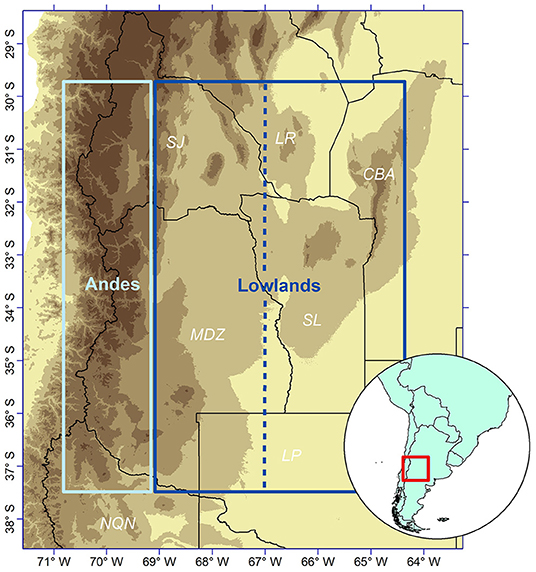
Figure 1. Study area with the delimitation of the main regions analyzed (Andes and Lowlands) and the provinces included in the CWA. CBA, Córdoba; LP, La Pampa; LR, La Rioja; MDZ, Mendoza; NQN, Neuquén; SJ, San Juan; SL, San Luis. The dashed line divides the Eastern and Western portions of the Lowlands region.
Long-term surface observations have showed negative precipitation trends along the Andes region (Rivera and Arnould, 2020), which favored a sustained glacier mass loss over the higher elevations of the Andes ranges (Dussaillant et al., 2019), and positive precipitation trends over the Lowlands region (Maenza et al., 2017; Rivera and Arnould, 2020). The interannual rainfall variability over the whole CWA region has been partially attributed to El Niño-Southern Oscillation (ENSO), with El Niño events favoring positive precipitation anomalies (both snow and rainfall) and La Niña events accounting for precipitation deficits, although with spatial heterogeneity (Masiokas et al., 2006; Penalba and Rivera, 2016; Hurtado and Agosta, 2020).
Reference Data for the IPSL-CM6A-LR Model Validation
For the validation of the precipitation and temperature data from the IPSL-CM6A-LR model outputs we used records from the Climatic Research Unit (CRU) Time-Series (TS) version 4.04 (Harris et al., 2020) as reference in the comparison. The CRU dataset covers the period 1901–2019 with a 0.5° × 0.5° spatial resolution, and provides monthly grid land-based observations derived from archives of meteorological stations from national meteorological services and other external agencies. For the validation of the remaining variables (runoff, snow cover, and depth), including also precipitation and temperature, we used data from the ERA5-Land product (Hersbach et al., 2020), which spans the period 1981–2020 at 0.1° × 0.1° horizontal resolution. Despite the availability of observations for runoff, snow cover and snow depth over the region, we decided to use the gridded ERA5-Land outputs given the difficulty to compare between variables measured at hydrometeorological stations with variables averaged spatially over a grid square.
IPSL-CM6A-LR Model Data
The IPSL-CM6A-LR global climate model was developed at the Institut Pierre-Simon Laplace (IPSL) to study natural climate variability and climate response to natural and anthropogenic forcings (Boucher et al., 2020). The previous version of the model (IPSL-CM5A-MR) was found to be the best model among 24 climate models from the CMIP5 in representing the regional present-climate over the study area (Cabré and Nuñez, 2020). Moreover, the IPSL-CM6A-LR showed a good representation of precipitation patterns and long-term trends considering the CMIP6 historical runs over the CWA, with a significant pattern correlation coefficient (PCC = 0.55, p < 0.05) between the observed and the simulated fields of precipitation trends over Southwestern South America during 1901–2014 as a result of increases in the regional sea level pressure pattern (Rivera and Arnould, 2020). Significant improvements in the model climatology (particularly for temperature and precipitation) were documented compared to previous model versions, a factor that is particularly linked to the new version of the atmospheric component of the model (Boucher et al., 2020; Hourdin et al., 2020). The horizontal resolution of the model is 2.5° × 2.5°.
In order to achieve the objectives of this research, we used a combination of the IPSL-CM6A-LR historical runs and future projections. The historical simulations are forced with estimates of natural (e.g., volcanic eruptions, solar, and orbital variability) and anthropogenic (e.g., greenhouse gas emissions, aerosols, land use change) climate forcings to simulate climate change and variability over the period covered by the observational record (Cook et al., 2020). Following the CMIP6 protocol, these simulations cover the 1850–2014 period for the IPSL-CM6A-LR model. We selected 10 out of 32 simulations for the characterization of past climate variations over the study area, in order to reduce computational costs and considering the lack of sensitivity to the choice of the members (Boucher et al., 2020). These simulations differ slightly in their atmospheric and oceanic conditions at the beginning of the model runs. Following the evaluation performed by Rivera and Arnould (2020), these model runs were regridded to 1° × 1° resolution using bilinear interpolation, which led to consider 14 grid points over the Andes region and 35 grid points over the Lowlands. The model ensemble was calculated as the average of the 10 selected runs.
We used a set of low emissions scenarios from the new ScenarioMIP pathways of future emissions (O'Neill et al., 2016). In this sense, we considered the updated version of the RCP2.6 (SSP1-2.6), which represents a low end of the range of future forcing pathways and will produce a multi-model mean of <2°C warming by 2100. Additionally, we used the SSP1-1.9 scenario, which represents the very low end of the range of scenarios in the literature, generated from the policy interest for scenarios that would inform a possible goal of limiting global mean warming to 1.5°C above pre-industrial levels (James et al., 2017). Thus, SSP1-1.9 and SSP1-2.6 pathways are expected to provide information relative to limit global warming to 1.5 and 2°C, respectively. Finally, we also analyzed the SSP4-3.4, which fills the gap at the low end of the range of future forcing pathways, reaching 3.4 W m−2 by 2,100 and a temperature increase slightly above 2°C with respect to pre-industrial levels. The three selected scenarios show the lowest levels of CO2 concentration and temperature change by the end of the Twenty-first Century (O'Neill et al., 2016). The IPSL-CM6A-LR has 6 runs for the SSP1-1.9 and SSP1-2.6 scenarios, while only 2 runs are available for the SSP4-3.4. Compared to the total set of scenarios, the selected ones received less attention in the climate modeling community when compared with, for example, the scenarios SSP2-4.5 or SSP5-8.5 (updates of the RCP4.5 and RCP8.5, respectively). Following the procedure performed for the historical runs, the future projections were regridded to 1 × 1° horizontal resolution and the model ensemble was calculated as the average of the model runs for the three selected scenarios.
From the selected model runs, we assessed the projected changes in near-surface temperature over the study area (see Warming levels section). Moreover, we selected the following variables in order to evaluate the projected changes in the hydrological cycle over the study area considering different warming levels: precipitation (pr), total soil moisture content (mrso), total surface runoff (mrros), total runoff (mrro), snow area percentage (snc), snow depth (snd), and surface snow amount (snw). Table 1 provides information relative to the selected variables. The changes in the snow related variables were calculated only for the period with significant snow accumulation, i.e., from May to October (Masiokas et al., 2006; Figure 2D).
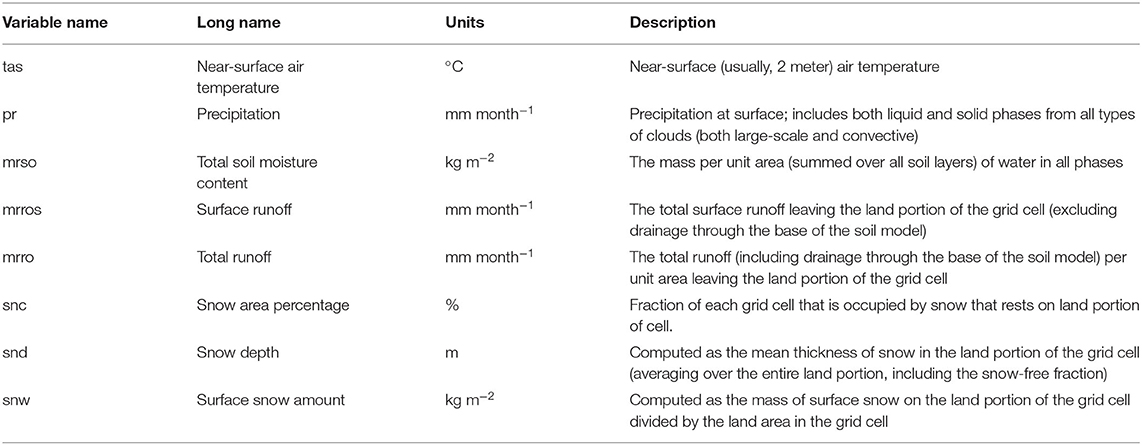
Table 1. Description of the variables of the IPSL-CM6A-LR model analyzed for the evaluation of the changes in the hydrological cycle over the CWA.
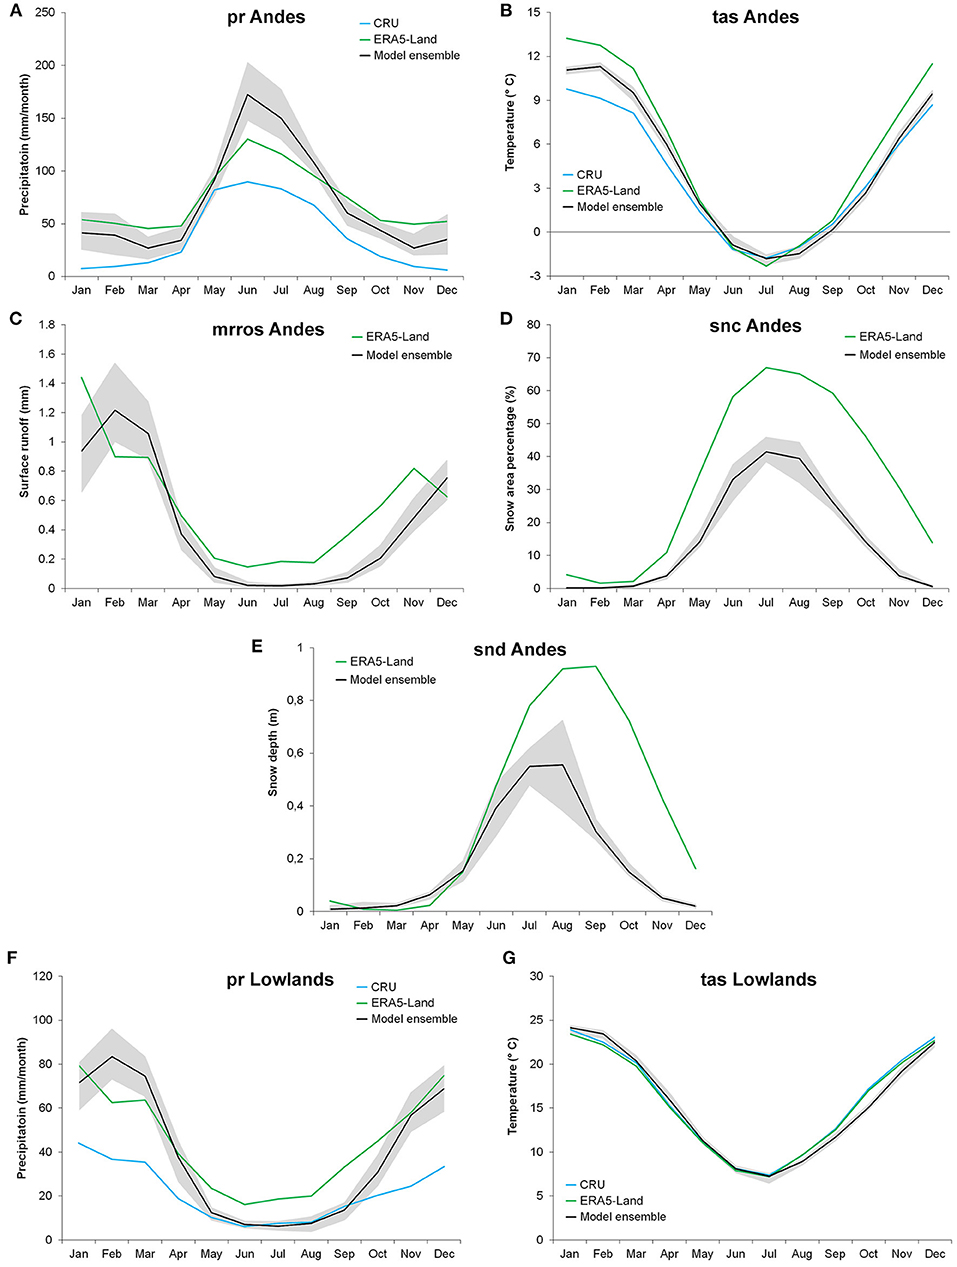
Figure 2. Annual cycle of the variables considered for the validation of the IPSL-CM6A-LR model runs over the 1981–2010 control period. (A–E) Show the annual cycle over the Andes domain, while (F,G) show the annual cycle over the Lowlands. The black lines represent the model ensemble mean considering the 10 historical runs selected, the blue lines represent the annual cycle obtained through the CRU TS 4.04 database, the green lines show the variables obtained through ERA5-Land reanalysis. The gray shading indicates the 5 and 95% quantiles derived from the dispersion of the historical runs. (A) pr (mm), (B) tas (°C), (C) mrros (the depth in mm the water would have if it were spread evenly over the grid box), (D) snc (the fraction of the cell in % occupied by snow), (E) snd (m), (F) pr (mm), and (G) tas (°C).
Warming Levels
To investigate the future changes in the hydroclimate of CWA considering the targets of the Paris Agreement, we calculated the periods for which the predefined near-surface temperature anomalies of 1.5 and 2°C relative to pre-industrial levels are reached. For this purpose, several definitions are available in the recent literature, typically starting with some pre-industrial baseline period, an averaged window period, the calculation of the anomalies relative to the baseline period and the identification of the year when the warming levels are reached (James et al., 2017; Nikulin et al., 2018). Firstly, considering that the rate of warming is amplified with elevation (Rangwala et al., 2013; Pepin et al., 2015; Zazulie et al., 2018), it is expected that high-mountain environments (Andes region) will warm faster than environments at lower elevations (Lowlands region), and so we calculated separately the regional warming levels for these two sub-domains. The pre-industrial period is defined as the multi-century period prior to the onset of large-scale industrial activity around 1,750 (IPCC, 2018). Hawkins et al. (2017) showed that the 1720–1800 period is the most suitable to be defined as pre-industrial in physical terms, although the 1850–1900 period provided a reasonable approximation. For this study, we selected the 1861–1890 period as an approximation of pre-industrial conditions, in line with the choices of others previous research (Kjellström et al., 2018; Mba et al., 2018). Each of the simulated regional warming time series was smoothed with a 30-year moving average filter. A warming level is reached by the first time when the central year of the 30-year moving average is above 1.5 or 2°C compared to the pre-industrial baseline. A control period 1981–2010 was selected to compare the future changes in the analyzed variables, calculating differences among 30-year periods. While several studies opted to show projected changes compared to pre-industrial periods, thus describing the full scale of changes resulting from anthropogenic forcing (Neukom et al., 2015; Mba et al., 2018; Cook et al., 2020), the expected changes from this comparison would be much larger than those computed relative to the 1981–2010 control period and this can be misinterpreted by policymakers. It must be noted that a small overlap between the control and 1.5°C periods is present only for the Andes region (see Results). The control period was also used as reference for the validation of the model outputs.
Results
Evaluation of IPSL-CM6A-LR Model Performance: 1981–2010
As first step, we performed a comparison between the reference datasets (CRU TS 4.04 and ERA5-Land) and the IPSL-CM6A-LR model outputs, considering the most relevant variables (pr, tas, snc, snd, and mrros). These variables were averaged over the Andes and Lowlands domains (Figure 1) and its annual cycles computed over the control period were compared among the selected datasets. In general, there is a good representation of the seasonality of precipitation, snow cover, and depth and runoff over the Andes domain, highlighting the ability of the IPSL-CM6A-LR model to represent the Mediterranean regime, as well as the monsoonal summer precipitation regime over the Lowlands domain (Figure 2). The simulated precipitation by the IPSL-CM6A-LR model agrees better with ERA5-Land than with CRU TS 4.04 dataset in both sub-domains, which might be linked to the limited amount of observations over CWA that are used as input for the CRU TS 4.04 database (Rivera and Arnould, 2020). Over the Andes, the IPSL-CM6A-LR model shows an underestimation of precipitation between September and April and an overestimation during austral winter (Figure 2A), compared to the ERA5-Land dataset. This overestimation was previously shown not only for the IPSL model but also for other models of CMIP5 and CMIP6 (Zazulie et al., 2017; Rivera and Arnould, 2020).
In terms of temperature, differences between the model outputs and the CRU TS 4.04 and ERA5-Land are evident over the Andes domain, particularly between October and April. Thus, there is a good agreement between model outputs and observation datasets between May and September, but for the summertime months there is an underestimation or overestimation considering as reference the ERA5-Land or the CRU TS 4.04 datasets, respectively (Figure 2B). The comparison between ERA5-Land and IPSL-CM6A-LR in terms of surface runoff, snow cover, and snow depth generally shows an underestimation from the model outputs (Figures 2C–E). Nevertheless, caution should be taken considering that these variables depend on the size of the grid cells. Over the Lowlands region, differences between CRU TS 4.04 and ERA5-Land are observed in terms of precipitation, although with a similar annual cycle. The IPSL-CM6A-LR shows a better agreement with the ERA5-Land precipitation, although matching the CRU TS 4.04 records between May and September (Figure 2F). In terms of temperature, there is a good agreement between the model outputs and the observations over the Lowlands, although a cold bias is verified during austral spring (Figure 2G).
Timing for Reaching 1.5 and 2°C Above Pre-industrial Conditions
From the methodology described in the Warming levels section, we obtained six time series of 30-year window temperature anomalies relative to the pre-industrial baseline; for each scenario (SSP1-1.9; SSP1-2.6; and SSP4-3.4) and region (Andes and Lowlands). Considering the limited number of runs for the SSP4-3.4 pathway, a factor that can increase the uncertainty in the determination of the year when temperatures are expected to reach the selected warming levels, we only show in Figure 3 the temperature anomalies for the SSP1-1.9 and SSP1-2.6 pathways. The historical runs show that the Andes region has been warming faster than the Lowlands, as expected from previous research considering the Andes (Zazulie et al., 2018) and other mountainous regions as the Himalayas or the Rocky Mountains (Rangwala et al., 2013). Some of the proposed mechanisms for elevation-dependent warming were related to factors that affect the net flux of radiation at the surface such as albedo, clouds, water vapor, aerosols, and their feedback mechanisms (Pepin et al., 2015). In this sense, Zazulie et al. (2018) showed a strong projected reduction in the winter albedo for elevated areas of the Central Andes, a factor that is expected to increase the surface absorption of solar radiation owing to a reduced snow cover (Rangwala et al., 2013). These factors contribute to the anticipated timing of 1.5 and 2°C regional warming levels in the Andes region with respect to the results from the Lowlands region. The estimated year to reach the warming level of 1.5°C in the Andes region is 2020 (2006–2035) under the SSP1-1.9 and SSP1-2.6 scenarios and 2019 (2005–2034) under the SSP4-3.4 scenario. The same warming level will be reached in the Lowlands region during 2035 (2021–2050) under the SSP1-1.9 scenario; 2036 (2022–2051) under the SSP1-2.6 scenario; and 2032 (2018–2047) under the SSP4-3.4 scenario. These results are in line with the projected time for reaching the 1.5°C global warming level between 2030 and 2052 at the current observed warming rate (IPCC, 2018). Thus, a difference of approximately 15 years for the 1.5°C target results from the differential warming between the Andes and the Lowlands. One reason for policy concern is the fact that, even considering the lowest emission scenarios available in the scientific community, the IPSL-CM6A-LR model shows that the warming level of 1.5°C will be reached before 2050 in the whole CWA region. Efforts to pursue the most aggressive mitigation scenario (SSP1-1.9) will be translated in a temperature overshoot around 2050, returning to values below the 2°C level in the case of the Andes region and below 1.5°C in the case of the Lowlands region (Figure 3).
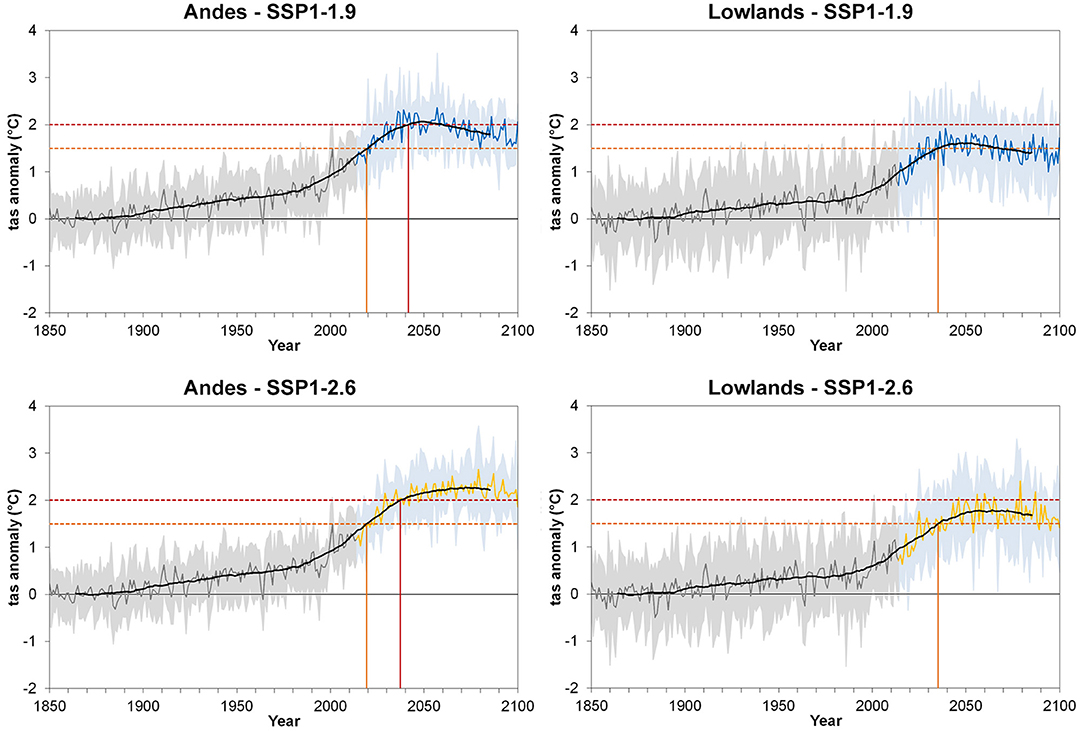
Figure 3. Near-surface air temperature (tas) anomaly time series relative to the 1861-1890 pre-industrial baseline for the Andes (left panels) and Lowlands (right panels) regions and for the SSP1-1.9 (upper panels) and SSP1-2.6 (lower panels) scenarios from the IPSL-CM6A-LR runs. The dark gray lines show the series from the historical model ensemble; while the blue and orange lines continue the series using the model ensemble from the future projections under the SSP1-1.9 and SSP1-2.6 scenarios, respectively. The gray and light blue shading indicates the 5 and 95% quantiles derived from the dispersion of the historical runs (1850–2014) and future runs (2015–2100), respectively. The thick black line shows the 30-year moving average. The horizontal dashed lines indicate the 1.5 and 2°C thresholds, while the vertical lines show the year when the simulations reach the defined increases in temperature.
Considering the warming level of 2°C, only the SSP4-3.4 project that the Lowlands region will reach this level during 2064 (2050–2079), with the most aggressive mitigation scenarios limiting the regional warming below 2°C (Figure 3). However, the simulations for the Andes region will reach the 2°C warming level in all the scenarios considered: 2042 (2028–2057) under SSP1-1.9; 2038 (2024–2053) under SSP1-2.6; and 2035 (2021–2050) under SSP4-3.4. These results show that increasing mitigation actions will translate to a delay in the zero emission year (de la Fuente et al., 2017) over the CWA.
Changes in the Water Cycle Components at 1.5 and 2°C Warming Levels
Once the 30-year periods were defined for each warming level, region and scenario, we assessed the projected changes in several variables related to the hydrological cycle of the CWA relative to the control (1981–2010) period. Figure 4 shows a comparison of the projected changes in annual total precipitation for a warming level of 1.5°C considering the scenarios SSP1-1.9 and SSP1-2.6. It must be noted that the Lowlands region was divided into two sub-domains: its Eastern and Western portions. This decision was made considering the spatial gradient of the expected changes in precipitation (Cabré and Nuñez, 2020), the observed trends over the last Century (Díaz et al., 2020; Rivera and Arnould, 2020), and the differences in the precipitation seasonality, which is more marked in the Eastern Lowlands than in the Western Lowlands (Doyle, 2020). The projected changes in annual total precipitation exhibit an east-west gradient, with increases in the Eastern Lowlands and decreases over the Andes region; although the uncertainties in the results are high due to the dispersion in the model simulations (Figure 4). A similar spatial pattern of future precipitation changes was found by Cabré and Nuñez (2020) using RCP4.5 and RCP8.5 scenarios. Comparing the median values of the simulations, the transitional Western Lowlands region is expected to experience a slight reduction in annual precipitation under the SSP1-1.9 scenario but a slight increase under the SSP1-2.6 and SSP4-3.4 scenarios. The projected increase in annual precipitation over the Eastern Lowlands will be even higher considering the SSP4-3.4 scenario, suggesting the role of GHGs concentrations in the circulation patterns favoring a wetting trend over Southeastern South America, particularly during the austral summer (Zazulie et al., 2018; Cook et al., 2020). The expected decrease in precipitation over the Andes region is not dependent on the selected scenario and has less uncertainties than the projected changes in the Lowlands.
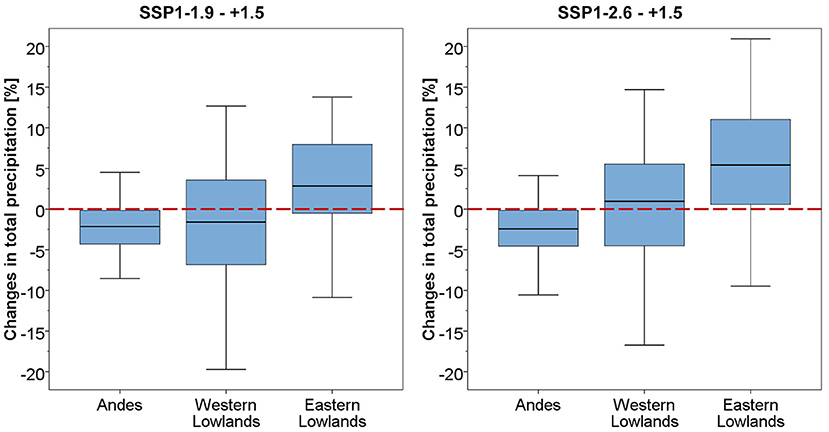
Figure 4. Boxplot of the projected changes in annual precipitation (pr) for the warming level of 1.5°C, expressed as the percentage of change relative to the 1981–2010 baseline period, over the Andes and Lowlands domains. The Lowlands region was divided into its Eastern and Western parts for a more detailed description of the expected changes in precipitation. The left (right) panel shows the projected changes considering the SSP1-1.9 (SSP1-2.6) scenario when the temperature anomaly reaches 1.5°C above preindustrial levels. Each boxplot shows the median and first and third quartiles, while the whiskers extend to the data values that are 1.5 times the interquartile range above or below the quartiles.
The expected decline in precipitation and increase in temperature over the Andes will have undoubtedly a strong impact on the projected changes in snowpack characteristics. Figure 5 shows the projected changes in snow area percentage and in snow depth considering the 1.5 and 2°C warming levels and the three selected scenarios. Most of the simulations show future decreases in the snow area percentage of about 10–15% considering the 1.5°C warming level, regardless of the selected scenario, a factor associated with the similar timing of the warming level. A half-degree temperature increment translates into an additional 10% decrease in snow area percentage over the Andes region, with some model runs exceeding losses of 30% relative to 1981–2010 (Figure 5). Regarding snow depth, the projected decreases for the 1.5°C warming level are expected to be between 15 and 25%, although there is a large dispersion among the model runs. The 2°C warming level is projected to generate a decline in snow depth of about 25 to 35% relative to the control period, with the most relevant changes linked to the SSP1-1.9 scenario. Even considering the large uncertainties represented by the model spread, the influence of the forcing pathways generates a consistent regional response in terms of reduction of snow area extent and snow depth as a function of temperature increase and precipitation decline over the Andes.
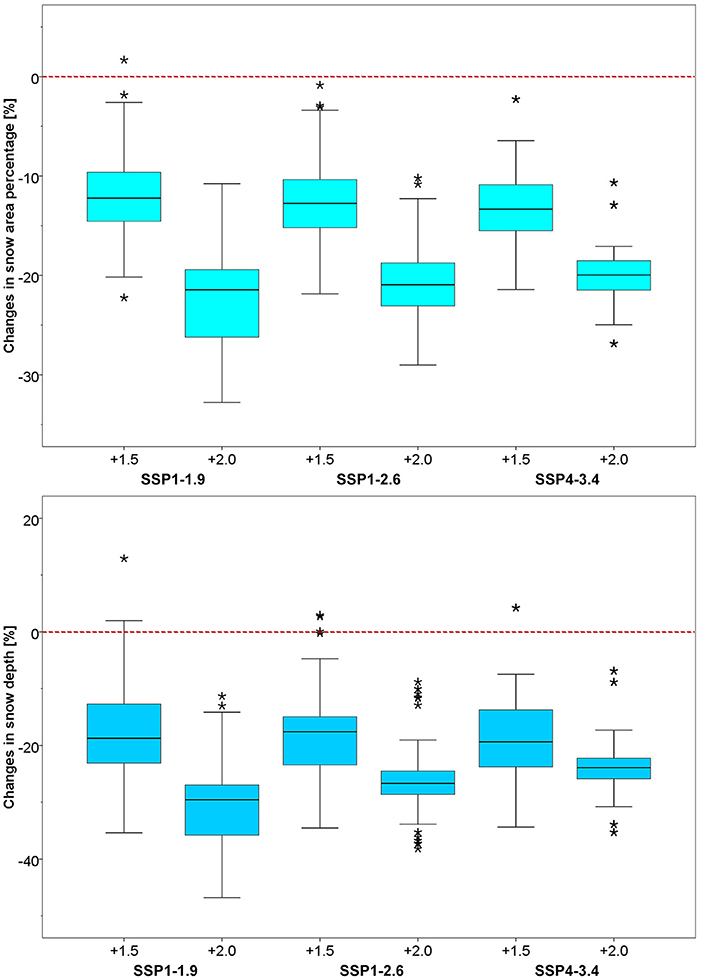
Figure 5. Boxplot of the projected changes in snow area percentage (snc, upper panel) and snow depth (snd, lower panel), expressed as the percentage of change relative to the 1981–2010 baseline period, over the Andes domain. The changes are based on the periods where the temperature anomaly is projected to reach 1.5 and 2°C above preindustrial levels, considering the SSP1-1.9, SSP1-2.6, and SSP4-3.4 scenarios. Each boxplot shows the median and first and third quartiles, while the whiskers extend to the data values that are 1.5 times the interquartile range above or below the quartiles. Outliers are represented by asterisks.
The temporal evolution of the changes in surface snow amount relative to the 1981–2010 control period is shown in Figure 6. The historical period is mostly characterized with positive anomalies in the snow amount, particularly during the pre-industrial period, although with large dispersion between the model simulations and increments relative to the control period that can exceed 200%. A marked decline in snow amount is observed during the last years of the simulated historical runs, a factor that can be linked to the more pronounced increase in temperature along the Andes (Figure 3) but also to the declining trends in observed precipitation (Boisier et al., 2016). The projections for the Twenty-first Century show a pre-dominance of negative anomalies in the snow amount relative to 1981–2010 (Figure 6). Mean decreases from around 19 to 23% are projected for the 1.5°C warming level, depending on the forcing pathway considered, while the 2°C warming level shows a decline of about 26 to 34% in the snow amount. An apparent recovery can be observed considering the model ensemble under the SSP1-1.9 scenario during the last decades of the Twenty-first Century, a result likely related to a return to lower temperatures after 2050 as a result of mitigation actions (Figure 3). Large interannual variability is observed considering the ensemble of SSP4-3.4 runs given the limited number of available model runs, making uncertain the expected changes in snow amount under this scenario. Therefore, changes in the snow characteristics along the Andes region will likely exacerbate the recent glacier mass losses (Dussaillant et al., 2019) in the next 30 years.
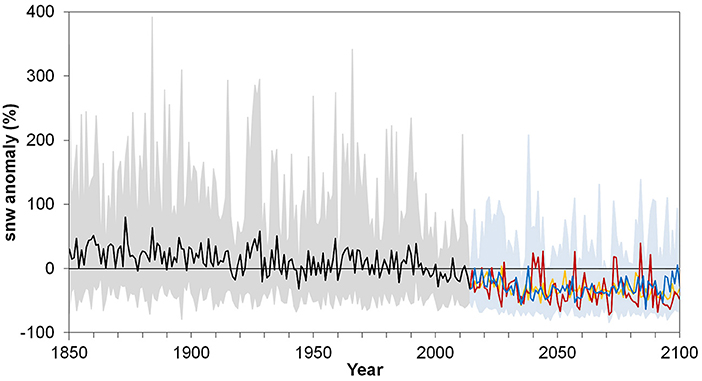
Figure 6. Mean annual variations in surface snow amount (snw) over the Andes region, considering historical (1850–2014) and future (2015–2100) runs of the IPSL-CM6A-LR model, expressed as the percentage of change relative to the 1981–2010 baseline period. The black line represents the ensemble mean for the historical runs, the shading in gray indicates the 5 and 95% quantiles across the historical model runs. The blue, orange, and red lines show the ensemble mean of the future surface runoff projections considering the SSP1-1.9, SSP1-2.6, and SSP4-3.4 scenarios, respectively. The light-blue shading indicates the 5 and 95% quantiles across the future runs.
The snowpack accumulated in the Andes region is the main water source of the major rivers of the CWA (Masiokas et al., 2006). Thus, it is expected that the projected decline in snow characteristics will have an impact on regional runoff. Figure 7 shows the projected changes in total runoff over the Andes region, for the selected warming levels and scenarios. The majority of the model runs show median decreases between 5 and 15%, although with large dispersion indicated by the interquartile values between 0 and −20% and even some model runs projecting total runoff increases. To determine if this projected increase would be related to increased glacier melt contribution to groundwater runoff is beyond the scope of this study, but could be explored using a combination between downscaled model projections to run hydrological models at the basin scale, as performed by Bozkurt et al. (2018, 2019) and Omani et al. (2016). However, the sign of the expected changes for most of the simulations is in line with the projected changes in snow characteristics, temperature and precipitation along the Andes, as shown previously. The largest decreases in total runoff are projected under the SSP1-1.9 and SSP1-2.6 scenarios for the 2°C warming level (Figure 7).
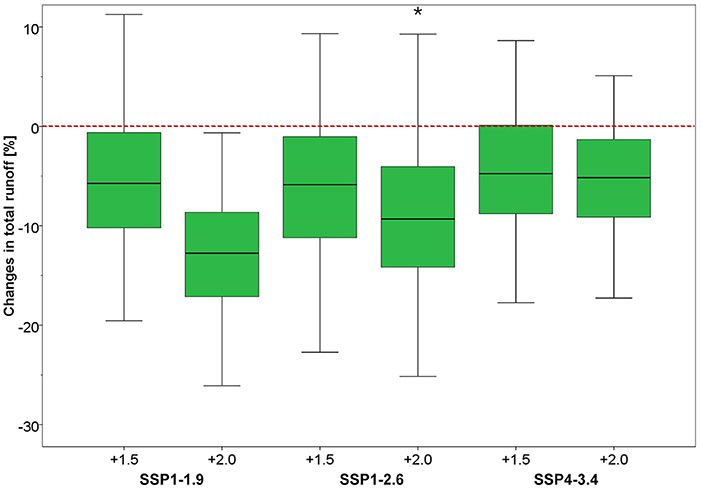
Figure 7. Boxplot of the projected changes in total runoff (mrro), expressed as the percentage of change relative to the 1981–2010 baseline period, over the Andes domain. The changes are based on the periods where the temperature anomaly is projected to reach 1.5 and 2°C above preindustrial levels, considering the SSP1-1.9, SSP1-2.6, and SSP4-3.4 scenarios. Each boxplot shows the median and first and third quartiles, while the whiskers extend to the data values that are 1.5 times the interquartile range above or below the quartiles. Outliers are represented by asterisks.
Figure 8 further illustrates the temporal evolution of the surface runoff changes relative to the 1981–2010 control period, considering the historical runs and the scenario runs for the 1850–2100 period. Similar to what was found for the snow amount over the Andes region, a period with pre-dominant positive runoff anomalies was simulated between 1850 and 1950, with more variable signs between 1950 and 2000 and predominantly negative afterward, although with large interannual variability (Figure 8). Considering the SSP1-1.9 scenario, the average of the projected decreases for the warming levels of 1.5 and 2°C relative to 1981–2010 will be between 8 and 16%, respectively. Similar changes are expected under the SSP1-2.6 scenario, with decreases ranging from 10 to 16%, while the SSP4-3.4 scenario project decreases in surface runoff between 9 and 15%.
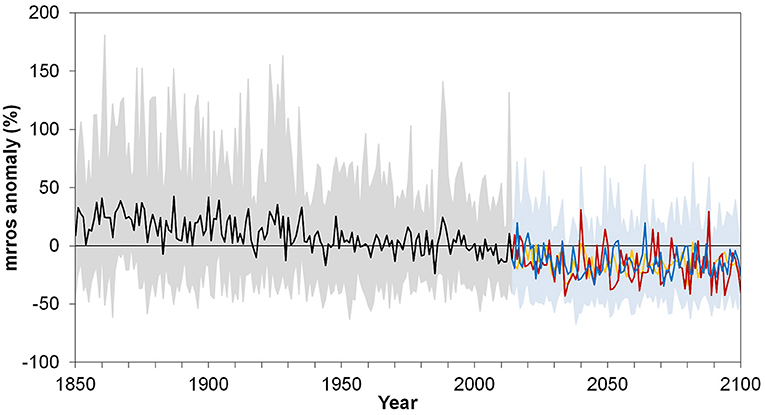
Figure 8. Mean annual variations in surface runoff (mrros) over the Andes region, considering historical (1850–2014) and future (2015–2100) runs of the IPSL-CM6A-LR model, expressed as the percentage of change relative to the 1981–2010 baseline period. The black line represents the ensemble mean for the historical runs, the shading in gray indicates the 5 and 95% quantiles across the historical model runs. The blue, orange, and red lines show the ensemble mean of the future surface runoff projections considering the SSP1-1.9, SSP1-2.6, and SSP4-3.4 scenarios, respectively. The light-blue shading indicates the 5 and 95% quantiles across the future runs.
An opposite behavior in the projected changes in runoff is observed for the eastern portion of the CWA, where the increases in precipitation for the warming levels of 1.5 and 2°C translate to increases in both total and surface runoff. In this sense, projected increases in surface runoff range from 18 to 30% (16 to 34%) following the SSP1-1.9 scenario (SSP1-2.6 scenario). The east-west spatial gradient in runoff changes was also found by Cook et al. (2020), with higher contrast in the sign of the regional changes considering high emissions scenarios.
In the Western Lowlands, agriculture is a key activity that is only possible through irrigation (Montaña et al., 2016). Large artificial oases are located in the region, with vineyards, olives, and fruit trees being the main crops (Contreras et al., 2011). A large fraction of the water used for irrigation is generated through snowmelt (Massone et al., 2016), with a future contribution that will be determined by the projected increases in temperature and decreases in snow amount. Moreover, the projected changes in precipitation over the Western Lowlands have large uncertainty in their sign (Figure 3), making more complicated the quantification of future water availability for agricultural purposes. One key variable for agriculture is soil moisture, which is likely connected to increases in evaporative demand mediated by vegetation responses and water use (Cook et al., 2020). In this sense, we evaluated the projected changes in total soil moisture content in particular along the Western Lowlands, considering the 1.5 and 2°C warming levels relative to the control period. The projected changes are expected to be relatively small, with large uncertainty given the range of changes among the model simulations, but with the majority of the projected runs indicating a decrease of ~2% for the 1.5°C warming level under the SSP1-1.9 and SSP1-2.6 scenarios (Supplementary Figure 1). Considering the Eastern Lowlands, the uncertainty in the sign of the projected differences between the 1.5°C warming level and the 1981–2010 control period is also high, although positive changes are mostly expected in response to the projected precipitation increases. This result can be beneficial for rainfed agriculture given the potential decrease in the irrigation demands over the region. However, the projected agricultural expansion can generate greater water use, highlighting the role of human-modified systems in the uncertainty of future water resources.
Hadley Circulation Expansion as a Driver of the Future Andean Hydroclimate
From a dynamical perspective, one of the main drivers of the long-term precipitation decline along Southwestern South America can be related to the poleward expansion of the Hadley Circulation (Cai et al., 2012; Rivera and Arnould, 2020). This is associated to an increase in sea level pressure (SLP) along the subtropical Southeast Pacific Ocean, which is adequately captured by the IPSL-CM6A-LR model (Rivera and Arnould, 2020), and also in the atmospheric pressure at middle levels of the troposphere (Garreaud et al., 2020). This expansion may have also favored the southward shift of the storm tracks and the consequent decline in seasonal and annual precipitation over the Andes region. Possible causes behind this tropical expansion were attributed mainly to increased GHG emissions and ozone depletion effects and, to a lesser extent, to internal climate variability (Staten et al., 2018; Villamayor et al., 2019; Mindlin et al., 2020).
For the evaluation of the projected expansion of the Hadley Circulation under the 1.5 and 2°C warming levels, we calculated two widely used metrics of the position of the Hadley Circulation edge. One is the UAS metric, defined as the subtropical latitude where the zonal-mean near-surface zonal wind switches sign from tropical easterlies to midlatitude westerlies (Davis and Birner, 2017), and the other is the SLP metric, defined as the latitude of the subtropical sea-level pressure maximum (Choi et al., 2014). For its calculation we used the simulated sea level pressure and eastward near-surface wind from the IPSL-CM6A-LR model for the historical runs (1850–2014) and the future projections (2015–2100) forced under the SSP1-1.9; SSP1-2.6; and SSP4-3.4 emission scenarios. Both metrics closely capture the variability in the zero-crossing latitude of the 500 hPa mass streamfunction (Ψ500)–the conventional, dynamical definition of the Hadley cell edge (Waugh et al., 2018; Staten et al., 2020)–considering reanalyses and models (Solomon et al., 2016; Davis and Birner, 2017; Waugh et al., 2018). The metrics were calculated using the Tropical-width Diagnostics (TropD) code package (Adam et al., 2018) applied to the zonally and time average wind field (Grise and Davis, 2020).
Figure 9 shows the projected changes in the poleward expansion of the Hadley Circulation based on the SLP and UAS metrics for the periods when the temperature anomaly is projected to reach 1.5 and 2°C above preindustrial levels along the Andes region with respect to the 1981–2010 baseline. In general, all the model runs show a poleward expansion of the Hadley Circulation, a factor that is consistent with the expected decline in snow characteristics, runoff and precipitation over the region. The interquartile range shows expansions between 0.1 and 0.3° latitude for the SSP1-1.9 and between 0.1 and 0.4° latitude for the SSP1-2.6 (Figure 9), consistent with an increase in CO2 levels. Even when both metrics are highly correlated, the UAS tends to project an expansion larger than the obtained through the SLP under both scenarios, with both metrics showing a far southward position of the Hadley Circulation edge considering the warming level of 2°C compared to the position at the level of 1.5°C.
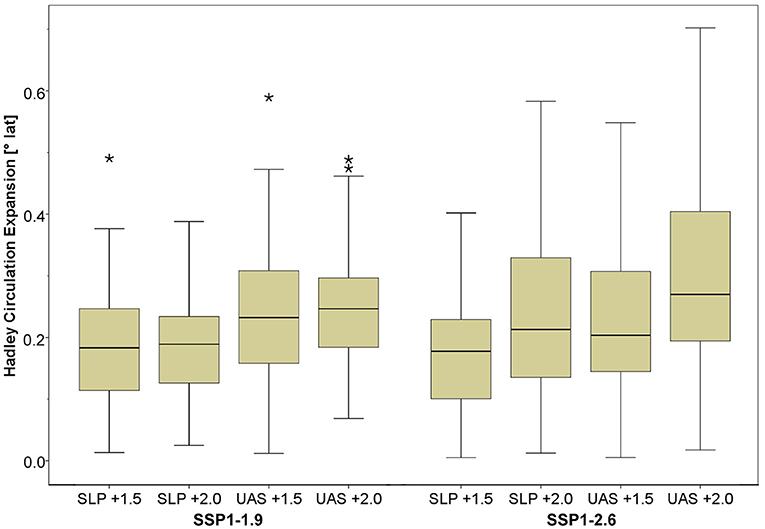
Figure 9. Boxplot of the projected southward expansion of the Hadley Circulation based on the SLP and UAS metrics, expressed as the change in the latitude of the Hadley Circulation edge over the periods where the temperature anomaly is projected to reach 1.5 and 2°C above preindustrial levels along the Andes region compared to the 1981–2010 baseline. Each boxplot shows the median and first and third quartiles, while the whiskers extend to the data values that are 1.5 times the interquartile range above or below the quartiles. Outliers are represented by asterisks.
Discussion
This work provides an evaluation of the projected changes in several components of the hydrological cycle along the CWA using a set of scenarios characterized by low emissions pathway, with the objective to provide insights of the expected impacts generated by 1.5 or 2°C warming levels. These levels arise from the Paris Agreement, where nations committed to mitigate and reduce GHG emissions in order to limit the impacts of global warming. In this sense, we expect that the outcomes of this study can motivate national to sub-national mitigation measures in order to increase the efforts for substantial and rapid decarbonisation.
In the case of Argentina, the intended Nationally Determined Contribution (NDC) of the country had an unconditional GHG emissions reduction of 15% by 2030 compared to a business as usual (BAU) projection, with an additional reduction of 15% conditioned to international financial support (Dash and Gim, 2019). With the ratification of the Paris Agreement in 2016, Argentina presented a revised NDC with a more ambitious target of 18% reduction in all GHGs below BAU for 2030, not exceeding the net emission of 483 MtCO2e (Santos Da Silva et al., 2019). The revised conditional target increased to a reduction of 37% by 2030. Nevertheless, these expected reductions are far from being fair and ambitious to achieve the Paris Agreement goals (Robiou du Pont et al., 2017), with one of the lowest targets of GHG emissions reduction of Latin America (Santos Da Silva et al., 2019) and requiring further actions to meet the NDC (den Elzen et al., 2019). All the Parties are expected to communicate new or updated NDCs by 2020, in line with more ambitious mitigation and adaptation policies (Farinosi et al., 2020).
In order to implement the NDC by 2030, the National Climate Change Cabinet of Argentina provides the framework for the creation of climate change sectorial plans, which are part of the National Climate Change Adaptation and Mitigation Plan (Secretaría de Ambiente y Desarrollo Sustentable, 2019). The sectorial distribution of the National GHG inventory is dominated by energy and agriculture. To cope with the unconditional reduction in GHG emissions, the country will need to increase the energy efficiency by reducing the energy intensity to more than 2% annually, together with an increase in the proportion of renewable energy (Cervantes-Bravo et al., 2017). The national Government has established targets for the energy policy, with 10,000 MW of renewable energy by 2025 representing 20% of the national electricity consumption (Arango-Aramburo et al., 2020). An examination of the historical development of renewable energy policy regime in Argentina showed that the policy density–the extent to which a certain policy area is covered by governmental activities– ranked among the lowest compared to Brazil, Canada, Mexico and USA, while the policy intensity–the strength the policy has toward meeting specific goals–showed one of the highest scores (Pischke et al., 2019). There is limited growth prospect in nuclear capacity for Argentina (Santos Da Silva et al., 2019), although some deep decarbonization pathways project an increase in the electricity generation through nuclear power in 2050 (Bataille et al., 2020). The CWA has the potential to provide solar and wind energy as part of this transition to a higher proportion of renewables in the near future. The installed solar and wind capacity of the country is well below the capacity from other countries as Brazil, Chile or Uruguay (Arango-Aramburo et al., 2020). The reader can refer to Wilcox et al. (2020) to know about possible technological options for climate change mitigation to address the goals of the Paris Agreement and effectively limiting global warming.
Our results show that the timing for the analyzed warming levels will depend on the emissions pathways considered. Heavily mitigated emissions as in the SSP1-1.9 scenario will led to a delay in the emergence of the 2°C warming level in the Andes region, also avoiding Lowlands region temperature to reach this level. Lowering the efforts for effective mitigation, as seen under the SSP1-2.6 and SSP4-3.4 pathways, will increase the chance for anticipated emergence of the warming levels over the Andes region, even with the possibility of reaching the 2°C target along the Lowlands region before 2100. Nevertheless, we need to consider the inertia and internal variability of the climate system, factors that are expected to delay the emergence of a discernible response to strong, sustained mitigation (IPCC, 2018; Samset et al., 2020).
The expected changes in the water cycle are characterized by a heterogeneous spatial response to the warming levels, as summarized in Figure 10. As previously shown using long-term observations (Díaz et al., 2020; Rivera and Arnould, 2020) the Andes disrupts the precipitation patterns creating significant west-east asymmetries and gradients, with decreases in precipitation in the Andes region–particularly south of 35°S–and increases in precipitation east of the Andes foothills. The most relevant precipitation declines over the Andes are projected south of 35°S showing a dependency on future scenarios, with higher decreases in precipitation (Zazulie et al., 2018) and increased drought frequency and severity under high emissions scenarios (Spinoni et al., 2020). These spatial features are expected to continue in the future under the selected warming levels, with decreases in precipitation along the Andes region and increases particularly over the Eastern Lowlands relative to the 1981–2010 control period. The Western Lowlands constitute a transitional region where uncertainty in the projected changes in precipitation is high, and the sign of the change depends upon the selected scenario and timing of warming level. The east-west gradient is also evident considering the changes in meteorological drought characteristics, with projected increases in drought frequency and severity along the Andes region and decreases in the Lowlands region (Spinoni et al., 2020). The projected changes in temperature and precipitation are expected to contribute to the geographical shifts of Argentina winegrowing regions (Cabré and Nuñez, 2020). These changes were already observed in Mendoza considering the last 32 years, with a vineyard expansion in the upper Tunuyán river basin (Rojas et al., 2020) as an effective adaptation strategy to a warming and drier climate.
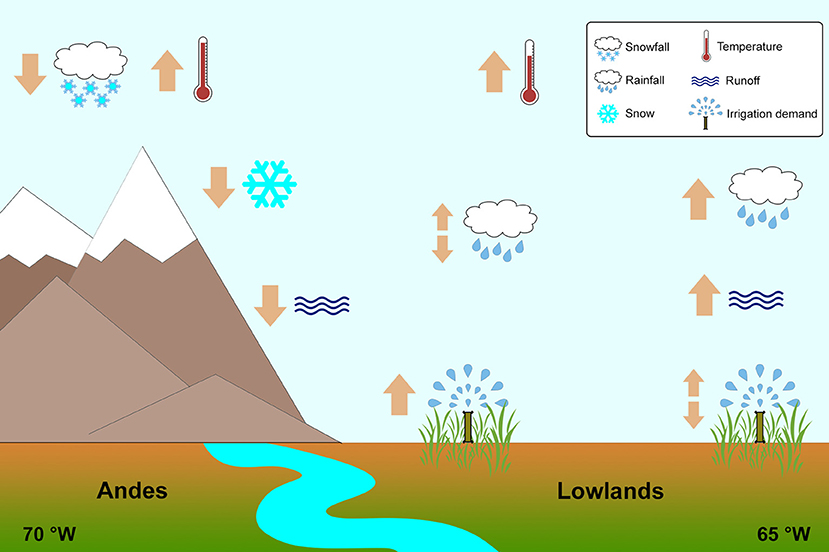
Figure 10. Conceptual diagram summarizing the expected changes in the hydroclimate of the CWA. Upward and downward arrows show positive and negative changes in the water cycle components for the selected warming levels, respectively. The combination of upward and downward arrows reflects the uncertainty in the expected changes.
The projected changes in snow and its consequent impact on runoff along the headwaters of CWA will likely stress the capacity for hydropower generation in the region. A prolonged drought condition since 2010 affected snow accumulation over the Andes. Since the snowmelt is the most relevant source of water, the reduced snowfall over the mountains propagated the drought signal through the streamflows in the adjacent foothills east of the Andes ranges (Rivera et al., 2017). Our results show that the decreases in snow amount will likely contribute to more hydrological drought conditions over CWA in the future, with higher snow and runoff deficits considering the 2°C warming level. Other studies using high emissions scenarios and projections for the end of the Century estimated an increase in runoff associated with an increase in glacier melt contribution due to higher warming levels expected (Omani et al., 2016). While this scenario is plausible, the cold season snow accumulation represents the 90% of the variability of streamflow (Villalba et al., 2016), a factor that links the projected decreases in snow characteristics to decreases in surface and total runoff. Similar results considering the runoff over the study area were found by Cook et al. (2020), supporting our findings. One of the plausible mechanisms behind the drying signal along the Andes region is the poleward expansion of the Hadley Circulation, which is projected to continue its expansion in the near future at a rate that is dependent on the emissions scenario and warming level selected. Our results are consistent with the projected changes in the intensity and the poleward extension of the anticyclonic high-pressure system of the Subtropical Pacific Ocean (Fahad et al., 2020), which has a significant influence in the Andean hydroclimate. Using the SSP5-8.5 high-emissions scenario, Grise and Davis (2020) found a poleward expansion in the Southern Hemisphere Hadley Circulation that is outside the range natural variability since the year 2000, highlighting the role of anthropogenic forcings in the dynamics of projected precipitation decline over CWA.
Irrigation and a variety of socio-economic activities are highly dependent on streamflow, particularly in the Andes foothills. Therefore, the projected decreases in runoff will likely generate higher irrigation demands, particularly over the Western Lowlands of the CWA (Figure 10), where the irrigation efficiency is strikingly low and the dependence on snowmelt is significant. In the case of this region, the water for irrigation is distributed based on the water rights inherent to each parcel and not according to the water need of the different crop types (Schwank et al., 2014). Therefore, in view of the expected changes it is advised a shift in irrigation practices toward more modern systems based on drip irrigation. Using two NDC scenarios, Santos Da Silva et al. (2019) projected a significant increase in the water demand for agricultural irrigation in Argentina in the coming decades, as a result of the expansion of the croplands and the increase in crop production, factors that are expected to play a significant role over the Lowlands east of 67°W. In this sense, the projected increases in precipitation, total soil moisture and runoff might compensate for the expected increase in water needs due to the agricultural expansion, although the evaporative demand is expected to increase too, setting a complex configuration in terms of the irrigation demand for this region. Moreover, the fraction of land used for bioenergy crop production could increase across the Eastern Lowlands, in line with the projected agricultural intensification for 2030 over Argentina (Piquer-Rodríguez et al., 2018), particularly considering biofuel production based on soybean. However, dedicated bioenergy crop production in Argentina is not projected as a major source of land-use pressure under the NDC scenarios (Santos Da Silva et al., 2019). According to Law 26.0931, is mandatory to include 10% of biodiesel and 12% of bioethanol in the sales of gasoline and diesel in Argentina, a proportion that should be projected to increase if the country aims to cope with the target of NDC.
It is expected that the projected precipitation changes along the CWA Lowlands favor not only the agricultural expansion and intensification but also the development of the cattle sector, which is a major source of income and GHG emissions (Arango et al., 2020). Another aspect regarding water resources is the projected population growth, a factor that will likely increase the pressure over water to sustain the socio-economic activities, which can overlap the signal of climate change to set a complex scenario along the Andes foothills.
While the objective of the study is not to provide alternatives for mitigation and reduction of GHG emissions to achieve the pledges of Argentina regarding the Paris Agreement goals, we have shown that the effects of the projected warming levels will have serious consequences for the water resources over the CWA in the near future, even under the most aggressive mitigation pathways. These results should motivate a more ambitious unconditional target for GHG reductions, to achieve a more efficient transition toward renewable energy sources, sustainable forest management including afforestation and reforestation, and an improved efficiency in the transport, industry, and building sectors.
This study constitutes the first step for the evaluation of future changes in the hydroclimate of Argentina using low emissions scenarios. Next steps will consider the use of both downscaled General Circulation Models and hydrological models to provide critical information at the basin scale considering the complex topography of the Andes mountains. This kind of studies has been recently developed in Brazil by Avila-Diaz et al. (2020a,b), who provided information regarding the projected evolution of extreme precipitation and temperature indices, and in Chile by Araya-Osses et al. (2020), who generated climate change projections of daily maximum and minimum temperature and precipitation in more than 400 locations. The outcomes of this future study will provide tailored information that can aid decision-making processes in near-term agricultural practices and water management.
Conclusions
The impacts of a regional increase in temperature considering the 1.5 and 2°C warming levels was evaluated on several components of the hydrological cycle of the CWA region, through simulations from the IPSL-CM6A-LR climate model. As a first step, we showed that the model outputs accurately represent the annual cycle of the most relevant variables over both the Andes and Lowlands regions, although misrepresent the winter seasonal totals over the Andes, as was shown by previous studies. The main findings of this study indicate that the critical temperature thresholds will be reached between 2020 and 2048 over the Andes region, depending on the selected warming level and future projection, a timing that is 10–15 years earlier than that for the Lowlands region and highlights the enhanced warming with elevation. The projected changes in the hydrological cycle in the CWA would imply a reduction of snow amount, cover and depth over the Andes, leading to a reduction of runoff and compromising the socio-economical activities along the Andean foothills. This would imply the need for improving water management practices, particularly through an increase in irrigation efficiency. The documented long-term drying trend over the Central Andes it is expected to continue even considering the most aggressive mitigation pathways. From a dynamical perspective, this trend could be attributed to the poleward expansion of the descending branch of the Hadley Circulation over the Southern Hemisphere, a mechanism that is expected to continue in the future as consequence of the increased GHG concentrations. On the other hand, precipitation increases were projected over the Eastern Lowlands, with a likely benefit for the agricultural activities considering the projected expansion of agricultural areas there. The outcomes of this study can contribute to further steps toward the evaluation of future climate projections over the region. Future studies could consider the use of downscaled projections to provide information on basin scale, together with the evaluation of changes in the occurrence of precipitation and temperature extremes. This may provide a comprehensive picture to evaluate mitigation strategies on a regional basis.
Data Availability Statement
The IPSL-CM6A-LR model outputs analyzed for this study can be found in the Earth System Grid Federation (https://esgf-node.llnl.gov/search/cmip6/). The data from ERA5-Land reanalysis can be accessed from the Copernicus Climate Data Store (doi: 10.24381/cds.68d2bb30). Precipitation and temperature data from the Climatic Research Unit (CRU) Time-Series (TS) version 4.04 is available at the Centre for Environmental Data Analysis (CEDA) Archive (https://catalogue.ceda.ac.uk/uuid/89e1e34ec3554dc98594a5732622bce9).
Author Contributions
JR, EN, and MV contributed to the design of the study. JR wrote the first draft of the manuscript. EN calculated the Hadley Circulation metrics. EN and MV provided additional edits to the manuscript. All authors revised and approved the submitted version of the manuscript.
Funding
This work was supported by the National Agency for Scientific and Technological Promotion (ANPCyT) (Grant No. PICT-2016-0431, PICT-2016-1666, and PICTO-UUMM-2019-00004) and the project THEMES (THE Mystery of the Expanding tropicS: from past to future), supported by the BNP Paribas Foundation.
Conflict of Interest
The authors declare that the research was conducted in the absence of any commercial or financial relationships that could be construed as a potential conflict of interest.
Acknowledgments
We acknowledge the World Climate Research Programme, which, through its Working Group on Coupled Modeling, coordinated, and promoted CMIP6. We thank the climate modeling groups for producing and making available their model output, the Earth System Grid Federation (ESGF) for archiving the data and providing access, and the multiple funding agencies who support CMIP6 and ESGF.
Supplementary Material
The Supplementary Material for this article can be found online at: https://www.frontiersin.org/articles/10.3389/fclim.2020.587126/full#supplementary-material
Footnotes
1. ^Available online at: https://www.argentina.gob.ar/normativa/nacional/ley-26093-116299/texto (accessed July 2020).
References
Adam, O., Grise, K. M., Staten, P., Simpson, I. R., Davis, S. M., Davis, N. A., et al. (2018). The TropD software package (v1): standardized methods for calculating tropical-width diagnostics. Geosci. Model Dev. 11, 4339–4357. doi: 10.5194/gmd-11-4339-2018
Arango, J., Ruden, A., Martinez-Baron, D., Loboguerrero, A. M., Berndt, A., Chacón, M., et al. (2020). Ambition meets reality: achieving ghg emission reduction targets in the livestock sector of Latin America. Front. Sustain. Food Syst. 4:65. doi: 10.3389/fsufs.2020.00065
Arango-Aramburo, S., Ríos-Ocampo, J. P., and Larsen, E. R. (2020). Examining the decreasing share of renewable energy amid growing thermal capacity: the case of South America. Renew. Sustain. Energ. Rev. 119:109648. doi: 10.1016/j.rser.2019.109648
Araya-Osses, D., Casanueva, A., Román-Figueroa, C., Uribe, J. M., and Paneque, M. (2020). Climate change projections of temperature and precipitation in Chile based on statistical downscaling. Clim. Dyn. 54, 4309–4330. doi: 10.1007/s00382-020-05231-4
Avila-Diaz, A., Abrahão, G., Justino, F., Torres, R., and Wilson, A. (2020a). Extreme climate indices in Brazil: evaluation of downscaled earth system models at high horizontal resolution. Clim. Dyn. 54, 5065–5088. doi: 10.1007/s00382-020-05272-9
Avila-Diaz, A., Benezoli, V., Justino, F., Torres, R., and Wilson, A. (2020b). Assessing current and future trends of climate extremes across Brazil based on reanalyses and earth system model projections. Clim. Dyn. 55, 1403–1426. doi: 10.1007/s00382-020-05333-z
Barros, V. R., Boninsegna, J. A., Camilloni, I. A., Chidiak, M., Magrín, G. O., and Rusticucci, M. (2015). Climate change in Argentina: trends, projections, impacts and adaptation. WIREs Clim. Change 6, 151–169. doi: 10.1002/wcc.316
Bataille, C., Waisman, H., Briand, Y., Svensson, J., Vogt-Schilb, A., Jaramillo, M., et al. (2020). Net-zero deep decarbonization pathways in Latin America: challenges and opportunities. Energy Strategy Rev. 30:100510. doi: 10.1016/j.esr.2020.100510
Boisier, J. P., Rondanelli, R., Garreaud, R. D., and Muñoz, F. (2016). Anthropogenic and natural contributions to the Southeast Pacific precipitation decline and recent megadrought in central Chile. Geophys. Res. Lett. 43, 413–421. doi: 10.1002/2015GL067265
Boucher, O., Servonnat, J., Albright, A. L., Aumont, O., Balkanski, Y., Bastrikov, V., et al. (2020). Presentation and evaluation of the IPSL-CM6A-LR climate model. J. Adv. Model. Earth Syst. 12:e2019MS002010. doi: 10.1029/2019MS002010
Bozkurt, D., Rojas, M., Boisier, J. B., Rondanelli, R., Garreaud, R., and Gallardo, L. (2019). Dynamical downscaling over the complex terrain of southwest South America: present climate conditions and added value analysis. Clim. Dyn. 53, 6745–6767. doi: 10.1007/s00382-019-04959-y
Bozkurt, D., Rojas, M., Boisier, J. P., and Valdivieso, J. (2018). Projected hydroclimate changes over Andean basins in central Chile from downscaled CMIP5 models under the low and high emission scenarios. Clim. Change 150, 131–147. doi: 10.1007/s10584-018-2246-7
Byrne, M. P., and Schneider, T. (2016). Narrowing of the ITCZ in a warming climate: physical mechanisms. Geophys. Res. Lett. 43, 11350–11357. doi: 10.1002/2016GL070396
Cabré, F., and Nuñez, M. (2020). Impacts of climate change on viticulture in Argentina. Reg. Environ. Change 20:12. doi: 10.1007/s10113-020-01607-8
Cai, W., Cowan, T., and Thatcher, M. (2012). Rainfall reductions over Southern hemisphere semi-arid regions: the role of subtropical dry zone expansion. Sci. Rep. 2:702. doi: 10.1038/srep00702
Camisay, M. F., Rivera, J. A., Matteo, L., Morichetti, P., and Mackern, M. V. (2020). Estimation of integrated water vapor from GNSS ground stations over Central-Western Argentina. Role in the development of regional precipitation events. J. Atmosph. Solar-Terrest. Phys. 197:105143. doi: 10.1016/j.jastp.2019.105143
Castex, V., Morán Tejada, E., and Beniston, M. (2015). Water availability, use and governance in the wine producing region of Mendoza, Argentina. Environ. Sci. Policy 48, 1–8. doi: 10.1016/j.envsci.2014.12.008
Cervantes-Bravo, R. J., Ñaupari-Barzol, H., Jimenez-Nieves, E. T., Magnelli, D., and Dabrowski, A. (2017). Energy efficiency scenarios following the energy trilemma - argentina's commitment to COP21. Soc. Petrol. Eng. doi: 10.2118/185511-MS
Choi, J., Son, S.-W., Lu, J., and Min, S.-K. (2014). Further observational evidence of Hadley cell widening in the Southern Hemisphere. Geophys. Res. Lett. 41, 2590–2597. doi: 10.1002/2014GL059426
Contreras, S., Jobbágy, E. G., Villagra, P. E., Nosetto, M. D., and Puigdefábregas, J. (2011). Remote sensing estimates of supplementary water consumption by arid ecosystems of central Argentina. J. Hydrol. 397, 10–22. doi: 10.1016/j.jhydrol.2010.11.014
Cook, B. I., Mankin, J. S., Marvel, K., Williams, A. P., Smerdon, J. E., and Anchukaitis, K. J. (2020). Twenty-first century drought projections in the CMIP6 forcing scenarios. Earth's Future 8:e2019EF001461. doi: 10.1029/2019EF001461
Crespo, S. A., Fernandoy, F., Cara, L., Klarian, S., and Lavergne, C. (2020). First snow, glacier and groundwater contribution quantification in the upper Mendoza River basin using stable water isotopes. Isotopes Environ. Health Stud. 56, 566–585. doi: 10.1080/10256016.2020.1797713
Dash, R., and Gim, T.-H. T. (2019). Drivers of Nationally determined contributions - an exploratory look at several developing countries. Int. Rev. Spatial Plann. Sustain. Dev. 7, 4–20. doi: 10.14246/irspsd.7.2_4
Davis, N., and Birner, T. (2017). On the discrepancies in tropical belt expansion between reanalyses and climate models and among tropical belt width metrics. J. Climate 30, 1211–1231. doi: 10.1175/JCLI-D-16-0371.1
de la Fuente, A., Rojas, M., and Mac Lean, C. (2017). A human-scale perspective on global warming: zero emission year and personal quotas. PLoS ONE 12:e0179705. doi: 10.1371/journal.pone.0179705
den Elzen, M., Kuramochi, T., Höhne, N., Cantzler, J., Esmeijer, K., Fekete, H., et al. (2019). Are the G20 economies making enough progress to meet their NDC targets? Energy Policy 126, 238–250. doi: 10.1016/j.enpol.2018.11.027
Deng, K., Yang, S., Ting, M., Tan, Y., and He, S. (2018). Global monsoon precipitation: trends, leading modes, and associated drought and heat wave in the Northern Hemisphere. J. Clim. 31, 6947–6966. doi: 10.1175/JCLI-D-17-0569.1
Díaz, L. B., Saurral, R. I., and Vera, C. S. (2020). Assessment of South America summer rainfall climatology and trends in a set of global climate models large ensembles. Int. J. Climatol. 2020, 1–19. doi: 10.1002/joc.6643
Donnelly, C., Greuell, W., Andersson, J., Gerten, D., Pisacane, G., Roudier, P., et al. (2017). Impacts of climate change on European hydrology at 1.5, 2 and 3 degrees mean global warming above preindustrial level. Clim. Change 143, 13–26. doi: 10.1007/s10584-017-1971-7
Doyle, M. E. (2020). Observed and simulated changes in precipitation seasonality in Argentina. Int. J. Climatol. 40, 1716–1737. doi: 10.1002/joc.6297
Dussaillant, I., Berthier, E., Brun, F., Masiokas, M., Hugonnet, R., Favier, V., et al. (2019). Two decades of glacier mass loss along the Andes. Nat. Geosci. 12, 802–808. doi: 10.1038/s41561-019-0432-5
Fahad, A., Burls, N. J., and Strasberg, Z. (2020). How will southern hemisphere subtropical anticyclones respond to global warming? mechanisms and seasonality in CMIP5 and CMIP6 model projections. Clim. Dyn. 55, 703–718. doi: 10.1007/s00382-020-05290-7
Farinosi, F., Dosio, A., Calliari, E., Seliger, R., Alfieri, L., and Naumann, G. (2020). Will the Paris agreement protect us from hydro-meteorological extremes? Environ. Res. Lett. 15:aba869. doi: 10.1088/1748-9326/aba869
Flores-Aqueveque, V., Rojas, M., Aguirre, C., Arias, P. A., and González, C. (2020). South Pacific subtropical high from the late holocene to the end of the 21st century: insights from climate proxies and general circulation models. Clim. Past 16, 79–99. doi: 10.5194/cp-16-79-2020
Garbarini, E. M., González, M. H., and Rolla, A. L. (2019). The influence of Atlantic High on seasonal rainfall in Argentina. Int. J. Climatol. 39, 4688–4702. doi: 10.1002/joc.6098
Garreaud, R. D. (2009). The Andes climate and weather. Adv. Geosci. 22, 3–11. doi: 10.5194/adgeo-22-3-2009
Garreaud, R. D., Boisier, J. P., Rondanelli, R., Montecinos, A., Sepúlveda, H. H., and Veloso-Aguila, D. (2020). The central Chile mega drought (2010–2018): a climate dynamics perspective. Int. J. Climatol. 40, 421–439. doi: 10.1002/joc.6219
Grise, K. M., and Davis, S. M. (2020). Hadley cell expansion in CMIP6 models. Atmos. Chem. Phys. 20, 5249–5268. doi: 10.5194/acp-20-5249-2020
Harris, I., Osborn, T. J., Jones, P., and Lister, D. (2020). Version 4 of the CRU TS monthly high-resolution gridded multivariate climate dataset. Sci. Data 7:109. doi: 10.1038/s41597-020-0453-3
Hawkins, E., Ortega, P., Suckling, E., Schurer, A., Hegerl, G., Jones, P., et al. (2017). Estimating changes in global temperature since the preindustrial period. Bull. Amer. Meteor. Soc. 98, 1841–1856. doi: 10.1175/BAMS-D-16-0007.1
Herrera-Pantoja, M., and Hiscock, K. M. (2015). Projected impacts of climate change on water availability indicators in a semi-arid region of central Mexico. Environ. Sci. Policy 54, 81–89. doi: 10.1016/j.envsci.2015.06.020
Hersbach, H., Bell, B., Berrisford, P., Hirahara, S., Horányi, A., Muñoz-Sabater, J., et al. (2020). The ERA5 global reanalysis. Q. J. R. Meteorol. Soc. 146, 1999–2049. doi: 10.1002/qj.3803
Hock, R., Bliss, A., Marzeion, B., Giesen, R., Hirabayashi, Y., Huss, M., et al. (2019). GlacierMIP – a model intercomparison of global-scale glacier mass-balance models and projections. J. Glaciol. 65, 453–467. doi: 10.1017/jog.2019.22
Hoegh-Guldberg, O., Jacob, D., Taylor, M., Bolaños, T. G., Bindi, M., Brown, S., et al. (2019). The human imperative of stabilizing global climate change at 1.5°C. Science 365:eaaw6974. doi: 10.1126/science.aaw6974
Hourdin, F., Rio, C., Grandpeix, J.-Y., Madeleine, J.-B., Cheruy, F., Rochetin, N., et al. (2020). LMDZ6A: The atmospheric component of the IPSL climate model with improved and better tuned physics. J. Adv. Model. Earth Syst. 12:e2019MS001892. doi: 10.1029/2019MS001892
Hurtado, S. I., and Agosta, E. A. (2020). El Niño Southern oscillation-related precipitation anomaly variability over eastern subtropical South America: atypical precipitation seasons. Int. J. Climatol. doi: 10.1002/joc.6559. [Epub ahead of print].
IPCC (2018). “Global Warming of 1.5°C,” in An IPCC Special Report on the Impacts of Global Warming of 1.5°C Above Pre-industrial Levels and Related Global Greenhouse Gas Emission Pathways, in the Context of Strengthening the Global Response to the Threat of Climate Change, Sustainable Development, and Efforts to Eradicate Poverty, eds V. Masson-Delmotte, P. Zhai, H. O. Pörtner, D. Roberts, J. Skea, P.R. Shukla, A. Pirani, W. Moufouma-Okia, C. Péan, R. Pidcock, S. Connors, J.B.R. Matthews, Y. Chen, X. Zhou, M.I. Gomis, E. Lonnoy, T. Maycock, M. Tignor, and T. Waterfield (Geneva: IPCC).
James, R., Washington, R., Schleussner, C.-F., Rogelj, J., and Conway, D. (2017). Characterizing half-a-degree difference: a review of methods for identifying regional climate responses to global warming targets. WIREs Clim. Change 8:e457. doi: 10.1002/wcc.457
Kjellström, E., Nikulin, G., Strandberg, G., Christensen, O. B., Jacob, D., Keuler, K., et al. (2018). European climate change at global mean temperature increases of 1.5 and 2 °C above pre-industrial conditions as simulated by the EURO-CORDEX regional climate models. Earth Syst. Dynam. 9, 459–478. doi: 10.5194/esd-9-459-2018
Larkin, A., Kuriakose, J., Sharmina, M., and Anderson, K. (2018). What if negative emission technologies fail at scale? implications of the Paris agreement for big emitting nations. Clim. Policy 18, 690–714. doi: 10.1080/14693062.2017.1346498
Ma, J., Chadwick, R., Seo, K.-H., Dong, C., Huang, G., Foltz, G. R., et al. (2018). Responses of the tropical atmospheric circulation to climate change and connection to the hydrological cycle. Ann. Rev. Earth Planet. Sci. 46, 549–580. doi: 10.1146/annurev-earth-082517-010102
Maenza, R. A., Agosta, E. A., and Bettolli, M. L. (2017). Climate change and precipitation variability over the western ‘Pampas' in Argentina. Int. J. Climatol. 37, 445–463. doi: 10.1002/joc.5014
Markus, M., Cai, X., and Sriver, R. (2019). Extreme floods and droughts under future climate scenarios. Water 11:1720. doi: 10.3390/w11081720
Masiokas, M., Villalba, R., Luckman, B. H., Le Quesne, C., and Aravena, J. C. (2006). Snowpack variations in the central Andes of Argentina and Chile, 1951-2005: large-scale atmospheric influences and implications for water resources in the region. J. Clim. 19, 6334–6352. doi: 10.1175/JCLI3969.1
Masiokas, M. H., Rabatel, A., Rivera, A., Ruiz, L., Pitte, P., Ceballos, J. L., et al. (2020). A review of the current state and recent changes of the andean cryosphere. Front. Earth Sci. 8:99. doi: 10.3389/feart.2020.00099
Massone, H., Martinez, D., Vich, A., Quiroz Londoño, M., Trombotto, D., and Grondona, S. (2016). Snowmelt contribution to the sustainability of the irrigated Mendoza's Oasis, Argentina: an isotope study. Environ. Earth Sci. 75:520. doi: 10.1007/s12665-015-5141-9
Mba, W. P., Longandjo, G.-N. T., Moufouma-Okia, W., Bell, J.-P., James, R., Vondou, D. A., et al. (2018). Consequences of 1.5°C and 2°C global warming levels for temperature and precipitation changes over Central Africa. Environ. Res. Lett. 13:055011. doi: 10.1088/1748-9326/aab048
Mindlin, J., Shepherd, T. G., Vera, C. S., Osman, M., Zappa, G., Lee, R. W., et al. (2020). Storyline description of Southern hemisphere midlatitude circulation and precipitation response to greenhouse gas forcing. Clim. Dyn. 54, 4399–4421. doi: 10.1007/s00382-020-05234-1
Montaña, E., Diaz, H. P., and Hurlbert, M. (2016). Development, local livelihoods, and vulnerabilities to global environmental change in the South American dry andes. Reg. Environ. Change 16, 2215–2228. doi: 10.1007/s10113-015-0888-9
Neukom, R., Rohrer, M., Calanca, P., Salzmann, N., Huggel, C., Acuña, D., et al. (2015). Facing unprecedented drying of the central andes? precipitation variability over the period AD 1000–2100. Environ. Res. Lett. 10:084017. doi: 10.1088/1748-9326/10/8/084017
Nikulin, G., Lennard, C., Dosio, A., Kjellström, E., Chen, Y., Hänsler, A., et al. (2018). The effects of 1.5 and 2 degrees of global warming on Africa in the CORDEX ensemble. Environ. Res. Lett. 13:065003. doi: 10.1088/1748-9326/aab1b1
Omani, N., Srinivasan, R., Karthikeyan, R., Venkata Reddy, K., and Smith, P. K. (2016). Impacts of climate change on the glacier melt runoff from five river basins. Trans. ASABE 59, 829–848. doi: 10.13031/trans.59.11320
O'Neill, B. C., Tebaldi, C., van Vuuren, D. P., Eyring, V., Friedlingstein, P., Hurtt, G., et al. (2016). The scenario model intercomparison project (ScenarioMIP) for CMIP6. Geosci. Model Dev. 9, 3461–3482. doi: 10.5194/gmd-9-3461-2016
Penalba, O. C., and Rivera, J. A. (2016). Precipitation response to El Niño/La Niña events in Southern South America – emphasis in regional drought occurrences. Adv. Geosci. 42, 1–14. doi: 10.5194/adgeo-42-1-2016
Pepin, N., Bradley, R., Diaz, H., Baraer, M., Caceres, E. B., Forsythe, N., et al. (2015). Elevation-dependent warming in mountain regions of the world. Nat. Clim. Change 5, 424–430. doi: 10.1038/nclimate2563
Piquer-Rodríguez, M., Baumann, M., Butsic, V., Gasparri, H. I., Gavier-Pizarro, G., Volante, J. N., et al. (2018). The potential impact of economic policies on future land-use conversions in Argentina. Land Use Policy 79, 57–67. doi: 10.1016/j.landusepol.2018.07.039
Pischke, E. C., Solomon, B., Wellstead, A., Acevedo, A., Eastmond, A., De Oliveira, F., et al. (2019). From Kyoto to Paris: measuring renewable energy policy regimes in Argentina, Brazil, Canada, Mexico and the United States. Energ. Res. Soc. Sci. 50, 82–91. doi: 10.1016/j.erss.2018.11.010
Rangwala, I., Sinsky, E., and Miller, J. R. (2013). Amplified warming projections for high altitude regions of the northern hemisphere mid-latitudes from CMIP5 models. Environ. Res. Lett. 8:024040. doi: 10.1088/1748-9326/8/2/024040
Rivera, J. A., and Arnould, G. (2020). Evaluation of the ability of CMIP6 models to simulate precipitation over Southwestern South America: climatic features and long-term trends (1901-2014). Atmosph. Res. 241:104953. doi: 10.1016/j.atmosres.2020.104953
Rivera, J. A., Otero, F., Naranjo Tamayo, E., and Silva, M. (2020). Sixty years of hail suppression activities in mendoza, argentina: uncertainties, gaps in knowledge and future perspectives. Front. Environ. Sci. Atmosph. Sci. 8:45. doi: 10.3389/fenvs.2020.00045
Rivera, J. A., Penalba, O. C., Villalba, R., and Araneo, D. C. (2017). Spatio-temporal patterns of the 2010-2015 extreme hydrological drought across the Central Andes, Argentina. Water 9:652. doi: 10.3390/w9090652
Robiou du Pont, Y., Jeffery, M., Gütschow, J., Rogelj, J., Christoff, P., and Meinshausen, M. (2017). Equitable mitigation to achieve the Paris Agreement goals. Nat. Clim. Change 7, 38–43. doi: 10.1038/nclimate3186
Rogelj, J. D., Shindell, K., Jiang, S., Fifita, P., Forster, V., Ginzburg, C., et al. (2018). “Mitigation Pathways Compatible with 1.5°C in the Context of Sustainable Development,” in Global Warming of 1.5°C. An IPCC Special Report on the Impacts of Global Warming of 1.5°C Above Pre-Industrial Levels and Related Global Greenhouse Gas Emission Pathways, in the Context of Strengthening the Global Response to the Threat of Climate Change, Sustainable Development, and Efforts to Eradicate Poverty, eds V. Masson-Delmotte, P. Zhai, H. O. Pörtner, D. Roberts, J. Skea, P.R. Shukla, A. Pirani, W. Moufouma-Okia, C. Péan, R. Pidcock, S. Connors, J.B.R. Matthews, Y. Chen, X. Zhou, M.I. Gomis, E. Lonnoy, T. Maycock, M. Tignor, and T. Waterfield (Geneva).
Rojas, F., Rubio, C., Rizzo, M., Bernabeu, M., Akil, N., and Martín, F. (2020). Land use and land cover in irrigated drylands: a long-term analysis of changes in the mendoza and Tunuyán River Basins, Argentina (1986–2018). Appl. Spatial Anal. 13, 875–899. doi: 10.1007/s12061-020-09335-6
Rusticucci, M., Kyselý, J., Almeira, G., and Lhotka, O. (2016). Long-term variability of heat waves in Argentina and recurrence probability of the severe 2008 heat wave in Buenos Aires. Theor. Appl. Climatol. 124, 679–689. doi: 10.1007/s00704-015-1445-7
Samset, B. H., Fuglestvedt, J. S., and Lund, M. T. (2020). Delayed emergence of a global temperature response after emission mitigation. Nat. Commun. 11:3261. doi: 10.1038/s41467-020-17001-1
Sanderson, B., Tebaldi, C., and O'Neill, B. (2016). What would it take to achieve the Paris temperature targets? Geophys. Res.Lett. 43, 7133–7142. doi: 10.1002/2016GL069563
Santos Da Silva, S. R., Miralles-Wilhelm, F., Muñoz-Castillo, R., Clarke, L. E., Braun, C. J., Delgado, A., et al. (2019). The Paris pledges and the energy-water-land nexus in Latin America: exploring implications of greenhouse gas emission reductions. PLoS ONE 14:e0215013. doi: 10.1371/journal.pone.0215013
Schellnhuber, H., Rahmstorf, S., and Winkelmann, R. (2016). Why the right climate target was agreed in Paris. Nature Clim. Change 6, 649–653. doi: 10.1038/nclimate3013
Schleussner, C. F., Rogelj, J., Schaeffer, M., Lissner, T., Licker, R., Fischer, E. M., et al. (2016). Science and policy characteristics of the Paris agreement temperature goal. Nat. Climate Change 6, 827–835. doi: 10.1038/nclimate3096
Schwank, J., Escobar, R., Girón, G. H., and Morán-Tejada, E. (2014). Modeling of the Mendoza river watershed as a tool to study climate change impacts on water availability. Environ. Sci. Policy 43, 91–97. doi: 10.1016/j.envsci.2014.01.002
Secretaría de Ambiente y Desarrollo Sustentable (2019). Informe Nacional de Inventario del Tercer Informe Bienal de Actualización de la República Argentina a la Convención Marco de las Naciones Unidas para el Cambio Climático (CMNUCC). Available online at: https://www4.unfccc.int/sites/SubmissionsStaging/NationalReports/Documents/9587041_Argentina-BUR3-1-3er%20Informe%20Bienal%20de%20la%20Republica%20Argentina.pdf (accessed July 20, 2020).
Secretaría de Ambiente y Desarrollo Sustentable. (2015). Tercera Comunicación Nacional de la República Argentina a la Convención Marco de las Naciones Unidas Sobre el Cambio Climático. Available online at: https://www.argentina.gob.ar/sites/default/files/3com.-resumen-ejecutivo-de-la-tercera-comunicacion-nacional.pdf (accessed July 20, 2020).
Solomon, A., Polvani, L. M., Waugh, D. W., and Davis, S. M. (2016). Contrasting upper and lower atmospheric metrics of tropical expansion in the Southern Hemisphere. Geophys. Res. Lett. 43, 10496–10503. doi: 10.1002/2016GL070917
Spinoni, J., Barbosa, P., Bucchignani, E., Cassano, J., Cavazos, T., Christensen, J. H., et al. (2020). Future global meteorological drought hotspots. a study based on CORDEX data. J. Clim. 33, 3635–3661. doi: 10.1175/JCLI-D-19-0084.1
Staten, P. W., Grise, K. M., Davis, S. M., Karnauskas, K. B., Waugh, D. W., Maycock, A., et al. (2020). Tropical widening: from global variations to regional impacts. Bull. Amer. Meteor. Soc. 101, E897–E904. doi: 10.1175/BAMS-D-19-0047.1
Staten, P. W., Lu, J., Grise, K. M., Davis, S. M., and Birner, T. (2018). Re-examining tropical expansion. Nature Clim. Change 8, 768–775. doi: 10.1038/s41558-018-0246-2
United Nations Framework Convention on Climate Change (2015). Paris Agreement. Available online at: https://unfccc.int/sites/default/files/english_paris_agreement.pdf (accessed July 20, 2020).
Viale, M., Bianchi, E., Cara, L., Ruiz, L. E., Villalba, R., Pitte, P., et al. (2019). Contrasting climates at both sides of the Andes in Argentina and Chile. Front. Environ. Sci. 7:69. doi: 10.3389/fenvs.2019.00069
Viale, M., and Nuñez, M. N. (2011). Climatology of winter orographic precipitation over the subtropical central Andes and associated synoptic and regional characteristics. J. Hydrometeorol. 12, 481–507. doi: 10.1175/2010JHM1284.1
Viale, M., Valenzuela, R., Garreaud, R. D., and Ralph, F. M. (2018). Impacts of atmospheric rivers on precipitation in Southern South America. J. Hydrometeor. 19, 1671–1687. doi: 10.1175/JHM-D-18-0006.1
Villalba, R., Boninsegna, J. A., Masiokas, M. H., Cara, L., Salomón, M., and Pozzoli, J. (2016). Cambio climático y recursos hídricos. El caso de las tierras secas del oeste argentino. Ciencia Hoy. 25, 48–55.
Villamayor, J., Khodri, M., Rivera, J. A., Naranjo, E. B., and Daux, V. (2019). “The expanding tropics impact on central Andes precipitation,” in General Assembly Conference Abstracts, Vol. 21 (Vienna).
Waugh, D. W., Grise, K. M., Seviour, W. J. M., Davis, S. M., Davis, N., Adam, O., et al. (2018). Revisiting the relationship among metrics of tropical expansion. J. Clim. 31, 7565–7581. doi: 10.1175/JCLI-D-18-0108.1
Wilcox, J., Renforth, P., and Kraxner, F, (eds.). (2020). The Role of Negative Emission Technologies in Addressing Our Climate Goals. Lausanne: Frontiers Media SA.
Zazulie, N., Rusticucci, M., and Raga, G. B. (2017). Regional climate of the Subtropical Central Andes using high-resolution CMIP5 models. Part I: past performance (1980-2005). Clim. Dyn. 49, 3937–3957. doi: 10.1007/s00382-017-3560-x
Keywords: CMIP6, Central-Western Argentina, hydrological cycle, climate projections, climate change, low emission scenarios, Paris agreement, regional impacts
Citation: Rivera JA, Naranjo Tamayo E and Viale M (2020) Water Resources Change in Central-Western Argentina Under the Paris Agreement Warming Targets. Front. Clim. 2:587126. doi: 10.3389/fclim.2020.587126
Received: 24 July 2020; Accepted: 25 November 2020;
Published: 16 December 2020.
Edited by:
Roger Rodrigues Torres, Federal University of Itajubá, BrazilReviewed by:
Álvaro Ávila-Díaz, Universidade Federal de Viçosa, BrazilCristiano Prestrelo, Federal University of Rio Grande Do Norte, Brazil
Copyright © 2020 Rivera, Naranjo Tamayo and Viale. This is an open-access article distributed under the terms of the Creative Commons Attribution License (CC BY). The use, distribution or reproduction in other forums is permitted, provided the original author(s) and the copyright owner(s) are credited and that the original publication in this journal is cited, in accordance with accepted academic practice. No use, distribution or reproduction is permitted which does not comply with these terms.
*Correspondence: Juan A. Rivera, anJpdmVyYUBtZW5kb3phLWNvbmljZXQuZ29iLmFy