 Mark Loveland1
 Amin Kiaghadi1,2*
 Clint N. Dawson1
 Hanadi S. Rifai2Shubhra Misra3
 Helena Mosser4Alessandro Parola4
- 1Computational Hydraulics Group, Oden Institute, University of Texas at Austin, Austin, TX, United States
- 2Civil and Environmental Engineering, University of Houston, Houston, TX, United States
- 3Hurricane Flood Risk Reduction Design Branch, U.S. Army Corps of Engineers Galveston District, Galveston, TX, United States
- 4Water Resource Branch, U.S. Army Corps of Engineers Fort Worth District, Fort Worth, TX, United States
Compound flooding is a physical phenomenon that has become more destructive in recent years. Moreover, compound flooding is a broad term that envelops many different physical processes that can range from preconditioned, to multivariate, to temporally compounding, or spatially compounding. This research aims to analyze a specific case of compound flooding related to tropical cyclones where the compounding effect is on coastal flooding due to a combination of storm surge and river discharge. In recent years, such compound flood events have increased in frequency and magnitude, due to a number of factors such as sea-level rise from warming oceans. Therefore, the ability to model such events is of increasing urgency. At present, there is no holistic, integrated modeling system capable of simulating or forecasting compound flooding on a large regional or global scale, leading to the need to couple various existing models. More specifically, two more challenges in such a modeling effort are determining the primary model and accounting for the effect of adjacent watersheds that discharge to the same receiving water body in amplifying the impact of compound flooding from riverine discharge with storm surge when the scale of the model includes an entire coastal line. In this study, we investigated the possibility of using the Advanced Circulation (ADCIRC) model as the primary model to simulate the compounding effects of fluvial flooding and storm surge via loose one-way coupling with gage data through internal time-dependent flux boundary conditions. The performance of the ADCIRC model was compared with the Hydrologic Engineering Center- River Analysis System (HEC-RAS) model both at the watershed and global scales. Furthermore, the importance of including riverine discharges and the interactions among adjacent watersheds were quantified. Results showed that the ADCIRC model could reliably be used to model compound flooding on both a watershed scale and a regional scale. Moreover, accounting for the interaction of river discharge from multiple watersheds is critical in accurately predicting flood patterns when high amounts of riverine flow occur in conjunction with storm surge. Particularly, with storms such as Hurricane Harvey (2017), where river flows were near record levels, inundation patterns and water surface elevations were highly dependent on the incorporation of the discharge input from multiple watersheds. Such an effect caused extra and longer inundations in some areas during Hurricane Harvey. Comparisons with real gauge data show that adding internal flow boundary conditions into ADCIRC to account for river discharge from multiple watersheds significantly improves accuracy in predictions of water surface elevations during coastal flooding events.
Introduction
The observed increasing trend in the destructiveness of coastal storms over the past decades (Emanuel, 1987, 2005; Demaria and Kaplan, 1994; Jongman et al., 2012; Hinkel et al., 2014) has been attributed to the changing climate (Levitus et al., 2000); a trend that does not appear to be slowing down. Part of the increase in damage of more recent storms can be attributed to the higher levels of flooding due to combined effects from riverine flows and storm surge (Bakhtyar et al., 2020a). While oceanic processes such as tides and storm surge impact flooding in low lying coastal areas, meteorological and hydrological mechanisms influence flooding due to rainfall. When these processes interact, they can cause much higher flooding levels than if they were to occur separately. A compound event can be defined as a combination of simultaneous or sequential processes leading to a more significant event (Couasnon et al., 2020). Applying this definition to coastal flooding, a compound flooding event is flooding due to the interaction of the open ocean, meteorological behavior, and hydrological factors (Zscheischler et al., 2018).
The increase in damage to coastal areas from hurricanes in recent years present the need to model the compounding effects from storm surge and riverine discharge more accurately so that reliable flood-risk assessments, including forecasts can be made. Compounding processes pose a challenge to current coastal models because there are a vast amount of physical processes such as tides, storm surge, sea level rise, wind, and river discharge that all interact with each other to significantly impact flooding in coastal areas (Bilskie et al., 2016; Moftakhari et al., 2017, 2019; Saleh et al., 2017; Bilskie and Hagen, 2018; Muñoz et al., 2020; Ye et al., 2020). While there are many physics-based coastal, hydrodynamic, hydraulic, and hydrologic models, most have typically been applied to account for one or more limited processes involved in compound flooding and not the entire set of forcing parameters. For instance, there are many well-validated models for storm surge such as the Sea, Lake and Overland Surges from Hurricanes (SLOSH) model (Jelesnianski et al., 1992), the Semi-implicit Cross-scale Hydroscience Integrated System Model (SHCISM) (Zhang and Baptista, 2008; Zhang et al., 2016), DELFT3D (Veeramony et al., 2016), and the Advanced Circulation (ADCIRC) model (Fleming et al., 2008). There are also many well-validated hydrological and hydraulic models that model rainfall-runoff processes such as the Gridded Surface Subsurface Hydrological Analysis Model (GSSHA) (Downer et al., 2004), the Hydrologic Engineering Center River Analysis System (HEC-RAS) (Brunner, 2002; Hicks and Peacock, 2005), and the Watershed Systems of 1-D Stream-River Network, 2-D Overland Regime, and 3-D Subsurface Media (WASH123D). Some of these models are capable of modeling streamflow, surface-runoff flow, and subsurface flow represented using a common set of governing equations (Yeh et al., 2005). Though models such as WASH123D, GSSHA, and HEC-RAS excel at modeling a diverse array of physics in coastal environments, these models typically cover a single watershed and therefore do not model wind-driven storm surge coming in the open ocean which is important in order to perform forecasts (Santiago-Collazo et al., 2019).
To simulate compound flooding and more specifically the compounding effects of storm surge and riverine discharge on coastal flooding, there have been many recent efforts that could be categorized into the following approaches: (1) a single model that contains all of the size, detail, and physics needed to capture compound flooding from wind-driven storm surge from the open ocean and riverine discharge from inland, (2) loose coupling of a storm surge model with a hydrological/hydraulic model (for river discharge) through boundary conditions (one or two ways), and (3) dynamic coupling by passing back and forth boundary conditions at each synched time-step (Santiago-Collazo et al., 2019). Among these approaches, the loose coupling of the hydrological model with the storm surge model via boundary conditions, and making a single integrated, holistic modeling framework are the most common and most challenging methods, respectively. To date, to the best knowledge of the authors, there is no single modeling system that could address all aspects of compound flooding. However, many studies have coupled two or more models, loosely or dynamically, to simulate different compounding effects such as the compounding effect of storm surge and riverine discharge which this research focuses on. Kumbier et al. (2018) investigated the compounding effects of riverine discharge and storm surge off the coast of Australia by incorporating upstream river discharge boundary conditions from gauge data into the Delft3D model and found that neglecting riverine discharge resulted in an underprediction of flood levels by 30% (Kumbier et al., 2018). Zhang et al. (2019) utilized the hydrological model National Water Model (NWM) to account for the compounding effect from riverine discharge as input into the SCHISM ocean dynamics model via exterior boundary conditions in order to model Hurricane Irene's impact on Delaware Bay (Zhang et al., 2019). It was found that the inclusion of riverine discharge into the SCHSIM model resulted in elevated water surface levels for more than 2 weeks after Hurricane Irene hit that area. Bakhtyar et al. (2020b) executed a loose one-way coupling between the NWM and ADCIRC/WAVEWATCH III using the D-Flow FM hydraulic model to assess compound flooding impacts for tropical cyclones in the Delaware river basin and it was shown that water level predictions depend on a detailed representation of riverine discharge and elevated sea levels as well as detailed pressure and wind forcing (Bakhtyar et al., 2020b). Gori et al. (2020) investigated the contribution of flooding due to river discharge along the North Carolina coast by loosely coupling the storm surge model ADCIRC, and the hydraulic model HEC-RAS by using ADCIRC output as downstream boundary conditions into the 1-D/2-D HEC-RAS hydraulic model in order to account for the effects of storm surge (Gori et al., 2020). It was found that riverine contributions increased peak storm tide by up to 0.36 m. Environmental Fluid Dynamics Code (EFDC) (Hamrick, 1992) was coupled with ADCIRC to examine the concurrent impact of hurricane surge and floods due to significant rainfall with different return periods (Alarcon et al., 2014a,b), and to simulate the fate and transport of spills during compound events (Kiaghadi et al., 2018). Results showed increases in land inundated with longer inundation times along with up to 2 m higher water depth in areas with a higher number of discharging bayous. Additionally, it was found the velocities were significantly higher during the receding surge when riverine flows were included. In these loosely coupled modeling frameworks, there is a “primary” model which simulates the dominant physical processes in the area of interest, with the “secondary” model providing boundary conditions to the primary model.
While the idea of using two or more models in a coupled framework is common in simulating compound flooding, choosing the primary model is challenging. Selecting the right primary model is a function of various factors including but not limited to the purpose and scale of modeling, reliability of the model, computational time, and ease of use. When simulating compound flooding scenarios (or real-time modeling) where both riverine discharge and storm surge are occurring, determining the downstream boundary condition is challenging. For instance, in a loosely coupled framework with a small domain model as the primary one, the discharge upstream could be directly affected by the downstream water surface elevation (WSE) modeled by a separate large domain model that does not take the discharge flux into account. This compound effect on the WSE can also be influenced by contributions from adjacent watersheds that discharge to the same receiving water body (e.g., lake or bay). Thus, the application of using some of the existing hydrodynamic models such as EFDC or HEC-RAS as the primary model to simulate a compound flooding event, would be limited to a small domain for a hindcast scenario. These limitations are mainly due to not being fully parallelized [not using a high-performance computational (HPC) platform] that leads to a need for a downstream boundary condition that is not far away from the affected zone by the storm surge, upstream discharges, and any adjacent watersheds. Furthermore, some of the hydrodynamic models do not have the capability to simulate wind-driven flows from the open ocean. Hence, within the context of compound flood modeling related to tropical cyclones, it is essential to evaluate the ability of a storm surge model that is capable of simulating wind-driven surges and riverine flows that could be run on an HPC platform. In other words, the primary model should have the capability of simulating the maximum possible components of compound flooding individually with the minimum requirement of boundary data being provided by the secondary model.
In this study, ADCIRC was chosen as the primary model because it is a well-validated model and is maintained by a large community of users (Dietrich et al., 2011a, 2012; Hagen, 2011; Bhaskaran et al., 2013; Hope et al., 2013; Technology Riverside Inc., and AECOM, 2015). Since it has an unstructured mesh design (Luettich and Westerink, 2004), it allows for a large domain where ocean dynamics far from the coast (wind-driven hurricanes) can be modeled with enough detail to capture critical features in coastal areas such as rivers and weirs, which will allow for incorporating compound flooding effects. Furthermore, ADCIRC has been written in parallel with Message Passing Interface (MPI), so it is capable of evaluating large domains that contain millions of nodes in a short period of time (Dietrich et al., 2011b). For this study, the approach to model compound flooding is by loosely one-way coupling internal flux boundary conditions into the ADCIRC model to account for river discharge.
HEC-RAS 2-D was chosen as the secondary model since it is a well-documented model with many validated test cases that excels at modeling hydraulics on a single watershed with high accuracy when calibrated (Hicks and Peacock, 2005; Brunner, 2016; Quirogaa et al., 2016; Balbhadra et al., 2020). The 2-D version of HEC-RAS was specifically chosen so that comparisons with ADCIRC, which is a 2-D model as well, can be made in order to evaluate ADCIRC's validity as a model for combined riverine discharge and storm surge on the scale of a watershed.
The main objectives of this study are (i) evaluating ADCIRC's validity in modeling river discharge. This will be accomplished by simulating compound floods around a single river and comparing the results with the observed data and a validated hydraulic model (HEC-RAS 2-D) as benchmarks, (ii) evaluating ADCIRC's validity in modeling a storm system from the open ocean with river discharge included, this riverine discharge will be interpolated from the flux input from the validated HEC-RAS 2-D model. This will be accomplished by running ADCIRC in a larger domain that includes multiple rivers as well as the coast and greater ocean. The results will then be compared with the aforementioned benchmarks, and (iii) including discharges from multiple adjacent watersheds to evaluate the codependency between WSE and riverine discharge and how a large domain model could capture this effect. For the first objective, a fixed downstream boundary condition will be used to mimic the storm surge effect within the domain, while for the second and third ones, a wind field will be used to generate the storm surge far away from the watershed of interest.
Methods
Model Theory
As noted earlier, the main objective of this research is to evaluate the reliability of ADCIRC as the primary model in simulating compound flooding and comparing its performance with the HEC-RAS model. The two models utilize different physics equations to model WSE; HEC-RAS solves the 2-D Shallow Water Equations while ADCIRC solves the Generalized Wave Continuity Equations (GWCE) (Luettich and Westerink, 2004; Dietrich et al., 2012). The GWCE in spherical coordinates is a differential form of the continuity and momentum conservation equations specifically for shallow water (where the horizontal length scale is much larger than the depth length scale) systems (see the Supplementary Materials section for more details).
It is important to recall that ADCIRC's numerical approximation to the GWCE utilizes a finite element approximation on an unstructured triangular mesh. This contrasts with HEC-RAS, which uses a finite volume method on a structured rectangular mesh. It is important here to see that the GWCE from ADCIRC was first designed for modeling the open ocean and wind-driven storm surge and so ADCIRC contains many more forcing terms than the HEC-RAS equations. The HEC-RAS model was created for evaluating river floodplains, and so processes that occur in the open ocean, such as wind-driven surge and tides are not accounted for in the governing equations but are instead included as external boundary conditions when needed. However, as an advantage for HEC-RAS 2D, it has the capability of modeling direct rainfall excess onto the grid which ADCIRC cannot currently handle. Since HEC-RAS requires a uniform grid and is parallelized using a shared-memory approach, it is not as scalable as ADCIRC. As a result, ADCIRC is capable of modeling much larger coastal systems than HEC-RAS. However, HEC-RAS has the advantage in that it is typically run in small but very highly detailed domains and can account for rainfall effects.
Study Area, Model Domains, and Inputs
The focus of this study is on the lower Neches River from the Salt Water Barrier to Sabine Lake, located in southeast Texas, very close to its border with Louisiana. Figure 1 shows the location of the lower Neches River as well as the Sabine River, which also discharges into Sabine Lake (3 miles east of Neches outflow). In this study, an existing calibrated and validated HEC-RAS model developed by the USACE for the study areas was used. The HEC-RAS 2-D domain developed by the U.S. Army Corps of Engineers (USACE), Fort Worth District, which includes ~26,000 rectangular computational cells (121.9 m by 121.9 m), is also shown in Figure 1 (Mosser et al., 2019). The domain covers ~28 miles of the Lower Neches River and includes the conveyance of the Neches River floodplain. Manning's roughness coefficients for the model were determined based on USGS developed land use raster file titled National Land Cover Database 2011 Land Cover (Homer et al., 2015) and areas of open water were overwritten with a value of 0.035. The bathymetry was specified by two sources; all area above normal water surface was determined by 1-m Light Detection and Ranging (LiDAR) data surveyed from 2017 to 2018 by the Texas Natural Resources Information System (TNRIS) while all area beneath the normal water surface level was determined from bathymetric data from the Sabine-to-Galveston ADCIRC model (Melby et al., 2019). An approximate trapezoidal channel along the Neches River was burned into the terrain below the water surface whenever the Sabine-to-Galveston ADCIRC bathymetric data was not refined enough. The HEC-RAS 2-D model has two boundary conditions: (1) upstream boundary (flow hydrograph) based on the available observed discharge values from the United States Geological Survey (USGS) streamflow gage at the Salt Water Barrier shown in Figure 1, and (2) downstream boundary (stage hydrograph) based on the WSE collected at National Oceanic and Atmospheric Administration (NOAA) 8770475 Port Arthur, TX gage. For the upstream boundary when gage data is not available, there is a calibrated HEC-HMS model created by the USACE that covers the 25534 square kilometers of the Neches River watershed just upstream of the upstream boundary condition in the HEC-RAS domain that will provide the flow rates. For the downstream boundary condition, in the absence of data from the NOAA gauge, WSE from ADCIRC or other models could be fed into HEC-RAS, however in this case the NOAA gauge was sufficient.
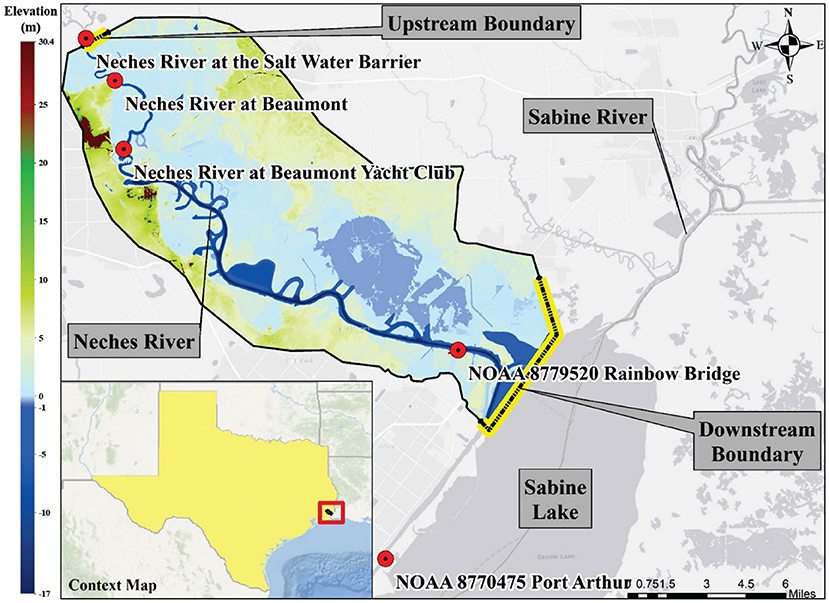
Figure 1. Lower Neches River watershed and Sabine River and Sabine Lake locations. The color-coded figure shows the bathymetry and land elevation. The HEC-RAS domain is outlined in black. Location of gages demarcated by red dots.
For ADCIRC, two meshes, one small (Figure 2B) and one large (Figure 2A) were used. The small mesh was used for evaluating ADCIRC's ability to model riverine discharge (objective 1), and the larger mesh was used to evaluate ADCIRC's ability to model a storm coming from the open ocean in combination with riverine discharge (objectives 2 and 3). A highly detailed and fine resolution mesh, provided by the USACE, with a total of 9,182,080 unstructured triangular elements (Figure 2A), was used as the large mesh. The large ADCIRC mesh includes the entire Gulf of Mexico as well as the Atlantic coast. A MATLAB tool (could be accessed through https://github.com/kiaghadi/Codes/blob/master/Extracting_XYZ_Manning_From_ADCIRC.m) was developed to extract the bathymetry and manning coefficients within the large ADCIRC mesh that coincide with the HEC-RAS 2D model (the full domain is shown in Figure 1 and part of the HEC-RAS mesh is shown in Figure 2C). The selected nodes were then exported to ArcMap where the “Extract Values to Point” was used to assign the bathymetry, land elevation, and manning values to the ADCIRC nodes from the HEC-RAS input rasters. Another MATLAB tool (https://github.com/kiaghadi/Codes/blob/master/Cutting_ADCIRC_Mesh.m) was developed to custom cut the large mesh to the size of the HEC-RAS domain and export the updated nodes, cells, boundary conditions, bathymetry, land elevation, and node attributes in order to create the small ADCIRC mesh. The output was the small ADCRIC mesh with a total of 122,839 unstructured triangular elements (part of the small mesh is shown in Figure 2B). The effects of river discharge were added into the small and large ADCIRC models via internal time-dependent flux boundary conditions across a string of seven nodes. A sensitivity analysis, using the small mesh, was performed in order to determine the location of the internal time-dependent flux boundary conditions. The sensitivity analysis resulted in the boundary conditions being added into the ADCIRC meshes (both small and large) in an area that is as far upstream in the Neches River as possible but where there is still high enough mesh refinement to describe the river feature. In addition to the Neches River flow boundary condition that was added to both small and large mesh, an additional boundary condition was implemented on the large mesh to represent discharges from the Sabine River. After the meshes were created, a Python code (https://github.com/Markloveland/Writefort20) was developed to automate the process of reading the time-dependent flux boundary data by interpolating the same boundary data that was used for the upstream boundary conditions in HEC-RAS, which was derived from nearby USGS gage data, onto the ADCIRC meshes. The code distributes the flux among boundary nodes and delivers flux at each node for the time periods of the simulations. ADCIRC treats flow as flux; thus, the flow data (usually given in cms or cfs) was converted to m2/s using the width between the flow boundary nodes.
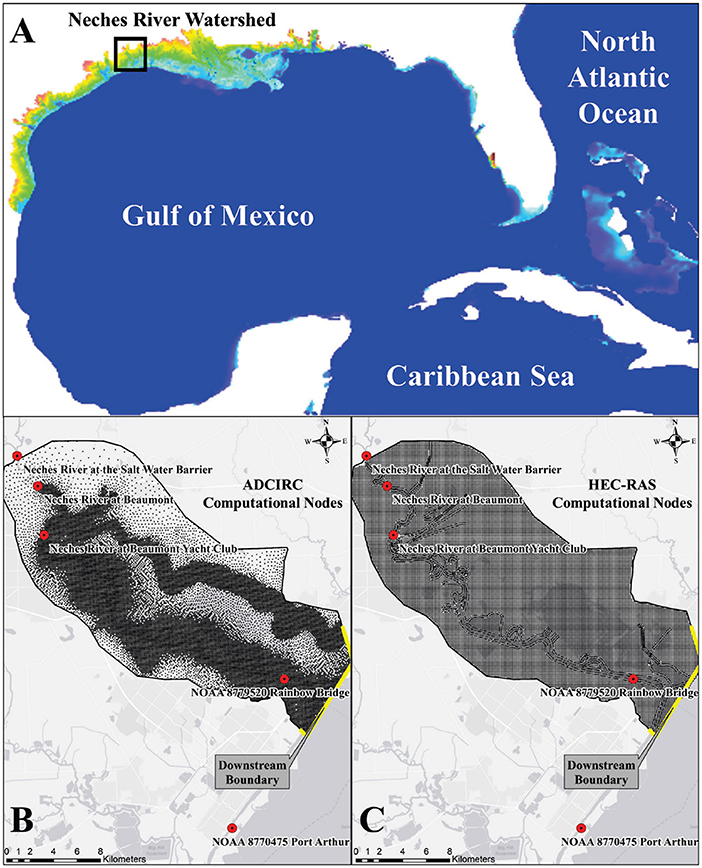
Figure 2. (A) Location of the Neches River watershed within the large ADCIRC mesh that include the Gulf of Mexico and part of the north Atlantic Ocean, (B) ADCIRC small mesh structure, each black dot indicates a computational node, and (C) HEC-RAS mesh structure, the black lines separate each of the finite volume elements.
For the ADCIRC small domain, the downstream boundary condition was defined as a non-periodic, time-varying elevation boundary condition. To determine the values for downstream boundary condition in ADCIRC, WSE was extracted from the HEC-RAS 2D model input, which was derived from data from the closest NOAA gage, and then interpolated into ADCIRC model input. For the ADCIRC large domain, instead of having a downstream boundary condition the exterior boundaries were tidal boundary conditions in the North Atlantic Ocean. The tidal boundary conditions were determined using OceanMesh2D software (Pringle, 2018) which interpolates output from the Oregon State University TPXO9 tidal model (Egbert and Erofeeva, 2002) into external elevation specified boundary conditions. In the large domain, winds were incorporated as inputs in order to account for storm surge. Official hindcast winds and pressure data were obtained from the USACE Research & Development Center Coastal & Hydraulics Laboratory in the Oceanweather Inc. (OWI) format and used as the forcing input for ADCIRC. The OWI winds and pressures were given over three uniform grids with three levels of refinement at time intervals of 15 min. The coarsest grid extended over most of the Gulf of Mexico and Atlantic coast with latitudes from 5 degrees North up to 42 degrees North and longitudes from 99 degrees West to 55 degrees West with refinement of 0.2 degrees in both directions. The next level of refinement has a grid from 18 degrees North to 31 degrees North and 98 degrees West to 80 degrees West with refinement of 0.08 degrees in both directions. The level of highest refinement was from 26.5 degrees North to 29.5 degrees North and from 98.5 degrees West to 95.4 degrees West with a refinement of 0.02 degrees in both directions. ADCIRC automatically interpolates both temporally and spatially these winds and pressures from the uniform OWI grids onto each node of the ADCIRC mesh by taking the winds and pressures from the grid with the highest refinement at the location of a given node.
Scenarios
After constructing the meshes, Hurricane Harvey (2017) was simulated in each model and model results were compared to measured data from USGS and NOAA gages. Although peak storm surge caused by Hurricane Harvey was observed in Corpus Christi, the hurricane produced moderate surge levels in the study area. Furthermore, Hurricane Harvey caused historical precipitation in the study area leading to unprecedented flow rates in the Neches River, making it a good case study for compound flooding.
To evaluate the capability of the ADCIRC model in simulating compound flooding, we ran the ADCIRC model with the Hurricane Harvey test case for 12 days using the small mesh (with the same domain size as HEC-RAS) with the boundary conditions set to the same as the HEC-RAS model (USGS gage data in upstream boundary and NOAA gage data for the downstream boundary condition) just interpolated onto the small ADCIRC mesh. We then compared the ADCIRC results with the validated HEC-RAS model, which ran for the same 12 days (by USACE), and gage data. Next, we ran the ADCIRC model with the large mesh for five different scenarios: (i) Hurricane Harvey with both Neches and Sabine Rivers, and storm surge (wind and pressure driven) inputs, (ii) Hurricane Harvey with no flow input (surge effect), (iii) Hurricane Harvey with flow input only from Neches River, (iv) Hurricane Harvey with flow input but with no wind field, and (v) Hurricane Harvey with no flow and no wind output (just tides). The first scenario was developed to evaluate the performance of the ADCIRC model as the primary model in simulating compound flooding and compare its performance in its full capacity (e.g., by including the wind field) with HEC-RAS. The second scenario was chosen to evaluate the effect of having riverine flows not only within the watershed but also farther downstream. The third scenario was tested to assess the effect of flow discharging from the adjacent watersheds (Sabine River) when evaluating the compound flooding within a watershed (Neches River). Finally, the last two scenarios were tested to see the effect of storm surge and examine to see if compound flooding from storm surge and river discharge played a significant role during Hurricane Harvey. It should be noted that the WSEs in the Sabine Lake, where both rivers discharging into, are a function of tides, storm surge (wind driven), and discharges from both rivers. Although the HEC-RAS model developed for the Neches River watershed does not include the discharge rates from Sabine river, using the actual WSEs observed during a hydrologic event (i.e., Hurricane Harvey) will incorporate the effect of the aforementioned variables into the model. In other words, the effect of Sabine River discharge on Neches River inundation pattern is dictated to the model through the downstream boundary condition that is based on observed data. This dependency to the downstream boundary condition could be problematic when the model is being used to test scenarios instead of hindcast studies. In this case, a significant error in the model results could be introduced by not considering the effect of adjacent watersheds or not including them in the coupled models (e.g., ADCIRC).
Comparison Metrics
In order to analyze the differences in WSE output of the HEC-RAS and ADCIRC models, it is essential to quantitatively evaluate the differences in the models as well as the difference between each model and real data collected during the hydrologic event. As seen in Figure 1, there are four locations within the HEC-RAS and corresponding ADCIRC domains that have USGS or NOAA gauge data. These locations are the Neches River at the Saltwater Barrier, the Neches River at Beaumont, the Neches River at Beaumont Yacht Club, and Rainbow Bridge (see Figure 1). Among these four locations, the Neches River at the Saltwater Barrier (USGS gage) is located upstream of the flow boundary in the ADCIRC domain and very close to the HEC-RAS upstream boundary condition. Furthermore, there is a hydraulic structure located at that location that is not included in the ADCIRC mesh. Thus, in this study, data from the other three gauges were used for comparisons with model results. In the subsequent section, the resulting output from ADCIRC and HEC-RAS models will be compared with each other and the gauge data at these three locations. In order to evaluate the magnitude of error between the models and the real data quantitatively, the root means square error (RMSE) is computed for each comparison. RMSE is described by the following:
Where t is the time step, is the observed WSE at time step t, yt is the model output at time step t, and T is the total number of time steps. In addition to RMSE, the coefficient of determination (R2) is computed for each of the comparisons in order to evaluate how well the models are replicating measured data. R2 is described by the following:
Here denotes the mean of the observed data. While RMSE provides information on the accuracy of the model in predicting the magnitude, R2 evaluates how close the model fits the data. A value of R2of 1 means that the model fits the data exactly. In addition to evaluating the accuracy, the bias and mean absolute error (MAE) will also be calculated in order to see if the models have an underlying tendency in undershooting or overshooting measurements and to evaluate the aggregate of error between the models and data time series. MAE and bias are calculated using the following formulas:
It should be noted that instead of relying on real observational data from the hindcast that the small mesh uses, the large ADCIRC mesh relies on wind driven storm surge and the harmonic tide from the open ocean. As a result, less accurate results are anticipated from the large mesh simulations; however, the general trends and periodicity of the rise in WSE is expected to remain similar to the HEC-RAS and ADCIRC small mesh.
Results and Discussion
Comparing ADCIRC and HEC-RAS
The small ADCIRC mesh, large ADCIRC mesh (with both Neches and Sabine Rivers), and HEC-RAS models were run for the Hurricane Harvey case and resulted in the following WSE time-series (Figure 3) at the Neches River at Beaumont, Neches River at Beaumont Yacht Club, Rainbow Bridge stations, and HEC-RAS downstream boundary location (see Figure 1 for the locations). The comparison metrics for all simulations are shown in Table 1. The small ADCIRC mesh showed a very similar pattern in predicting WSE when compared to HEC-RAS (0.76 < R2 < 0.88). It is apparent that, in general, the ADCIRC small mesh simulation underpredicted WSEs (Figure 3) with an RMSE between 0.13 and 0.59 m and bias between −0.01 and 0.50 m compared to the HEC-RAS model. The small mesh ADCIRC results at Rainbow Bridge, the most downstream observational gauge, compared well with the HEC-RAS results as shown in Figure 3. At this station, there was an RMSE of only 0.13 m with an R2 of 0.88, MAE of ~11.7% and a small bias of −0.01 m, which corresponds to an overprediction.
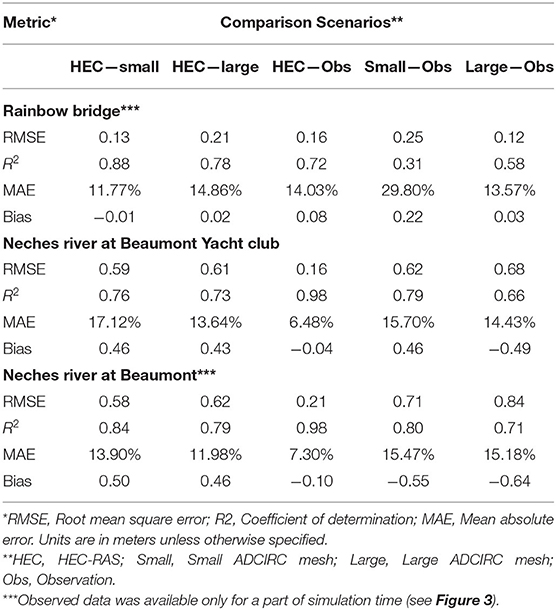
Table 1. Evaluation metrics for different simulation scenarios.
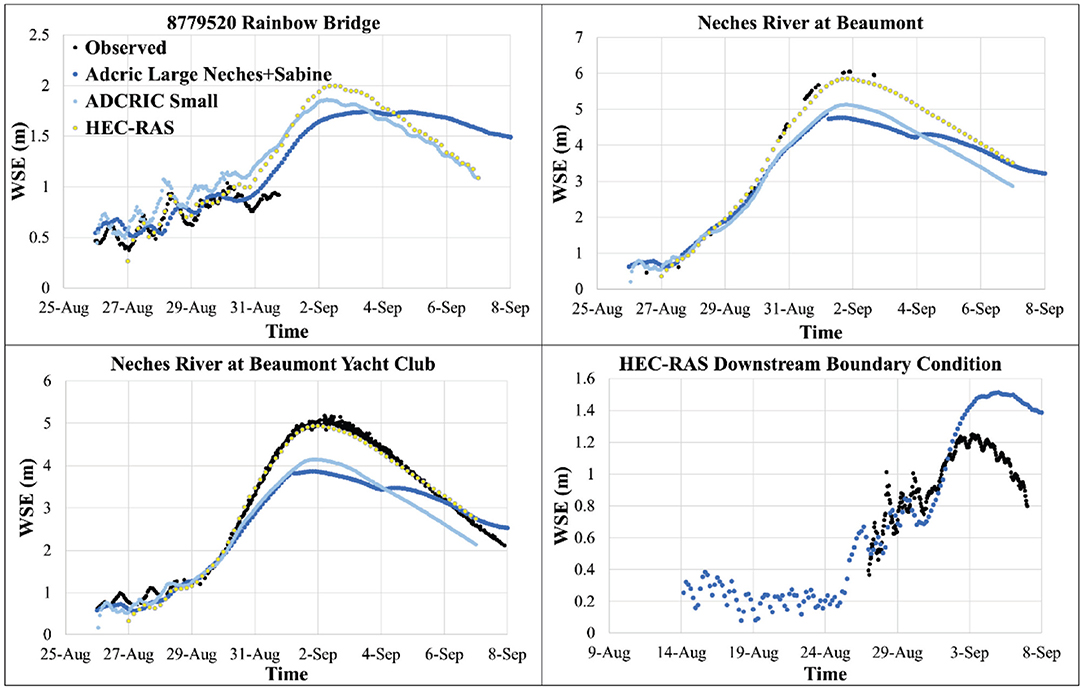
Figure 3. Results of various ADCIRC simulation scenarios for water surface elevations (WSEs) at different locations (see Figure 1 for the locations).
The large ADCIRC mesh performed somewhat similar to the small ADCIRC mesh; the large mesh results were slightly less accurate (compared to observational data) and underestimated the WSE even more than the small mesh. The RMSEs in comparison to the HEC-RAS output and real-time observations were between 0.21–0.62 m and 0.12–0.84 m, respectively. The observed data, in Rainbow Bridge and Neches River at Beaumont stations, as seen in Figure 3, was too sparse, so the evaluation metrics presented in Table 1 should be treated with care for these two stations. However, qualitatively, the observed data followed very close to the HEC-RAS output.
Based on the results depicted in Figure 3 and Table 1, it appears that the ADCIRC model is capable of computing changes in WSE due to riverine flooding though with underprediction of WSEs in some areas. As discussed in the methods section, HEC-RAS and ADCIRC models have different equations as well as various numerical schemes. However, another reason that could account for the underprediction of the first two stations is the fidelity of the ADCIRC mesh. The small ADCIRC mesh simulation was very accurate in modeling the WSE at Rainbow Bridge; the domain in the small model has a much heavier refinement in its mesh. The two stations where model results from ADCIRC underpredicted the WSE were in locations where the ADCIRC mesh was less detailed than the HEC-RAS mesh (as seen in Figures 2B,C). It has been shown that increasing the density of nodes in an ADCIRC mesh, especially near geographic features such as channels or lakes where there are steep variations in elevation, can drastically improve accuracy (Pringle et al., 2020). Finally, it should be noted that the HEC-RAS model was intensively calibrated for the Hurricane Harvey event while the ADCIRC model was not calibrated explicitly for this event. While the ADCIRC meshes were tuned to match the HEC-RAS model, tuning parameters and nodal attributes could also increase the accuracy as have be seen in multiple validations and sensitivity analyses using ADCIRC (Blain, 1998; Dietrich et al., 2011a, 2012; Bhaskaran et al., 2013; Hope et al., 2013).
Impact From Storm Surge
Since Hurricane Harvey was characterized by exceptionally high riverine discharge that heavily impacted water surface elevations in the Neches river watershed and Sabine Lake areas, it remains to be seen what influence storm surge had in compounding with the riverine discharge. As shown in Figure 4A even with all the flow emanating from Sabine and Neches Rivers, the WSE in the mouth of the Gulf of Mexico (GOM) did not change significantly without the presence of a wind field (storm surge). However, once the wind was considered an increase of almost 0.6 m (2 ft) was observed around August 25 when Hurricane Harvey hit the study area. Such an increase in WSE in the downstream of the study area accompanied by the flow from upstream could be considered a compound flooding event. The effect of flow on WSE at this location was observed several days after the passage of the strongest wind field when the riverine flow had continued to drain the runoff from the upper watersheds to GOM. The compounding effect of the wind and riverine flow in locations further upstream of the GOM mount (i.e., at the confluence of Neches River and Sabine Lake) is shown in Figure 4B. The simulations with the wind field showed higher level of WSE at the beginning of Harvey but once the high volume of runoff was introduced to the system and the wind field passed the study area, the scenarios with and without wind that considered flow showed almost identical results.
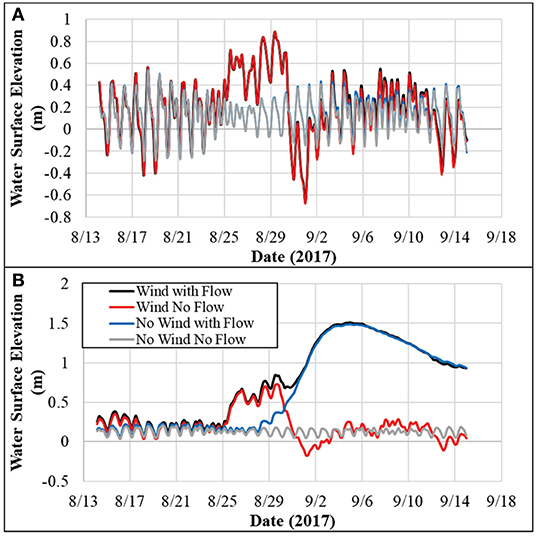
Figure 4. Water surface elevations from ADCIRC with various forcing conditions turned on/off (A) just downstream of the Sabine Lake at its confluence with Gulf of Mexico, and (B) at the confluence of Neches River and Sabine Lake (HEC-RAS and ADCIRC small mesh downstream boundaries).
Effect of Riverine Flow
In this section, the results of the effects of including riverine flow on the large ADCIRC mesh are presented. The ADCIRC large mesh was run for the same Hurricane Harvey test case, once with riverine discharge included from both Sabine and Neches rivers, and once with no riverine flow.
Figure 5 shows the maximum WSE at each model node over the course of the entire simulation (also known as maxele) for the large ADCIRC mesh with and without riverine flow inputs. The maximum elevation plots are not representative of any singular point in time, but instead, the maximum elevation reached at each point in space over the course of the whole simulation. Such plots are useful in evaluating the overall differences between the two simulations. It is apparent in Figure 5 that there is a large discrepancy in the WSE patterns between the two simulations (with and without riverine flows).
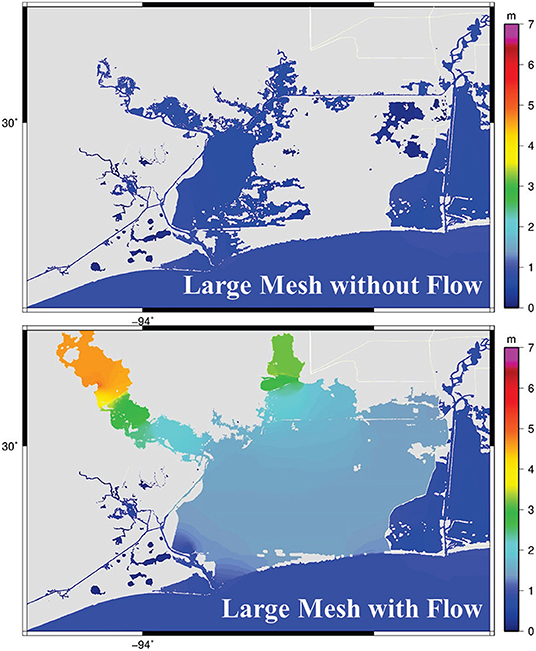
Figure 5. Maximum elevation in the computational elements over the period of simulation for the large ADCIRC mesh with and without riverine flow inputs.
In addition to having much larger areas of inundation, the simulation with riverine flow had much higher peak WSEs, which indicates that there is indeed a compound flooding effect. The riverine flow compounds with the incoming storm surge, resulting in higher WSE than with either riverine flow or surge considered separately. In order to analyze these results in more detail, the same three stations as in the previous section were used for comparisons. Additionally, one location near the downstream boundary of the HEC-RAS domain, one location in the middle of the Sabine Lake, as well as one location at the mouth of the Gulf of Mexico were used (see Figure 6).
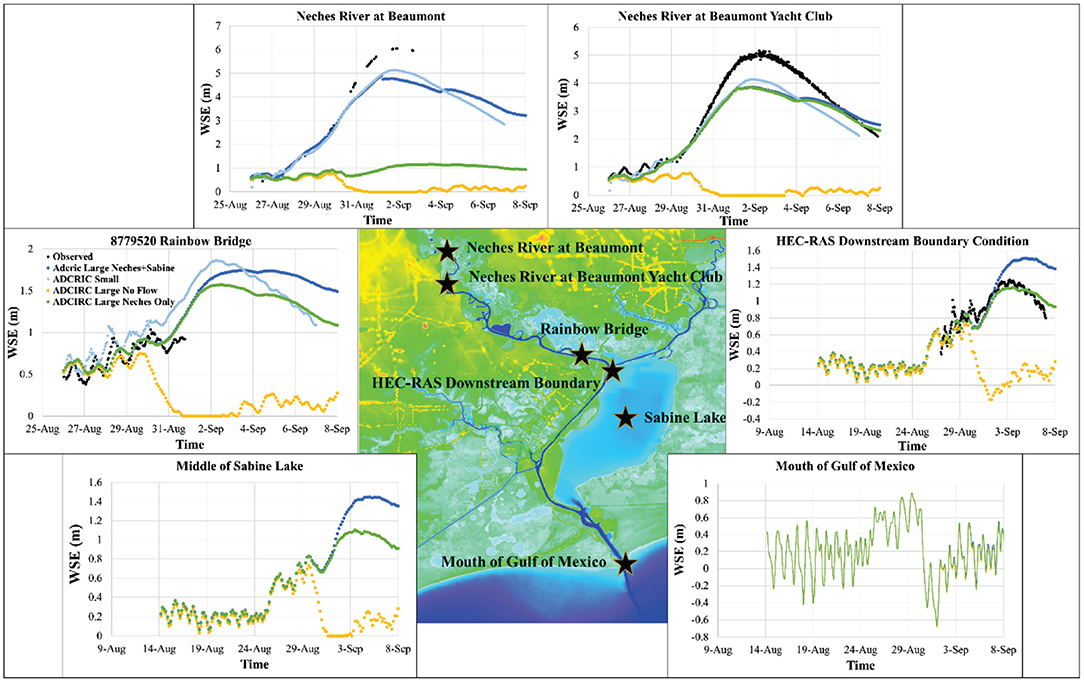
Figure 6. ADCIRC output for different scenarios at the location of all comparison stations shown in the center colored panel.
There are quite large differences in WSEs between the simulations that include and neglect the riverine discharges. Such a large difference indicates that flooding in an estuarine system is a function of both storm surge and riverine discharge; without including the riverine flow in the simulation, many of the computational elements did not even become inundated for the bulk of the simulation (Figure 5). Including riverine flow in the simulation results in a dramatic increase in accuracy. For instance, as shown in Table 1, for the large mesh (with the flow), the RMSE at Neches River at Beaumont was 0.62 and 0.84 m when compared to HEC-RAS and observed data, respectively. This RMSE is much smaller than the RMSEs of >4.00 m for the ADCIRC large mesh without flow. Similarly, the Neches River at Beaumont Yacht Club and Rainbow Bridge (Figure 6) show that running the ADCIRC simulation with riverine flow taken into account dramatically increases accuracy when compared to the real data and the validated HEC-RAS model.
The inclusion of riverine flow influences WSE further downstream, outside of where the small mesh ADCIRC and HEC-RAS domains end. Figure 6 shows the difference in WSEs due to including flow in the central part of Sabine Lake, where it was heavily flooded during Hurricane Harvey. The differences in WSEs were as large as 1.3 m. In this location, up to August 28th, the WSEs are relatively similar, indicating that the changes in the mild rise in WSE over this period are a result of tides and storm surge. However, after this time, the two WSE time-series diverge. This divergence agrees with the timing of the increasing flow input in the upstream. The results at the mouth of the Gulf revealed that the riverine discharge does not affect the WSEs beyond the estuarine system. As shown in Figure 6, the scenario with both Neches and Sabine River (with flow) resulted in a minor increase (0–5 cm) in the WSE at the mouth of the Gulf where the Sabine Lake discharges into the Gulf of Mexico. During an event such as Hurricane Harvey where the spatial extent of the rainfall-induced flows from the event was an extremely large area including many watersheds, not considering the riverine flows and their compound effect in determining WSEs could lead to significant underpredictions of inundation and flood risk. Thus, when evaluating storms where river discharge is large, it is critical to incorporate river flow in order to obtain accurate WSEs. This comes as no surprise especially when modeling a storm with such high riverine discharge as Hurricane Harvey. These results are also not limited to just this test case as ADCIRC has been shown to increase in accuracy when incorporating the effects of riverine discharge through boundary conditions (Bunya et al., 2010).
Interaction Among Watersheds
The previous sections demonstrate conclusively that adding riverine flow into the ADCIRC model can allow for much higher accuracy in modeling storms with compound flooding. In this section, the codependences of two watersheds are analyzed. In the previous simulations, when the ADCIRC large mesh with the riverine flow was used, the discharges from both the Neches and Sabine watersheds were included since they are in close proximity, and both feed into the Sabine Lake. Figure 7 shows the significance of incorporating both watershed discharges as opposed to just from the Neches. Including the Sabine River caused higher and more intense inundations in the system. In addition to areas located in the downstream of both Neches and Sabine River, adding the Sabine River discharge caused changes in the WSEs and flooding pattern of areas within the Neches River (Figure 6).
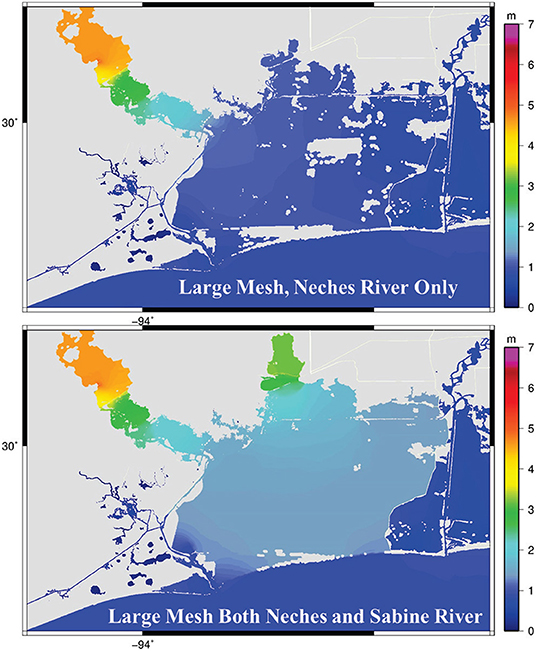
Figure 7. Maximum elevation in the computational elements over the period of simulation for the large ADCIRC mesh with only Neches River and both Neches and Sabine River flows. These plots are not representative of any singular point in time, but instead, the maximum elevation reached at each point in space over the course of the whole simulation.
Incorporating the two watersheds as opposed to just Neches had the highest effect on the WSE at the Neches River at Beaumont, followed by Rainbow Bridge and then Beaumont Yacht Club (see Figures 1, 6 for locations). Neches River at Beaumont showed the highest impact from the Sabine River, while it is the farthest from the confluence of Neches and Sabine Rivers. This high impact might be due to the fact that the presence of Sabine River discharge in the system caused some water to flow back into the Neches River which resulted in more inundation in the Neches River upstream. Without the addition of the Sabine watershed, the accuracy of the Neches River at Beaumont would be marginally better than not including any flow at all. It is also interesting that the Neches only simulation at Rainbow Bridge station remains quite similar to the simulation with both watersheds up until around September 2nd when the overflow from the Sabine watershed starts increasing WSE in the Neches. Such an increase in the WSEs far away from the watershed outlets emphasizes the importance of considering interactions among watersheds when modeling compound flooding.
In addition to the areas upstream of the confluence of the two rivers, including the discharges from Sabine River, could potentially affect the downstream water bodies and floodplains as well. As shown in Figure 6, right at the downstream boundary condition of HEC-RAS and small ADCIRC model (see Figure 1) the effect of extra flow is substantial. This finding is particularly important when ADCIRC is being used for real-time simulation or coupling with other hydrodynamic models (e.g., HEC-RAS). A coupled system that only focuses on a single watershed without considering the interactions among adjacent watersheds could result in inaccurate WSEs. The discharge from Sabine River also caused a 0.5 m increase in WSE in the Sabine lake (Figure 6) which caused more inundation in the adjacent lands (Figure 7). Similar to the previous section, the effect of adding more discharge on WSEs of the Gulf was minimal.
Conclusions
This research demonstrated ADCIRC's ability to model compounding effects from storm surge and riverine discharge via loose one-way coupling with gage data through internal time-dependent flux boundary conditions in a single watershed by comparing ADCIRC with a validated 2-D hydraulic model in HEC-RAS. As presented in this study, accounting for adjacent watersheds through the incorporation of internal time dependent flux boundary conditions in ADCIRC could have significant impact on the accuracy of the WSEs during a tropical cyclone. Furthermore, the results suggest that adjacent watersheds can significantly impact the WSEs (as high as 4 m observed) of their neighboring watersheds at times of high riverine discharge and should be considered when modeling compound flooding events that affect more than one watershed in the same geographic region. Some limitations in this study that can be improved upon in the future are that short range waves and pluvial flooding were neglected. A common way of addressing short range waves in ADCIRC has been coupling ADCIRC with a wave model such as WAVEWATCH III or the Simulating Waves Nearshore model (SWAN). The contribution to compound flooding by pluvial flooding in ADCIRC has not yet been addressed and is currently an open area of research. Further improvements can be made such as mesh refinement in the upstream locations in the ADCIRC mesh as well as parameter calibration in order to increase accuracy in the WSE when compared to gage data. Additionally, including more watersheds across the Gulf of Mexico, attempting to use this modeling framework to hindcast more historical storms other than Hurricane Harvey, as well as using this framework in a forecasting setting is a future goal.
Data Availability Statement
The raw data supporting the conclusions of this article will be made available by the authors, without undue reservation.
Author Contributions
ML and AK developed the idea and completed the majority of the modeling, analysis, and writings. CD helped with running the ADCIRC model as well as developing the research idea and overall project management in coordination with SM. HM, SM, and AP helped with the HEC-RAS model as well as data acquisition. HR helped with developing the methodology. CD, HR, SM, and AP helped with data analysis and review of writing. All authors contributed to the article and approved the submitted version.
Funding
This research was based upon work supported by, or in part by, the Department of Defense High Performance Computing Modernization Program (HPCMP) under User Productivity Enhancement, Technology Transfer, and Training (PETTT) contract # GS04T09DBC0017. Support was also provided from the National Science Foundation grant # 1934192 and the Hurricane Resilience Research Institute at the University of Houston. Additional support was provided by National Science Foundation grant #1854986.
Conflict of Interest
The authors declare that the research was conducted in the absence of any commercial or financial relationships that could be construed as a potential conflict of interest.
The handling editor is currently organizing a Research Topic with one of the authors CD.
Supplementary Material
The Supplementary Material for this article can be found online at: https://www.frontiersin.org/articles/10.3389/fclim.2020.609610/full#supplementary-material
References
Alarcon, V. J., Johnson, D., Mcanally, W. H., van der Zwaag, J., Irby, D., and Cartwright, J. (2014a). “Design and deployment of a dynamic-coupling tool for EFDC BT,” in Computational Science and Its Applications – ICCSA 2014, eds B. Murgante, S. Misra, A. M. A. C. Rocha, C. Torre, J. G. Rocha, M. I. Falcão, et al. (Cham: Springer International Publishing), 615–624.
Alarcon, V. J., Johnson, D., McAnally, W. H., van der Zwaag, J., Irby, D., and Cartwright, J. (2014b). Nested hydrodynamic modeling of a coastal river applying dynamic-coupling. Water Resour. Manag. 28, 3227–3240. doi: 10.1007/s11269-014-0671-6
Bakhtyar, R., Maitaria, K., Velissariou, P., Trimble, B., Flowers, T., Moghimi, S., et al (2020a). Characterizing Compound Coastal-Riverine Behavior along the U.S. East Coast using a Coupled Hydrologic-Hydrodynamic Model. Available online at: https://agu.confex.com/agu/osm20/meetingapp.cgi/Paper/646141 (accessed September 19, 2020).
Bakhtyar, R., Maitaria, K., Velissariou, P., Trimble, B., Mashriqui, H., Moghimi, S., et al. (2020b). A new 1D/2D coupled modeling approach for a riverine-estuarine system under storm events: application to Delaware River Basin. J. Geophys. Res. Ocean 125:e2019JC015822. doi: 10.1029/2019JC015822
Balbhadra, T., Ranjan, P., Ajay, K., Sajjad, A., and Ritu, G. (2020). Coupling HEC-RAS and HEC-HMS in precipitation runoff modelling and evaluating flood plain inundation map. World Environ. Water Resour. Congr. 2017, 240–251. doi: 10.1061/9780784480625.022
Bhaskaran, P. K., Nayak, S., Bonthu, S. R., Murty, P. L. N., and Sen, D. (2013). Performance and validation of a coupled parallel ADCIRC-SWAN model for THANE cyclone in the Bay of Bengal. Environ. Fluid Mech. 13, 601–623. doi: 10.1007/s10652-013-9284-5
Bilskie, M. V., and Hagen, S. C. (2018). Defining flood zone transitions in low-gradient coastal regions. Geophys. Res. Lett. 45, 2761–2770. doi: 10.1002/2018GL077524
Bilskie, M. V., Hagen, S. C., Alizad, K., Medeiros, S. C., Passeri, D. L., Needham, H. F., et al. (2016). Dynamic simulation and numerical analysis of hurricane storm surge under sea level rise with geomorphologic changes along the northern Gulf of Mexico. Earth's Futur. 4, 177–193. doi: 10.1002/2015EF000347
Blain, C. A. (1998). Coastal Tide Prediction Using the ADCIRC-2DDI Hydrodynamic Finite Element Method: Model Validation and Sensitivity Analyses in the Southern North Sea/English Channel. Available online at: https://apps.dtic.mil/dtic/tr/fulltext/u2/a358752.pdf
Brunner, G. (2002). Hec-ras (River Analysis System). North American Water and Environment Congress. Available online at: https://cedb.asce.org/CEDBsearch/record.jsp?dockey=0100264 (accessed August 19, 2020).
Brunner, G. (2016). HEC-RAS River Analysis System Hydraulic Reference Manual. Available online at: www.hec.usace.army.mil (accessed August 13, 2020).
Bunya, S., Dietrich, J. C., Westerink, J. J., Ebersole, B. A., Smith, J. M., Atkinson, J. H., et al. (2010). A high-resolution coupled riverine flow, tide, wind, wind wave, and storm surge model for Southern Louisiana and Mississippi. Part I: model development and validation. Mon. Weather Rev. 138, 345–377. doi: 10.1175/2009MWR2906.1
Couasnon, A., Eilander, D., Muis, S., Veldkamp, T. I. E., Haigh, I. D., Wahl, T., et al. (2020). Measuring compound flood potential from river discharge and storm surge extremes at the global scale. Hazards Earth Syst. Sci. 20, 489–504. doi: 10.5194/nhess-20-489-2020
Demaria, M., and Kaplan, J. (1994). Sea surface temperature and the maximum intensity of atlantic tropical cyclones. J. Clim. 7, 1324–1334. doi: 10.1175/1520-0442(1994)007<1324:SSTATM>2.0.CO;2
Dietrich, J. C., Tanaka, S., Westerink, J. J., Dawson, C. N., Luettich, R. A., Zijlema, M., et al. (2012). Performance of the unstructured-mesh, SWAN+ ADCIRC model in computing hurricane waves and surge. J. Sci. Comput. 52, 468–497. doi: 10.1007/s10915-011-9555-6
Dietrich, J. C., Westerink, J. J., Kennedy, A. B., Smith, J. M., Jensen, R. E., Zijlema, M., et al. (2011a). Hurricane gustav (2008) waves and storm surge: hindcast, synoptic analysis, and validation in southern Louisiana. Mon. Weather Rev. 139, 2488–2522. doi: 10.1175/2011MWR3611.1
Dietrich, J. C., Zijlema, M., Westerink, J. J., Holthuijsen, L. H., Dawson, C., Luettich, R. A., et al. (2011b). Modeling hurricane waves and storm surge using integrally-coupled, scalable computations. Coast. Eng. 58, 45–65. doi: 10.1016/j.coastaleng.2010.08.001
Downer, C. W., Asce, M., and Ogden, F. L. (2004). GSSHA: model to simulate diverse stream flow producing processes. Artic. J. Hydrol. Eng. 9, 161–174. doi: 10.1061/(ASCE)1084-0699(2004)9:3(161)
Egbert, G. D., and Erofeeva, S. Y. (2002). Efficient inverse modeling of barotropic ocean tides. J. Atmos. Ocean. Technol. 19, 183–204. doi: 10.1175/1520-0426(2002)019<0183:EIMOBO>2.0.CO;2
Emanuel, K. (2005). Increasing destructiveness of tropical cyclones over the past 30 years. Nature 436, 686–688. doi: 10.1038/nature03906
Emanuel, K. A. (1987). The dependence of hurricane intensity on climate. Nature 326, 483–485. doi: 10.1038/326483a0
Fleming, J. G., Fulcher, C. W., Luettich, R. A., Estrade, B. D., Allen, G. D., and Winer, H. S. (2008). “A real time storm surge forecasting system using ADCIRC,” in Estuarine and Coastal Modeling, ed M. L. Spaulding (Reston, VA: American Society of Civil Engineers), 893–912. Available online at: https://ascelibrary.org/doi/book/10.1061/9780784409909
Gori, A., Lin, N., and Smith, J. (2020). Assessing compound flooding from landfalling tropical cyclones on the North Carolina Coast. Water Resour. Res. 56. doi: 10.1029/2019WR026788
Hagen, S. (2011). Hydrodynamics of the 2004 Florida Hurricanes. J. Coast. Res. 28:1121. doi: 10.2112/JCOASTRES-D-10-00170.1
Hamrick, J. M. (1992). A Three-Dimensional Environmental Fluid Dynamics Computer Code: Theoretical and Computational Aspects. Special report in applied marine science and ocean engineering. Virginia Institute of Marine Science, William & Mary. Available online at: https://doi.org/10.21220/V5TT6C
Hicks, F. E., and Peacock, T. (2005). Suitability of HEC-RAS for flood forecasting. Can. Water Resour. J. 30, 159–174. doi: 10.4296/cwrj3002159
Hinkel, J., Lincke, D., Vafeidis, A. T., Perrette, M., Nicholls, R. J., Tol, R. S. J., et al. (2014). Coastal flood damage and adaptation costs under 21st century sea-level rise. Proc. Natl. Acad. Sci. U.S.A. 111, 3292–3297. doi: 10.1073/pnas.1222469111
Homer, C. G., Dewitz, J., Yang, L., Jin, S., Danielson, P., Xian, G. Z., et al. (2015). Completion of the 2011 National Land Cover Database for the conterminous United States – representing a decade of land cover change information. Photogramm. Eng. Remote Sens. 81, 345–354. doi: 10.14358/PERS.81.5.345
Hope, M. E., Westerink, J. J., Kennedy, A. B., Kerr, P. C., Dietrich, J. C., Dawson, C., et al. (2013). Hindcast and validation of Hurricane Ike (2008) waves, forerunner, and storm surge. J. Geophys. Res. Ocean. 118, 4424–4460. doi: 10.1002/jgrc.20314
Jelesnianski, C. P., Chen, J., and Shaffer, W. A. (1992). SLOSH: Sea, Lake, and Overland Surges from Hurricanes. NOAA Technical Report NWS 48, National Oceanic and Atmospheric Administration, U. S. Department of Commerce, 71. Scanning courtesy of NOAA's NOS's Coastal Service's Center.
Jongman, B., Ward, P. J., and Aerts, J. C. J. H. (2012). Global exposure to river and coastal flooding: long term trends and changes. Glob. Environ. Chang. 22, 823–835. doi: 10.1016/j.gloenvcha.2012.07.004
Kiaghadi, A., Rifai, H. S., Kiaghadi, A., and Rifai, H. S. (2018). The Effect of Local Runoff from Concurrent Rainfall Events with Storm Surge on Hydrodynamics and Land Inundation. AGUFM 2018, NH23A-01. Available online at: https://ui.adsabs.harvard.edu/abs/2018AGUFMNH23A.01K/abstract (accessed August 21, 2020).
Kumbier, K., Carvalho, R. C., Vafeidis, A. T., Woodroffe, C. D., and Carvalho, R. C. (2018). Investigating compound flooding in an estuary using hydrodynamic modelling: a case study from the Shoalhaven River, Australia. Hazards Earth Syst. Sci. 18, 463–477. doi: 10.5194/nhess-18-463-2018
Levitus, S., Antonov, J. I., Boyer, T. P., and Stephens, C. (2000). Warming of the world ocean. Science 287, 2225–2229. doi: 10.1126/science.287.5461.2225
Luettich, R. A., and Westerink, J. J. (2004). Formulation and Numerical Implementation of the 2D/3D ADCIRC Finite Element Model Version 44.XX, Morehead City, NC. Available online at: https://www.worldcat.org/title/formulation-and-numerical-implementation-of-the-2d3d-adcirc-finite-element-model-version-44-xx/oclc/57466266
Melby, J. A., Barrett, A. L., Massey, T. C., Nadal-Caraballo, N. C., Misra, S., and Gonzalez, V. (2019). Sabine to Galveston Pre-Construction, Engineering and Design. PED: Coastal Storm Surge and Wave Hazard Assessment. Port Arthur - Contract 1. ERDC/CHL Technical Report.
Moftakhari, H., Schubert, J. E., AghaKouchak, A., Matthew, R. A., and Sanders, B. F. (2019). Linking statistical and hydrodynamic modeling for compound flood hazard assessment in tidal channels and estuaries. Adv. Water Resour. 128, 28–38. doi: 10.1016/j.advwatres.2019.04.009
Moftakhari, H. R., Salvadori, G., AghaKouchak, A., Sanders, B. F., and Matthew, R. A. (2017). Compounding effects of sea level rise and fluvial flooding. Proc. Natl. Acad. Sci. U.S.A. 114, 9785–9790. doi: 10.1073/pnas.1620325114
Mosser, H., Ghanuni, H., and DiGesu, J. (2019). Sabine Pass to Galveston Bay Orange County, Port Arthur & Freeport Hurricane Flood Protection System Preconstruction, Engineering and Design: Lower Neches Riverine Flooding Analyses. U. S. Army Corps of Engineers, Fort Worth District, Technical Report.
Muñoz, D. F., Moftakhari, H., and Moradkhani, H. (2020). Compound effects of flood drivers and wetland elevation correction on coastal flood hazard assessment. Water Resour. Res. 56. doi: 10.1029/2020WR027544
Pringle, W. (2018). (PDF) OceanMesh2D: User Guide - Precise Distance-Based Two-Dimensional Automated Mesh Generation Toolbox Intended for Coastal Ocean/Shallow Water. Available online at: https://www.researchgate.net/publication/326327226_OceanMesh2D_User_guide_-_Precise_distance-based_two-dimensional_automated_mesh_generation_toolbox_intended_for_coastal_oceanshallow_water (accessed August 25, 2020).
Pringle, W. J., Wirasaet, D., Roberts, K. J., and Westerink, J. (2020). Global storm tide modeling with ADCIRC v55: unstructured mesh design and performance. Geosci. Model Dev. Discuss. 1, 1–40. doi: 10.5194/gmd-2020-123
Quirogaa, V. M., Kurea, S., Udoa, K., and Manoa, A. (2016). Application of 2D numerical simulation for the analysis of the February 2014 Bolivian Amazonia flood: application of the new HEC-RAS version 5. Ribagua 3, 25–33. doi: 10.1016/j.riba.2015.12.001
Riverside Technology Inc, and Aecom. (2015). Mesh Development, Tidal Validation, and Hindcast Skill Assessment of an Adcirc Model for the Hurricane Storm Surge Operational Forecast System on the Us Gulf-Atlantic Coast. doi: 10.17615/4z19-y130
Saleh, F., Ramaswamy, V., Wang, Y., Georgas, N., Blumberg, A., and Pullen, J. (2017). A multi-scale ensemble-based framework for forecasting compound coastal-riverine flooding: the Hackensack-Passaic watershed and Newark Bay. Adv. Water Resour. 110, 371–386. doi: 10.1016/j.advwatres.2017.10.026
Santiago-Collazo, F. L., Bilskie, M. V., and Hagen, S. C. (2019). A comprehensive review of compound inundation models in low-gradient coastal watersheds. Environ. Model. Softw. 119, 166–181. doi: 10.1016/j.envsoft.2019.06.002
Veeramony, J., Condon, A., Linzell, R., and Watson, K. (2016). Validation of Delft3D as a Coastal Surge and Inundation Prediction System. Available online at: https://apps.dtic.mil/sti/citations/ADA631769 (accessed August 19, 2020).
Ye, F., Zhang, Y. J., Yu, H., Sun, W., Moghimi, S., Myers, E., et al. (2020). Simulating storm surge and compound flooding events with a creek-to-ocean model: importance of baroclinic effects. Ocean Model. 145:101526. doi: 10.1016/j.ocemod.2019.101526
Yeh, G.-T., Huang, G., Zhang, F., Cheng, H.-P., and Lin, H.-C. (2005). WASH123D: A Numerical Model of Flow, Thermal Transport, and Salinity, Sediment, and Water Quality Transport in WAterSHed Systems of 1-D Stream-River Network, 2-D Overland Regime, and 3-D Subsurface Media Acknowledgments and Disclaimers. Available online at: https://www.researchgate.net/profile/Gour-Tsyh_Yeh/publication/236975269_WASH123D_All/links/0deec51a94e0aebb5a000000/WASH123D-All.pdf (accessed August 21, 2020).
Zhang, Y., and Baptista, A. M. (2008). SELFE: A semi-implicit Eulerian-Lagrangian finite-element model for cross-scale ocean circulation. Ocean Model. 21, 71–96. doi: 10.1016/j.ocemod.2007.11.005
Zhang, Y. J., Ye, F., Stanev, E. V., and Grashorn, S. (2016). Seamless cross-scale modeling with SCHISM. Ocean Model. 102, 64–81. doi: 10.1016/j.ocemod.2016.05.002
Zhang Y. J. Ye F. Yu H. Sun W. Moghimi S. Myers and, E. . (2019). Simulating compound flooding events in a hurricane. Ocean Dyn. 70, 621–640. doi: 10.1007/s10236-020-01351-x
Keywords: ADCIRC, HEC-RAS, numerical modeling, hurricanes, inundation
Citation: Loveland M, Kiaghadi A, Dawson CN, Rifai HS, Misra S, Mosser H and Parola A (2021) Developing a Modeling Framework to Simulate Compound Flooding: When Storm Surge Interacts With Riverine Flow. Front. Clim. 2:609610. doi: 10.3389/fclim.2020.609610
Received: 23 September 2020; Accepted: 21 December 2020;
Published: 04 February 2021.
Edited by:
Navid Tahvildari, Old Dominion University, United StatesReviewed by:
Hamed Moftakhari, University of Alabama, United StatesAntonia Sebastian, University of North Carolina at Chapel Hill, United States
Copyright © 2021 Loveland, Kiaghadi, Dawson, Rifai, Misra, Mosser and Parola. This is an open-access article distributed under the terms of the Creative Commons Attribution License (CC BY). The use, distribution or reproduction in other forums is permitted, provided the original author(s) and the copyright owner(s) are credited and that the original publication in this journal is cited, in accordance with accepted academic practice. No use, distribution or reproduction is permitted which does not comply with these terms.
*Correspondence: Amin Kiaghadi, YW1pbi5raWFnaGFkaTIwMTNAZ21haWwuY29t