 Stefano Caserini1*
 Dario Pagano1
 Francesco Campo1
 Antonella Abbà2
 Serena De Marco1
 Davide Righi1
 Phil Renforth3
 Mario Grosso1
- 1Dipartimento di Ingegneria Civile ed Ambientale, Politecnico di Milano, Milan, Italy
- 2Dipartimento di Scienze e Tecnologie Aerospaziali, Politecnico di Milano, Milan, Italy
- 3Research Centre for Carbon Solutions, School of Engineering and Physical Sciences, Heriot-Watt University, Edinburgh, United Kingdom
Proposals to increase ocean alkalinity may make an important contribution to meeting climate change net emission targets, while also helping to ameliorate the effects of ocean acidification. However, the practical feasibility of spreading large amounts of alkaline materials in the seawater is poorly understood. In this study, the potential of discharging calcium hydroxide (slaked lime, SL) using existing maritime transport is evaluated, at the global scale and for the Mediterranean Sea. The potential discharge of SL from existing vessels depends on many factors, mainly their number and load capacity, the distance traveled along the route, the frequency of reloading, and the discharge rate. The latter may be constrained by the localized pH increase in the wake of the ship, which could be detrimental for marine ecosystems. Based on maritime traffic data from the International Maritime Organization for bulk carriers and container ships, and assuming low discharge rates and 15% of the deadweight capacity dedicated for SL transport, the maximum SL potential discharge from all active vessels worldwide is estimated to be between 1.7 and 4.0 Gt/year. For the Mediterranean Sea, based on detailed maritime traffic data, a potential discharge of about 186 Mt/year is estimated. The discharge using a fleet of 1,000 new dedicated ships has also been discussed, with a potential distribution of 1.3 Gt/year. Using average literature values of CO2 removal per unit of SL added to the sea, the global potential of CO2 removal from SL discharge by existing or new ships is estimated at several Gt/year, depending on the discharge rate. Since the potential impacts of SL discharge on the marine environment in the ships' wake limits the rate at which SL can be applied, an overview of methodologies for the assessment of SL concentration in the wake of the ships is presented. A first assessment performed with a three-dimensional non-reactive and a one-dimensional reactive fluid dynamic model simulating the shrinking of particle radii, shows that low discharge rates of a SL slurry lead to pH variations of about 1 unit for a duration of just a few minutes.
Introduction
Purposefully increasing the alkalinity of the ocean is gaining mounting attention for the potential to mitigate ocean acidification, a major threat for some marine ecosystems, while simultaneously removing atmospheric CO2. After Kheshgi (1995) first proposed to add alkaline materials to the ocean surface for removing atmospheric carbon and storing it in the seawater, some authors (Keller et al., 2014; Renforth and Henderson, 2017; Lenton et al., 2018; Rau et al., 2018) indicated a large potential for carbon removal by “ocean alkalinity enhancement,” via spreading Ca(OH)2 (commonly named slaked lime, SL) or NaOH in seawater, as well as for mitigating ocean acidification and enhancing the net calcification of reef (Albright et al., 2016).
However, technological challenges and potential side effects must be assessed, such as the impact on the ecological and biogeochemical functioning of the ocean. While chemical reactions of ocean alkalinity enhancement are theoretically known, and some processes to produce SL without CO2 emissions into the atmosphere have been proposed (Renforth and Henderson, 2017; Caserini et al., 2019), less is known regarding the practical aspects of spreading large amounts of alkaline materials in the seawater for ocean alkalinity enhancement.
Many studies (i.e., IPCC, 2018; Nemet et al., 2018) shows that achieving the Paris Agreement goal of limiting warming to well below 2°C or even 1.5°C may require 10-20 gigatonnes (Gt) of CO2 removed from the atmosphere per year by 2100, in addition to a rapid global economy-wide reduction in greenhouse gas emissions through “conventional” mitigation. The magnitude of the task and the rates required to achieve net carbon removal suggests that a portfolio of options should be implemented, and in the race to remove this tremendous amount of CO2 research should be devoted not only to current frontrunners, i.e., bioenergy and carbon capture and storage, but also to approaches less formally evaluated in terms of cost, effectiveness, resource availability, and acceptability (Rau, 2019).
Previous research (Keller et al., 2014; Lenton et al., 2018) have simulated the spreading of 10 Gt/y (~0.25 Pmol/y of alkalinity) in the period 2020–2100; this amount represents the total transport capacity of all large cargo ships and tankers assessed by Köhler et al. (2013), considering 0.33 Gt as the total deadweight tonnage (dwt) and an average of 32 ports called per ship per year.
Renforth et al. (2013) assessed the need of 101 dedicated 300,000 dwt bulk carriers to discharge 1 Gt/y of SL, assuming a discharge time of ~3.5 days (at a discharge rate of 1 ton per second), within a discharge cycle length (including the loading and the time for reaching the open ocean and return) of ~11 days. Harvey (2008) considered the addition of calcium carbonate to upwelling regions using smaller vessels, and suggested 750–3000 ships would be required to deliver 4 Gt of CaCO3 per year. While the use of dedicated ships to spread SL offers greater control of the application area and distribution rates, the use of existing shipping capacity and routes would access a larger area and offer pathways to more rapid scalability.
In the present study, we have undertaken a detailed analysis of the potential of SL discharge for the Mediterranean Sea, a closed basin where maritime transport routes are denser than the global average, and precise data on navigation are available. Alternative scenarios that consider new dedicated ships, purchased or built for the purpose, and the use of ballast water tanks to carry and discharge the SL are also discussed. Conservative values of discharge rates of SL (≤25 kg/s) have been considered, in order to minimize the risk of impacting the marine environment in the ships' wake.
The assessment of the localized impact produced by SL at the discharge point, due to a temporary increase of pH and alkalinity, is necessary to evaluate the environmental side effects of this practice. A pH increase (leading to a decrease in aqueous CO2 and an increase in bicarbonate ion concentrations), as well as the co-dissolution of other elements, could have a detrimental impact on marine ecosystems (Bach et al., 2019). Pedersen and Hansen (2003) and Locke et al. (2009) demonstrate the low probability, for different kinds of organisms, to survive when exposed to high pH level, over several days or weeks. Cripps et al. (2013) point out to acid-base balance alterations in Carcinus maenas once again in response to acute exposure to Ca(OH)2 concentrations. Bach et al. (2019), recognize how a pH increase, whilst leading to benefits such as the decrease in aqueous CO2, the increase in bicarbonate ion concentrations, the co-dissolution of other elements, could, conversely, shift the current ecological equilibrium, with detrimental consequences for some organisms rather than others depending on the alkaline mineral used. Hence, a better understanding of the ecological implications of ocean liming requires additional dedicated experimental studies.
The local impact where SL is applied is related to the mineral composition (i.e., % of Mg) and to the technology of discharge chosen (Renforth and Henderson, 2017; Bach et al., 2019). The discharge of CaCO3 in specific areas in the deep ocean (below 200 m) characterized by lower biodiversity (Costello and Chaudhary, 2017), favorable mixing conditions and upwelling currents, has been studied by Harvey (2008), and has the disadvantage that can only be applied in isolated upwelling regions of the world's ocean (Garcı̀a-Reyes et al., 2015) in order to impact climate. SL dispersion in the wake of a ship may be a more efficient technique since it allows it to dissolve quickly within the rapidly mixed wake while the ship is cruising. The dispersion is strongly dependent on the rate of dissolution within the mixed wake of the ship, influenced by vessel's waterline length, speed, and the discharge rate; accurate modeling and ad hoc experiments are needed to establish a relationship between the amount of SL discharged and the impact produced, i.e., to define application limits useful to avoid or minimize the environmental impact. An overview of modeling approaches for the assessment of SL concentration in the wake of the ships are presented here, and an initial assessment is performed with two modeling approaches: the first was a three-dimensional non-reactive computer fluid dynamics (CFD) model, where turbulent diffusion conditions have been applied to understand particles and concentrations behavior. Then, a one-dimensional reactive model was applied to provide an initial simplified method of incorporating chemical parameters into previous CFD modeling results.
Materials and Methods
Potential Discharge at the Global Scale
Existing maritime vessels could be used for transporting SL and discharging it along the route. The equipment for SL loading and discharge could be easily designed, and a share of the capacity and loading space could be dedicated to the transport of pulverized SL; the latter could be discharged in the form of a slurry, also called “milk of lime,” which can be prepared on board by mixing pulverized Ca(OH)2 with water. The necessity of using milk of lime and not just limewater (the aqueous solution of calcium hydroxide) is due to the poor solubility of calcium hydroxide (1.73 kg/m3 at 25°C), that would require a very relevant amount of seawater to dilute SL. Minimizing the volumes of water allows to speed up the discharge and to decrease the energy consumption for water management; the use of water from the engine cooling system could reduce the need of fresh seawater for mixing, reducing the interactions with seawater environment and saving energy for the pumping. The design of the solids handling system, and the optimum water content, is beyond the scope of this work.
The potential of SL discharge by existing maritime traffic depends on several factors, such as:
• fleet size and capacity;
• length of navigation at sea;
• fraction of the existing capacity that can be dedicated to SL transport;
• SL supply chain.
Existing Maritime Fleet Size and Capacity
Data regarding the number and use of the different types of ships, subdivided by type and size classes, are reported by the Greenhouse Gas Studies of the International Maritime Organization (IMO–International Maritime Organization, 2014), which refers to the year 2012, shown in Supplementary Table 1. Data on the number of vessels relate to both the total registered and the active ships circulating as detected by the AIS (Automatic Identification System); the latter is used to estimate the average sailing days, of interest for the discharge potential. The total equivalent hours of navigation per year could be calculated by multiplying the number of active ships by the number of average equivalent days at sea.
Table 1 shows the summary values for different categories of ships. The average values are calculated by weighting the different size classes based on the number of annual sailing days.
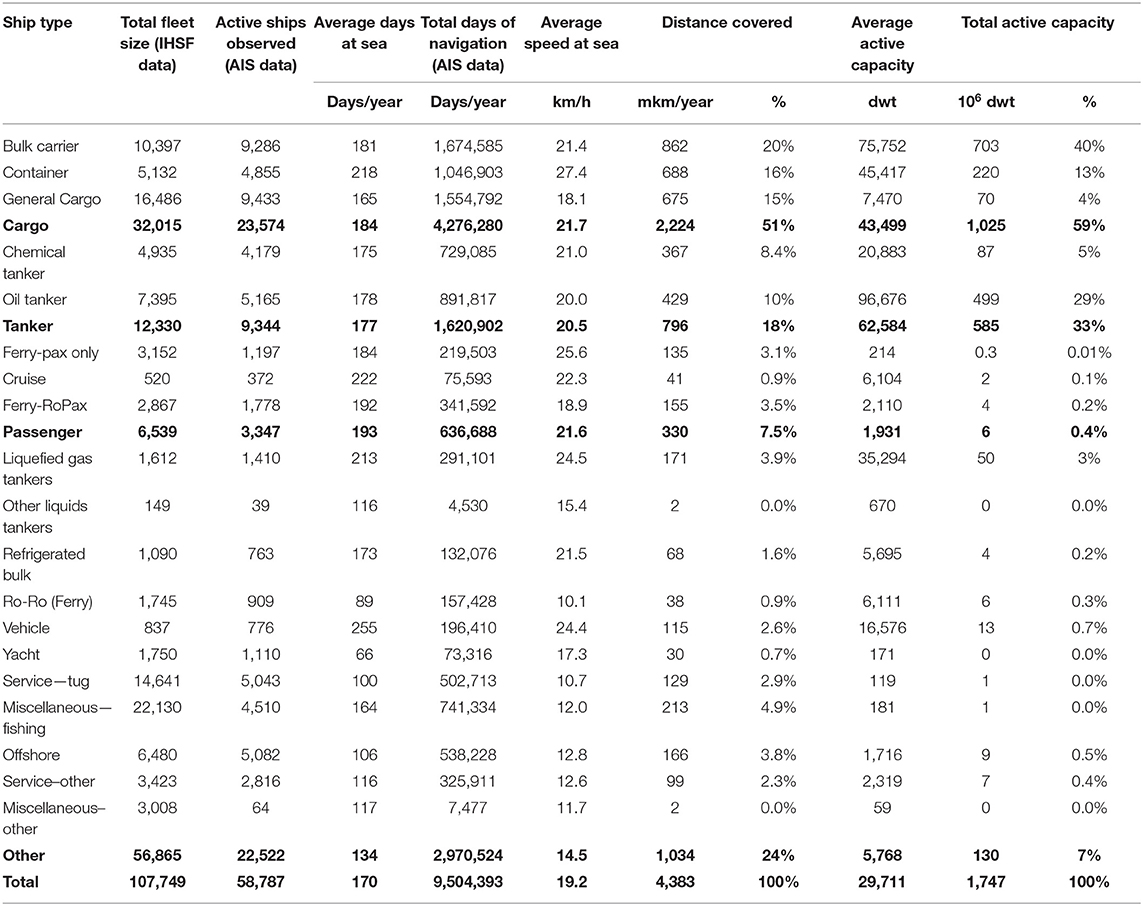
Table 1. Main characteristics of the existing maritime fleet (Data source: IMO–International Maritime Organization, 2014).
Figure 1 shows that 92% of the total active capacity, in terms of deadweight tonnage (the measure of how much weight a ship can carry), is related to two ship categories, cargo (bulk carrier, container, general cargo) and tanker (chemical tanker, oil tanker), although they represent only about 40% in terms of vessel number. Bulk carriers and container ships, directly suitable for SL discharge because of their structure and for logistic reasons (Panarello, 2020), have been considered for the assessment of SL discharge worldwide. They represent only 17% of the total commercial global fleet in terms of number, but 53% in terms of total active tonnage (Table 1).
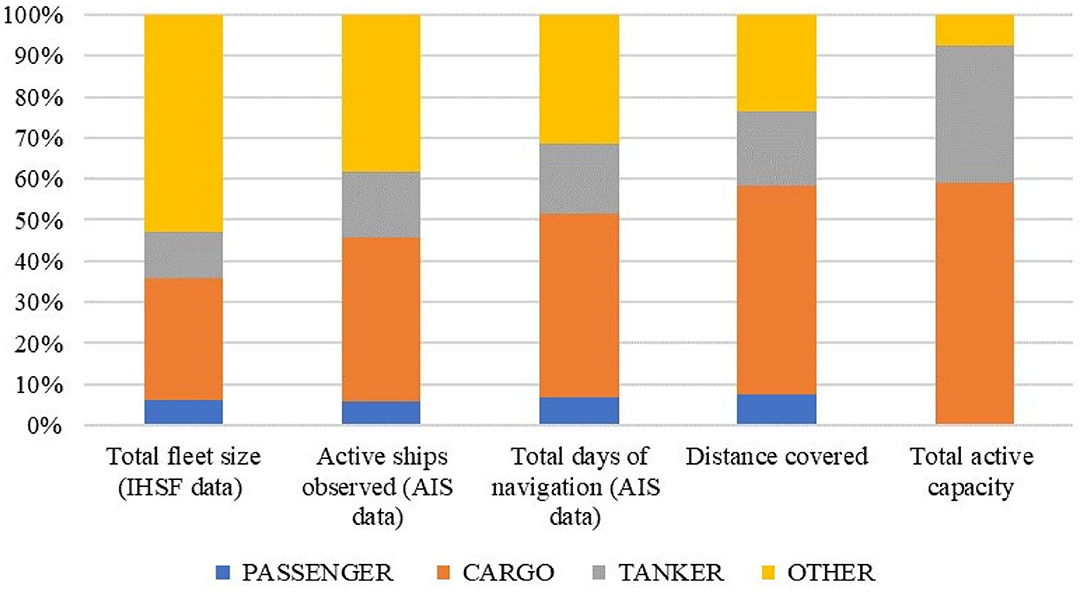
Figure 1. Main characteristics of existing passenger, cargo and thanker ships (Data source: IMO–International Maritime Organization, 2014).
Length of Navigation at Sea
Longer navigation at sea allows to either maximize or minimize the discharge rate of a fixed amount of SL. Container ships and bulk carriers have relevant average days of navigation (218 and 181 respectively), as well as about 70% of the total distance covered by vessels worldwide. A significant fraction of the registered fleet is not used, albeit this fraction is lower for bulk carriers and container ships. Although detailed data on the average distance traveled per typical sea-leg are not available, the average distance covered by commodities (6,278 km for dry bulk carriers, 8,938 km for Container ships, see Supplementary Table 2) was calculated using the ratio between the world seaborne trade in cargo in ton-miles and the total global trade (UNCTAD–United Nations Conference on Trade Development, 2018, 2019a).
Existing Ships Tonnage Dedicated to the Transport of Slaked Lime
The transportation of SL would obviously compete with the transportation of goods, and the convenience of SL transport could be increased by revenue that can be obtained from SL spreading (i.e., due to carbon credits for CO2 removal generated). However, it must be considered that, for logistical reasons, ships dedicated to the transport of goods from the place of production to the place of consumption, are often sailing not fully loaded, in particular in the return trip (Narula, 2019). The space used for slaked lime storage and for all the equipment for making the slaked lime will be permanently not available for transporting goods, but will allow the discharge also during the return trip.
According to information gathered from a ship designer (Panarello, 2020), it may be assumed that some 10–20% of the net cargo capacity of the container ships could be used for carrying slaked lime, since in many routes containers ships can store SL in the hold. Although adding weigh on board would reduce the ship performances, and requires space permanently dedicated for SL storage in the hold, as well as pipes and pumps is subtracted for other uses, this option would not impair significantly the use of the ship and the intended operations. In this scenario, it would not be necessary to carry out extensive modifications to the ships as it would be just a matter of arranging dedicated tanks and suitable pumping and conveying systems, while much greater efforts would be required to install dedicated SL loading facilities at calling ports.
Bulk carriers could also be used for carrying SL during sea passages in ballast, i.e., trip with no cargo on board to get a ship in position for the next loading port or docking (see Use of Ballast Water Tanks of Existing Ships). SL should be more conveniently loaded in the ship as a powder and then mixed with water on board, so to produce a slurry, called “milk of lime,” which is discharged in the sea. In order to limit the amount of water for SL dilution, it is assumed to use 2% of water dilution compared to saturation, equivalent to a SL concentration of 86.5 g/l (=1.73/0.02) or 11.6 liter per kilogram of SL discharged, which is typical for slurry management systems.
Slaked Lime Supply Chain
The possibility to transport the quantities of SL required does not only depend on the tonnage but also on the frequency of reload. If ships are loaded with SL only at the departure and arrival ports, the ships will discharge the load during the whole trip, thus the discharge rate will depend on the tonnage of the vessels and on the sea-leg length. The discharge potential increases if case reloading of SL is assumed during intermediate stops. Bulk carriers and container ships usually make several stops during their trips, when SL could be refilled during the standard loading and unloading operations in the ports. The analysis of several bulk carriers' routes via different platforms (Marinetraffic, 2019; Vesselfinder, 2019) shows that bulk carriers usually make one intermediate stop. For container ships, an average of four intermediate stops has been assessed by analyzing the main routes identified by UNCTAD–United Nations Conference on Trade Development (2019a), (Transpacific, Intra-regional, Europe-Asia, East-West, South-South, Europe-North America), and the data on routes lengths available in Marinetraffic (2019) considering the ports along the route (see Supplementary Table 3 for details). Logistic constraints might limit the possibility of loading SL in each stop, for instance additional time required for loading or the lime manufacturing infrastructure.
Potential Discharge at the Local Scale—Mediterranean Sea
A more detailed assessment of the potential SL discharge is possible at the local scale, where maritime traffic data are available. Here a case study of the Mediterranean Sea is considered, where monthly data of traffic density in the year 2017 are available from the EMODnet-Human Activities Project (EMODnet, 2019a), as monthly hours of permanence in the cells of a 1 km x 1 km grid for the whole Mediterranean Sea (EMODnet, 2019b). Two vessel categories (cargo and tanker), have been considered. According to IMO–International Maritime Organization (2014) they represent about 56% of all commercial vessels circulating in the world and 92% in terms of active tonnage. Other categories have limited navigation hours or operate near to the coast, thus they are less suitable for spreading SL.
EMODnet Data
EMODnet vessel traffic density data consider the hours when ships are at berth in the proximity of ports, which are clearly not of interest for the purpose of spreading SL. As an example, Supplementary Figure 1 shows the detail of the original cargo and tanker traffic around Malta.
In order to exclude these data, the cumulative distribution of monthly hours of navigation for each cell and for each vessel category has been assessed; the maximum number of monthly hours in the cells has been limited to a threshold value of 10, thus assuming a limit value of 10 h/km2/month for vessels density. The percentile of the distribution which corresponds to the threshold value 10 is quite similar for the two categories of vessels considered (99.3rd for the category Cargo, 99.7th for the category Tanker). The value chosen for the threshold, 10 h/month, is very close to the inflection point of the curves that represent the cumulative distribution of density values for the two categories of vessels (see Supplementary Figure 2). By means of visual comparison between the original traffic density maps and the maps after the application of the threshold, it has been verified that this choice of limitation to 10 h/month of the permanence of the ships in the cells, clearly identified as berth areas, did not substantially affect the cells in the routes of ships for the two categories of vessels.
Although the number of cells applicable is very low (<0.7% of the total cells of the grid) the application of the threshold leads to a drastic reduction of the total hours of navigation, respectively 51 and 53% for cargo and tanker ships. Monthly hours of navigation in the Mediterranean Sea before and after the application of the threshold are available in Supplementary Table 4.
Further processing has also been carried out to eliminate the cells of the EMODnet grid whose centroid is <5 km from the coast. The further reduction in the total hours of navigation, is−12.6 % for Cargo and−13.6% for Tanker. The total annual hours of navigation are shown in Supplementary Table 5.
The traffic density of cargo effectively exploitable for SL discharge is shown in Figure 2.
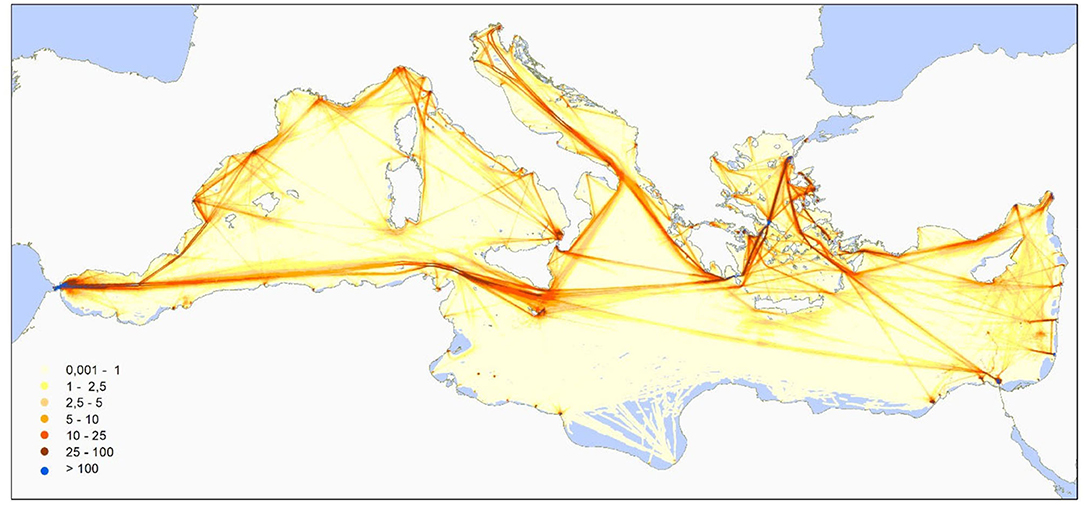
Figure 2. Maritime traffic density (hours/year) for cargo exploitable for slaked lime discharge.
Comparison of Vessel Traffic in the Mediterranean Sea and Worldwide
A comparison between the annual hours of navigation in the Mediterranean Sea and the hours of navigation worldwide could be done considering for the IMO data reported in Table 1; it assesses the total equivalent navigation hours/year as the product of the number of vessels for the number of average equivalent days at sea (calculated by IMO considering the actual engine running hours and assuming 24 h per day). Results in Table 2 show that the vessel traffic in the Mediterranean Sea accounts for 4.9% (cargo) and 5.8% (tanker) of the global traffic. This highlights that traffic density in the Mediterranean Sea is greater than the global average, since the surface of the Mediterranean Sea represents only 0.7% of the global ocean surface (2.51 Mkm2 compared to 361 Mkm2).
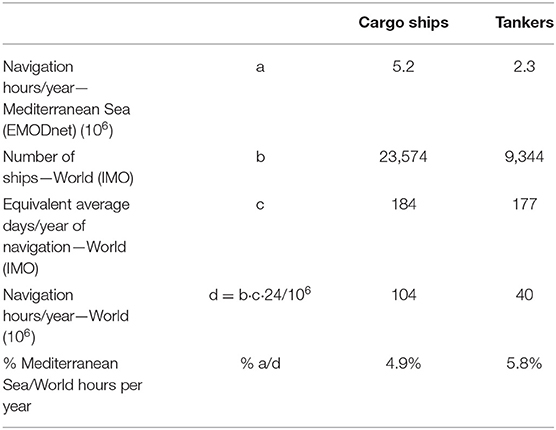
Table 2. Hours of navigation in the Mediterranean Sea and worldwide.
EDGAR Data
The Emission Database for Global Atmospheric Research (EDGAR) is a product of the Joint Research Center (JRC) and the PBL Netherlands Assessment Agency and contains inventories of global emissions of greenhouse gases and air pollutants (Wang et al., 2008; Alessandrini et al., 2017; EDGAR, 2018; Crippa et al., 2020). CO2 emissions from maritime traffic for 2018 are shown in Supplementary Figure 3. EDGAR assesses emissions from ship traffic globally on the basis of the fuel consumption data used disaggregating them on a grid using LRIT (Long Range Identification and Tracking) data signals provided by the ships flying the flag of the European Union (EU) member states, Iceland, Norway and the overseas territories of the EU member states. Emissions downscaling is also carried out using LRIT signal density data by ship category, i.e., assuming the same emission factor worldwide for the same ship category. Focusing on the Mediterranean Sea, the percentage of LRIT signals in the Mediterranean Sea compared to the global total (that also represents the percentage of hours of navigation) of two categories of ships is shown in Table 3.
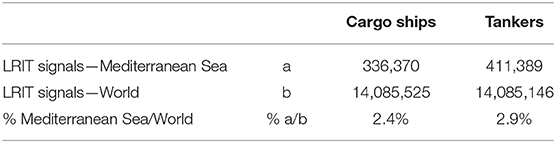
Table 3. CO2 LRIT signals of cargo and tanker maritime traffic in the Mediterranean Sea and worldwide (Source: EDGAR, 2018).
The percentages of maritime traffic in the Mediterranean Sea compared to global traffic (in terms of hours of navigation) estimated on the basis of EDGAR data for 2010 are substantially lower than those previously evaluated by EMODnet/IMO data for 2017/2012. This difference can only be partially due to the different years considered, since the average variation of CO2 emissions from shipping traffic in the period 2012–2015 shows a very small increase (IMO–International Maritime Organization, 2014; ICCT–International Council on Clean Transportation, 2017); a more remarkable reason is that EDGAR's dataset covers ships flying the flag of States contributing to the EU LRIT Cooperative Data Center (CDC), namely all EU Member States, Iceland, Norway, and Overseas Territories of EU Member States. Nominally, the LRIT vessel positions are refreshed every 6 h, while there is significant traffic in the Mediterranean Sea of ships flying the flags of non-European States.
As shown in Table 4, according to UNCTAD data (UNCTAD–United Nations Conference on Trade Development, 2019a), commercial ships flying the flag of a European state (including Norway) account for 14% of the world's commercial fleet in terms of numbers (21% in terms of gross tonnage); instead, ships belonging to shipping companies based in a European state (including the Principality of Monaco and the overseas territories of European states such as Bermuda Islands) account for 29% of the world's total commercial fleet (41% in terms of dead weight tonnage), 86% of which fly a foreign flag (i.e., a flag of a country other than that of the owner shipping company's headquarters). These numbers are congruent with numerous studies (e.g., Luo et al., 2013; European Commission, 2015; Deloitte, 2017) which have shown the relevance of the practice of “flagging out,” where European shipping companies are using flags of convenience of non-European countries, such as Panama, Marshall Islands, Liberia, etc., in order to obtain tax benefits, reducing the costs of the crew and social security.
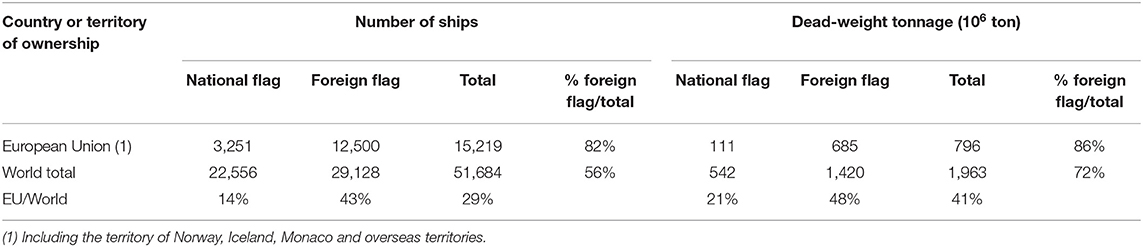
Table 4. Number of ships and total deadweight tonnage registered within the European Union and worldwide (Source: UNCTAD–United Nations Conference on Trade Development, 2019a).
For example, the Mediterranean Shipping Company (MSC), Europe's leading CO2 emissions company (Transport Environment, 2019), is reported to use the Panama flag for a large part of its fleet. As regards the countries, 52% of the ships belonging to shipping companies based in Greece, which make up about 9% of the world commercial fleet, fly the Liberian, Panamanian or Marshallese flag (UNCTAD–United Nations Conference on Trade Development, 2019b). In addition, a sample analysis of ships sailing in the Mediterranean Sea registered on marinetraffic.com (Marinetraffic, 2019) shows a significant proportion of ships flying the flags of non-European countries. It seems therefore very plausible that a significant part of the CO2 emissions of ships is not represented by the EDGAR database, thus underestimating the maritime traffic in the Mediterranean Sea.
The Fluid Dynamics of Slaked Lime Discharge at Sea
The simulation of the behavior of SL particles after their release in the wake of a ship could be done with several methodologies and fluid dynamic modeling approaches.
Research on dilution rates in the wake of ships has initially considered the discharge of liquids (Delft, 1970; Delvigne, 1987; Byrne et al., 1988) and a model that describes the dependence of the dilution on the speed, dimensions and specific resistance coefficient of the ship has been proposed by Lewis (1985). A simplified formula (1), valid for the disposal of liquids, has been adopted in 1975 by the former International Maritime Consultative Organization, known today as International Maritime Organization (Renforth and Henderson, 2017).
where:
D: dilution factor
c: constant equivalent to 0.0030 for a single discharge orifice or 0.0045 for two discharge orifices
Q: volume discharge rate
U: vessel speed
L: waterline length
t: time after disposal
Further field testing (Byrne et al., 1988; Chou, 1996), however, showed that this formula underestimates the dispersal rate by 3 to 10 times. Other studies considered the dilution following discharges from large cruise ships (US-EPA, 2002; Loehr et al., 2006). Katz et al. (2003) simulated the dilution of pulped waste materials into the wake of a US Navy frigate, carrying out field measurements and computer modeling. Situ and Brown (2013) studied the fluctuations of surrogate pollutants concentrations released in the wake of an outboard motor within a small waterway, assessing experimentally the dispersion constant, aka the exponent of time t in formula (1). Chou (1996) identified three different behaviors of the flow within the ship wake development (Figure 3), considering the ratio between the distance from the ship (x) and the ship's width (B).
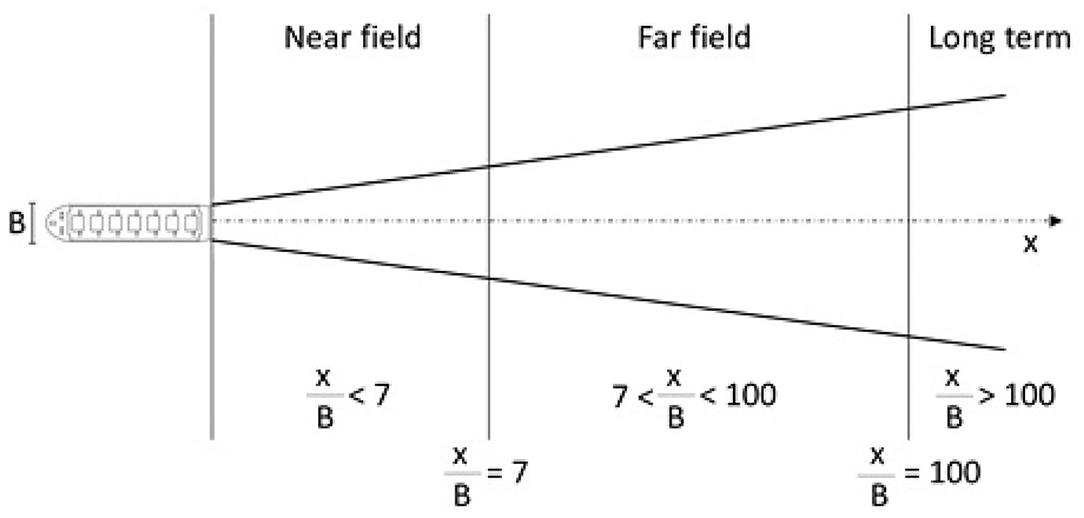
Figure 3. Schematic subdivision of the ships' wake (adapted from Chou, 1996).
In the long-term diffusion region (x/B>100) and its influence on the dilution process of the lime, the flow motion is governed only by the ocean currents and the ambient turbulence. In the far wake (7<x/B<100) it is independent both on the geometry and configuration of the problem; as a consequence, the mean velocity profiles in the transversal direction present similar behavior at different distances from the ship, as theoretically proposed (Pope, 2000) and experimentally verified by numerous authors (Naudascher, 1965, Chen and Rodi, 1980). Moreover, in this region the dilution rate can be easily obtained, since non-reactive quantities, advected by the flow, behave similarly (Chou, 1996). The near wake (x/B < 7), wherein lower dilution rate and thus higher SL concentration in seawater could be expected, may not have a simple and universal solution. Indeed, in this region the flow strongly depends on the ship geometry and on the velocity induced by the propeller.
In recent years, thanks to the development of accurate numerical models and the improvements of computational resources, the Computational Fluid Dynamics (CFD) is frequently employed to investigate applicative problems of engineering interest. Especially for the naval and ocean research field, CFD has become a powerful tool because of the multiple difficulties that can be faced in producing experimental data both in the model and at the full scale. This is the case of the SL release, where a better understanding of SL dispersion in the near field of the wake of a ship could be derived from CFD.
Three-Dimensional Non-reactive CFD Model
A simulation of the flow behavior in the wake of a ship has been performed through a three-dimensional bi-phase CFD model, where SL discharged has been treated as a passive non-reactive substance (inertial article) advected by the flow. The aim is to attain a first assessment of how particles behave and what their dilution rate is. As the massive fluid stream is assumed to be found around the keel, all calculations have been made considering the wake raised by the ship in the region located in the back of the hull.
Numerical simulations have been performed using the free CFD Open-Source library called OpenFOAM (Open Field Operation and Manipulation) given the wide range of features that provides for the most various problems such as combustion, heat transfer, complex, and multi-phase flows. In the numerical code, the Unsteady Reynolds Averaged Navier-Stokes (URANS) equations are solved by using the transient PimpleFoam solver and the k-ω-SST turbulence model. Effects due to gravity (SL particle sinking) and the wave motion are considered negligible, with respect to the flow induced by the propeller in the wake. The propeller was modeled as an actuator disk (Hough and Ordway, 1964).
A Kriso container ship (KCS, Length 232.5 m; width 32 m; depth 19 m; speed 6 m/s or 21.6 km/h), one of the most widespread large ship model, has been chosen, being a valuable geometry for a real application of this process. A slurry of Ca(OH)2 particles with 45 μm radius and initial concentration C0 = 86.5 g/l is discharged by a circular nozzle, injected just above the screw where the velocity induced by the propeller is higher. Two flow rates, 10 kg/s and 100 kg/s have been considered, corresponding to nozzle diameters (d0) of 0.27 and 0.86 m, respectively.
Although multiple injection points could be used to reduce the maximum load in the wake, a single injection point has been considered for the sake of simplicity. Mean velocity, relative to the ship reference frame, and the particle fields in the wake of the ship are shown in Supplementary Figure 4. Particle dispersion is mainly influenced by the advection of the mean flow. In this region, provided that particles are advected by the high velocity induced by the propeller, the flow can be described by a round jet model (Rajartnam, 1976) with axis aligned with the streamline of maximum velocity. This assumption is confirmed by the results of numerical simulations: the mean velocity of the flow is constantly equal to the value at the injection point (U0), 10 m/s, as long as the distance, namely s, is <6 times d0. From this distance on, the mean velocity varies well approximated by the following equation (2) (Kundu et al., 2012), that considers the streamline starting at the center of the circular discharging area with maximum velocity and particles concentration:
where:
U(s): mean flow velocity along the axis of a turbulent round jet, with respect to the absolute reference frame [m/s];
U0: flow velocity at the injection point, with respect to the absolute reference frame [m/s];
d0: diameter of the circular area of discharge [m];
s: curvilinear abscissa along the streamline starting at the injection point [m].
As in round jets, diffusion and dilution begin for s > 6d0, and thus particle concentration is constant until s≈6d0. Furthermore, the particle concentration along the streamline starting at the injections point, obtained by the numerical simulations, is in good agreement with the jet model (Kundu et al., 2012) following the equation:
where:
Cnr: concentration of a non-reactive substance [g/l];
C0: initial concentration [g/l].
One-Dimensional Reactive Model
A simplified one-dimensional reactive model for the dispersion of SL particles advected by the mean flow along the streamline starting at the injection point, is here formulated. The aim is now to assess SL particle radius and concentration along the wake, including dynamic chemical reaction between SL and the seawater. It is considered that particle settling velocity is not relevant compared to the velocity of the stream.
Fluid velocity is approximated by equation (2), and each calcium hydroxide particle is assumed to be solid and perfectly spherical. According to Tannenberger and Klein (2009), particle radius rp is expected to shrink with the following expression:
where:
rp: radius of the particle [μm];
rpI: initial radius of the particle [μm];
ϕ0: diffusion potential [-];
σ: seawater calcium ion diffusivity coefficient [m2/s]
t: elapsed time [s].
As can be seen, radius particle is a function of a chemical parameter known as diffusion potential; it is a dimensionless number linked to two important chemical parameters, α and χ0, as follows:
where:
χ0: difference between the saturation concentration of calcium at the particle surface and the calcium concentration in the bulk liquid [kg/m3];
α: dimensionless ratio between mass transfer to the bulk and mass loss of the particle, known as a factor that should be taken into account for non-pure substances dissolution (Csanady, 1986).
The elapsed time from the injection of the particle located at s, is calculated integrating the reciprocal of the velocity given by Equation (2):
The rate of dissolution as expressed by Csanady (1986), depends on the mass flow M from the spherical particle to the water by this correlation:
where:
Ṁ: loss of mass of the particle [kg/s];
ρp: density of Ca(OH)2 particle [kg/m3].
Assuming that particle shrinking is mainly caused by the total mass transfer to the liquid phase, under diffusion and advection conditions, M can be modeled as proposed by Levich (1992):
where:
Pe: dimensionless Peclet number which represents the ratio between convective and diffusive terms, assessed as:
Moreover, assuming that particles are advected by the fluid and drag effects are neglected, its velocity coincides with the fluid velocity, U (s). Given the above, the relation held for particle concentration, in terms of time derivative, is calculated as the mass flow of a single particle, divided by the particle mass and multiplied by the local calcium hydroxide concentration. This leads to the following equation:
where:
C(s): Ca(OH)2 concentration along the streamline, as a function of the distance s [g/l].
Hence, provided that a time interval dt = ds/U(s) corresponds to a fluid element displacement ds [m] divided by the local fluid velocity, one can transform the equation (10) as follows:
Finally, substituting Ṁ and the Peclet number in the equation (11) yields:
which can be integrated in space to obtain C as a function of the distance s.
While the concentration derivative is always negative, its absolute value increases with the particle radius reduction. Indeed, reducing the radius, the ratio between surface exchange and the mass of the particle increases, thereby accelerating the dilution process. Concentration reduction due to the particle size shrinking is thus applied to the concentration obtained by the advection of the fluid motion and by turbulent diffusion given by equation (2). Starting from the initial condition C(0) = 86 g/l, equation (12) is integrated numerically using a four-step explicit Runge-Kutta scheme (Quarteroni et al., 2014), discretized on 2201 computational nodes equally distributed along the independent variable 0 ≤ s ≤ 1100 m.
Parameters needed for the methodology presented here should derive from experimental works and be related to the local context where SL discharge happens. In this first analysis, all parameters have been taken from the literature, as reported in Table 5.
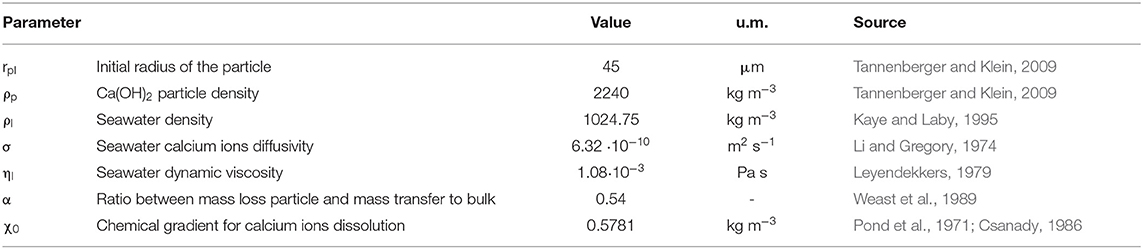
Table 5. Constants quantities used in the one-dimensional bi-phase model.
As diffusion potential appears to be an important parameter controlling the dilution rate of calcium hydroxide, since it combines the effect of α, χ0 and ρp (see Equation 5), a preliminary analysis of its influence on the results has been performed by varying ϕ0 within the range identified by Tannenberger and Klein (2009), from 0 to 2.09·10−4.
pH Variation
Since the detailed evaluation of seawater pH increase due to Ca(OH)2 dissolution requires chemical modeling which is outside the scope of this paper, a simplified approach has been used, based on a series of quadratic relationship between Ca(OH)2 input and pH variation, assessed for different values of seawater pH through the software PHREEQC, developed by the U.S. Geological Survey to perform a wide variety of aqueous geochemical calculations (USGS, 2019).
A standard water composition (Supplementary Table 6, taken from Lyman and Fleming, 1940), with a pH of 8.12 (Butenschön et al., 2020) and a temperature of 20 °C has been considered. The continuous discharge has been divided into 50 meters steps, calculating input of dissolved Ca(OH)2 in seawater in every step by the difference between Ca(OH)2 particle concentration in seawater and the concentration of a non-reactive substance:
where:
It: input of dissolved Ca(OH)2 at the step t [g/l];
Cnrt: concentration of a non-reactive substance at the step t [g/l]—see Equation 3;
Ct: concentration of solid Ca(OH)2 in seawater at the step t [g/l]—see Equation 12.
The pH increase in each step has been calculated with the quadratic relationship:
for different initial pH levels (Supplementary Figure 5); the fitting of the non-dimensional parameters a and b for the different pH initial levels proved the following equations (Supplementary Figure 6):
The final pH in every step is assessed by the following equation that considers the average pH due not only to the input of alkalinity, but also to the dilution in the wake (represented by Equation 2), that could be seen as an addition of “clean” water:
where:
pH0 = initial pH of seawater.
Dt = dilution during the step, calculated from the variation of a non-reactive substance along the streamline, . Considering Equation 3, it becomes , where s is the distance from the discharge calculated along the streamline.
The reaction of SL with CO2 to produce calcium bicarbonate has not been considered since is the CO2 uptake and hydration is potentially slower than the dissolution of SL. As such, this is a conservative assumption that predicts the largest impact on seawater pH since the reaction with CO2 could reduce the pH spike.
Given that carbonate precipitation in natural seawater can take several dozens of minutes even at high pH (Chave and Suess, 1970; Pytkowicz, 1973), it was assumed that no CaCO3 precipitation occurs in the ships' wake because of the rapid mixing time that leads to a short pH spike.
Results
Potential Slaked Lime Discharge and CO2 Removal Worldwide
Based on the existing global fleet size data and length of shipping route, the potential global discharge of SL has been assessed considering:
• The existing global fleet of bulk carriers and container ships;
• Fifteen percent of the ships' cargo capacity, resulting in the 13% of the average ships' tonnage, used for SL load;
• Ship discharge SL along existing routes, assuming an average distance of about 6,300 km for bulk carriers and 8,900 for container ships;
• Single load scenario, with SL loading at the departure; multiple loads scenario, with SL loading at one stop along the route for bulk carriers and two stops for container ships.
• As shown in Table 6, the total potential SL discharge at a global scale is assessed between 1.7 Gt/year (load at departure), to 4.0 Gt/year assuming one intermediate reload for the bulk carriers and two for the container ships. It is worth noting that the discharge rate, estimated considering a uniform spreading of the load along the route, varies between 5 and 18 kg/s in the different cases analyzed.
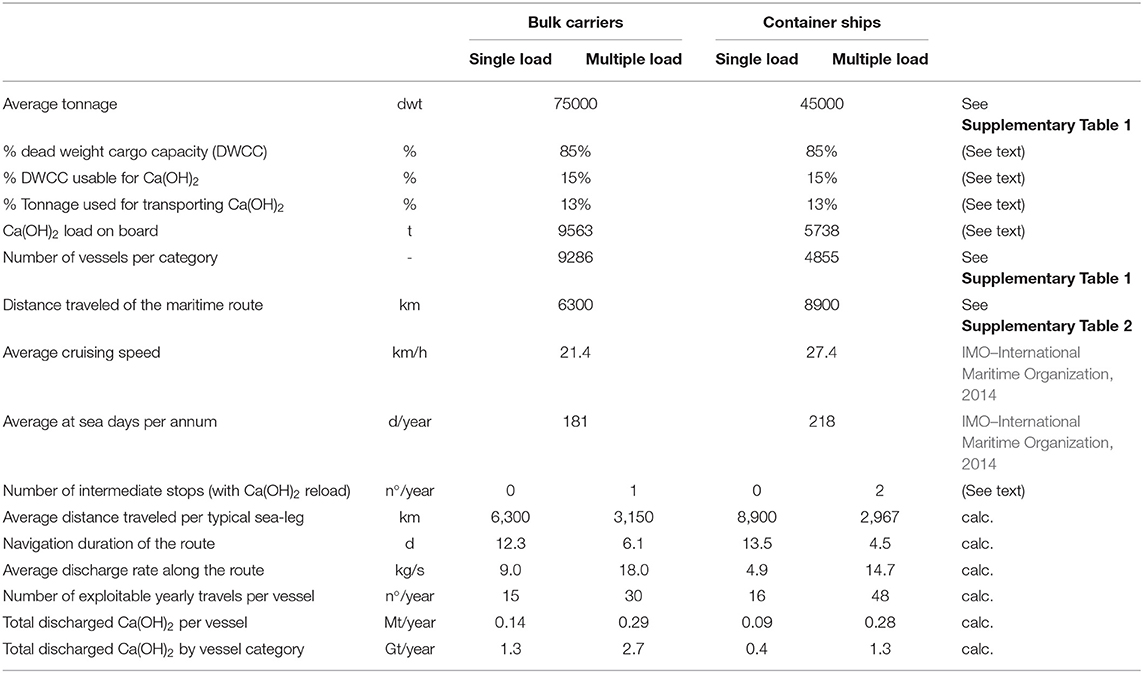
Table 6. Assessment of potential Ca(OH)2 discharge from bulk carriers and container ships at the global scale.
Although atmospheric CO2 removal should be evaluated by using biogeochemical cycle models through (particularly considering rebound effects from the ocean), it is possible to estimate the CO2 removed from the atmosphere based on the amount of CO2 absorbed per mole of Ca(OH)2 added to seawater. The stoichiometric value suggests that 2 mol of CO2 taken up per 1 mol of added Ca(OH)2 (i.e., 2 mol of alkalinity neutralize 2 mol of carbonic acid, with 2 mol of atmospheric carbon dioxide dissolving into the ocean to reestablish the equilibrium). However, the reaction between a small proportion of the hydroxyl and bicarbonate ions to form carbonate and water, as well as vertical mixing of SL that could limit the actual availability of the alkaline water at the ocean's surface, reduce the efficiency of the uptake, thus a conservative value of 1.4 mol of carbon dioxide absorbed per each mole of Ca(OH)2 added has been assessed by Keller et al. (2014). Considering this 1.4 mol/mol ratio, a range of total additional CO2 uptake between 1.5 Gt/year and 3.3 Gt/year is assessed for single load and multiple loads.
Potential Slaked Lime Discharge in the Mediterranean Sea
The higher traffic density in the Mediterranean basin, compared to the global average, leads to a potential of SL discharge far higher than what requested for counteracting ocean acidification. Considering only the existing 5.15 million of hours of navigation of cargo ships, a low SL discharge rate of 10 kg/s leads to a total annual discharge of 186 Mt/year. Considering a conservative value of CO2 absorbed per each mole of Ca(OH)2, assessed as 1.1 mol/mol for the Mediterranean Sea (Butenschön et al., 2020), leads to a range of CO2 additional uptake of about 122 MtCO2/year, that is similar to the average annual baseline uptake of 120 MtCO2/year assessed for the Mediterranean Sea in the period 2000–2019 by Butenschön et al. (2020). In other words, the discharge of SL by existing cargo ships along the Mediterranean route could provide a significant CO2 removal and contrast to the ongoing seawater acidification trend.
Even a low discharge rate of 10 kg/s, the SL loaded in 15% of the ships' cargo capacity would be discharged in about 3300 km, without the need of any additional stops to reload along the majority of the routes in the Mediterranean Sea (See Supplementary Table 7). A discharge rate of 10 kg/s leads also to a volume of water of 416 m3/h, that is similar to the water used for engine cooling in a 75,000 dwt bulk carrier ship, since main engines have a seawater flow rate of 0.06 m3/h per kW of power (see Supplementary Table 8 for details).
The same considerations apply for existing tanker ships, that also have a relevant discharge potential. The potential of passenger ships (i.e., cruise ship) is limited by their low capacity, as space use is already highly optimized. Assuming that 5% of dead weight cruise capacity is used for SL transport, SL would need to be reloaded daily if a discharge rate of only 1 kg/s is used. As such, the induced CO2 removal by enhanced ocean alkalinization could only compensate no more than the CO2 emitted by the vessel (see Supplementary Table 7).
Alternative Scenarios of Discharge
New Dedicated Ships
New dedicated ships built with the only purpose of spreading SL into seawater, with an average tonnage of 75,000 dwt, have been considered. Although this scenario allows flexibility in the choice of the discharge parameters (i.e., location and SL discharge rate), a discharge rate of 50 kg/s has been assumed. Since its discharge rate is five times higher than the one considered for existing ships in the Mediterranean Sea (see Alternative Scenarios of Discharge), specific works could be undertaken during the construction or renewal of the vessels in order to increase the points of discharge and to minimize the impact in the wake of the ship. The discharge rate is calculated assuming an average speed at sea of 25 km/h. Discharge is assumed to take place continuously throughout the route in the form of a slurry, using the power of additional engines and seawater for the mixing of the SL transported in pulverized form. The selection of the routes could be made in order to maximize the efficiency of CO2 removal and the contrast to the ocean acidification, and avoiding areas where there could be eventual regulatory limitations for the discharge.
The total annual discharge by 1,000 new dedicated ships (assuming that 2.5 days are needed to load the ships in the ports, 15 days a year for maintenance stops and a discharge rate of 50 kg/s) assessed as shown in Table 7, amounts to 1.3 Gt/year. Considering again a ratio of 1.4 mol of CO2 absorbed per each mole of Ca(OH)2 added (Keller et al., 2014) this correspond to a removal of 1.1 GtCO2/year. Although the construction of 1,000 new ships, or in part the renewal of existing unused ships, is a monumental task, it should be taken into account that a quarter (about 8,000 ships) of the existing registered cargo fleet is not active (Table 1), and that United States built 2,710 Liberty ships in 4 years and a half during World War II (Davies, 2004). As such, the creation of ~1000 dedicated ships over the coming decades appears plausible.
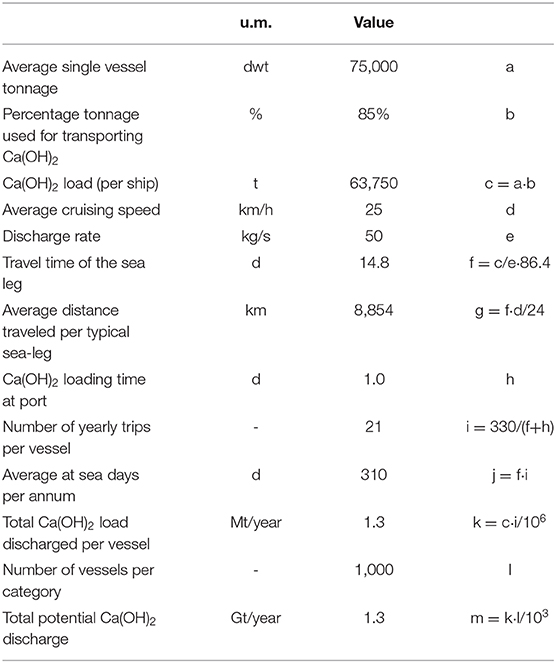
Table 7. Assessment of the potential SL discharge from new dedicated ships.
Use of Ballast Water Tanks of Existing Ships
Ballast water is carried in ships ballast tanks when the ships travel empty. It is filled or emptied when cargo is unloaded or loaded, or when a ship needs extra stability during critical weather conditions. A large number of bulk carriers are used only on a one-way trip for delivering cargo and are empty on their return trip. According to Brancaccio et al. (2018) 45% of bulk carriers travel without carrying any cargo on the return trip. Such trade asymmetries are larger for energy commodities and lower for commodities transported by containers (Narula, 2019).
Ballast water tanks could be used to contain and discharge SL into seawater, as proposed by Köhler et al. (2013). To discharge SL the installation of pumps for the purpose would not be necessary, since ballast pumps are designed for a rapid ballast water discharge. The use of ballast tanks to transport a slurry of SL could avoid the necessity of a dedicated cargo hold, and at the same time has the benefit of avoiding the treatment of ballast water (or at least reducing treatment costs), currently mandatory because ships are a major vector for the introduction of non-indigenous and harmful organisms (Johnson and McMahon, 1998; Sousa et al., 2008). pH increase through the addition of alkaline materials (one of which is calcium hydroxide) is an efficient and cheap ballast water treatment strategy (Starliper et al., 2015), since it kills the aquatic nuisance species that cause economic and ecological damages to oceans. International legislative constraints should be evaluated to understand the possibility of discharging SL slurry; ballast water treatment with SL is still not among the authorized treatment methods (IMO–International Maritime Organization, 2008).
Ballast water is about 36% of the deadweight tonnage of bulk carriers and container ships respectively (Globallast, 2017), thus the potential of SL discharge could be relevant, depending on discharge rate, sea-leg lengths and number of intermediate stops, as previously described. This option could be of great interest for some type of vessels (i.e., cruises) that have limitations in SL transport (see Slaked Lime Concentration and pH Variation in the Ships' Wake). Developments of carbon removal policy framework and CO2 market recognizing revenue for SL discharge, therefore for enhanced ocean alkalinity, could generate potential revenues from ballast travels for the shipowners, thus making SL handling and transport more economically attractive. The main challenge connected to the use of ballast water for SL discharge is the prevention of Ca(OH)2 precipitation in the slurry at the bottom of the tanks. This requires significant structural changes to the vessel to keep in suspension the SL in the water, which should be further investigated before a more precise assessment of the discharge potential of this scenario.
Slaked Lime Concentration and pH Variation in the Ships' Wake
How the SL is added to the ocean will control the chemical changes in local seawater. The results of the modeling suggest that as in a round jet, the reduction of the concentration of a non-reactive substance with the distance is mainly related to the turbulent diffusion in the flow, besides to the diffusion of the mean velocity field due to entrainment of external flow. Velocity, particle concentration and relative dilution rate D(s) = C0/C(s) along the streamline are represented in Figure 4 and Supplementary Table 9 for discharge rates of 10 and 100 kg/s. Since the concentration is inversely proportional to the curvilinear abscissa (s), dilution grows linearly with the distance. With a discharge rate of 10 kg/s particle concentration is reduced by a factor 10 after 13 meters (about 2 s), and after 43 meters with a discharge of 100 kg/s. At the end of the near field of the wake (224 m), concentration is reduced 166 times and 52 times respectively for the lower and higher discharge rate evaluated.
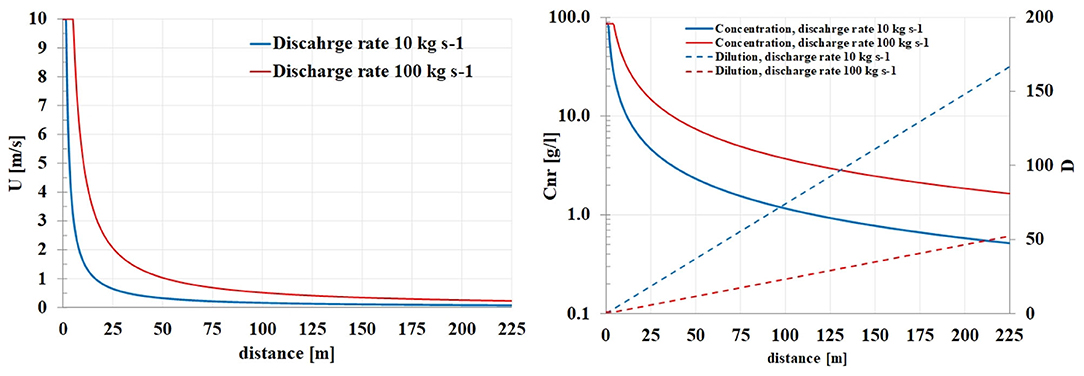
Figure 4. Velocity of the flow (left plot), concentration of a non-reactive substance discharged in the wake (right plot, line) and dilution rate (right plot, dotted line), for two discharge rates.
This dilution considers only the dispersion of a non-reactant substance, thus in case of SL discharge, the dynamic of the chemical reaction between SL particle and seawater should be added in order to assess final SL concentration in the wake.
Results are reported in Figure 5, where the reduction of particle radius and its concentration are shown for 5 different values of the diffusion potential and 2 values of the discharge rate, as a function of the distance. The effect of the variation of the diffusion potential is evident since higher values cause a more rapid particle radius reduction as a consequence of dilution processes. The curve related to a null value of the diffusion potential reproduces exactly the behavior of the concentration under non-reacting conditions given by equation (3).
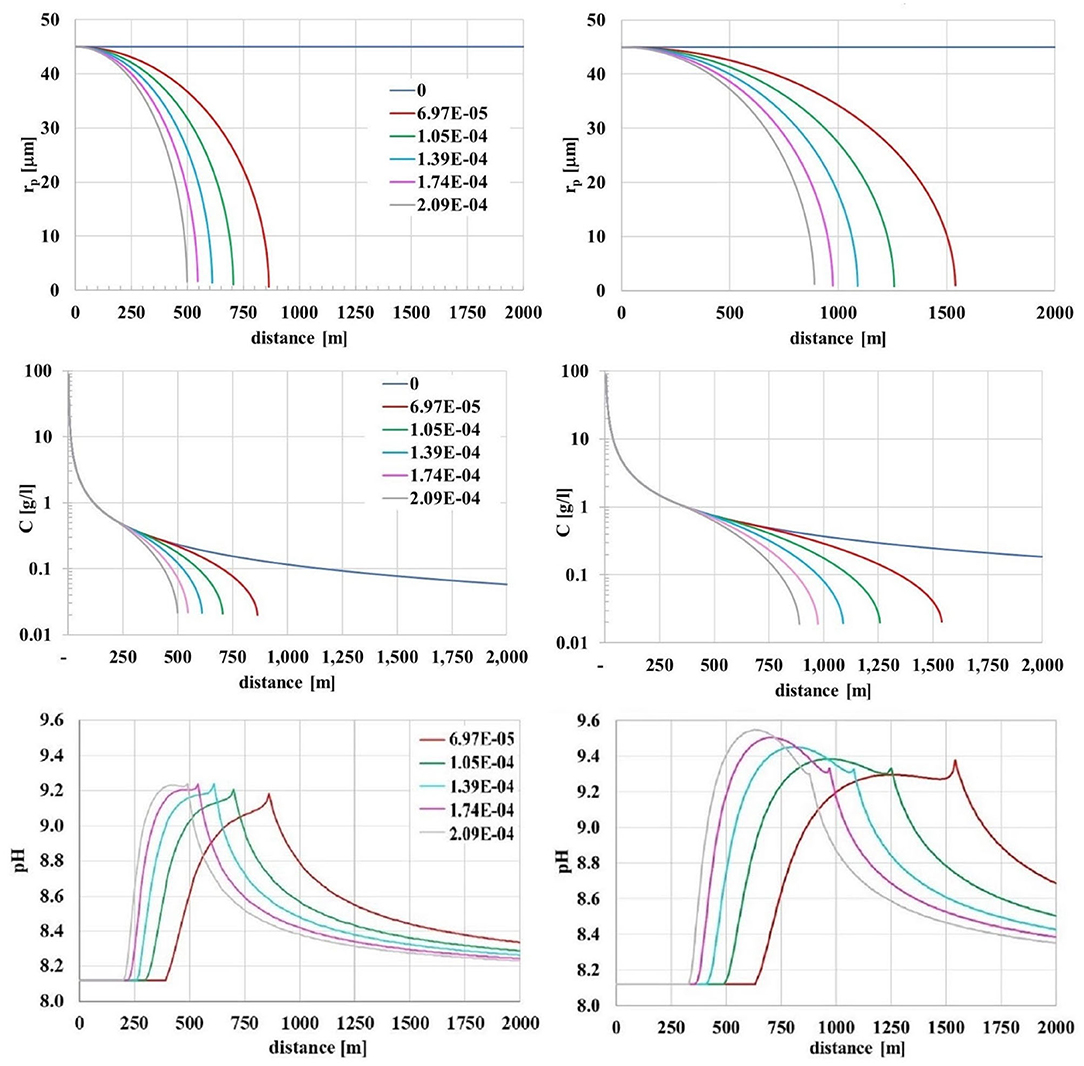
Figure 5. Particle radius (top), Ca(OH)2 concentration (middle) and pH variation (bottom) for different values of the diffusion potential ϕ0 and two rate of discharge (left: 10 kg/s; right: 100 kg/s). Initial Ca(OH)2 particle radius: 45 μm.
With 10 kg/s discharge rate, for distances lower than 250 m, particle radius remains >40 μm; afterward, concentration varies substantially depending on Φ0. The lower the Φ0, the slower the radius reduction and the lower the concentration decrease. A slower radius reduction entails a similar reduction in the divergence of concentration trends from that simulated in the first model. This implies that for all the near field and part of the a far field of the wake, the mass concentration reduction due to the particle size reduction is negligible with respect to the effect of the advection-diffusion related to the mean and the turbulent flow.
When the particle radius is reduced to smaller than 40 μm (after 400 m with a discharge rate of 100 kg/s), the effect of the chemical diffusion becomes dominant and the concentration diverges from the curve representing the pure diffusion derived by the fluid motion. Particle concentration becomes zero at a distance between 500 and 850 m (at the lower discharge rate) and after 900–1500 m (at the higher discharge rate). Dissolution of Ca(OH)2 particle begins when particle concentration is about 0.4 g/l (discharge rate 10 kg/s) or 0.75 g/l (100 kg/s) thus a significant ionic load is provided to seawater within few minutes.
pH variations in the wake reach a maximum value of about in 1 unit, with minor differences (0.3 unit) between the two discharge rates. The high discharge rate (100 kg/s) moves the spike ahead, about 200–300 meters with higher diffusion potential and 500–700 m with lower, and increases the duration of higher pH value. With a 10 kg/s discharge rate, pH variation becomes lower than 0.2 units after 1400–1600 m from the discharge (230–330 s), while for 100 kg/s this happens 1700–3000 m (280–500 s) from the discharge (see Supplementary Figure 7). Eventually, this seawater would mix into the surrounding water.
These results could be refined considering the range of variation of other parameters listed in Table 5, which should be constrained through experimental studies or possible alternations to Ca(OH)2 production. For example, decreasing the average particle radius in the slurry would decrease the time required for dissolution, thus increasing the rate of Ca(OH)2 ionic load to seawater and thus maximum pH alteration.
Discussion
A very high potential discharge of slaked lime in the sea can be achieved by using the existing global commercial fleet of bulk carriers and container ships and low discharge rates. This could reach several Gt/year of SL discharged if a significant share of the existing maritime traffic of dry bulk carriers and containers is used. In case between 20 and 40% of the existing fleet is involved in such operation of ocean liming, this would imply a potential of 1 Gt/y of CO2 removal from the atmosphere.
For some closed basin, such as the Mediterranean Sea where traffic density is higher than the global average, the potential of SL discharge also with a low rate of 10 kg/s is far higher than what needed for counteracting ocean acidification (Butenschön et al., 2020).
Current global lime production is ~360 Mt/year, which may increase to >500 Mt/year by 2100 and produces approximately an equivalent mass of CO2 (Renforth, 2019). The proposal considered here would require the expansion of lime production to a scale equivalent to the global cement industry (4.5 Gt/year), with technologies that prevented the emission of the process CO2 (e.g., Hanak et al., 2017). These facilities would need to located close to ports to avoid excessive overland travel, and additional loading facilities would be required. The design of an efficient logistic chain to increase the loading capacity of SL in ports is essential to the availability of SL for vessels at the departure or for the reload. High-capacity, zero-emissions hydroxide production could also be achieved via electrochemical water/salt/mineral splitting powered by non-fossil electricity (e.g., House et al., 2007; Rau et al., 2018).
Presently the addition of material to some areas of the ocean is restricted through national and international regulation. The responsible development of this approach requires that appropriate international governance mechanisms are considered and implemented before deployment (Lenton et al., 2019). While out of the scope of this study, it is important to consider how the research will be developed, including the development of laboratory-based experimentation, stakeholder engagement in experimental design, and the stage-gating of field trials.
However, important potential constraints should be considered, like the need of upscaling substantially the current levels of limestone mining and slaked lime production, the modification of existing ships, the implementation of loading facilities in the port or international and the national legislative restrictions that could limit the discharge in some areas. The definition of an efficient supply chain to increase the loading capacity of SL in ports is essential to the availability of SL for vessels at the departure or for the reload.
Using existing vessels has many advantages including lower substantial modifications of the ships for the purpose, lower capital and investment costs, low discharge rates due to the length of routes. However, a fleet of new dedicated ships could better manage SL storage and spreading. The use of ballast water tanks for carrying and discharging SL could be of great interest, but the risk of precipitation of Ca(OH)2 or carbonate minerals (e.g., CaCO3) in the slurry at the bottom of the containers would limit its application due to the long residence time in the ballast tanks.
The global potential of CO2 removal from SL discharge by cargo and container ships (1.5-3.3 GtCO2/year) or new ships (1.1 GtCO2/y), assessed using average literature values of CO2 removal per unit of SL added, could be limited by the actual availability of decarbonized SL as well as the maximum discharge rate that could avoid localized impacts of SL discharge on the marine environment.
Since a globally distributed alkalinity is responsible for a potentially small environmental local impact (Renforth and Henderson, 2017), low SL discharge rates in the ships' wake have been considered. SL dispersion on the wake of a ship, initially analyzed by representing the pure diffusion derived by the fluid motion, lead to two order of magnitude reduction of the initial SL concentration within the first 25 s in case of low discharge rates, and within the first 75 s with high discharge rates. The dissolution model added to the fluid dynamic analysis allows simulating the shrinking of particle radius, thus the dissolution of the ionic load to seawater. As much concentration diverges from the curve of the non-reactive diffusion, the higher the particle radius reduction, the dispersive phenomena would prevail over the advection. The pH variations are lower than 1.5 unit, and the duration of pH variation, higher than 1 unit, lasts just a few minutes for higher discharge rates. Diurnal fluctuations of 0.2 pH units are not uncommon (Schulz and Riebesell, 2013), and diurnal changes of 1 pH unit is typical in coastal environments (Cornwall et al., 2013). While research that considers the impact of the changes in carbonate chemistry and ecosystem function due to ocean alkalinity enhancement is at an early stage (e.g., Gore et al., 2018), the results of this modeling work help to constrain the magnitude of the perturbation. Given that the effects described here would also be attenuated by CO2 uptake, the impact is likely to be less than ~1–1.5 pH units for several minutes.
The modeling approach discussed could be used to establish a relationship between SL addition rate and seawater pH increase, and thus threshold values for a safe SL discharge rate. Further investigations are needed to constrain the model parameters. Specifically, the diffusion and dissolution of calcium hydroxide. Future work should also include a more complex fluid dynamics model, taking into account all chemical parameters influencing particle motion, including SL particle radius, geometry, and porosity. Following this, relationships between physics and chemical simulations, and the local environmental changes produced, must be established to assess the maximum SL quantity which can assure that the benefits from ocean liming are not hindered by localized impact of the discharge on marine life.
This paper has considered the use of SL as alkaline material to be added to seawater, because of the considerable worldwide availability of limestone and the industrial maturity of the calcination and slaking processes, although the storage of the large quantities CO2 produced during calcination still represent a challenge (Bui et al., 2018). Anyway, other alternative alkalinity sources that have been proposed, such as Mg(OH)2 (Renforth and Henderson, 2017), Na2CO3 (Kheshgi, 1995), NaOH (House et al., 2007), or electrogeochemical strategies (Rau et al., 2018) deserve attention and further research.
Data Availability Statement
Publicly available datasets were analyzed in this study. This data can be found here: www.emodnet-humanactivities.eu/view-data.php.
Author Contributions
SC conceptualized the research and with DP wrote the draft. DP performed the calculation on the SL discharge potential with the support of SC. AA performed the fluid dynamic analysis and wrote the draft of that session with support from SD and SC. SC, SD, and DR performed the analysis on pH variation. MG, PR, and FC critically revised and improved the draft. All authors approved the submitted version.
Funding
The research was carried out within the Desarc-Maresanus project (www.desarc-maresanus.net), which received the financial support of Amundi SGR SpA. Renforth is supported by the UKRI Greenhouse Gas Removal Programme (NE/P019730/2).
Conflict of Interest
The authors declare that the research was conducted in the absence of any commercial or financial relationships that could be construed as a potential conflict of interest.
Acknowledgments
Authors thank Andrea Panarello (Interprogetti Srl), Roberto Marras (Unicalce), Giovanni Cappello, and Dennis Ross Morrey (CO2APPS) for their useful suggestions, as well as Maria Ludovica Dall'Aglio for the support with the CFD modeling. Some of the results of this research were made possible by the computational resources made available at CINECA (Italy) by the high-performance computing projects ISCRA-C LWMITSW.
Supplementary Material
The Supplementary Material for this article can be found online at: https://www.frontiersin.org/articles/10.3389/fclim.2021.575900/full#supplementary-material
References
Albright, R., Caldeira, L., Hosfelt, J., Kwiatkowski, L., and Maclaren, J. K. (2016). Reversal of ocean acidification enhances net coral reef calcification. Nature 531, 362–365. doi: 10.1038/nature17155
Alessandrini, A., Guizzardi, D., Janssens-Maenhout, G., Pisoni, E., Trombetti, M., and Vespe, M. (2017). Estimation of shipping emissions using vessel Long Range Identification and tracking data. J. Maps 13, 946–954. doi: 10.1080/17445647.2017.1411842
Bach, L. T., Gill, S. J., Rickaby, R. E. M., Gore, S., and Renforth, P. (2019). CO2 removal with enhanced weathering and ocean alkalinity enhancement: potential risks and co-benefits for marine pelagic ecosystems. Front. Clim. 1:7. doi: 10.3389/fclim.2019.00007
Brancaccio, G., Kalouptsidi, M., and Papageorgiou, T. (2018). Geography, Search Frictions and Endogenous Trade Costs. NBER Working Paper No. 23581. Available online at: http://www.nber.org/papers/w23581
Bui, M., Adjman, C., Bardow, A., Anthony, E., Boston, A., Brown, S., et al. (2018). Carbon capture and storage (CCS): the way forward. Ener. Environ. Sci. 11, 1062–1176. doi: 10.1039/c7ee02342a
Butenschön, M., Lovato, T., Grosso, M., Masina, S., and Caserini, S. (2020). Alkalinisation scenarios in the Mediterranean Sea for efficient removal of atmospheric CO2 and the mitigation of ocean acidification. Front. Clim. 3:6145537. doi: 10.3389/fclim.2021.614537
Byrne, C. D., Law, R. J., Hudson, P. M., Thain, J. E., and Fileman, T. W. (1988). Measurements of the dispersion of liquid industrial waste discharged into the wake of a dumping vessel. Water Res. 22, 1577–1584. doi: 10.1016/0043-1354(88)90171-6
Caserini, S., Barreto, B., Lanfredi, C., Cappello, G., Morrey, D. R., and Grosso, M. (2019). Affordable CO2 negative emission through hydrogen from biomass, ocean liming, and CO2 storage. Mitig. Adap. Strat. Glob. Change 24, 1231–1248. doi: 10.1007/s11027-018-9835-7
Chave, K. E., and Suess, E. (1970). Calcium carbonate saturation in seawater: effects of dissolved organic matter. Limon. Oceanogr. 15:633–37.
Chen, C. J., and Rodi, W. (1980). Vertical Turbulent Buoyant Jets – A Review of Experimental Data. Oxford: Pergamon Press
Chou, H.-T. (1996). On the dilution of liquid waste in ships' wakes. J. Mar. Sci. Technol. 1, 149–154. doi: 10.1007/BF02391175
Cornwall, C. E., Hepburn, C. D., McGraw, C. M., Currie, K. I., Pilditch, C. A., Hunter, K. A., et al. (2013). Diurnal fluctuations in seawater pH influence the response of a calcifying macroalga to ocean acidification. Proc. R. Soc. 280:1772. doi: 10.1098/rspb.2013.2201
Costello, M. J., and Chaudhary, C. (2017). Marine biodiversity, biogeography, deep-sea gradients, and conservation. Curr. Biol. 27, R511–R527. doi: 10.1016/j.cub.2017.04.060
Crippa, M., Solazzo, E., Huang, G., Guizzardi, D., Koffi, E., Muntean, M., et al. (2020). High resolution temporal profiles in the Emissions Database for Global Atmospheric Research. Nat. Sci. Data 7:121. doi: 10.1038/s41597-020-0462-2
Cripps, G., Widdicombe, S., Spicer, J. I., and Findlay, H. S. (2013). Biological impacts of enhanced alkalinity in Carcinus maenas. Mar. Poll. Bull. 71, 190–198. doi: 10.1016/j.marpolbul.2013.03.015
Csanady, G. T. (1986). Mass transfer to and from small particles in the sea. Limnol. Oceanog. 31, 237–248. doi: 10.4319/lo.1986.31.2.0237
Davies, J. (2004). “Liberty” Cargo Ship. Available online at: http://ww2ships.com/acrobat/us-os-001-f-r00.pdf
Delft (1970). Studies on the Mixing of Dilute Acid With Seawater in the Propeller Slipstream of the Coaster “Kathe H.” Waterloopkundig Laboratory Delft M939.
Delvigne, G. A. L. (1987). “Experiments on the dilution capacity of wakes from tankers dumping in the North Sea,” in Oceanic Processes in Marine Pollution Physicochemical Processes and Wastes in the Ocean, O'Connor, T. P., Burt, W. V., Duedall, I. W., editors. (Malabar, FL: Krieger,), 11–19.
EDGAR (2018). Emissions Database for Global Atmospheric Research. Available online at: https://edgar.jrc.ec.europa.eu/gallery.php
EMODnet (2019a). EMODnet-Human Activities Project–Shipping Density. Available online at: www.emodnet-humanactivities.eu/view-data.php
EMODnet (2019b). EU Vessel Density Map. Detailed Method. Available online at: http://www.emodnet-humanactivities.eu/documents/Vessel%20density%20maps_method_v1.5.pdf
European Commission (2015). Study on the Analysis and Evolution of International and EU Shipping. Zoetermeer: Final Report.
Garcìa-Reyes, M., Sydeman, W. J., Schoeman, D. S., Rykaczewski, R. R., Black, B. A., et al. (2015). Under pressure: Climate change, upwelling, and eastern boundary upwelling ecosystems. Front. Marine Sci. 2:109. doi: 10.3389/fmars.2015.00109
Globallast (2017). Available online at: http://archive.iwlearn.net/globallast.imo.org/ballast-water-as-a-vector/index.html
Gore, S., Renforth, P., and Perkins, R. (2018). The potential environmental response to increasing ocean alkalinity for negative emissions. Mitig. Adapt. Strat. Glob. Change, 24, 1191–1211. doi: 10.1007/s11027-018-9830-z
Hanak, D. P., Jenkins, B., Kruger, T., and Manovic, V. (2017). High-efficiency negative-carbon emission power generation from integrated solid-oxide fuel cell and calciner. Appl. Ener. 205, 1189–1201. doi: 10.1029/j.apenergy.2017.08.090
Harvey, L. D. D. (2008). Mitigating the atmospheric CO2 increase and ocean acidification by adding limestone powder to upwelling regions. J. Geophys. Res. 113:C04028. doi: 10.1029/2007JC004373
Hough, G. R., and Ordway, D. E. (1964). The Generalized Actuator Disk. Tech. Rep. Cameron Station, Alexandria, Virginia: TAR-TR 6401, Therm Advanced Research, Inc.
House, K. Z., House, C. H., Schrag, D. P., and Aziz, M. J. (2007). Electrochemical acceleration of chemical weathering as an energetically feasible approach to mitigating anthropogenic climate change. Environ. Sci. Technol. 41, 8464–8470. doi: 10.1021/es.0701816
ICCT–International Council on Clean Transportation (2017). Greenhouse Gas Emissions From Global Shipping, Washington DC, 2013–2015.
IMO–International Maritime Organization (2008). Resolution MEPC.174(58). Guidelines For Approval Of Ballast Water Management Systems (G.8), London, UK.
International Maritime Organization (2014). Third IMO Greenhouse Gas Study 2014. Suffolk: Micropress Printers.
IPCC (2018). Global Warming of 1.5°C: Summary for Policy Makers. Available online at: http://report.ipcc.ch/sr15/pdf/sr15_spm_final.pdf
Johnson, P. D., and McMahon, R. G. (1998). Effects of temperature and chronic hypoxia on survivorship of zebra mussels (Dreissena polymorpha) and Asian clam (Corbicula fluminea). Canad. J. Fish. Aqu. Sci. 55, 1564–1572. doi: 10.1139/f98-030
Katz, C. N., Chadwick, D. B., Rohr, J., Hyman, M., and Ondercin, D. (2003). Field measurements and modeling of dilution in the wake of a US navy frigate. Mar. Pollut. Bull. 46, 991–1005. doi: 10.1016/S0025-326X(03)00117-6
Kaye, G. W. C., and Laby, T. H. (1995). Tables of Physical and Chemical Constants. Longman, 16th edition, London, UK.
Keller, D. P., Feng, E. Y., and Oschilies, A. (2014). Potential climate engineering effectiveness and side effects during a high carbon dioxide-emission scenario. Nat. Communic. 5:3304. doi: 10.1038/ncomms4304
Kheshgi, H. S. (1995), Sequestering atmospheric carbon dioxide by increasing ocean alkalinity. Energy 20, 915–922, doi: 10.1016/0360-5442(95)00035-F.
Köhler, P., Abrams, J. F., Völker, C., Hauck, J., and Wolf-Gladrow, D. A. (2013). Geoengineering impact of open ocean dissolution of olivine onatmospheric CO2, surface ocean pH and marine biology. Environ. Res. Lett. 8:014009. doi: 10.1088/1748-9326/8/1/014009
Kundu, P. K., Cohen, I. M., and Dowling, D. R. (2012). Fluid Mechanics, 5th Edn. Cambridge, MA: Elsevier.
Lenton, A., Boyd, P., Thatcher, M., and Emmerson, K. (2019). Foresight must guide geoengineering research and development. Nat. Clim. Change 9:342. doi: 10.1038/s41558-019-0467-z
Lenton, A., Matear, R. J., Keller, D. P., Scott, V., and Vaughan, N. E. (2018). Assessing carbon dioxide removal through global and regional ocean alkalinization under high and low emission pathways. Earth Syst. Dynam. 9, 339–357. doi: 10.5194/esd-9-339-2018
Lewis, R. E. (1985). The dilution of waste in the wake of a ship. Water Res. 19, 941–945. doi: 10.1016/0043-1354(85)90360-4
Leyendekkers, J. V. (1979). Prediction of the density and viscosity seawater, its concentrates and other multicomponent solution using the Tamman-Tait-Gibson model. Desalination 29, 263–274. doi: 10.1016/S0011-9164(00)82243-2
Li, Y.-H., and Gregory, S. (1974). Diffusion of ions in sea water and in deep-sea sediments. Geochim Cosmochim Acta 38, 703–714. doi: 10.1016/0016-7037(74)90145-8
Locke, A., Doe, K. G., Fairchild, W. L., Jackman, P. M., and Reese, E. J. (2009). Preliminary evaluation of effects of invasive tunicate management with acetic acid and calcium hydroxide on non-target marine organisms in Prince Edward Island, Canada. Aqu Inv. 4, 221–236. doi: 10.3391/ai.2009.4.1.23
Loehr, L. C., Beegle-Krause, C.-J., George, K., McGee, C. D., Mearns, A. J., and Atkinson, M. J. (2006). The significance of dilution in evaluating possible impacts of wastewater discharges from large cruise ships. Mar. Poll. Bull. 52, 681–688. doi: 10.1016/j.marpolbul.2005.10.021
Luo, M., Fan, L., and Li, K. X. (2013). Flag choice behaviour in the world merchant fleet. Transportmetrica 9, 429–450. doi: 10.1080/18128602.2011.594969
Marinetraffic (2019). Available online at: https://www.marinetraffic.com
Narula, K. (2019). The maritime dimension of sustainable energy security. Lect. Notes Ener 9:68. doi: 10.1007/978-981-13-1589-3_9
Naudascher, E. (1965). Flow in the wake of self-propelled bodies and related sources of turbulence. J. Fluid Mech. 22, 625–656. doi: 10.1017/S0022112065001039
Nemet, G. F., Callaghan, M. W., Creutzig, F., Fuss, S., Hartmann, J., Jérôme, H., et al. (2018). Negative emissions – part 3: innovation and upscaling. Environ. Res. Lett. 13:063002. doi: 10.1088/1748-9326/aabff4
Pedersen, M. F., and Hansen, P. J. (2003). Effects of high pH on a natural marine planktonic community. Mar. Ecol. Prog. Ser. 260, 19–31. doi: 10.3354/meps260019
Pond, S., Pytkowicz, R. M., and Hawley, J. E. (1971). Particle dissolution during settling in the oceans. Deep-Sea Res. 18, 1135–1139. doi: 10.1016/0011-7471(71)90099-4
Pytkowicz, R. M. (1973). Calcium carbonate retention in supersaturated seawater. Am. J. Sci. 273, 515–522.
Quarteroni, A., Sacco, R., Saleri, F., and Gervasio, P. (2014). Matematica Numerica 4a edizione. Milano: Springer.
Rau, G. (2019). The race to remove CO2 needs more contestants. Nat. Clim. Change 9:256. doi: 10.1038/s41558-019-0445-5
Rau, G. H., Willauer, H. D., and Ren, Z. J. (2018). The global potential for converting renewable electricity to negative-CO2-emissions hydrogen. Nature Clim. Change 8, 621–625. doi: 10.1038/s41558-018-0203-0
Renforth, P. (2019). The negative emission potential of alkaline materials. Nat. Comm. 10:1401. doi: 10.1038/s41467-019-09475-5
Renforth, P., and Henderson, G. (2017). Assessing ocean alkalinity for carbon sequestration. Rev. Geophy. 55, 636–674. doi: 10.1002/2016RG000533
Renforth, P., Jenkins, B. G., and Kruger, T. (2013). Engineering challenges of ocean liming. Energy 60, 442–452. doi: 10.1016/j.energy.2013.08.006
Schulz, K. G., and Riebesell, U. (2013). Diurnal changes in seawater carbonate chemistry speciation at increasing atmospheric carbon dioxide. Mar. Biol. 160, 1889–1899. doi: 10.1007/s00227-012-1965-y
Situ, R., and Brown, R. (2013). Mixing and dispersion of pollutants emitted from an outboard motor. Mar. Poll. Bull. 69, 1-2, 19–27. doi: 10.1016/j.marpolbul.2012.12.015
Sousa, R., Antunes, C., and Guilhermino, L. (2008). Ecology of the invasive Asian clam Corbicula fluminea (Müller, 1774) in aquatic ecosystems: an overview. Ann. Limnol. 44, 85–94. doi: 10.1051/limn:2008017
Starliper, C. E., Watten, B. J., Iwanowicz, D., Green, P. A., Bassett, N. L., and Adams, C. R. (2015). Efficacy of pH elevation as a bactericidal strategy for treating ballast water of freight carriers. J. Adv. Res. 6, 501–509. doi: 10.1016/j.jare.2015.02.005
Tannenberger, M., and Klein, H. (2009). Settling and Dissolution of Calcium Hydroxide Particles. Fakultätfür Maschinenwesen, Studiengang Chemieingenieurwesen. Technischen Universität München.- München: Lehrstuhlfür Anlagen - und Prozesstechnik; Semesterarbeit
Transport and Environment (2019). EU Shipping's Climate Record-Maritime CO2 Emissions and Real-World Ship Efficiency Performance. European Federation for Transport and Environment AISBL.
UNCTAD–United Nations Conference on Trade and Development (2019b). Handbook of Statistics 2019 (Geneva).
United Nations Conference on Trade and Development (2018). Review of Maritime Transport 2018 (Geneva).
United Nations Conference on Trade and Development (2019a). Review of Maritime Transport 2019 (Geneva).
US-EPA (2002). Cruise Ship Plume Tracking Survey Report. EPA 842-R-02-001, Office of Water, Washington, DC. Available online at: https://www.epa.gov/sites/production/files/2015-11/documents/cruise_ship_plume_tracking_survey_report.pdf
USGS (2019). PHREEQC. U.S. Geological Survey. vers. 3. Available online at: http://www.usgs.gov/software/phreeqc-version-3
Vesselfinder (2019). Available online at: www.vesselfinder.com
Wang, C., Corbett, J. J., and Firestone, J. (2008). Improving spatial representation of global ship emissions inventories. Env. Sci. Techn. 42, 193–199. doi: 10.1021/es0700799
Keywords: slaked lime, sea acidification, CO2 removal, maritime traffic, ocean alkalinisation
Citation: Caserini S, Pagano D, Campo F, Abbà A, De Marco S, Righi D, Renforth P and Grosso M (2021) Potential of Maritime Transport for Ocean Liming and Atmospheric CO2 Removal. Front. Clim. 3:575900. doi: 10.3389/fclim.2021.575900
Received: 24 June 2020; Accepted: 10 March 2021;
Published: 08 April 2021.
Edited by:
David Peter Keller, GEOMAR Helmholtz Center for Ocean Research Kiel, GermanyReviewed by:
Greg H. Rau, University of California, Santa Cruz, United StatesChris Vivian, Fisheries and Aquaculture Science (CEFAS), United Kingdom
Copyright © 2021 Caserini, Pagano, Campo, Abbà, De Marco, Righi, Renforth and Grosso. This is an open-access article distributed under the terms of the Creative Commons Attribution License (CC BY). The use, distribution or reproduction in other forums is permitted, provided the original author(s) and the copyright owner(s) are credited and that the original publication in this journal is cited, in accordance with accepted academic practice. No use, distribution or reproduction is permitted which does not comply with these terms.
*Correspondence: Stefano Caserini, c3RlZmFuby5jYXNlcmluaUBwb2xpbWkuaXQ=