 John A. Callahan
 Daniel J. Leathers
 Christina L. Callahan
- 1Delaware Geological Survey, Department of Geography and Spatial Sciences, University of Delaware, Newark, DE, United States
- 2Department of Geography and Spatial Sciences, Center for Environmental Monitoring and Analysis, University of Delaware, Newark, DE, United States
Coastal flooding poses the greatest threat to human life and is often the most common source of damage from coastal storms. From 1980 to 2020, the top 6, and 17 of the top 25, costliest natural disasters in the U.S. were caused by coastal storms, most of these tropical systems. The Delaware and Chesapeake Bays, two of the largest and most densely populated estuaries in the U.S. located in the Mid-Atlantic coastal region, have been significantly impacted by strong tropical cyclones in recent decades, notably Hurricanes Isabel (2003), Irene (2011), and Sandy (2012). Current scenarios of future climate project an increase in major hurricanes and the continued rise of sea levels, amplifying coastal flooding threat. We look at all North Atlantic tropical cyclones (TC) in the International Best Track Archive for Climate Stewardship (IBTrACS) database that came within 750 km of the Delmarva Peninsula from 1980 to 2019. For each TC, skew surge and storm tide are computed at 12 NOAA tide gauges throughout the two bays. Spatial variability of the detrended and normalized skew surge is investigated through cross-correlations, regional storm rankings, and comparison to storm tracks. We find Hurricanes Sandy (2012) and Isabel (2003) had the largest surge impact on the Delaware and Chesapeake Bay, respectively. Surge response to TCs in upper and lower bay regions are more similar across bays than to the opposing region in their own bay. TCs that impacted lower bay more than upper bay regions tended to stay offshore east of Delmarva, whereas TCs that impacted upper bay regions tended to stay to the west of Delmarva. Although tropical cyclones are multi-hazard weather events, there continues to be a need to improve storm surge forecasting and implement strategies to minimize the damage of coastal flooding. Results from this analysis can provide insight on the potential regional impacts of coastal flooding from tropical cyclones in the Mid-Atlantic.
Introduction
Coastal storms are a multi-threat natural hazard, often including heavy rain, strong winds, large waves, rip currents, and storm surge, all of which must be considered collectively when assessing risk and devising mitigation strategies. According to the National Oceanic and Atmospheric Administration (NOAA), for the years 1980 – 2019, 17 of the top 25 costliest natural disasters in the US were caused by tropical cyclones (TCs) (NOAA National Centers for Environmental Information, 2020). Coastal flooding, primarily from storm surge and waves, from these storms poses the greatest threat to human life and is often the source of much of the damage (Blake and Gibney, 2011; Rappaport, 2014; Chippy and Jawahar, 2018; Weinkle et al., 2018).
Two of the largest estuaries in the United States, the Delaware and Chesapeake Bays, have been significantly impacted by strong TCs in recent decades, notably Hurricanes Sandy (2012), Irene (2011), and Isabel (2003). These two estuaries, located in the Mid-Atlantic coastal region, house ~27 million inhabitants, a high density of metropolitan areas, transportation networks, industrial ports, and currently are under active development (Sanchez et al., 2012; Chesapeake Bay Program, 2020). Alongside large investments in public and private infrastructure, the region also hosts numerous critical natural ecosystems, saltmarshes and freshwater wetlands, agricultural fields, and forested lands threatened by degradation and erosion. Coastal flooding has been deemed an important natural hazard in this region (Boesch et al., 2018; Delaware Emergency Management Agency, 2018) and can have a tremendous economic impact on current and future waterfront areas (Li et al., 2020).
Impacts from coastal flooding are highly dependent upon both the natural and social vulnerability of a location (i.e., it is hyper-local), as well as the human response to implement adaptation measures (e.g., dune/berm systems, shoreline hardening), and therefore can vary drastically over short distances. The wide diversity of land use and vulnerable communities make it difficult to plan for this region as a whole. It is critical that we understand the severity and geographic variability of storm surge to properly assess the risk, aid in preparedness, and ultimately reduce the severe impacts from coastal flooding (Council on Climate Preparedness Resilience, 2016).
Water levels in the Delaware and Chesapeake Bays have been well-monitored by tide-gauge networks for several decades, particularly at NOAA National Water Level Observation Network (NWLON) sites operated through the Physical Oceanographic Real-Time System (PORTS) for each bay. Although this is primarily due to the importance of marine navigation and public safety, many of these gauges are particularly high quality, have very long records, and have been well-cited for monitoring sea-level rise and climate studies (Holgate et al., 2013; Sweet et al., 2017a; NOAA National Ocean Service National Water Level Observation Network, 2020; NOAA National Ocean Service Physical Oceanographic Real-Time System, 2020). Relative sea-level rise (SLR) (Sallenger et al., 2012; Kopp, 2013; Boon et al., 2018) and high-tide flooding (Sweet et al., 2014, 2020) rates in the region have increased in recent decades as compared to the early-mid twentieth century and are expected to continue increasing into the near future (Callahan et al., 2017; Sweet et al., 2017a; Boesch et al., 2018). Increases in sea levels lead directly to higher probabilities of coastal flood events (Rahmstorf, 2017; Sweet et al., 2017b).
The Mid-Atlantic region lies in a climatic transition zone, between continental and marine climate types, split in the Fourth National Climate Assessment (Jay et al., 2018) between the Northeast (Delaware Bay and upper Chesapeake Bay) and the Southeast (lower Chesapeake Bay) Regions. Mid-Atlantic weather is often dictated by the relative position of the westerly polar jet stream (often times directly above in the winter), flanked by baroclinic instability from warm ocean waters to the east and atmospheric uplift along the Appalachian front to the west (Leathers et al., 1998; Strobach et al., 2018). Coastal flooding is observed year-round from East Coast winter storms (Hirsch et al., 2001), surface high pressure systems (spring to fall) and tropical systems (summer to fall), with a higher percentage of TC-caused extreme flood events in the southern portions of the region (Booth et al., 2016). Although the Mid-Atlantic has been impacted by tropical systems less frequently than some other portions of the U.S., recent tropical cyclones and their associated storm surge and river flooding have caused damages in excess of $80 billion (Smith and Katz, 2013), hundreds of injuries, and loss of life across this heavily populated and economically sensitive region of the country.
Several climatologies of tropical weather systems and their impacts have been completed for the Atlantic and Gulf coast regions of the U.S. (i.e., Simpson and Lawrence, 1971; Landsea and Franklin, 2013; Elsner and Kara, 1999; Muller and Stone, 2001; Xie et al., 2005; Keim et al., 2007; McAdie et al., 2009). Results from these studies (Keim et al., 2007) indicate that the Mid-Atlantic experiences return periods of 4–10 years for any tropical cyclone (including tropical storms and hurricanes), 35–100 years for hurricanes of any strength, and >100 years for Category 3 and above hurricanes. These return periods are significantly longer than other areas along the Atlantic and Gulf coasts of the U.S., due mainly to the inland position of the Mid-Atlantic coastline.
In additions to sea levels, sea-surface temperatures (SSTs) in the equatorial and North Atlantic are also expected to increase under future global warming scenarios, leading to an increase in the number of severe tropical cyclones (Kossin et al., 2017; Knutson et al., 2020). Recent research has also shown trends in tropical cyclone location moving northward, increases in rapid intensification and surface wind speeds, and decrease in translational speed (Kossin, 2018; Knutson et al., 2019; Murakami et al., 2020; Yang et al., 2020). All of these suggest the extreme importance to understand current and past coastal flooding due to TCs.
Numerous studies have utilized storm surge to measure frequency or impact of coastal storms along the US Atlantic Coast (Dolan and Davis, 1992; Zhang et al., 2000; Bernhardt and DeGaetano, 2012; Colle et al., 2015) or globally (Marcos et al., 2015; Mawdsley and Haigh, 2016). However, few have focused on tropical systems occurring in the Delaware and Chesapeake Bays, or the Mid-Atlantic in general.
SURGEDAT is a database specifically designed to store storm surge data. It contains 700 tropical surge events around the world and more than 8,000 unique tropical high water marks along the U.S. Gulf and Atlantic Coasts since 1880, however, only a few records are located in the Mid-Atlantic region (Needham et al., 2015). The USACE North Atlantic Comprehensive Coastal Survey report (US Army Corps of Engineers, 2014) and FEMA Region 3 Coastal Storm Surge Study (Federal Emergency Management Agency, 2013) included many simulated tropical systems in their storm surge modeling work due to the dearth of observational data in the region. Booth et al. (2016) looked at all extreme storm surge events and the relative influence of tropical cyclones for select gauges in the Mid-Atlantic. They found that for large coastal flood events, tropical systems were the most likely cause, whereas for less severe events, the relative importance of tropical systems decreased and extratropical cyclones increased. Wilkerson and Brubaker (2013) investigated the spatial variability of storm surge in the lower Chesapeake Bay over all extreme coastal flooding events but included only a few tropical cyclones. Rashid et al. (2019) looked at interannual and multi-decadal variability of extreme storm surge during the peak extratropical (November – April) and tropical (May – October) seasons. Although they included surges from all types of storm events, they concluded that the Mid-Atlantic region varied differently than the Northeast and Southeast portions of the U.S. Atlantic Coast at long time scales.
The overall goal of the current study is to improve understanding of the magnitude and spatial variability of tropical cyclone-caused coastal flooding in the Delaware and Chesapeake Bays. The first part of the paper focuses on the computation of skew surge at tide gauges for each TC event. Skew surge is not commonly used to assess the surge produced by a storm although it may be a more appropriate measure of risk of storm surge (refer to Section Skew Surge and Harmonic Analysis for more details). The remaining parts of the paper focus on grouping tide gauges with similar skew surge response into sub-bay geographic regions, as well as grouping TCs into clusters that exhibit similar spatial patterns of skew surge. This information will aid in local planning, emergency preparedness, and communication outreach regarding the hazards of coastal storms in the region.
Materials and Methods
Study Region
The Delaware and Chesapeake Bays, connected via the Chesapeake and Delaware (C & D) Canal, surround the Delmarva Peninsula (Figure 1). Both bays are heavily tidally influenced with freshwater inputs from the major river systems of the Delaware River, Susquehanna River, and Potomac River. Tidal water levels are impacted by many environmental characteristics, including the geometry of the coastline, bathymetry, bottom friction/dissipation effects, reflection of the wave near the head of the bay (Lee et al., 2017) as well as prevailing remote winds and ocean currents. Storm surge, while also impacted by these factors, is additionally influenced by characteristics of the storm itself, such as storm size and direction of travel, duration, atmospheric pressure, wind speed and wind direction relative to the coastline (Ellis and Sherman, 2015; National Hurricane Center, 2019). Coastal flood levels in this region are the net effect of numerous complex hydrodynamics at play.
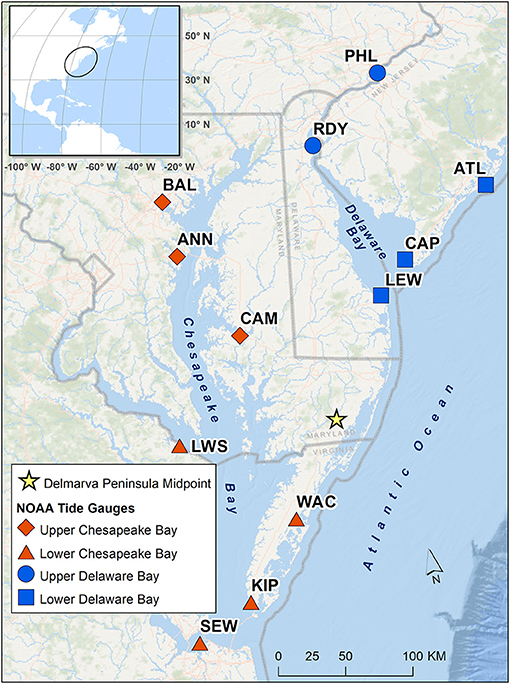
Figure 1. Map of the Delaware and Chesapeake Bays highlighting NOAA tide gauges used in the current study. The inset overview map shows the 750 km circular buffer around the Delmarva Peninsula reference point (yellow star) computed from the mean latitude and longitude of the six ocean coastal gauges: Atlantic City (ATL), Cape May (CAP), Lewes (LEW), Wachapreague (WAC), Kiptopeke (KIP), and Sewells Point (SEW).
The Delaware Bay has a classical funnel shape, width of about 18 km at its mouth between Cape Henlopen and Cape May, expanding to ~45 km at its widest point (Wong and Münchow, 1995), with an average bathymetry of about 7 m, although deep scour in the middle of the lower part of the bay can extend to over 20–25 m (Eagleson and Ippen, 1966; Harleman, 1966; Salehi, 2018). The converging coastlines toward the head of the bay amplifies tides in the northern regions, where the tidal range is over 2 m compared to <1.5 m near the mouth (Lee et al., 2017; Ross et al., 2017). This contrasts with the Chesapeake Bay, a much longer bay, more dendritic in form with many tributaries, ranging in width from 5.6 to 56 km. The Chesapeake Bay is relatively shallow at median depth of about 6 m, with only 18% of its surface area at depths above 12 m, although a narrow navigation channel width depths > 9 m exists along the east side of the main channel (Patrick, 1994; Xiong and Berger, 2010). Tidal range is ~0.7 m in the northern reaches, dipping to 0.3 m at the middle of the bay, increasing to 0.9 m at the mouth (Zhong and Li, 2006; Lee et al., 2017; Ross et al., 2017).
Tidal cycle patterns in this region are mainly semi-diurnal, albeit the tides transition in the Chesapeake Bay from semi-diurnal in the lower portion to a mixed tidal regime in the upper portions, forming a mix of progressive and standing waves throughout the bay system (Xiong and Berger, 2010; Ross et al., 2017). The average seasonal cycle of mean sea level is similar across the bays, a bimodal distribution with the maximum in fall (October) and secondary maximum in late spring (May-June), primarily caused by periodic fluctuations in atmospheric weather systems and coastal water steric effects (NOAA National Ocean Service Center for Operational Oceanographic Products Services, 2020a).
Tropical Cyclone Data
Tropical cyclone information used in this study is extracted from the International Best Track Archive for Climate Stewardship (IBTrACS) North Atlantic Basin dataset Version 4 (Knapp et al., 2018). IBTrACS is a collection of global best track data for cyclones that achieved tropical or sub-tropical status at some point in their lifetime. Data were obtained from multiple research centers around the world and are stored in a centralized location for standardized distribution (Knapp et al., 2010). IBTrACS has been endorsed by the World Meteorological Organization non-government domain Tropical Cyclone Programme as an official archiving and distribution resource for tropical cyclone best track data.
For the current study, TCs were limited to those occurring in the North Atlantic Ocean basin during the time period 1980–2019 with tracks that cross within a 750 km radius circular buffer around the Delmarva Peninsula. Distance to Delmarva was computed as the great circle distance using the GRS80 reference ellipsoid from a reference location along the Delmarva coastline to the TC center listed in each IBTrACS record. The Delmarva coastal reference location (latitude = 38.137778, longitude = −75.416944) was determined by computing the mean latitude and longitude coordinates of the six coastal tide gauges used in the study, namely Atlantic City (ATL), Cape May (CAP), Lewes (LEW), Wachapreague (WAC), Kiptopeke (KIP), and Sewells Point (SEW) (Figure 1; Table 1). The large 750 km radius, relative to the typical size of TCs, was chosen to be sure to capture TCs that could significantly impact water levels (Zhang et al., 2000; Booth et al., 2016). This resulted in a subset of 144 TCs with median annual count of 3.5 TCs. The monthly distribution closely matches, although occurring slightly earlier in the season, the distribution of all North Atlantic TCs (Figure 2). However, the annual percentage of all North Atlantic TCs that are near Delmarva can be quite variable, with a minimum of 5% in 2010 and a maximum of 50% occurring in 1985 and 2004.
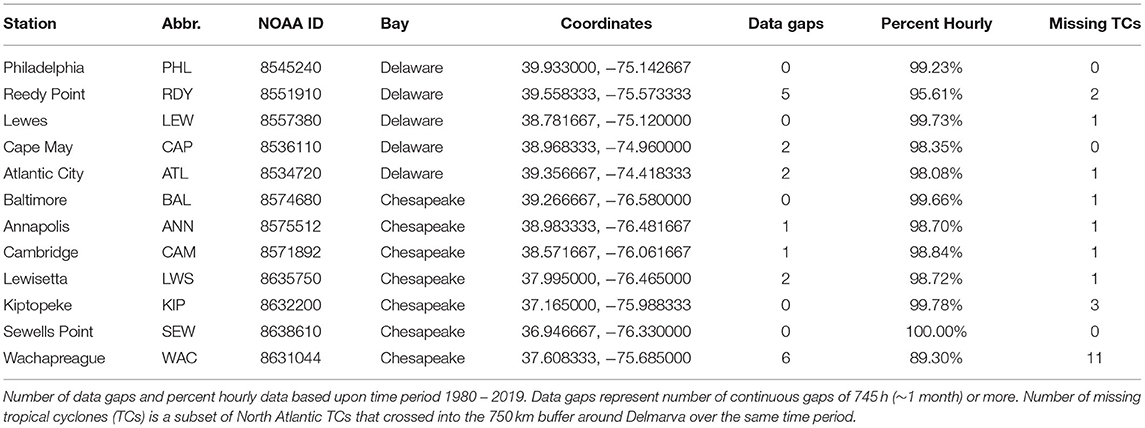
Table 1. Tide gauges used in the current study.
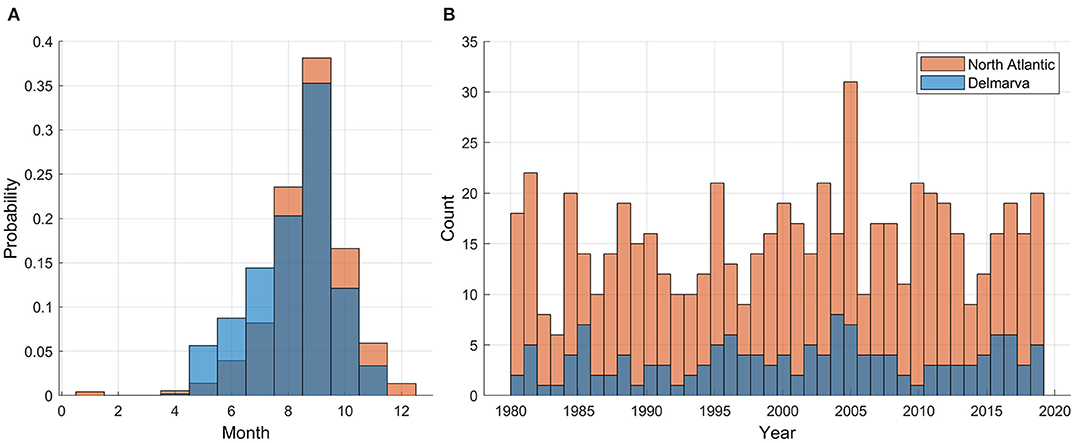
Figure 2. Monthly (A) and annual (B) distribution of all 1980 – 2019 North Atlantic tropical cyclones and the subset of those whose track crosses the 750 km buffer around Delmarva Peninsula.
IBTrACS notes the original source of information for each storm record. The data source for all the selected TCs from 1980 through 2018 is the U.S. National Hurricane Center (NHC) Hurricane Database 2 (HURDAT2) (Landsea and Franklin, 2013). TCs from the 2019 season were listed as NHC provisional status and likely were the operational best track estimate (i.e., have not yet been reanalyzed post-season). Specific data retained from the IBTrACS dataset include the TC name and storm ID, center latitude and longitude, date and time, and storm status (e.g., hurricane, tropical storm, and tropical disturbance). Although HURDAT2 records correspond to 00, 06, 12, and 18Z times, IBTrACS interpolates many variables to 3-hourly observations using splines for positional data or linearly for non-positional data. GIS shapefiles of storm tracks were also obtained from IBTrACS.
Water Level Data
Tide gauges selected for this study were limited to NOAA operational tide gauges in and immediately around the Delaware and Chesapeake Bays. Requirements were that the gauge maintained nearly continuous record of hourly water levels for the time period 1980–2019, evenly located throughout the region, a set of harmonic constituents identified for making tidal predictions, and a vertical tidal datum conversion factor to North American Vertical Datum of 1988 (NAVD88). In all, 12 gauges were selected; five associated with the Delaware Bay and seven with the Chesapeake (Figure 1; Table 1). All selected gauges are part of NOAA NWLON and PORTS networks.
Hourly and High/Low water level data were downloaded from NOAA Center for Operational Oceanographic Products and Services (CO-OPS) API for Data Retrieval (NOAA National Ocean Service Center for Operational Oceanographic Products Services, 2020b). High/Low data represent the exact time and magnitude of each Higher-High, High, Low, and Lower-Low tidal peak. Hourly data represent the observed water level on each hour (e.g., 21:00, 22:00). The 40 years of hourly data at each gauge were manually inspected for errors and inconsistencies. Small periods of data clusters (2–16 h) were removed from the hourly time series (on seven occasions across all gauges) that existed within larger time periods of missing data to better represent the number and length of existing data gaps. No data from the High/Low time series were removed. Data gaps of 1 or 2 h (<10 across all gauges) were filled using linear interpolation. Larger data gaps were not filled. Table 1 lists the number of data gaps that spanned 745 h (~1 month) or greater as well as the percentage of valid hourly data points. Reedy Point and Wachapreague had the highest number of large data gaps, five and six, respectively, and lowest percentage of valid hourly data (based on a maximum of 14,610 h during 1980 – 2019), 95.61 and 89.30%, respectively. Water level records were compared against the dates of the TCs while within the 750 km buffer of Delmarva. Very few of the 144 TCs were missing from the water level records. Wachapreague had the largest amount of missing data due to a 2.5-year period (200,511–200,804) when valid Hourly and High/Low data were unavailable.
Skew Surge and Harmonic Analysis
This study uses skew surge as the measure of flooding contributed by each tropical storm. Skew surge is defined as the difference between the maximum observed total water level and the maximum predicted tidal level during a tidal cycle, even if the observed and predicted tidal peaks are offset (i.e., skewed) from each other (Figure 3; Pugh and Woodworth, 2014). Each tidal cycle therefore has one value of skew surge. By measuring the height of water levels above highest predicted tide, skew surge represents the increase of water levels more clearly separated from the astronomically forced-tides and tide-surge interactions (Batstone et al., 2013; Mawdsley and Haigh, 2016; Williams et al., 2016; Stephens et al., 2020). With respect to preparedness, skew surge represents a truer estimate of the amount of water a location observes above what they expected from high tides alone. Hourly non-tidal residual (NTR, the difference between coincident total water level and predicted tide) is a more common measure of storm surge. However, the statistically computed hourly NTR includes known and unknown non-linear interactions between tides and low-frequency surge produced by a storm, which are complex and dependent upon many environmental factors (Bernier and Thompson, 2007; Spicer et al., 2019). As well, often during coastal flooding storm events, the maximum NTR does not coincide exactly with predicted high tide peak e.g., Hurricane Ernesto 2006 at Sewells Point and Hurricane Sandy 2012 at Reedy Point tide gauges had their largest residuals occur near predicted low tide. Overall, skew surge is less dependent upon tide-surge interactions and independent of tidal phase, proving to be advantageous in developing joint probability estimates of extreme water levels for long-term planning, and therefore less prone to misleading conclusions drawn from NTR estimates of surge (Williams et al., 2016).
Figure 3. Diagram of skew surge during a tidal cycle. In the above example, the total water level and predicted tide peaks are skewed from one another. The maximum hourly non-tidal residual occurs closer to low tide than to high tide (Source: Mawdsley and Haigh, 2016).
Predicted tides were computed at each gauge through harmonic analysis based on hourly total water level time series using the U-Tide Matlab software package (Codiga, 2011). Harmonic analysis incorporated the set of 37 harmonic constituents defined by NOAA for their official tide predictions in this region (NOAA National Ocean Service Center for Operational Oceanographic Products Services, 2020c). This set of 37 constituents are based on known astronomically-cyclic motions of the Earth-Sun-Moon system and local resonances due to water depth and geomorphology of the region that are tidally significant; other tidal constituents were either too small a magnitude or too long a period (i.e., multiple years) to significantly alter daily tidal predictions (NOAA, 2019). Additionally, the seven constituents noted by Harris (1991) relevant for US East Coast water levels were included in the harmonic analysis. The same set of 44 constituents were used for all tide gauges. A lowpass filter was not applied to the hourly NTR as this could also remove meteorological forcing on water levels at these frequencies, which occur when tropical systems move quickly through the Mid-Atlantic region on the order of a tidal cycle or less.
Harmonic analysis was performed in 1-year segments over each calendar year (Jan – Dec) instead of on the full 40-year time period simultaneously. For time periods with data gaps of 1 month or larger, the harmonic analysis was performed on a 3-year period, centered on the year with most missing data, to ensure capture of the seasonal variation. Annual computations minimizes timing errors that can lead to the leakage of tidal energy into the non-tidal residual (Merrifield et al., 2013) and minimizes the impact of sea-level rise as the increasing trend is absorbed into the model through the annual mean. Moreover, a 40-year analysis would have resulted in harmonics fit to average conditions and therefore would not account for changing constituent magnitudes that could result from deepening water level or other changing environmental conditions (Ross et al., 2017). Similarly, the Sa (solar annual) and SSa (solar semi-annual) constituents' periods of ~12 and 6 months, respectively, are largely influenced by seasonal weather conditions and storm tracks, leading to high interannual variation; harmonic analysis tests without these two constituents resulted in large discontinuities between adjacent years.
Over each tidal cycle, the maximum of the observed TWL peaks between the High/Low and hourly time series was aligned with predicted tide peaks within +/- 3 h of each other. The time offset was extended to +/- 6 h if no High/Low or TWL peaks were found within +/- 3 h (this was required for < 100 tidal peaks across all gauges over the study time period, and occurred only for gauges within the Chesapeake Bay). Total resultant count was 28,231 tidal peaks per gauge for 1980–2019. The difference between the maximum observed TWL and maximum predicted tide level over each tidal cycle was computed as skew surge.
Daily Weather Maps provided by the NOAA Central Library Data Imaging Project (Ritterbush, 2012) were reviewed alongside observed water levels during the approach to Delmarva of each of the 144 TCs. A time window was manually identified that encapsulated each TC's likely direct influence on water levels within our study region, with a priority to capture the maximum tidal peaks. A tidal peak is defined in this study as the point of high tide within each tidal cycle, and the maximum tidal peak is the high tide with the maximum water level around each TC. Since observed high tides can occur a few hours before or after the predicted high tide, the time of the tidal peak is defined here as the time of the predicted high tide. It often occurred that winds from surface high pressure systems and/or mid-latitude cyclones and associated fronts were influencing water levels in one or both of the bays coincidentally with the approach of the TC. NHC Tropical Cyclone Reports were also consulted for TCs from 1994 to 2019, as necessary (National Hurricane Center, 2020). In cases where a suitable time window without other identifiable weather systems could not be determined, the TC was removed from further analysis. TCs that seemed to have little to no effect on water levels (e.g., they were far away from Delmarva) were left in the analysis provided that no other weather system was noticeably impacting the study region at that time, resulting in a near-zero (slightly positive or negative) skew surge for some storms. Although there is potential for false-positive errors (i.e., removing a TC that should remain), this method provides a more conservative approach to assessing surge levels and spatial variability specifically attributed to tropical cyclones.
Median time window was 24 h before and 18 h after the TC's closest approach to Delmarva, although in rare cases the window was extended to several days. Ultimately, 38 TCs were removed from the analysis, leaving a total of 106, ~2.6 per year on average. For the remainder of this study, this subset of storms will be referred to as Delmarva TCs. Maximum skew surge and maximum TWL (“storm tide”) at all tidal peaks occurring within each Delmarva TC's time window were extracted. Storm tides and skew surges were detrended about the mean and normalized by the standard deviation over all 1980 – 2019 tidal peaks at each gauge independently. The detrending and standardization allows for a more direct spatial and temporal comparison of the relative influence of each storm. The detrended, normalized storm tide and skew surge are referred to as the storm tide index (STI) and skew surge index (SSI), respectively.
Distributions of skew surge and SSI values from TCs were computed at each tide gauge over all Delmarva TCs (N = 106). SSI was then compared to STI for each storm using Spearman Rank correlation. Spearman Rank correlation, a non-parametric method, was chosen over the Pearson Product-Moment method to compute correlations considering TC-caused skew surges (as well as storm tides and the normalized, detrended indexes) do not follow a Normal distribution (refer to section Delmarva Tropical Cyclone Storm Tide and Skew Surge Summary). Correlations were computed for skew surge against maximum NTR for each storm. Skew surge instead of SSI was chosen for this comparison as the NTR time series was not detrended or normalized.
SSI was also compared to the distance of each Delmarva TC's closest approach to the Delmarva Peninsula, regardless of the storm's track direction of movement. Influence of distance on storm surge is compounded by storm size, strength of winds, direction of winds, direction of storm movement, and the location of the tide gauge relative to the storm's direction (e.g., the right or left front quadrant of the TC). The only storm-specific characteristic used in the current study is the location of the TC storm track, and many of the other relevant characteristics are not available in IBTrACS for the full 40-yr time period (most only since 2004). It is not the intent of this study to determine which of these variables are most important to storm surge. However, the distance away of the storm track is often cited and frequently used in storm preparation and awareness campaigns.
Regional Skew Surge
Since each gauge location has unique tidal characteristics (e.g., mean sea level, tidal range), the STI and SSI derived for each Delmarva TC were averaged over all gauges within each bay. The gauges at Atlantic City and Wachapreague were included with Delaware Bay and Chesapeake Bay, respectively, as listed in Table 1. This allowed for a distinct measure of TC-based water levels per bay for each storm with equal relative weights across gauges. Missing data were ignored in the averaging as no storm had more than one gauge with missing information.
To investigate sub-bay geographic variability, cross-correlations and Principal Components Analysis (PCA) were performed on the STI and SSI to identify tide gauges with similar responses. Cross-correlations were computed using Spearman Rank coefficient. PCA with variable clustering was run on the STI and SSI to aid in grouping of gauges into like regions. Sub-bay regions are defined as groups of adjacent tide gauges with higher correlations with each other than with gauges immediate outside their group. STI and SSI for each storm were then averaged across gauges that lie within the identified sub-bay regions. Distributions and cross-correlations among regions were also computed. Each Delmarva TC was then ranked based on mean SSI for each bay and sub-bay region. Storms that were highly ranked in one region/bay as opposed to the others were noted.
Additionally, K-Means clustering was run on the Delmarva TC spatial pattern of SSI across all 12 tide gauges, from upper Delaware Bay to lower Chesapeake Bay. The spatial pattern of SSI is termed the “surge profile” of the storm. JMP Pro 15 statistical software was used to perform the clustering. K-Means is an unsupervised clustering technique that aggregates vectors of data (in our case, each storm's 12 data points of SSI at each gauge) into common sets based on each vector's (i.e., storm's) distance to a set number (K) of means in each dimension. The mean of each dimension is moved upon each pass of the algorithm to minimize the cumulative distance of each vector to its cluster mean. Although K-Means is sensitive to the sort order of the input data, several tests of different sort orders resulted in very similar clustering of storms. The cubic clustering criterion score was used to determine the optimum number of clusters. To determine if a storm's surge profile is associated with the location of its track though the Delmarva region, storm tracks were plotted for all storms within each K-Means cluster. A qualitative (rather than quantitative) assessment was performed on the storm's track position relative to the surge profile.
Results
Delmarva Tropical Cyclone Storm Tide and Skew Surge Summary
Mean storm tides over all Delmarva TCs (Table 2) range from a minimum of 0.48 m at ANN to a maximum of 1.36 m at PHL. Higher storm tides are observed in the Delaware Bay than in the Chesapeake Bay as well as in upper bays compared to the lower bays. This geographic pattern in storm tides nearly identically (r = 0.99) matches the pattern of the MHHW tidal datum currently published by NOAA. After detrending and normalization, the relationship of STI to MHHW flips to a strong negative relationship (r = −0.61). Largest STI values are in the Chesapeake over the Delaware Bay, and in the lower bays over the upper bays. PHL and RDY have the highest mean storm tides but lowest mean STI. Relationship of storm tides to MSL is similar as to MHHW albeit weaker (r = −0.39).
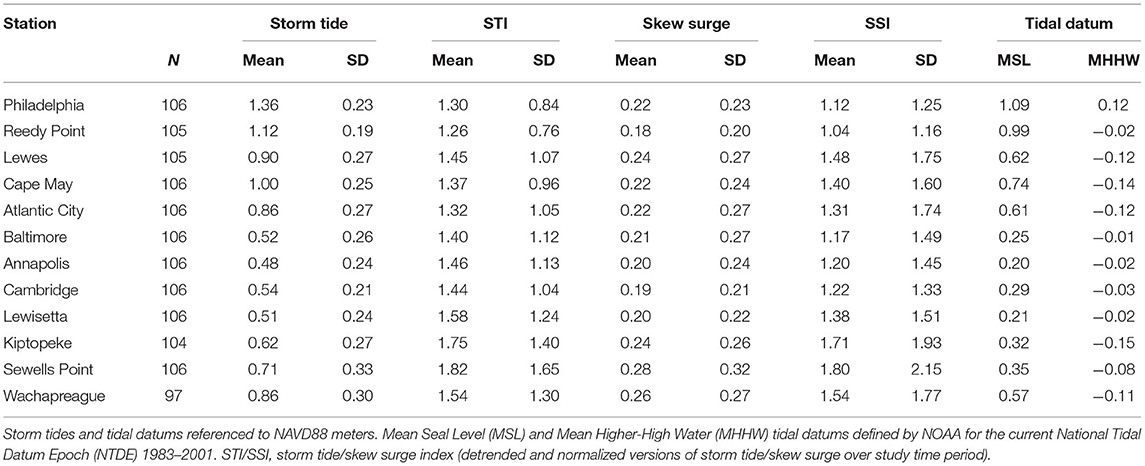
Table 2. Mean and standard deviation of storm tide and skew surge of Delmarva tropical cyclones, 1980 – 2019.
Mean skew surges are more consistent geographically than storm tides, showing very little change across the study region, although the standard deviations and range are similar to storm tides at only 1/2 to 1/6 of the magnitude of the mean. Higher mean skew surges are toward the extreme upper and lower ends and smaller means toward the middle of each bay, ranging from a minimum of 0.18 m at RDY to a maximum of 0.28 m at SEW. Mean skew surges show very little relationship to MHHW and a negative relationship to MSL (r = −0.42). After detrending and normalization, the relationship of SSI to MHHW and MSL stayed negative but strengthened (r = −0.35 and −0.67, respectively). Larger mean SSI values are found in the lower bays over the upper bays, and in the Chesapeake Bay over the Delaware Bay.
Distribution of skew surge for the Delmarva TCs do not follow a Normal distribution, confirmed by Anderson-Darling test statistic (Figure 4). Shape of the distributions show the typical characteristics of upper tail (extreme values) portion of a normally distributed population, asymmetric right-skewed with a greater number of outliers on the upper end than the lower end. Storm tide distributions (Supplementary Figure 3) are more evenly distributed but still show a skewed upper end tail (Box plots of these distributions are shown in Supplementary Figure 4). Many studies have shown extreme high coastal flood levels from tide gauges follow similar extreme value distributions (Tebaldi et al., 2012; Sweet et al., 2014; US Army Corps of Engineers, 2014; Marcos et al., 2015; Moftakhari et al., 2015; Booth et al., 2016; Rashid et al., 2019). The larger population of tidal peak maximum TWL and skew surge (1980–2019, N = 28,231) from which the Delmarva TC-based storm tides and skew surges were extracted, did indeed closely follow the Normal distribution over the long-term once detrended. The steepest curves (i.e., highest probability of smaller surges) occur in the upper bays except for the most north gauges in each bay, namely PHL and BAL, The detrended and normalized STI and SSI distributions for each gauge (not shown) hold essentially the same characteristics except with the expected shifted means and deviations.
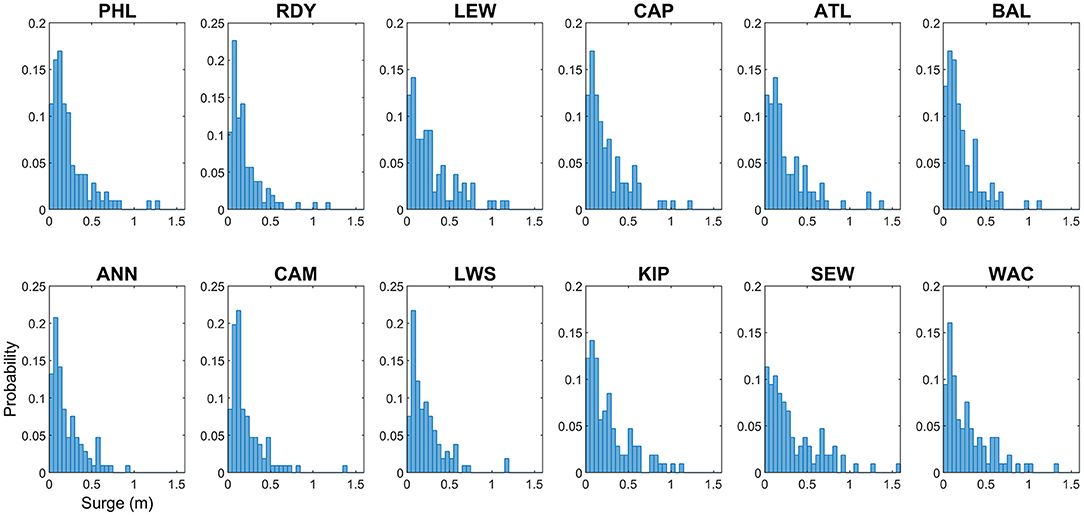
Figure 4. Probability distribution of skew surge (meters) for Delmarva tropical cyclones, 1980 – 2019.
SSI exhibits a strong, positive relationship to STI at all tide gauges (Figure 5). Correlations are consistent among sites within each bay, with Delaware Bay at 0.70 – 0.76 and Chesapeake Bay showing higher correlations at 0.82 – 0.89. Sites in the lower bays demonstrate slightly more scatter than in the upper bay, although correlations at all sites are statistically significant at the p = 0.01 level. The amount of scatter represents the number of storms with larger relative differences between storm-produced surge and total water level. Hurricane Isabel 2003 is the extreme event in the upper Chesapeake Bay as it produced significantly larger skew surge and storm tide than other storms.
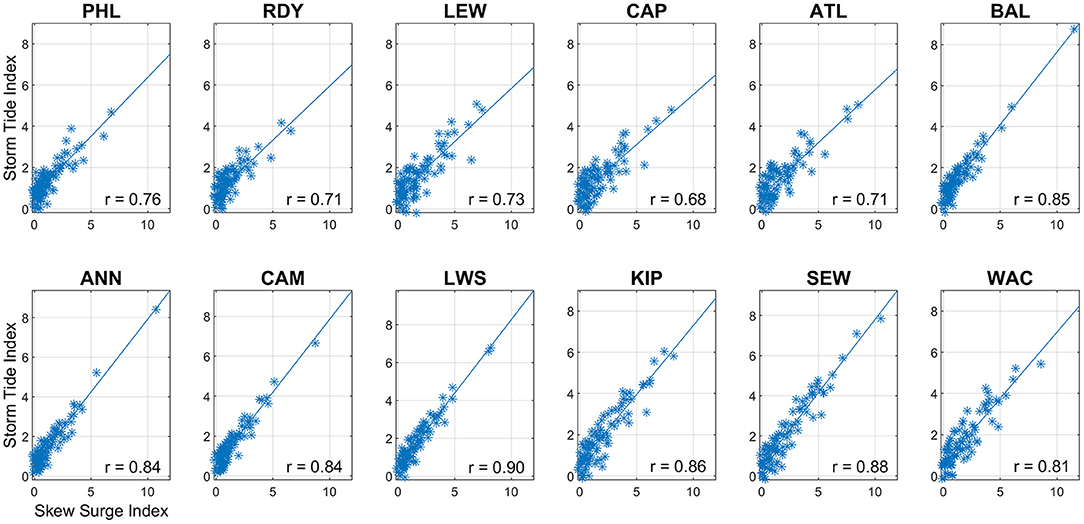
Figure 5. Scatterplot, least-squares regression line, and correlation coefficient of skew surge index (SSI) against storm tide index (STI) for Delmarva tropical cyclones, 1980 – 2019.
Similarly, skew surge exhibits a strong, positive relationship to maximum NTR (Figure 6). Correlations at all sites are statistically significant at the p = 0.01 level. The diagonal dashed line represents one-to-one ratio. Deviations from this line denote storm events when maximum residual occurred at tidal phases other than at tidal peaks. Largest differences occur during the largest skew surge events at the upper Delaware Bay sites, which also have the lowest correlations and relatively broad scatter, even at low surge levels. Over a single tidal cycle, skew surge must be equal to or less than maximum NTR, by definition, however during a storm event that covers multiple tidal cycles, this does not necessarily need to be the case. In our analysis, across all storms and gauges, skew surge was greater than maximum NTR by more than 1 cm only about 25 times, with a maximum difference of ~4 cm.
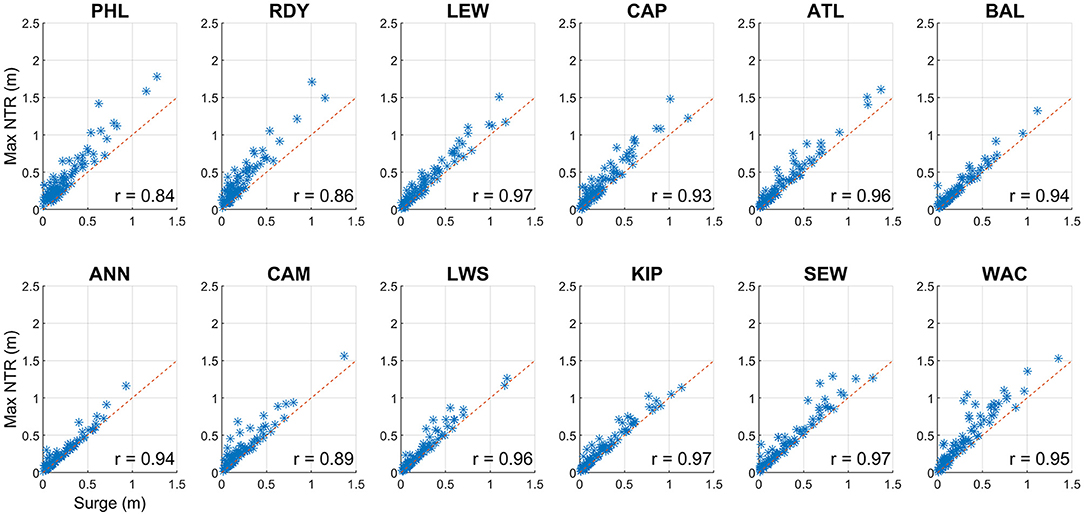
Figure 6. Skew surge against maximum hourly non-tidal residual (NTR) for Delmarva tropical cyclones, 1980 – 2019. Values in meters. Dashed red line represents to 1:1 ratio.
An inverse relationship is evident between SSI and distance to TC closest approach, with correlations ranging from r = −0.26 at SEW to r = −0.37 at both LEW and CAP (Supplementary Figure 5). Highest correlations are in lower Delaware Bay and lowest correlations in the lower Chesapeake Bay. Although correlations are statistically significant at the 0.01 level, there is broad scatter and several outliers. Similar SSI amounts, especially at lower surge levels, were produced by storms from nearly all distances.
Sub-bay Regionalization
Cross-correlations on SSI and STI produced from Delmarva TCs across all 12 tide gauges showed strong regional relationships (Figure 7 and Supplementary Tables 1, 2). Natural groupings of gauges of r = 0.88 and above (red regions in Figure 7) emerge within the same geographic regions. Strong distinctions can be noted between gauges in the upper bay and lower bay regions. PCA with variable clustering was run on the SSI and STI (results not shown) and supported results from the cross-correlation analysis. Results indicate regions as: Upper Delaware Bay (PHL, RDY), Lower Delaware Bay (LEW, CAP, ATL), Upper Chesapeake Bay (BAL, ANN, CAM), and Lower Chesapeake Bay (KIP, SEW, WAC). Observations at LWS showed similar correlations with gauges in both the upper and lower Chesapeake Bay regions and had the lowest correlations with gauges in its immediate vicinity. Hence, LWS was not assigned to any sub-bay region. Cross-correlations run on long-term daily maximum skew surge and TWL for 1980–2019 (results not shown) support the same geographic regions. Although not in the same geographic region, LEW correlates highly with gauges in the lower Chesapeake Bay, while WAC correlates highly with gauges in the lower Delaware Bay.
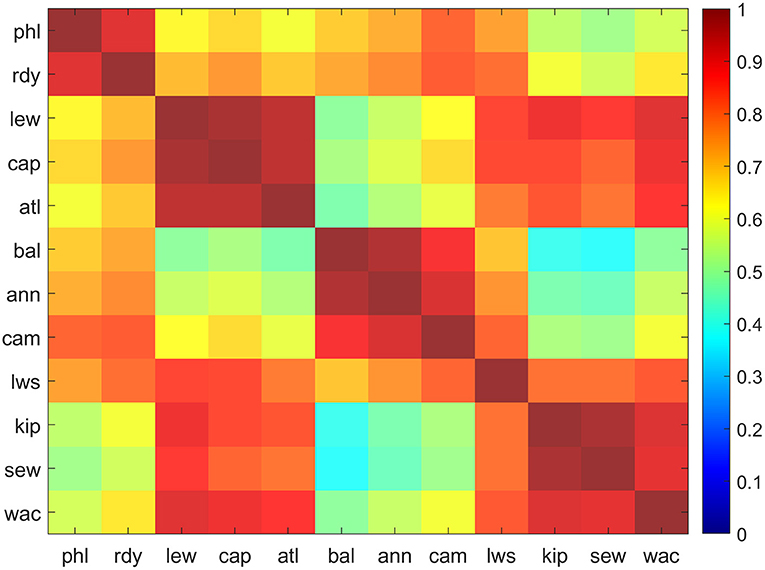
Figure 7. Corrgram of cross-correlation of skew surge index (SSI) for Delmarva tropical cyclones, 1980 – 2019. Correlation values computed using Spearman Rank method. Red (blue) colors represent higher (lower) correlations. Regions of gauges with similar correlations are easily identifiable as adjacent, like colors. All correlations are statistically significant at 0.01 level.
SSI values were spatially averaged across each of the sub-bay regions for each Delmarva TC. The Chesapeake Bay regions have higher mean SSI values than the corresponding Delaware Bay regions, and the lower bay regions have higher mean SSI than upper bay regions. Most notably, the lower bay regions have higher correlations to each other than to their respective upper bay regions, and likewise for the upper bay regions. Relationship between the Upper and Lower Chesapeake regions show the lowest correlation of any pair of groups (r = 0.50).
Distributions of regional mean SSI (Supplementary Figure 6) do not follow a Normal distribution, confirmed by Anderson-Darling statistic, but are more closely related to extreme value distributions similar to distributions of tide gauges. Upper bays experience a steeper, more uniform decline than lower bays, although all regions include outlier storms in the far upper end. Additionally, regional SSI against STI showed similar behavior as tide gauge analysis. Most of the deviations occur at the lower SSI values and the upper bays have slightly more scatter than lower bays. Chesapeake Bay shows higher correlations of SSI to STI (r = 0.86 in both upper and lower Bay regions) than does Delaware Bay (r = 0.73 and 0.72 for the upper and lower Bay regions, respectively).
Top Surges of Delmarva Tropical Cyclones
SSI values were spatially averaged over all gauges within each bay boundary (i.e., LWS was included for the Chesapeake Bay; ATL and WAC were not included for either bay) for each Delmarva TC (Figure 8). As noted earlier, large variations exist although most storms have mean SSI values under 2. Larger events typically have mean SSI values between 2 and 7. Mean SSI across all storms are 1.31 and 1.42 for the Delaware and Chesapeake Bays, respectively. Although many storms have similar mean SSI for each bay, especially for the smaller surge events, some stand out for their differences. Hurricanes Isabel (2003) and Fran (1996) impacted the Chesapeake more than the Delaware Bay by the largest margin, whereas likewise, Hurricanes Gloria (1985) and Sandy (2012) impacted the Delaware more than the Chesapeake Bay. The top 10 Delmarva TCs with the largest differences in mean SSI are listed in Supplementary Table 3.
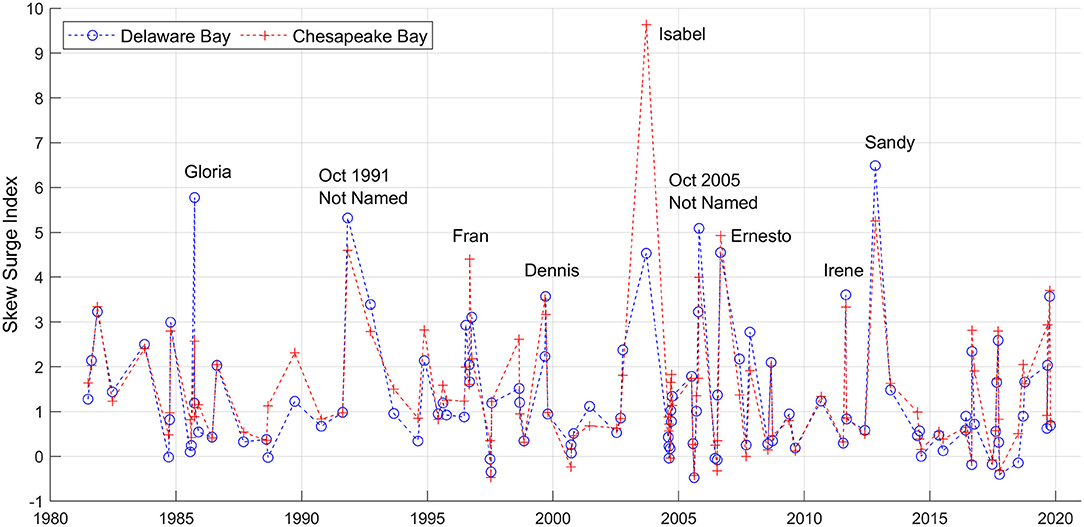
Figure 8. Skew surge index (SSI) of Delmarva tropical cyclones, 1980 – 2019, spatially averaged over the Delaware (blue) and Chesapeake (red) Bays.
The top 25 Delmarva TCs were ranked by mean SSI for each bay (Table 3). The year and month represent the time of the storm's closest approach, the great majority occurring in September and October. Status column represents the most common value of the IBTrACS USA_STATUS attribute while the storm was present within the 750 km buffer around Delmarva, including times before and after the storm's closest approach. Both bays have many top storms in common, notably Hurricanes Sandy (2012), Isabel (2003), and Not Named (1991), claiming 3 of the top 5 spots in each bay.
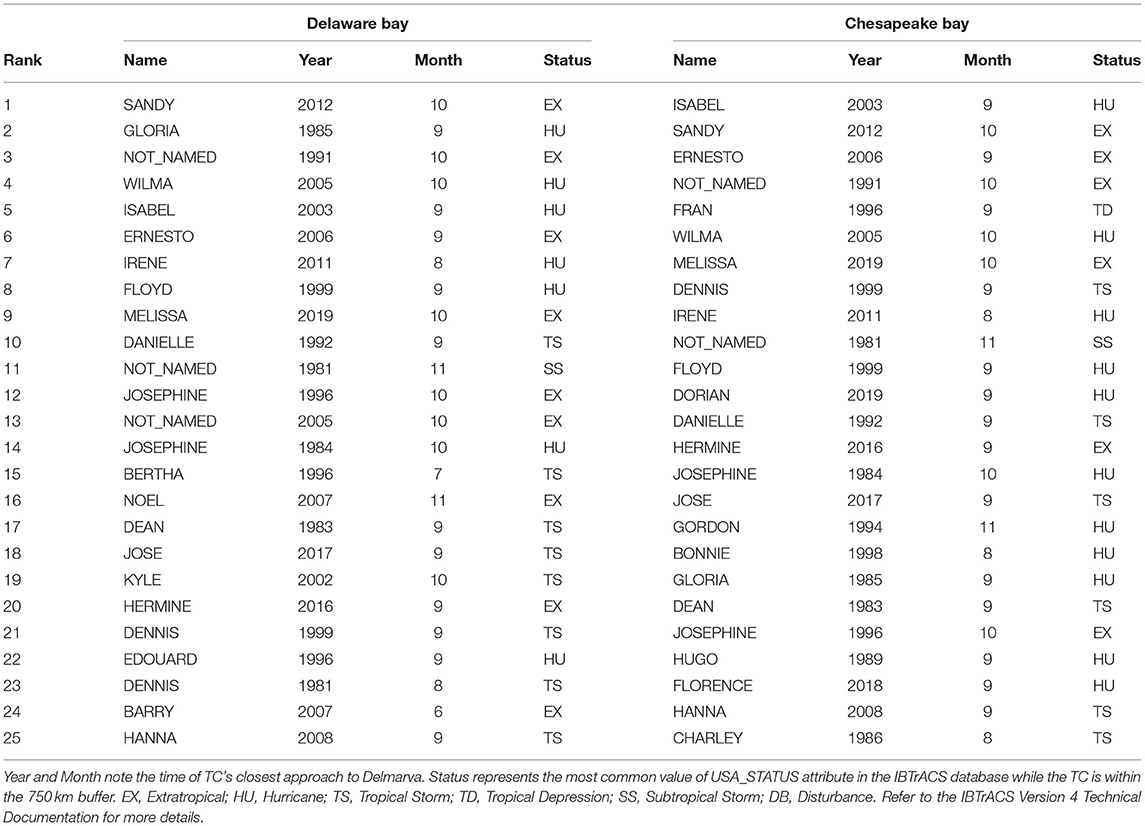
Table 3. Top 25 Delmarva tropical cyclones, ranked by skew surge index (SSI), spatially averaged over the Delaware and Chesapeake Bays, 1980 – 2019.
Delmarva TCs also show significant sub-bay regional differences. Supplementary Tables 4, 5 list the top 25 Delmarva TCs ranked separately for each of the four sub-bay regions. Surprisingly, Hurricane Isabel (2003) was the top ranked storm for the Upper Delaware Bay although it is typically known as a Chesapeake Bay flood event. Hurricanes Hugo (1989), Fran (1996), and Hanna (2008) produced higher surges in upper bays than lower bay regions (Supplementary Figure 8), whereas Hurricane Gloria (1985), Not Named (1991), and Hurricane Irene (2011) produced higher surges in the lower bay regions. (Note that Not Named (1991) may be better known as the Halloween Blizzard of 1991 or The Perfect Storm of 1991).
Spatial Patterns of Skew Surge
Analogous to grouping tide gauges based on their cross-correlations of SSI, the Delmarva TCs were grouped using the K-Means clustering algorithm based on their spatial pattern and magnitude of SSI (i.e., surge profile) throughout the study region. Only Delmarva TCs with valid surge data at all 12 tide gauges (N = 93) were used as input to the clustering algorithm. Numbers of clusters from 3 to 15 were tested with 13 clusters ultimately chosen based on the cubic clustering criterion score. Each cluster of TCs represents a unique combination of magnitude and pattern of variability of SSI. Six of the clusters contained a single TC and another contained only two TCs; these were typically the TCs with largest SSI magnitude or differences between upper and lower bays. Individual clusters with similar profiles were manually plotted together into a series of six panels. Figures 9A–F displays surge profiles from all Delmarva TCs used in the cluster analysis, with like colors in each panel representing individual clusters. Storm tracks associated with the TCs in each of the clusters were also mapped accordingly in six panels in Figures 10A–F. Although the grouping of clusters into each panel was a manual process done primarily for visualization purposes, the grouping in panel A was based on SSI magnitude whereas the grouping in panels C through F was based on SSI variability.
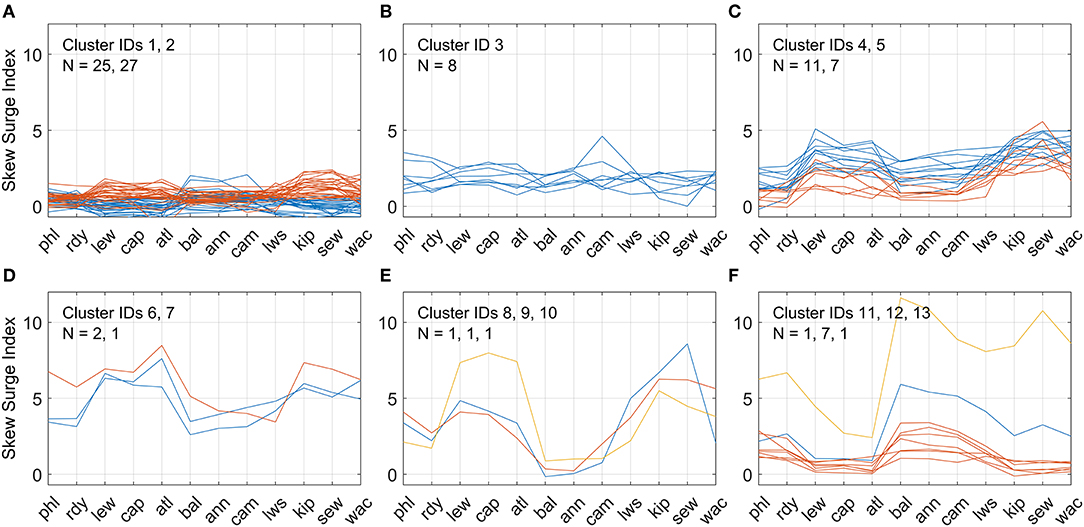
Figure 9. (A–F) Clusters of skew surge index (SSI) spatial profiles of Delmarva tropical cyclones, 1980 – 2019 based on K-Means clustering algorithm. In all, 13 clusters were identified K-Means and manually combined into six panels based on magnitude and spatial variation for visualization purposes. Like colors within each panel represent TCs within a single cluster, with blue, orange, and yellow representing the first, second, and third cluster listed in each panel, respectively. N represents the number of TCs per cluster.
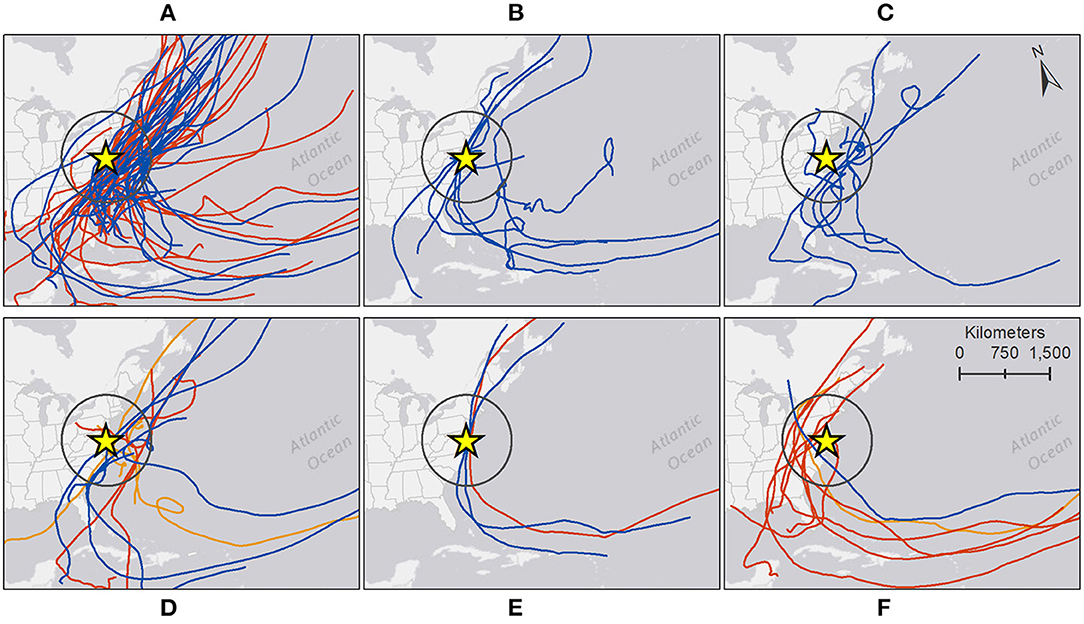
Figure 10. (A–F) Individual tracks of Delmarva tropical cyclones, 1980 – 2019, for each of the clusters identified by the K-Means algorithm on the skew surge index (SSI) profiles. Each map panel corresponds to the same panel of SSI profile plots in Figure 9. Colors of each cluster also match those in Figure 9.
Clusters 1-2 (panel A) include TCs with the lowest overall SSI magnitude (generally less than 2) and minor spatial variation. Cluster 2 has larger SSI values and is out of phase from cluster 1 in regards of upper vs lower bay SSI values. Cluster 3 (panel B) has slightly larger SSI values but less variation than clusters 1 and 2. Clusters 4–5 (panel C) also have higher SSI values but also more noticeable variation, with larger values in the lower bays than upper bays. Storm tracks for the great majority of these TCs are positioned either to the east of or directly over Delmarva. Two TCs plotted in panel C were exceptions, Dennis (1999) in Cluster 4 and Florence (2018) in cluster 5. Both had close approaches to the south of Delmarva raisin water levels in the Delaware and Chesapeake Bays before changing direction traveling west/northwest, before curving north and passing the study region on the west side.
Clusters 6–7 (panel D) and 8–10 (panel E) include TCs with large SSI magnitudes in the lower bays and greater variation, with clusters 8–10 showing anomalously low SSI values in the upper Chesapeake Bay. Each of these clusters contained a single TC, except for cluster 6 which contained two TCs. The three TCs in clusters 6–7, Hurricanes Sandy (2012), Wilma (2005), and Not Named (1991), were all large, late-season TCs that transitioned to ETCs and whose tracks were east of Delmarva. Similarly, the three TCs in clusters 8–10, Hurricanes Gloria (1985), Floyd (1999), and Irene (2011), have nearly identical tracks passing directly over Delmarva in a more south-to-south direction. Lastly, clusters 11–13 (panel F) include TCs that show higher SSIs in the upper bays than in the lower bays. Cluster 12 shows the lowest overall SSIs of the three, similar to cluster 1. Tracks of most of these TCs pass to the west of Delmarva, most notably Hurricanes Isabel (2003) and Fran (1996), which produced the largest and second largest SSI, respectively, in the upper Chesapeake Bay.
Discussion
The goal of the current study is to quantify the magnitude and regional differences of skew surge in the Delaware and Chesapeake Bays from tropical cyclones rather than the more common flood events due to extra-tropical cyclones (ETCs). Although future increases are projected in the number of major TCs and TC intensification (Kossin et al., 2017), the exact response of ETC cyclogenesis and frequency under global warming is still unclear. TCs make up a significant portion of the top flood events and receive much attention in research activities, emergency preparation action, and public awareness campaigns. Our focus was not to examine the storm-specific characteristics (e.g., storm size, atmospheric pressure, wind speed and direction) that contribute to storm surge but rather focus on the net effect of all of these, which is the ultimate metric to use from a risk management perspective.
Since skew surge is used in this study rather than maximum NTR, surge values for a particular storm may not match previous reports, such as in NOAA's NHC Tropical Cyclone Reports (National Hurricane Center, 2020). Maximum NTR can be a reliable indicator of storm surge in areas without significant tide-surge interaction, such as open coastal locations on the US Atlantic Coast (Zhang et al., 2000; Bernier and Thompson, 2007; Mawdsley and Haigh, 2016). This was tested on the Delaware and Chesapeake Bay gauges using Quantile-Quantile (Q-Q) plots and two-sample Anderson-Darling tests. These were run on the NTR during four different tidal phases: High Tide (+/- 1.5 h from high tidal peak), Falling Tide, Low Tide (+/- 1.5 h from low tidal peak), and Rising Tide. As examples, Supplementary Figures 1, 2 show plots for LEW and PHL. None of the gauges in our study appear to exhibit significant tide-surge interaction, in agreement with previous studies.
Closer inspection of the NTR time series did reveal small oscillations at tidal frequencies. Low-pass filters designed to remove these components could be applied to the NTR time series (Shirahata et al., 2016), however, filters can easily decrease amplitude of the signal and care must be taken to not remove water level oscillations (e.g., surge) caused by TCs moving quickly through the region. Additionally, for TCs with durations of multiple tidal cycles, maximum NTR often occurs over low predicted tide, and not indicative of amount of flooding over the next (or previous) high tide. Hence, maximum NTR is dependent upon numerous factors, and perhaps not as reliable (Batstone et al., 2013) or useful (Williams et al., 2016) an estimate of meteorological component of increased sea level as skew surge.
Figure 6 shows very high correlation coefficients between skew surge and max NTR for Delmarva TCs. High correlations values indicate how well-skew surge and max NTR are linearly related, not necessarily how close they are in magnitude. Across all gauges and Delmarva TCs, maximum NTR is greater than skew surge by 10 cm or more for 29% of events, and by 20 cm or more for 11.5% of events, most prominently at the upper Delaware Bay sites. This difference in timing could be indicative of tide-surge interactions or other phenomena occurring in this region but is beyond the scope of this paper. Large differences at large surge levels can lead to misinterpretation and potential overestimation of the amount of flooding from major, usually well-publicized, storms.
Due to the geomorphology and bathymetry of the region, tides are higher and exhibit wider range in the upper Delaware Bay than in other regions. Delmarva TC storm tides in the upper Delaware Bay were accordingly the highest in the study region (Table 2). Interaction of tides and surge, in addition to spatially variable relative sea-level rise, are complex yet play a large role in the amount coastal flooding a location observes. Detrending and normalizing storm tides and skew surges removes this influence, allowing for a better comparison of gauges over space and of storms over time. Gauges in the upper Delaware Bay resulted in the lowest STI, potentially meaning that the relative coastal flooding due to TCs is least in the upper Delaware Bay and most in the lower Chesapeake Bay. Likewise, STI shows a strong negative correlation to MHHW, decreasing relative influence of TC flooding in areas of higher tides.
The same concept holds true for storm surge. Results in Tables 2, 4 show that the Chesapeake Bay regions experience higher relative surges from TCs than the Delaware Bay. Likewise, the lower bays experience higher relative surges from TCs than do the upper bays. Relative influence of TC surge is expected to increase toward the south and east. TCs that stay just offshore, keeping Delmarva sites in the front left quadrant, bring strong southeast and east winds as they travel north/northeast direction, pushing water directly on the ocean coast an into the bays. As they pass, northwest winds that parallel the coast induce Ekman transport into the bays, at times competing against the local winds, increasing the surface water levels in the lower bays more than upper bays (Garvine, 1985). Differences in surge among TCs depend on duration, size, and strength of wind field.
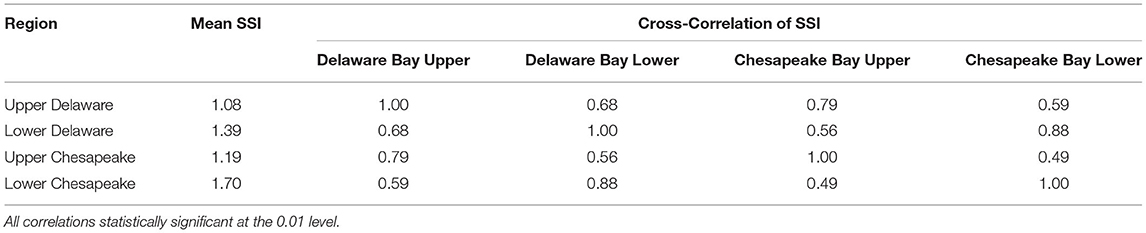
Table 4. Means and cross-correlations of spatially averaged skew surge index (SSI) of Delmarva tropical cyclones, 1980 – 2019.
Cross-correlations (Figure 7) and PCA on SSI demonstrate sub-bay geographic differences. LWS has similar correlations to gauges in both the lower and upper Chesapeake Bay regions but not as strong as among gauges within those regions. Generally, surge at LWS tended to follow the behavior of lower bay gauges during TCs that were east of Delmarva and of upper bay gauges during TCs that were west of Delmarva, although the magnitude was usually somewhere between. The central location of LWS makes it valuable for assessing surge in the Chesapeake Bay albeit problematic if assigned to either an upper or lower bay region.
Table 4 shows that lower regions in each bay respond to TCs more similarly to each other than to their respective upper regions. The distance between the bay inlets is relatively small compared to the size of the TC and their tracks, and drivers such as wind direction or Ekman transport would impact these areas similarly. This may run counter to public perception since many outreach and planning activities tend to focus on The Delaware and Chesapeake Bays separately. The Bays fall into separate NWS Forecast Offices, who are responsible for sending out real-time weather and coastal flood advisories, and have separate state initiatives and SLR planning committees (Callahan et al., 2017; Boesch et al., 2018). This is understandable considering the funding sources and political directives, however, perhaps the results of this study show that regions of each bay could be addressed collectively regarding surge risk hazards.
The World Meteorological Organization states that hurricanes are named to help with “disaster risk awareness, preparedness, management, and reduction,” and names are retired “due to sensitivity” from the destruction they cause (World Meteorological Organization, 2020). Ranking of storms can be looked upon in a similar vein by meteorologists and emergency managers, recalling local knowledge from pervious experiences to help in outreach. As well, it could provide scientists and planners analog storms with similar surge potential to compare against. Separate ranking by geographic region helps focus preparedness efforts.
Highly ranked storms in both bays include Hurricanes Isabel (2003), Wilma (2005), Ernesto (2006), Sandy (2012), and Not Named (1991). All of these were very large, strong storms with wide reaching wind fields that transitioned to extratropical near Delmarva. The high wind speeds and longer duration of swell directed at Delmarva contributed to the extreme surge levels from these storms. Surge from Isabel (2003) was an extreme outlier in the Chesapeake Bay compared to the other TCs primary due to its linear track, traveling southeast to northwest while keeping the Chesapeake in its right-front quadrant, continually pushing water up the bay (National Hurricane Center, 2014). Gloria (1985) would be Isabel's counterpart for the Delaware Bay, although its fast speed and track to the east of Delmarva limited its most severe impacts to the lower bay region.
Negative correlations between SSI and TC minimum distance to Delmarva were consistent across all sites, as expected (Supplementary Figure 5). However, the significant amount of scatter and outliers prohibit a direct quantifiable relationship. Results from the clustering analysis show similar information. For example, TC tracks in clusters 1–2 and 4–5 are indistinguishable yet those TCs produce varying magnitudes and spatial patterns of SSI. Likewise, TC tracks in clusters 3 and 8–10 are all positioned nearly directly over Delmarva, yet TCs in cluster 3 produce only minimal variation whereas TCs in clusters 8–10 produced very large variations.
Although the clustering was based solely on surge profiles, some similarities in tracks do exist. A large majority of the TC tracks were positioned directly over or just offshore to the east of Delmarva. The most common surge profile exhibits larger SSI values in the lower bays than upper bays (N = 51, from clusters 2, 4, 5, 6, 7, 8, 9, and 10), followed by larger SSI values in upper bays than lower bays (N = 34, from clusters 1, 11, 12, and 13) and minimal difference between the upper and lower bays (N = 8, from cluster 3). TCs that produce the largest SSI in the upper Chesapeake Bay pass by Delmarva to the west, whereas TCs that produce very low SSI values in the upper Chesapeake Bay yet large SSI values in the lower Chesapeake Bay pass directly over Delmarva. Generally, these results may imply that although distance and location of storm track may play a role, other storm-related factors are also involved in producing the observed surge amount a particular site may receive. Results of the current work could be extended with additional TC data (e.g., size, wind speed, duration, direction of travel) and a more rigorous statistical treatment.
In order to generalize some of the conclusions in this paper, a similar methodology could be applied to extratropical flood events at the same tide gauge locations. As well, a more thorough statistical analysis of surge magnitudes and spatial variation compared to specific TC meteorological characteristics and TC track location would quantify the relative contributions of the major drivers of TC-caused surge in the Delaware and Chesapeake Bays. Tropical cyclones, like all coastal storms, are multi-hazard weather events, with storm surge the most destructive and lethal hazard. In a changing environment, there continues to be a need to improve storm surge forecasting and implement strategies to minimize the damage of coastal flooding (Council on Climate Preparedness Resilience, 2016; Rahmstorf, 2017; Chippy and Jawahar, 2018). Results from this analysis can provide insight on the potential regional impacts of coastal flooding from tropical cyclones in the Mid-Atlantic region.
Benefit of Research to Scientific Community
This research will develop skew surge values for tropical storms over the past 40 years in the Mid-Atlantic. It will also summarize skew surge over regions of multiple tide gauges and investigate geographic difference among surge level and storm tracks. Skew surge is not a commonly used estimate of surge although it has been gaining acceptance and is well-positioned for separating the meteorological and tidal contributions to flood events. Impacts of coastal flooding from tropical storms are not commonly studied in the Mid-Atlantic, although it is highly developed and critical coastal region experiencing high rates of sea level rise. With the prospect of increased severe tropical cyclones in the future, a better understanding of the surge produced by these systems, both in spatial variability and magnitude, is important for developing mitigation and adaptation strategies to protect against these hazards.
Data Availability Statement
The dataset of Delmarva Tropical Cyclone skew surges and storm tides generated for this study can be found at the figshare repository: https://figshare.com/account/home#/projects/89696.
Author Contributions
JC, DL, and CC conceived the idea of investigating storm surge from tropical cyclones in the U.S. Mid-Atlantic. JC and DL designed the analysis framework. JC obtained all of the necessary data, performed the statistical analysis, and wrote the manuscript. DL and CC helped with results interpretation and manuscript revisions. CC contributed to the design of graphics and generated all maps. All authors contributed to the article and approved the submitted version.
Conflict of Interest
The authors declare that the research was conducted in the absence of any commercial or financial relationships that could be construed as a potential conflict of interest.
Publisher's Note
All claims expressed in this article are solely those of the authors and do not necessarily represent those of their affiliated organizations, or those of the publisher, the editors and the reviewers. Any product that may be evaluated in this article, or claim that may be made by its manufacturer, is not guaranteed or endorsed by the publisher.
Acknowledgments
The authors would like to thank the National Oceanic and Atmospheric Administration for providing a large database of water level data for public use. The authors would also like to thank Dr. Daniel L. Codiga, Graduate School of Oceanography, University of Rhode Island, and Dr. Richard Pawlowicz, Department of Earth, Ocean and Atmospheric Sciences, University of British Columbia, for their help in understanding the operation of U-Tide and performing harmonic analysis.
Supplementary Material
The Supplementary Material for this article can be found online at: https://www.frontiersin.org/articles/10.3389/fclim.2021.610062/full#supplementary-material
References
Batstone, C., Lawless, M., Tawn, J., Horsburgh, K., Blackman, D., McMillan, A., et al. (2013). A UK best-practice approach for extreme sea-level analysis along complex topographic coastlines. Ocean Eng. 71, 28–39. doi: 10.1016/j.oceaneng.2013.02.003
Bernhardt, J. E., and DeGaetano, A. T. (2012). Meteorological factors affecting the speed of movement and related impacts of extratropical cyclones along the U.S. east coast. Nat. Hazard. 61, 1463–1472. doi: 10.1007/s11069-011-0078-0
Bernier, N. B., and Thompson, K. R. (2007). Tide-surge interaction off the east coast of Canada and northeastern United States. J. Geophys. Res. 112:C06008. doi: 10.1029/2006JC003793
Blake, E. S., and Gibney, E. J. (2011). The Deadliest, Costliest, and Most Intense United States Tropical Cyclones From 1851to 2010 (and Other Frequently Requested Hurricane Facts). NOAA Technical Memorandum NWS NHC-6, (Miami FL: NOAA National Hurricane Center). 49.
Boesch, D. F., Boicourt, W. C., Cullather, R. I., Ezer, T., Galloway, G. E. Jr., Johnson, Z. P., et al. (2018). Sea-Level Rise: Projections for Maryland 2018. (Cambridge, MD: University of Maryland Center for Environmental Science) 27.
Boon, J. D., Mitchell, M., Loftis, J. D., and Malmquist, D. L. (2018). Anthropogenic Sea Level Change: A History of Recent Trends Observed in the U.S. East, Gulf and West Coast Regions, Special Report No. 467 in Applied Marine Science and Ocean Engineering, prepared by Virginia Institute of Marine Science, VA, 76.
Booth, J. F., Rider, H. E., and Kushnir, Y. (2016). Comparing hurricane and extratropical storm surge for the Mid-Atlantic and Northeast Coast of the United States for 1979–2013. Environ. Res. Lett. 11:94004. doi: 10.1088/1748-9326/11/9/094004
Callahan, J. A., Horton, B. P., Nikitina, D. L., Sommerfield, C. K., McKenna, T. E., and Swallow, D. (2017). Recommendation of Sea-Level Rise Planning Scenarios for Delaware: Technical Report, prepared for Delaware Department of Natural Resources and Environmental Control (DNREC) Delaware Coastal Programs (Delaware Dept of Natural Resources and Environmental Control), 116.
Chesapeake Bay Program (2020). State of the Chesapeake. Available online at: https://www.chesapeakebay.net/state (accessed August 18, 2020).
Chippy, M. R., and Jawahar, S. S. (2018). Storm surge and its effect-a review on disaster management in coastal areas. Civil Eng. Res. J. 4:555649. doi: 10.19080/CERJ.2018.04.555649
Codiga, D. L. (2011). Unified Tidal Analysis and Prediction Using the UTide Matlab Functions. GSO Technical Report 2011-01. South Kingstown, RI: Graduate School of Oceanography, University of Rhode Island, 60.
Colle, B. A., Booth, J. F., and Chang, E. K. M. (2015). A review of historical and future changes of extratropical cyclones and associated impacts along the US East Coast. Curr. Climate Change Rep. 1, 125–143. doi: 10.1007/s40641-015-0013-7
Council on Climate Preparedness and Resilience (2016). Opportunities to Enhance the Nation's Resilience to Climate Change (Washington, DC), 46.
Delaware Emergency Management Agency (2018). State of Delaware All-Hazard Mitigation Plan (Dover, DE), 308.
Dolan, R., and Davis, W. E. (1992). An intensity scale for Atlantic coast Northeast storms. J. Coastal Res. 8, 840–853.
Eagleson, P. S., and Ippen, A. T. (1966). Estuary and Coastline Hydrodynamics. New York, NY: McGraw-Hill Book Co.
Ellis, J. T., and Sherman, D. J. (2015). “Perspectives on coastal and marine hazards and disasters,” in Coastal Marine Hazards, Risks, and Disasters, eds J. F. Shroder, J. T. Ellis, and D. J. Sherman (Elsevier). doi: 10.1016/B978-0-12-396483-0.00001-7
Elsner, J. B., and Kara, A. B. (1999). Hurricanes of the North Atlantic: Climate and Society. New York, NY: Oxford University Press.
Federal Emergency Management Agency (2013). Region III: Coastal Analysis and Mapping. Region 3 Storm Surge Study. Available online at: https://sites.google.com/site/r3coastal/home/storm-surge-study (accessed April 9, 2020).
Garvine, R. W. (1985). A simple model of estuarine subtidal fluctuations forced by local and remote wind stress. J. Geogr. Oceans 90, 11945–11948. doi: 10.1029/JC090iC06p11945
Harleman, D. R. F. (1966). “Real estuaries, in estuary and coastline hydrodynamics,” in Tidal Dynamics in Estuaries: Real Estuaries. Estuary and Coastline Hydrodynamics, ed A. T. Ippen (New York, NY: McGraw-Hill), 522–545.
Harris, D. L. (1991). “Reproducibility of the harmonic constants. Tidal Hydrodynamics,” in ed B. P. Parker (Hoboken, NJ: John Wiley and Sons), 753–771.
Hirsch, M. E. A. T, Degaetano, and Colucci, S. J. (2001). An east coast winter storm climatology. J. Climate 14, 882–899. doi: 10.1175/1520-0442(2001)014<0882:AECWSC>2.0.CO;2
Holgate, S. J., Matthews, A., Woodworth, P. L., Rickards, L. J., Tamisiea, M. E., Bradshaw, E., et al. (2013). New data systems and products at the permanent service for mean sea level. J. Coastal Res. 29, 493–504. doi: 10.2112/JCOASTRES-D-12-00175.1
Jay, A. D. R, Reidmiller, C. W., Avery, D., Barrie, B. J., DeAngelo, A., Dave, M., et al. (2018). “Overview,” in Impacts, Risks, and Adaptation in the United States: Fourth National Climate Assessment, Volume II, eds D. R. Reidmiller, C. W. Avery, D. R. Easterling, K. E. Kunkel, K. L. M. Lewis, T. K. Maycock, et al. (Washington, DC: U.S. Global Change Research Program), 33–71.
Keim, B., Muller, R., and Stone, G. (2007). Spatiotemporal patterns and return periods of tropical storm and hurricane strikes from Texas to Maine. J. Climate 20, 3498–3509. doi: 10.1175/JCLI4187.1
Knapp, K. R., Diamond, H. J., Kossin, J. P., Kruk, M. C., and Schreck, C. J. (2018). International Best Track Archive for Climate Stewardship (IBTrACS) Project, Version 4. [North Atlantic Basin since 1980]. NOAA National Centers for Environmental Information. Non-government domain (accessed May 18, 2020).
Knapp, K. R., Kruk, M. C., Levinson, D. H., Diamond, H. J., and Neumann, C. J. (2010). The International Best Track Archive for Climate Stewardship (IBTrACS): unifying tropical cyclone best track data. Bullet. Am. Meteorol. Soc. 91, 363–376. doi: 10.1175/2009BAMS2755.1
Knutson, T., Camargo, S. J., Chan, J. C. L., Emanuel, K., Ho, C.-H., Kossin, J., et al. (2020). Tropical cyclones and climate change assessment: part II: projected response to anthropogenic warming. Bullet. Am. Meteorol. Soc. 1, E303–E322. doi: 10.1175/BAMS-D-18-0194.1
Knutson, T., Camargo, S. J., Chan, J. C. L., Emanuel, K., Ho, C.-H., Kossin, James, Mohapatra, M., et al. (2019). Tropical cyclones and climate change assessment: part I: detection and attribution. Bullet. Am. Meteorol. Soc. 1, 1987–2007. doi: 10.1175/BAMS-D-18-0189.1
Kopp, R. E. (2013). Does the mid-Atlantic United States sea level acceleration hot spot reflect ocean dynamic variability? Geophys. Res. Lett. 40, 3981–3985. doi: 10.1002/grl.50781
Kossin, J. P. (2018). A global slowdown of tropical-cyclone translation speed. Nature 558:104–107. doi: 10.1038/s41586-018-0158-3
Kossin, J. P., Hall, T., Knutson, T., Kunkel, K. E., Trapp, R. J., Waliser, D. E., et al. (2017). “Extreme storms,” in Climate Science Special Report: Fourth National Climate Assessment, Volume I, eds D. J. Wuebbles, D. W. Fahey, K. A. Hibbard, D. J. Dokken, B. C. Stewart, and T. K. Maycock (Washington, DC: U.S. Global Change Research Program), 257–276. doi: 10.7930/J07S7KXX
Landsea, C. W., and Franklin, J. L. (2013). Atlantic hurricane database uncertainty and presentation of a new database format. Monthly Weather Rev. 141, 3576–3592. doi: 10.1175/MWR-D-12-00254.1
Leathers, D. J., Kluck, D. R., and Kroczynski, S. (1998). The severe flooding event of January 1996 across North-Central Pennsylvania. Bullet. Am. Meteorol. Soc. 79, 785–797. doi: 10.1175/1520-0477(1998)079<0785:TSFEOJ>2.0.CO;2
Lee, S. B., Li, M., and Zhang, F. (2017). Impact of sea level rise on tidal range in Chesapeake and Delaware Bays. J. Geophys. Res. Oceans 122, 3917–3938. doi: 10.1002/2016JC012597
Li, M., Zhang, F., Barnes, S., and Wang, X. (2020). Assessing storm surge impacts on coastal inundation due to climate change: case studies of Baltimore and Dorchester County in Maryland. Nat. Hazard. 103, 2561–2588. doi: 10.1007/s11069-020-04096-4
Marcos, M., Calafat, F. M., Berihuete, A., and Dangendorf, S. (2015). Long-term variations in global sea level extremes. J. Geophys. Res. Oceans 120, 8115–8134. doi: 10.1002/2015JC011173
Mawdsley, R. J., and Haigh, I. D. (2016). Spatial and temporal variability and long-term trends in skew surges globally. Front. Marine Sci. 3, 1–29. doi: 10.3389/fmars.2016.00029
McAdie, C. J., Landsea, C. W., Neumann, C. J., David, J. E., Blake, E. S., and Hammer, G. R. (2009). “Tropical cyclones of the North Atlantic Ocean, 1851–2006: with 2007 and 2008 Track Maps Included,” in National Oceanic and Atmospheric Administration Historical Climatology Series 6-2, 243.
Merrifield, M. A., Genz, A. S., Kontoes, C. P., and Marra, J. J. (2013). Annual maximum water levels from tide gauges: contributing factors and geographic patterns. J. Geophys. Res. Oceans 118, 2535–2546. doi: 10.1002/jgrc.20173
Moftakhari, H. R., AghaKouchak, A., Sanders, B. F., Feldman, D. L., Sweet, W., Matthew, R. A., et al. (2015). Increased nuisance flooding along the coasts of the United States due to sea level rise: past and future, Geophys. Res. Lett. 42, 9846–9852. doi: 10.1002/2015GL066072
Muller, R. A., and Stone, G. W. (2001). A climatology of tropical storm and hurricane strikes to enhance vulnerability prediction for the Southeast U.S. coast. J. Coastal Res. 17, 9949–9956. Available online at: https://journals.flvc.org/jcr/article/view/81519
Murakami, H., Delworth, T. L., Cooke, W. F., Zhao, M., Xiang, B., and Hsu, P. C. (2020). Detected climatic change in global distribution of tropical cyclones. Proc. Natl. Acad. Sci. U. S. A. 117, 10706–10714. doi: 10.1073/pnas.1922500117
National Hurricane Center (2014). NOAA, Tropical Cyclone Report for Hurricane Isabel (Miami, FL: NOAA National Hurricane Center), 30.
National Hurricane Center (2019). NOAA, Storm Surge Overview. Available online at: https://www.nhc.noaa.gov/surge/ (accessed January 10, 2019).
National Hurricane Center (2020). NOAA, Tropical Cyclone Reports. Available online at: https://www.nhc.noaa.gov/data/tcr/ (accessed May 20, 2020).
Needham, H. F., Keim, B. D., and Sathiaraj, D. (2015). A review of tropical cyclone-generated storm surges: global data sources, observations, and impacts. Rev. Geophys. 53, 545–591. doi: 10.1002/2014RG000477
NOAA National Centers for Environmental Information (2020). U. S. Billion-Dollar Weather and Climate Disasters.
NOAA National Ocean Service Center for Operational Oceanographic Products Services (2020a). Sea Level Trends. Available online at: https://tidesandcurrents.noaa.gov/sltrends/ (accessed August 18, 2020).
NOAA National Ocean Service Center for Operational Oceanographic Products Services (2020b). API for Data Retrieval. Available online at: https://api.tidesandcurrents.noaa.gov/api/prod/ (accessed April 9, 2020).
NOAA National Ocean Service Center for Operational Oceanographic Products Services (2020c). NOAA Tide Predictions. Available online at: https://tidesandcurrents.noaa.gov/tide_predictions.html (accessed April 9, 2020).
NOAA National Ocean Service National Water Level Observation Network. (2020). NOAA National Ocean Service National Water Level Observation Network. Available online at: https://www.tidesandcurrents.noaa.gov/nwlon.html (accessed August 18, 2020).
NOAA National Ocean Service Physical Oceanographic Real-Time System. (2020). NOAA National Ocean Service Physical Oceanographic Real-Time System. Available online at: https://tidesandcurrents.noaa.gov/ports.html (accessed August 18, 2020).
Patrick, R. (1994). Rivers of the United States, Volume 1: Estuaries. Hoboken, NJ: John Wiley and Sons, 1994. ISBN: 978-0-471-30345-9
Pugh, D., and Woodworth, P. (2014). Sea-Level Science: Understanding Tides, Surges, Tsunamis and Mean Sea-Level Changes. Cambridge: Cambridge University Press. doi: 10.1017/CBO9781139235778
Rahmstorf, S. (2017). Rising hazard of storm-surge flooding. Proc. Natl. Acad. Sci. Commentary. 114, 11806–11808. doi: 10.1073/pnas.1715895114
Rappaport, E. (2014). Fatalities in the United States from Atlantic tropical cyclones new data and interpretation. Bullet. Am. Meteorol. Soc. Insights Innov. 2014, 341–346. doi: 10.1175/BAMS-D-12-00074.1
Rashid, M., Wahl, T., Chambers, D., Calafat, F., and Sweet, W. (2019). An extreme sea level indicator for the contiguous United States coastline. Sci. Data 6:326. doi: 10.1038/s41597-019-0333-x
Ritterbush, J. (2012). US daily weather maps project. Ref. Rev. 26, 39–39. doi: 10.1108/09504121211195333
Ross, A. C., Najjar, R. G., Li, M., Lee, S. B., Zhang, F., and Liu, W. (2017). Fingerprints of sea level rise on changing tides in the Chesapeake and Delaware Bays. J. Geophys. Res. Oceans 122, 8102–8125. doi: 10.1002/2017JC012887
Salehi, M. (2018). Storm surge and wave impact of low-probability hurricanes on the lower delaware bay—calibration and application. J. Mar. Sci. Eng. 6:54. doi: 10.3390/jmse6020054
Sallenger, A. H., Doran, K. S., and Howd, P. A. (2012). Hotspot of accelerated sea-level rise on the Atlantic coast of North America. Nat. Climate Change 2, 884–888, doi: 10.1038/nclimate1597
Sanchez, J. R., G Kauffman, K., Reavy, A., and Homsey (2012). “Chapter 1.7 - Natural Capital Value” in the Technical Report for the Delaware Estuary and Basin. Partnership for the Delaware Estuary. PDE Report No, (Partnership for the Delaware Estuary). 17-07, 70–75. Available online at: https://s3.amazonaws.com/delawareestuary/TREB+douments/TREB+2017+complete.pdf
Shirahata, K., Yoshimoto, S., Tsuchihara, T., and Ishida, S. (2016). Digital filters to eliminate or separate tidal components in groundwater observation time-series data. Jap. Agri. Res. Quart. 50, 241–252. doi: 10.6090/jarq.50.241
Simpson, R. H., and Lawrence, M. (1971). Atlantic Hurricane Frequencies Along the United States Coastline. NOAA Tech. Memo. NWS-SR-58 (Fort Worth, TX: NOAA Southern Region Headquarters), 14.
Smith, A. B., and Katz, R. W. (2013). US billion-dollar weather and climate disasters: data sources, trends, accuracy and biases. Nat. Hazard. 67, 387–410. doi: 10.1007/s11069-013-0566-5
Spicer, P., Huguenard, K., Ross, L., and Rickard, L. N. (2019). High-frequency tide-surge-river interaction in estuaries: causes and implications for coastal flooding. J. Geophys. Res. Oceans 124:15466. doi: 10.1029/2019JC015466
Stephens, S. A., Bell, R. G., and Haigh, I. D. (2020). Spatial and temporal analysis of extreme storm-tide and skew-surge events around the coastline of New Zealand. Nat. Hazard. Earth Syst. Sci. 20, 783–796. doi: 10.5194/nhess-20-783-2020
Strobach, E., Sparling, L. C., Rabenhorst, S. D., and Demoz, B. (2018). Impact of inland terrain on mid-atlantic offshore wind and implications for wind resource assessment: a case study. J. Appl. Meteorol. Climatol. 57, 777–796. doi: 10.1175/JAMC-D-17-0143.1
Sweet, W., Dusek, G., Carbin, G., Marra, J., Marcy, D., and Simon, S. (2020). 2019 State of U.S. High Tide Flooding with a 2020 Outlook. NOAA Technical Report NOS CO-OPS 092 (Silver Spring, MD: National Ocean Service Center for Operational Oceanographic Products and Services), 24.
Sweet, W. V., Horton, R. M., Kopp, R. E., LeGrande, A. N., and Romanou, A. (2017a). “Sea level rise,” in Climate Science Special Report: Fourth National Climate Assessment, Volume I, eds D. J. Wuebbles, D. W. Fahey, K. A. Hibbard, D. J. Dokken, B. C. Stewart, and T. K. Maycock (Washington, DC: U.S. Global Change Research Program), 333–363. doi: 10.7930/J0VM49F2
Sweet, W. V., Kopp, R. E., Weaver, C. P., Obeysekera, J., Horton, R. M., Thieler, E. R., et al. (2017b). Global and Regional Sea Level Rise Scenarios for the United States. NOAA Technical Report NOS CO-OPS (Silver Spring, MD: National Ocean Service Center for Operational Oceanographic Products and Services) 083, 75.
Sweet, W. V., Park, J., Marra, J. J., Zervas, C. E., and Gill, S. (2014). Sea Level Rise and Nuisance Flood Frequency Changes around the United States. NOAA Technical Report NOS CO-OPS (Silver Spring, MD: National Ocean Service Center for Operational Oceanographic Products and Services) 073, 66.
Tebaldi, C., Strauss, B. H., and Zervas, C. E. (2012). Modeling sea level rise impacts on storm surges along US coasts, Environ. Res. Lett. 7:014032. doi: 10.1088/1748-9326/7/1/014032
US Army Corps of Engineers (2014). North Atlantic Coast Comprehensive Study (NACCS), State Chapter D-7: State of Delaware, 142. Available online at: https://www.nad.usace.army.mil/CompStudy/
Weinkle, J., Landsea, C., Collins, D., Musulin, R., Crompton, R. P., Klotzbach, P. K., and Pielke, R. Jr (2018). Normalized hurricane damage in the continental United States 1900–2017. Nat. Sustainabil. 165:2. doi: 10.1038/s41893-018-0165-2
Wilkerson, C. N., and Brubaker, J. (2013). “Analysis of extreme water levels in the lower chesapeake bay,” in Proceedings of the 2012 OCEANS Conference. Hampton Roads, VA. doi: 10.1109/OCEANS.2012.6405098
Williams, J., Horsburgh, K. J., Williams, J. A., and Proctor, R. N. F. (2016). Tide and skew surge independence: new insights for flood risk. Geophys. Res. Lett. 43, 6410–6417. doi: 10.1002/2016GL069522
Wong, K.–C., and Münchow, A. (1995). Buoyancy forced interaction between estuary and inner shelf: observation. Continental Shelf Res. 15, 59–88. doi: 10.1016/0278-4343(94)P1813-Q
World Meteorological Organization (2020). Tropical Cyclone Naming. Available online at: https://public.wmo.int/en/our-mandate/focus-areas/natural-hazards-and-disaster-risk-reduction/tropical-cyclones/Naming (accessed August 15, 2020).
Xie, L., Yan, T., Pietrafesa, L. J., Morrison, J. M., and Karl, T. (2005). Climatology and interannual variability of North Atlantic hurricane tracks. J. Climate 18, 5370–5381. doi: 10.1175/JCLI3560.1
Xiong, Y., and Berger, C. R. (2010). Chesapeake bay tidal characteristics. J. Water Resourc. Protect. 2, 619–628. doi: 10.4236/jwarp.2010.27071
Yang, H., Lohmann, G., Lu, J., Gowan, E. J., Shi, X., Liu, J., et al. (2020). Tropical expansion driven by poleward advancing mid-latitude meridional temperature gradients. JGR Atmos. 2020:5042. doi: 10.5194/egusphere-egu2020-5042
Zhang, K., Douglas, B. C., and Leatherman, S. P. (2000). Twentieth-century storm activity along the U.S. East Coast. J. Climate 13, 1748–1761. doi: 10.1175/1520-0442(2000)013<1748:TCSAAT>2.0.CO;2
Zhong, L., and Li, M. (2006). Tidal energy fluxes and dissipation in the chesapeake bay. Continental Shelf Res. 26, 752–770. doi: 10.1016/j.csr.2006.02.006
Glossary
NOAA Tide Gauge Locations, Philadelphia (PHL), Reedy Point (RDY), Lewes (LEW), Cape May (CAP), Atlantic City (ATL), Baltimore (BAL), Annapolis (ANN), Cambridge (CAM), Lewisetta (LWS), Kiptopeke (KIP), Sewells Point (SEW), Wachapreague (WAC); CO-OPS, NOAA Center for Operational Oceanographic Products and Services; DEMA, Delaware Emergency Management Agency; ETC, Extratropical Cyclone (sometimes called mid-latitude cyclones); FEMA, Federal Emergency Management Agency; HURDAT2, Atlantic Hurricane Database (HURDAT2); IBTrACS, International Best Track Archive for Climate Stewardship; MHHW, Mean Higher-High Water tidal datum; MSL, Mean Sea Level tidal datum; NAVD88, North American Vertical Datum 1988; NCEI, NOAA National Centers for Environmental Information; NHC, NOAA National Hurricane Center (division of the National Weather Service); NOAA, National Oceanic and Atmospheric Administration; NOS, NOAA National Ocean Service; NTDE, National Tidal Datum Epoch; NTR, Non-tidal residual; NWLON, NOAA NOS National Water Level Observation Network; PORTS, NOAA National Ocean Service Physical Oceanographic Real-Time System; SSI, Storm Surge Index; SST, Sea Surface Temperature; STI, Storm Tide Index; SURGEDAT, A database specifically designed to store storm surge data with 700 tropical surge events around the world and more than 8,000 unique tropical high water marks along the U.S. Gulf and Atlantic Coasts since 1880; TC, Tropical Cyclone; TWL, Total water level; USACE, US Army Corps of Engineers; WMO, World Meteorological Organization.
Keywords: tropical cyclone, hurricane, Mid-Atlantic, storm surge, coastal flooding, tidal analysis, natural hazard, coastal risk
Citation: Callahan JA, Leathers DJ and Callahan CL (2021) Skew Surge and Storm Tides of Tropical Cyclones in the Delaware and Chesapeake Bays for 1980–2019. Front. Clim. 3:610062. doi: 10.3389/fclim.2021.610062
Received: 24 September 2020; Accepted: 12 July 2021;
Published: 31 August 2021.
Edited by:
Valentina Prigiobbe, Stevens Institute of Technology, United StatesReviewed by:
Jase Bernhardt, Hofstra University, United StatesJames Booth, City College of New York (CUNY), United States
Copyright © 2021 Callahan, Leathers and Callahan. This is an open-access article distributed under the terms of the Creative Commons Attribution License (CC BY). The use, distribution or reproduction in other forums is permitted, provided the original author(s) and the copyright owner(s) are credited and that the original publication in this journal is cited, in accordance with accepted academic practice. No use, distribution or reproduction is permitted which does not comply with these terms.
*Correspondence: John A. Callahan, am9obi5jYWxsYWhhbkB1ZGVsLmVkdQ==