 Nuria Castell
 Sonja Grossberndt
 Jøran S. Skaar
 Britt Ann K. Høiskar
- Norsk institutt for luftforskning (NILU)-Norwegian Institute for Air Research, Kjeller, Norway
Most European cities have air pollution levels that exceed the threshold for human health protection. Children are sensitive to air pollution and thus it is important to ensure they are not exposed to high concentrations of air pollutants. In order to make a positive change toward cleaner air, a joint effort is needed, involving all civil society actors. Schools and local communities have a decisive role, and can, for example, become engaged in citizen science initiatives and knowledge coproduction. In 2019, with the aim of raising awareness for air quality, NILU developed a citizen science toolbox to engage primary schools in monitoring air quality using a simple and affordable measuring method based on paper and petroleum jelly. This is a very visual method, where the students can clearly see differences from polluted and non-polluted places by looking at “how dirty” is the paper. In addition to the qualitative analysis, we have developed an air meter scale making possible for the students to obtain an indicative measurement of the air pollution level. The comparison between the paper and petroleum jelly method against reference PM10 data collected at two official air quality stations showed a good agreement. The method is a strong candidate for dust monitoring in citizen science projects, making participation possible and empowering people with simple tools at hand. The toolbox is targeted at primary schools and children aged 6–12 years, although it can easily be adapted to other age groups. The main objective of the toolbox is to involve young children who are usually not targeted in air quality citizen science activities, to develop research skills and critical thinking, as well as increase their awareness about the air they breathe. The toolbox is designed to engage students in hands-on activities, that challenge them to create hypotheses, design scientific experiments, draw conclusions and find creative solutions to the air pollution problem. The toolbox includes all the necessary material for the teachers, including guidance, background information and templates facilitating the incorporation in the school curricula. The toolbox was launched as part of the Oslo European Green Capital in March 2019 and was later included as part of the European Clean Air Day initiative coordinated by the European Citizen Science Association (ECSA) working group on air quality. A total of 30 schools and 60 4th grade classes (aged 8–9 years) participated in the Oslo campaign. The citizen science approach employed in the schools, combined the four key elements that promote knowledge integration: elicit ideas, add new ideas, distinguish among ideas and reflect and sort out ideas. Although the main goal of the study was to provide simple but robust tools for engaging young children in air quality monitoring, we also carried out ex-ante and ex-post evaluations in 12 of the participating classes using a 10-question multiple choice test to have an indication of the contribution of the activity to knowledge integration. The results show that there is an increase in the number of correct answers, as well as a reduction in the misconceptions after conducting the activity. These results indicate that applying a citizen science approach improved science instruction and helped knowledge integration by including students' views and taking advantage of the diverse ideas students generated. Citizen science gives learners an insight into the ways that scientists generate solutions for societal problems. But more important, citizen science provides a way to differ from the classic view of the learner as an absorber of information, by considering the social context of instruction and making the topic personally relevant.
Introduction
Despite long-term efforts across the whole of Europe during the last decades, air pollution is still a reason for concern with regard to health impacts, especially in urban areas. A recent report about the air quality in Europe estimates that long-term exposure to particulate matter was responsible for ~417.000 premature deaths in that area [EEA (European Environment Agency), 2020].
Air pollution is especially harmful to children, as their lungs are still developing. Air pollution has been associated with a wide variety of adverse health impacts in children (Gehring et al., 2013). These include increased acute respiratory disease, increased prevalence of respiratory symptoms and lowered lung function when pollution levels increase (Gehring et al., 2013; Guarnieri and Balmes, 2014).
Radical changes are needed to support the transformation toward a cleaner Europe, which must involve all parts of society. Schools and local communities have a decisive role in this context by promoting knowledge coproduction and citizen science (Harris and Ballard, 2018). Citizen science can be defined as the involvement of non-professionals, i.e., volunteer lay people, in scientific research (Bonney et al., 2009). In citizen science, citizens can contribute to scientific research at different levels, from helping to co-design a citizen science project to collecting data, and/or analyzing results and disseminating them (Haklay, 2013; Irwin, 2018). Citizen science has been described as being beneficial for participants in several ways, including: enhanced science literacy and critical thinking, developing new skills and advocacy/taking action to influence policy (Irwin, 2018, Den Broeder et al., 2018; Harris and Ballard, 2018).
The appearance of low-cost sensor technologies to monitor the environment has opened numerous opportunities for citizens to observe their environment and as part of these activities, monitor air pollution (e.g., Sensor.Community1, EU H2020 project hackAIR2). A number of projects and initiatives show the successful involvement of high school students in citizen science projects, monitoring air quality by help of low costs sensors that have been built and coded by the students independently (e.g., Fjukstad et al., 2018; Grossberndt et al., 2020). However, to our knowledge, there are no specific methods for air quality monitoring with focus on younger children that do not have technology as part of their curricula yet. Other citizen science projects with focus on air quality used active and passive samplers to measure levels of nitrogen dioxide (NO2) and particulate matter (PM) inside and outside the school buildings, developing toolkits and education tools to make children aware of air pollution, its effects on health and the environment and what they can do to reduce it [CleanAir@School3; Health and Environment Alliance, 2019]. Even though these citizen science projects focused on younger children, they did not involve the children in building their own devices neither decide about the place where they wanted to measure air quality. Thus, a true involvement of the children in the co-production of scientific knowledge was missing.
This led us to the design of a citizen science toolbox for primary school students, that involved them in all the phases of scientific research, including building their own air monitoring devices (Castell et al., 2020). The main objective of the toolbox was to introduce the concept of the scientific method to young children (aged 6–12 years), raise their awareness about air quality and elicit their imagination on how they can contribute to improve it. We deployed a citizen science approach, including the children in both problem definition and data collection and interpretation. We also empowered them to disseminate their results to local policy makers. The children in one of the participating schools had the opportunity to discuss their ideas with the Governing Mayor of Oslo, and three students from two different schools were invited as speakers to the Urban Future Global conference, where they presented the project results to an international audience mainly composed by public authorities and policy makers.
Method and Material
Citizen Science School Toolbox
The citizen science school toolbox was targeted toward primary schools and young children (aged 6–12) to engage them in designing their own experiment around measuring air pollution in their local environment. The goal of the toolbox was to engage young children in science, increase their understanding of the relation between air quality and health and encourage positive action toward cleaner air around the school buildings. The material was organized in a manner that students could conduct the experiment the same way it would be done by a researcher, following the scientific method of creating a hypothesis, design the experiment, analyse and discuss the results and extract conclusions.
The citizen science school toolbox was developed together with a master student in Digital Learning at the University of Oslo and was reviewed by several teachers and 4th grade students. In collaboration with the Education Agency in Oslo (Utdanningsetaten i Oslo, UDE) we ensured that the project was in line with the learning objectives in the schools' curriculum. The Environment Agency in Oslo (Bymiljøetaten i Oslo) also reviewed the material, and their help was crucial when reaching out to the schools in Oslo and Akershus county to invite them to participate in a monitoring campaing.
The toolbox contains an air meter (based on paper and petroleum jelly) to monitor dust, a dust scale to compare the air meter and obtain the pollution level, instructions for the teachers, a short introduction to air pollution and health for the students (above 8 years old) and a scientific notebook (above 8 years old) to guide the students in the design of their own experiment.
The teachers can use the materials from the citizen science school toolbox over two lessons, of ~45 min each. There must be at least 1 week between the two lessons, as this is the time that the air meter needs to be exposed to the air pollution. We proposed to divide the lessons as follows:
• Lesson 1: Elaboration on the background information, preparation, and deployment of the air meters.
• Lesson 2: Collection of the air meters, analysis, discussion, writing the conclusions and registration of the data on the website.
The activity can be conducted by each student individually, or the class can work in groups of 2–3 students. The students can also agree on a research question, and collectively design the experiment to answer it. Examples of experiments can be deploying air meters in different places around the schools to monitor differences in air pollution or deploying the air meter under different weather conditions to measure differences in air pollution over time at the same location.
We also prepared a website (http://luftaforalle.nilu.no) where the participating schools could easily download the citizen science school toolbox materials, upload their data to a GIS map, and see the results from other participant schools. The website was created in Norwegian, as the toolbox was first developed as part of the activities conducted in the Oslo Green Capital 2019. The toolbox materials are currently available in other languages (English, Norwegian, Portuguese, Dutch and German) through the European Clean Air Day website (http://www.ecad.eu), and the EU Citizen Science platform (https://eu-citizen.science/).
Air Meter
The air meter (Figure 1) can be printed in regular A4 paper, although it was recommended to use thick paper (160–200g). Each A4 paper has 4 air meters that the students need to cut. Each air meter contains a space on the top to fill in the date it was put out, the date it was taken in and the place it was deployed. The measuring part consist of a square of 6 × 6 cm2, divided into smaller squares of 1 × 1 cm2. In other to make the air meter more resistant to rain conditions, we suggested to first attach the air meter to an empty milk carton by using silver tape and then deploy it outside using also silver tape to fasten it for example to street lights, a tree or a window (Figure 2).
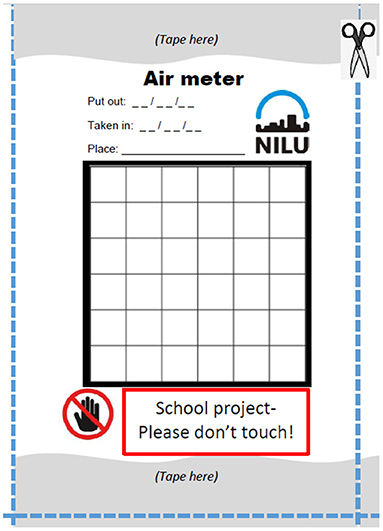
Figure 1. Air meter to monitor dust levels using petroleum jelly. The air meter can be printed in a normal A4 paper and then cut it to have four air meters.
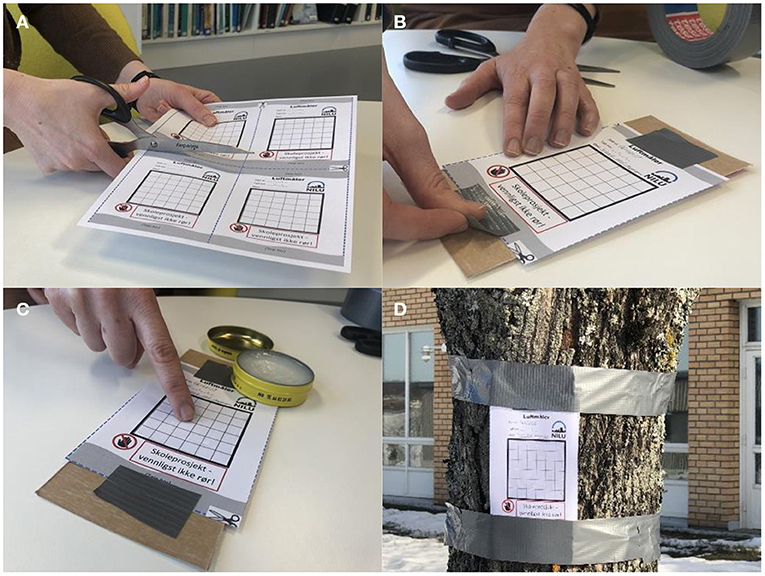
Figure 2. (A) After printing the air meter, the students can cut it. (B) The air meter is attached to a milk carton box using silver tape. (C) A thin layer of petroleum jelly is applied using the finger. (D) The air meter is deployed outside using silver tape.
The students should grease a thin layer of petroleum jelly covering the full 6 × 6 cm2 square using a brush or their fingers (Figure 2). The air meter has to be deployed outdoors for 1 week, this is to ensure that we are measuring over a representative period. As other passive instruments to monitor air pollution, like passive samplers, the air meter needs to be exposed for a sufficient amount of time to obtain a representative sample. We conducted several tests, and concluded that 1 week was an optimal time, as it was allowing to collect enough dust (particulate matter), while also fitting well in the school agenda (i.e., the same class was repeated the same day each week).
During the campaign period, from 27th February to 27th May 2019, we co-located air meters in three reference stations in Oslo (Kirkeveien, Hjortnes, and Sofienbergparken), representative of traffic and urban background stations. The air meters were placed and collected every week for 11 weeks. Figure 3 shows the comparison between the weekly average of PM10 at the reference station and the number of dots. The results show that the air meter, even being a very simple method, correlates well with the concentration of PM10 in the air, with a coefficient of dispersion of 0.4.
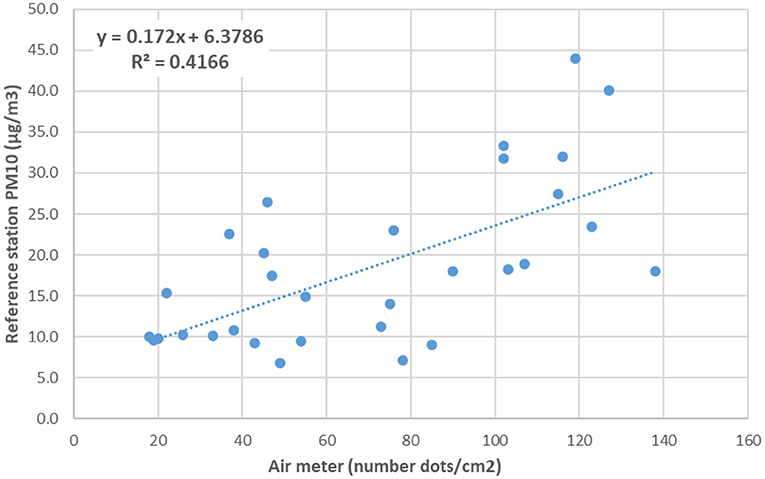
Figure 3. Comparison for the air meter against weekly particulate matter concentrations (PM10) measured at the reference stations of Sofienbergparken (urban background), Kirkeveien (traffic), and Hjørtnes (traffic) in Oslo.
Dust Scale for the Air Meter
To elaborate the dust scale, we co-located three air meters at a traffic reference station and three air meters at an urban background reference station for 20 weeks in the period between September and January 2018. We then compared the number of particles fastened to the petroleum jelly with the concentration of particle matter (PM10) measured at the reference station. Based on the comparison we linked the number of dots per cm2 with the air pollution level. We divided the scale in four air quality levels: low, medium, high, and very high. In order to facilitate the task of assessing the air quality level, specially to the smaller children, we also added pictures of the air meter, and a description of how the air meter will look like depending on the air pollution level (Figure 4).
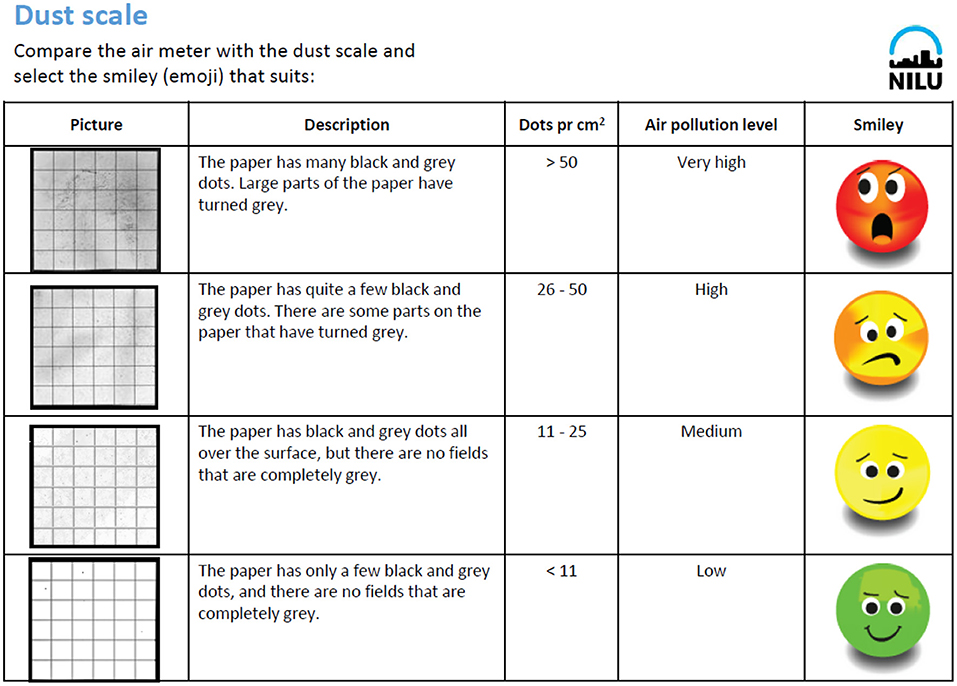
Figure 4. Dust scale to obtain the air pollution level measured with the air meter. Each level is associated with one smiley. The smiley will be used in the website to represent the air pollution level.
After 1 week of exposure the students could take down the air meters and compare their air meters with the dust scale to assess the air quality level. To count the gray dots, the student must select three squares from the grid, count the dots in each of the three squares, and calculate the average. Selecting three squares allows to obtain a more representative value, as the particles do not get fastened homogeneously over the full square. As mentioned before, the task of analyzing the air meter can be simplified depending on the children age.
Notebook: My Air Quality Experiment
As part of the toolbox material we created a two pages notebook for the students with the aim to guide them through the scientific method. The notebook is divided in two parts, one to be completed in the class 1, during the preparation and mounting of the air meter, and one for the class 2, after collecting the air meter and conducting the analysis. During the class 1, the students are asked to write down their research question or hypothesis (e.g., “I think there is more air pollution along St. Andrew Road and on the south side of the playground”), and describe the method about how they prepare the air meter step by step, and the location where they will place them. Then they prepare the air meter and go out to place it at their selected locations. During the class 2, after collecting the air meters, the students count the dots, and write down the results obtained after comparing the number of dots with the dust scale. They can now determine the level of air pollution at their selected locations. They can further discuss if their hypothesis was true or false, write down a conclusion about the air pollution level in the places they measured, and together suggest what can they do to improve air quality.
Web Portal
The web portal (in Norwegian, http://luftaforalle.nilu.no) has a link to download the material (in Norwegian), a video with the instructions, a link to upload the information from the air meter, and a link for visualizing the results. On the visualization map it is possible to filter the results by time period, school and level of pollution. The parts of the web portal for uploading data and visualizing the results can be accessed independently (http://renluftforalle.nilu.no/markers) and are currently available in English, Norwegian, Dutch, Hungarian, and German (Figure 5). They are operative and any school or interested person can upload new data.
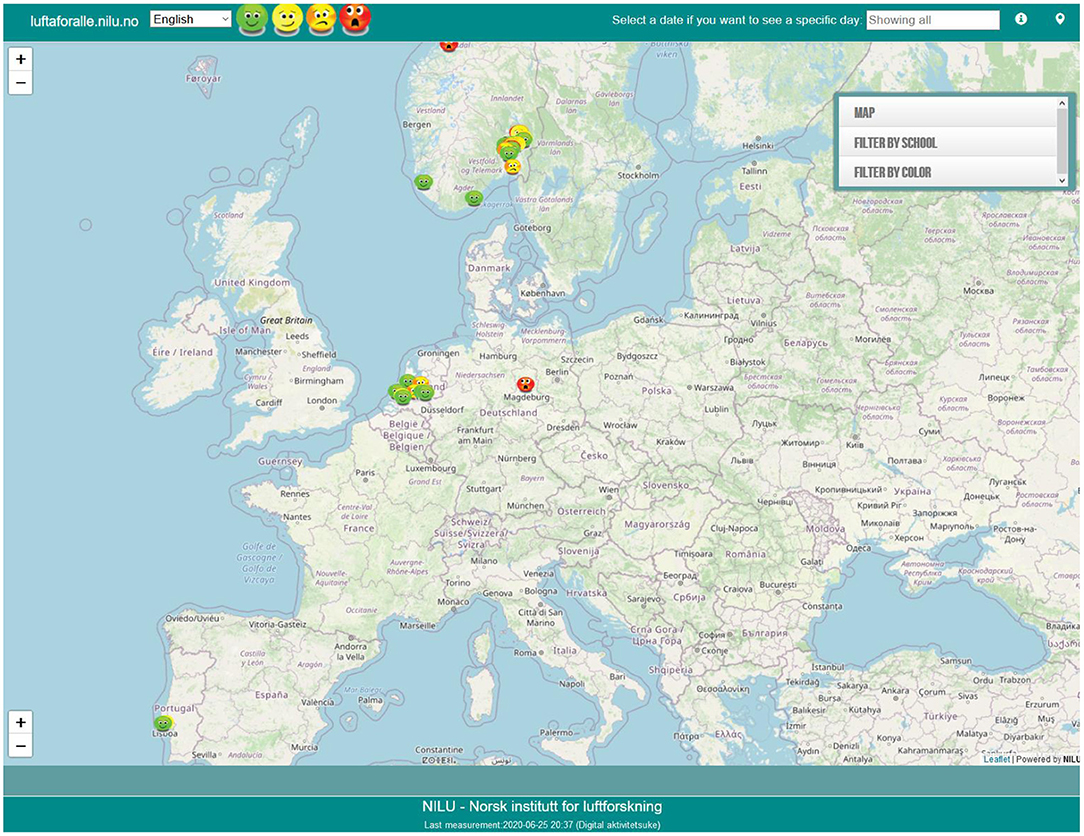
Figure 5. Screen shot of the web portal where the schools can upload the data and visualize the results from all the participant schools.
The teachers were asked to upload the results in the web portal. In order to register an air meter, the following information needs to be provided: the dates the air meter was deployed, the average number of dots per cm2, the weather conditions (i.e., if it was raining during the time the air meter was outside), and the air quality level (smiley). The registration form has also a free text box to add other relevant comments from the students or the teachers.
The part of the portal dedicated to upload the results has a registration area, where the schools are asked to provide a name for their class and the name of the school. We do not store any private information regarding the students or the teachers. The name of the class is displayed in the visualization map. Through the visualization map the students could see their own results but also the results from other participating schools (Figure 5). The visualization portal is open and do not require registration.
Citizen Science Engagement With Schools
Monitoring Campaign in Schools in Oslo and Surroundings
We prepared a list of the primary schools in Oslo and Akershus county, and sent an email to their directors presenting the campaign and inviting the schools to participate. For that purpose, we prepared a two-page leaflet (in Norwegian) explaining the purpose of the campaign and the tools we had created for the schools to actively participate in measuring air pollution. At the beginning of February 2019, we sent out the invitations.
The measuring campaign was conducted in the period between 15 March and 15 May 2019. This is the high season for particulate pollution in Norwegian cities, due to road dust resuspension. The kick-off of the campaign took place on 15th March at a participating school (Årvoll skole) in Oslo. The governing mayor of Oslo, together with a team of researchers from NILU, presented the project to the three 4th grade classes. The students had the opportunity to ask questions about the campaign and build their own air meter. The kick-off was covered by the national TV and regional press and was disseminated through different social media channels. This resulted in more schools registering to participate in the campaign.
A total of 60 4th grade classes from 30 schools in Oslo and Akershus county joined the measuring campaign. During the campaign, a team of one NILU scientist and the previously mentioned master student visited 10 schools (Volla, Munkerud, Tveita, Trasopp, Holmlia, Døli, Ullevål, Råholt, Årvoll, Auli) in Oslo and Akershus county and carried out the activities planned for the first class together with the teachers. Other schools conducted the activity without the assistance from NILU scientists. We collected almost 300 measurements.
In May 2019, the results from the project were presented at the Urban Future Global Conference in Oslo, an international conference for decision makers and city changers. The project was presented by three 4th grade students from Årvoll and Tveita skole.
Monitoring Campaign During the European Clean Air Day 2019
The citizen science toolbox for schools was selected as one of the monitoring methods for the European Clean Air Day (ECAD, http://cleanairday.eu), organized by the European Citizen Science Association (ECSA) working group on Air Quality and celebrated on 20 June 2019. The toolbox was mainly promoted through science fairs and workshops celebrated on the occasion of the ECAD in Netherlands, Germany, Hungary and Portugal. In Amersfoort (Netherlands) and Lisbon (Portugal), the toolbox was incorporated as part of teaching lessons at schools. In Netherlands, the activity was conducted by one school engaging students aged 12–13 years, while in Portugal, the activity was adapted for adult students participating in night school classes, aged 18–40 years.
Knowledge Integration
In the 10 schools in Oslo and Akershus county that we visited during the measuring campaign, we conducted ex-ante and ex-post questionnaires to evaluate the students' learning outcome and awareness about air pollution, using a 10-question multiple choice test. The ex-ante questionnaire was conducted before the students started the lesson 1 activities, while the ex-post questionnaire was conducted after all activities (lessons 1 and 2) had been conducted. The questions were related to the information that the students read about air pollution during the first lesson, as well as their work as junior scientists collecting and interpreting the data. The questions were checked by a teacher to ensure they were appropriate for the curricula of 4th grade students in Norway.
It is outside the scope of the study to thoroughly evaluate knowledge integration, and the conclusions we can extract from the tests are limited as we did not have any control group. Also, we did not have an individual ex-ante and ex-post evaluation, but we collected all the questionnaires in each class without differentiating who completed them. In some cases, the number of ex-ante and ex-post tests for a particular class did not match, as the number of attendees to the class may vary (e.g., due to sickness). The ex-ante and ex-post evaluations were only conducted in the classes that we visited. During our visit, we observed big differences in the classes (e.g., levels of concentration, reading skills, involvement in the activities), this was also displayed in the results from the questionnaires. In total, from the 12 classes that conducted both, we collected 245 ex-ante and 238 ex-post questionnaires that have been used in the analysis. Seven classes filled in only the ex-ante (124 tests), but did not return the ex-post. We have not used that data in the analysis. The results (Table 1) show that there is a 10% increase in the number of correct answers. We can also observe a reduction in the misconceptions, for instance, before performing the activities, 46% of the students thought that particulate matter is bigger than the diameter of a human hair, while after the activities, this wrong answer is only given by 22% of the students. Similarly, most of the students (60%), thought air quality was not a problem in Norway before starting the activities, while after the activities, only 32% of the students replied that air quality was not a problem in Norway. We can also see a decrease of 10% in the number of wrong answers to the question of what we can do to improve air quality.
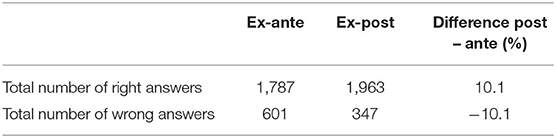
Table 1. Summary of the results from tests obtained in 12 primary classes that conducted the activity.
Even if the conclusions we can extract from the study are limited, the results from the tests indicate that conducting citizen science activities in the classroom can improve science instruction and help knowledge integration by including students' views and taking advantage of the diverse ideas students generated. The citizen science toolbox can help teachers to combine the four key elements that promote knowledge integration: elicit ideas, add new ideas, distinguish among ideas and reflect and sort out ideas (Bonney et al., 2009; Harris and Ballard, 2018).
Conclusions
Currently, most of the low-cost sensors used in citizen science school projects require technological knowledge (e.g., electronics, programming) and are not suitable for primary schools. The citizen science toolbox includes a low-tech method based on paper and petroleum jelly (air meter) suited for small children that still do not have technology as part of their curriculum. Despite being a very simple method, the comparison of the air meter against particulate matter measured at the reference stations show that the air meter has a good agreement with PM10 concentrations and can be used as an indication of air quality levels.
The citizen science school toolbox has proven to be successful in engaging young children in creating their own scientific experiment and eliciting ideas on how to improve air quality in their local environment. The ex-ante and ex-post evaluation showed that overall the toolbox has contributed to increasing knowledge about air pollution among the participating students.
The teachers evaluated positively the adequacy of the toolbox and the possibility to be further integrated as part of the primary schools' curriculum. The citizen science toolbox is openly accessible, allowing to be translated to other languages as well as adapting it to the specific requirement of national school curriculums.
The results of the campaign show that when we provide tools appropriate to the age of the children, they can participate in knowledge creation processes related to their local environment. Enrolling young children in citizen science can play an important role in addressing local environmental challenges as air pollution.
Data Availability Statement
The raw data supporting the conclusions of this article will be made available by the authors, without undue reservation.
Author Contributions
NC: project leader, design of Citizen Science Toolbox, preparation of the material, school engagement, data analysis and write manuscript. SG: school engagement, visits to the schools, preparation of the material, web portal, and supervision of manuscript. LG: design of the material for teachers and students, design of the questionnaires, interviews with teachers, and visits to the schools. MF: design of the web portal, including registration and visualization. JS: field work for the co-location of air meters in the reference stations. BH: engagement with authorities, facilitation of work at the schools, and supervision of the toolbox. All authors contributed to the article and approved the submitted version.
Funding
The creation of the citizen science toolbox for the campaign in Norway was partially funded by the ExtraStiftelsen project 2019/HE1-263918 Ren luft for alle led by NILU-Norwegian Institute for Air Research. The translation of the materials to other languages and the subsequent campaigns was done by members of the ECSA working group on air quality, without specific allocated funding.
Conflict of Interest
The authors declare that the research was conducted in the absence of any commercial or financial relationships that could be construed as a potential conflict of interest.
Acknowledgments
We would like to express our gratitude to Oslo Municipality, and specially Oslo Kommune Bymiljøetaten, Oslo Kommune Utdanningsetaten, and the Oslo Green Capital delegation for supporting the citizen science toolbox for schools from its start. We would like to thank NAAF (Norwegian Asthma and Allergy Association) for their partnership with NILU in the promotion of the toolbox in Norway and ECSA (European Citizen Science Association), especially the air quality working group and the organizing committee of the European Clean Air Day, for promoting the use of this toolbox across Europe.
Footnotes
1. ^https://sensor.community/en/
3. ^https://www.eea.europa.eu/themes/air/urban-air-quality/cleanair-at-school
References
Bonney, R., Ballard, H., Jordan, R., McCallie, E., Phillips, T., Shirk, J., et al. (2009). Public Participation in Scientific Research: Defining the Field and Assessing Its Potential for Informal Science Education. A CAISE Inquiry Group Report. Center for Advancement of Informal Science Education (CAISE), Washington, D.C., United States.
Castell, N., Grossberndt, S., Gray, L., Fredriksen, M., and Høiskar, B. (2020). Ren luft for alle. ExtraStiftelsen project 2019/HE1-263918. Report. NILU – Norwegian Institute for Air Research, Kjeller, Norway.
Den Broeder, L., Devilee, J., Van Oers, H., Schuit, A. J., and Wagemakers, A. (2018). Citizen Science for public health. Health Promot. Int. 33, 505–514. doi: 10.1093/heapro/daw086
EEA (European Environment Agency) (2020). Air Quality in Europe – 2020 Report, EEA Report No 09/2020, European Environment Agency, Copenhagen, Denmark.
Fjukstad, B., Angelvik, N., Wulff Hauglann, M., Sveia Knutsen, J., Grønnesby, M., Gunhildrud, H., and Ailo Bongo, L. (2018). “Low-Cost Programmable Air Quality Sensor Kits in Science Education,” in SIGCSE'18: The 49th ACM Technical Symposium on Computer Science Education (Baltimore, MD), 6 pages. doi: 10.1145/3159450.3159569
Gehring, U., Gruzieva, O., Agius, R. M., Beelen, R., Custovic, A., and Cyrys, J. (2013). Air pollution exposure and lung function in children: the ESCAPE project. Environ. Health Perspect. 121, 1357–1364. doi: 10.1289/ehp.1306770
Grossberndt, S., Castell, N., Gonzalez, E., and Passani, A. (2020). D2.7 Tutorial for Air Quality Projects in High Schools (Version 2.0). Kjeller: Zenodo.
Guarnieri, M., and Balmes, J. R. (2014). Outdoor air pollution and asthma. Lancet 383, 1581–1592. doi: 10.1016/S0140-6736(14)60617-6
Haklay, M. (2013). “Citizen science and volunteered geographic information – overview and typology of participation,” in Crowdsourcing Geographic Knowledge: Volunteered Geographic Information (VGI) in Theory and Practice, eds D. Z. Sui, S. Elwood, and M. F. Goodchild (Berlin: Springer), 105–122. doi: 10.1007/978-94-007-4587-2_7
Harris, E., and Ballard, H. (2018). Real science in the palm of your hand. A framework for designing and facilitating citizen science in the classroom. Sci. Children 55, 31–37. doi: 10.2505/4/sc18_055_08_31
Health and Environment Alliance (2019). Healthier Air, Healthier Children. 50 Schools Across the EU Monitor Air Quality. Brussels: HEAL Report.
Keywords: air quality, low-tech monitoring, citizen science, primary schools, inclusiveness, knowledge integration
Citation: Castell N, Grossberndt S, Gray L, Fredriksen MF, Skaar JS and Høiskar BAK (2021) Implementing Citizen Science in Primary Schools: Engaging Young Children in Monitoring Air Pollution. Front. Clim. 3:639128. doi: 10.3389/fclim.2021.639128
Received: 08 December 2020; Accepted: 01 March 2021;
Published: 24 March 2021.
Edited by:
Sven Schade, European Commission, ItalyReviewed by:
Danang Eko Nuryanto, Indonesian Agency for Meteorology, Climatology and Geophysics, IndonesiaMartin Scheuch, University College for Agrarian and Environmental Pedagogy, Austria
Copyright © 2021 Castell, Grossberndt, Gray, Fredriksen, Skaar and Høiskar. This is an open-access article distributed under the terms of the Creative Commons Attribution License (CC BY). The use, distribution or reproduction in other forums is permitted, provided the original author(s) and the copyright owner(s) are credited and that the original publication in this journal is cited, in accordance with accepted academic practice. No use, distribution or reproduction is permitted which does not comply with these terms.
*Correspondence: Nuria Castell, bmNiQG5pbHUubm8=