 Emily C. Adams1,2*
 Helen B. Parache1,2
 Emil Cherrington1,2
 Walter L. Ellenburg1,2
 Vikalp Mishra1,2
 Ronan Lucey1
 Catherine Nakalembe3
- 1Earth System Science Center, The University of Alabama in Huntsville, Huntsville, AL, United States
- 2NASA SERVIR Science Coordination Office, Marshall Space Flight Center, Huntsville, AL, United States
- 3Department of Geographical Science, University of Maryland, College Park, MD, United States
The 2019–2020 Desert Locust (DL) upsurge in East Africa threatened food security for millions in the region. This highlighted the need to track and quantify the damaging impacts of the swarming insects on cropland and rangelands. Satellite Earth observations (EO) data have the potential to contribute to DL damage assessments that can inform control measures, aid distribution and recovery efforts. EO can complement traditional ground based surveys (which are currently further limited due to COVID-19), by rapidly and cost effectively capturing the full spatial scale of the DL upsurge. However, EO-based techniques struggled to accurately quantify damage from this DL upsurge due to the sporadic and localized nature of infestations impacting scale, timing, and anomalous vegetation conditions. This study analyzed time series data from MODIS, the harmonized Landsat Sentinel-2 product, and C-band radar data from Sentinel-1 to distinguish DL damage from normal senescence or other confounding factors from January to June 2020. These data were compared to in situ locust swarm, band, and non locust observations collected by the Food and Agriculture Organization (FAO) and PlantVillage. The methods presented did not produce results that could confidently differentiate senescence from locust activity, and may represent a limitation of publicly available remotely sensed data to detect DL damage. However, the higher spatial resolution data sets showed promise, and there is potential to explore commercially available satellite products such as Planet Labs for damage assessment protocols.
1. Introduction
Desert locusts (Schistocerca gregaria) (DL) are considered one of the most dangerous migratory pests on the planet (Cressman, 2016; Gómez et al., 2018; Shrestha et al., 2021). They typically inhabit the arid regions stretching from West Africa to the Indian subcontinent and exist in a relatively unremarkable solitary phase (Cressman, 2016; Gómez et al., 2020; Shrestha et al., 2021). However, under favorable climatic conditions, DL can phase change into gregarious swarms, breeding, and devoring vegetation at massive scales (Pener, 1991; Sword et al., 2010). DL need wet, sandy soils to lay eggs and fresh green vegetation to sustain themselves (Pener, 1991; Collett et al., 1998). After hatching, they exist in a hopper phase, when they do not have wings (Pener, 1991). During the gregarious phase, these hoppers form bands of many millions of individuals marching together (Pener, 1991). Upon maturity, the locusts grow wings and swarm and copulate. Once again, the locusts look for the right soil conditions to lay eggs. This life cycle takes ~2–3 months (Pener, 1991). Utilizing synoptic wind patterns, DL can fly up to 100–150 km per day (Cressman, 2016; Food and of the United, 2020). Thus, when the right precipitation conditions occur and egg laying becomes very successful over a short period of time, swarming occurs (Pener, 1991; Collett et al., 1998; Sword et al., 2010). DL swarms migrate seasonally following well documented migratory routes (Homberg, 2015). These conditions came to fruition in late 2019 following cyclones in the Arabian Sea. Cyclones Mekunu and Luban in 2018 provided enhanced regional rainfall, particularly on the Arabian peninsula, and cyclone Pawan in 2019 created wind patterns enabling the DL to invade East Africa (Salih et al., 2020). An upsurge occurs when a very large increase in locust numbers and multiple outbreaks occur, leading to the production of two or more successive generations of transient-to-gregarious breeding in complementary seasonal breeding areas (Cressman, 2016). Since October 2019, rainfall in East Africa was anomalously high in desert areas, creating favorable conditions for DL activity including breeding and gregarization. Figure 1 illustrates the 3 month anomalies for the October, November, December 2019 and January, February, March 2020 time periods. These anomalies were calculated using the Climate Hazards Group InfraRed Precipitation with Station Data (CHIRPS) using the deviations from the long term (since 1980) climatology. In fact, due to the conditions outlined above, and the economic instability in Yemen reducing strategic control, the FAO noted in the September 2019 Desert Locust bulletin that the region was under threat for increasing DL activity. DL migratory patterns are also well documented, following the synoptic winds and vegetation green up. During upsurge, a typical 1 km squared swarm can contain 150 million locusts, and consume as much food as 35,000 people each day (Food and of the United, 2020). This can lead to widespread devastation of vegetation and crops over impacted areas, severely effecting local food security.
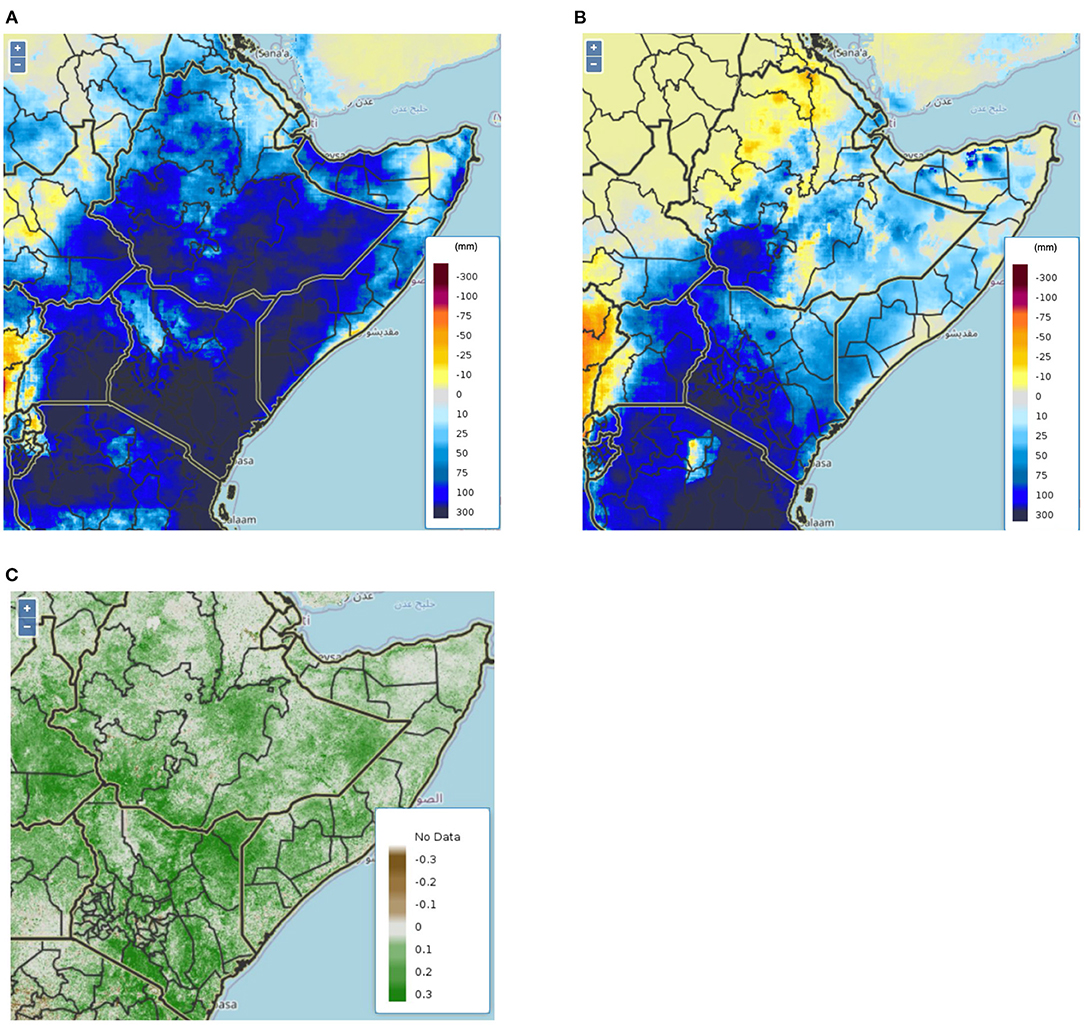
Figure 1. Three month precipitation anomalies derived from the Climate Hazards Group InfraRed Precipitation with Station Data (CHIRPS) for October, November, and December 2019 (A), and January, February, March 2020 (B). The region experienced ~50–300 mm more precipitation than average 3-monthly periods leading to enhanced greenness throughout the region (C) showing MODIS derived NDVI anomalies from the second dekad in January 2020.
Control strategies vary widely across the DL impacted areas depending upon the region, growth stage, and resource availability (Djibo et al., 2006; Klein et al., 2021). The FAO, the leading organization in DL control, prediction, and support, operates the Desert Locust Early Warning System, which uses a combination of remotely sensed, modeled, and in-situ information to understand DL phase and spread to inform management and control operations (Djibo et al., 2006; Cressman, 2013). The countries along the arid regions in northern Africa and the Arabian Peninsula are frequently impacted by locust infestations. These “front line countries” maintain locust control teams and report sightings and conditions back to the FAO, including the Desert Locust Control Organization for East Africa (DLCO-EA) and the Commission for Controlling the Desert Locust in the Western [Africa] Region (CLCPRO). This information feeds periodic bulletins on regional locust activity and informs control strategies (Cressman, 2013). Remotely sensed information, such as vegetation conditions, soil moisture, and precipitation, provide survey teams with general locations for favorable DL activity. These targets are of limited utility due to their large size, coarse resolution, remoteness, and local instability (Cressman, 2013; Ellenburg et al., 2021). Although control measures, such as localized spraying, burning, or trapping, ideally target sedentary eggs, widespread use of pesticides is also common during the swarming stage. During the most recent outbreak in West Africa, 13 million liters of pesticides were distributed to affected countries at a cost of about 280 million USD (Djibo et al., 2006). Many East African countries, who do not see upsurges often, lack the national capacity and ground presence to implement control measures effectively (Salih et al., 2020).
Satellite EO can complement and augment ground observations and monitoring, providing the potential to consistently monitor surface conditions, particularly over remote and hard to access locations. EO data have been successfully used to identify pest breeding locations (Ellenburg et al., 2021), monitor habitat (Klein et al., 2021), and predict distributions (Klein et al., 2021). As it is impractical to directly map DL from satellite observations due to spatial resolution requirements, typically other parameters are monitored to predict where DL are likely to thrive. For example, soil moisture and wind direction have been used to predict the likely spread of DL swarms for targeted interventions (e.g., Ellenburg et al., 2021). DL populations have also been successfully forecast through mapping emerging vegetation (Latchininsky, 2013).
Many EO-based studies include the use of optical imagery such as Aqua and Terra MODIS and the Landsat series, deriving Normalized Difference Vegetation Index (NDVI) and land cover from these datasets to arrive at DL habitat as described in the review by Klein et al. (2021). Thermal infrared sensors as well as active radar sensors have been used to measure temperature, precipitation, and soil moisture to identify DL habitat (Klein et al., 2021). Limitations of using remote sensing to monitor these proxy variables include low spatial and temporal resolution, as DL have localized impacts and yet travel rapidly over large areas. In addition, many EO-data layers, such as land cover and meteorological variables, that could be useful for DL detection are often out of date and can be time consuming and expensive to generate.
Few studies quantify damage from DL using remote sensing techniques, focusing instead on parameters such as NDVI, precipitation, and wind (Klein et al., 2021). Anomalous behavior of satellite observations such as vegetation conditions can provide significant information on the impact of pest infestations on vegetation (Wójtowicz et al., 2016). There have been instances where remote sensing has been used to assess pest damage or plant stress, but not in context of DL. Studies mapping locust damage such as the above have not focused on S. gregaria and the majority have relied on very high spatial resolution (VHR) imagery or hyperspectral data (Chavez, 1994; Genc et al., 2008; Pekel et al., 2011; Cressman, 2013). However, these data are not widely available and are expensive and hence the methods cannot be applied systematically (Klein et al., 2021).
Remote sensing of vast areas using multispectral and high spatial resolution (between 10 and 30 m) has become more accessible in recent years, thanks in part to the launch of the Sentinel-2 constellation that complements the Landsat series, as well as increased access to cloud computing resources to process high data volumes, including platforms such as Google Earth Engine (GEE), (Nakalembe et al., 2021). Nonetheless, damage caused by DL can be difficult to quantify with EO-data due to the sporadic and localized nature of infestations, agro-climatology and timing of the event. Yet, this information is valuable, supplementing ground based surveys that inform ground control operations, and aid distribution. In 2020, EO-based assessment were even more critical for capturing the full spatial scale of the DL upsurge limited ground operations due to COVID-19 related travel restrictions. Moreover, the regions in which DL are often active are remote and sparsely populated, limiting accessibility required to quantify impacts. However, these same remote regions often provide valuable resources for pastoral communities, wildlife, and subsistence cropland areas. With increased variability in regional climates and control measures hampered by global geopolitics, regional and national insecurity, DL outbreaks of large magnitude such as the 2019–2020 upsurge in Eastern Africa will likely increase, and the need to develop and improve methods to detect DL damage from remote sensing will become more valuable.
This research presents methodologies that could be used to systematically identify vegetation damage caused by DL. The methods are applied to the 2019–2020 DL upsurge in East Africa described at the worst upsurge in 25 years for Somalia and Ethiopia and worst in 70 years for Kenya (Nakalembe, 2020). Aiming to fill gaps in the research on using EO observations for DL detection, this work focuses on damage detection and acknowledges the need to distinguish DL damage from normal senescence and other confounding factors. The methods described were designed to take into account vegetation cycles, as migratory patterns of DL follow peak vegetation greenness (Pekel et al., 2011; Cressman, 2013; NOA, 2016). This investigation includes a data fusion approach combining higher resolution data and Sentinel 1 Synthetic-aperture radar (SAR) data. Few studies have applied Sentinel 1, VHR, and data fusion to DL damage detection (Klein et al., 2021). Successfully identifying DL damage would enhance the efficiency of distributing aid and measuring the efficacy of control measures.
2. Materials and Methods
2.1. Study Area
This study focuses on the Greater Horn of Africa (GHA) region that experienced the 2019–2020 DL upsurge. First reports of DLs in the GHA were received by the FAO in late 2019 (Salih et al., 2020). Djibouti, Eritrea, and Ethiopia began their control efforts as swarms growth increased significantly in Yemen and DL made their way across the Red Sea. Further, the typically “dry” season of January–March saw abnormally high rainfall (Figure 1), creating the perfect egg laying conditions across the arid and semi arid regions of the GHA. Soil texture, moisture and temperature are limiting factors for DL breeding and egg incubation, and are also leading indicators for vegetation growth (Batten, 1969; Mukerji and Gage, 1978; Padgham, 1981; Peng et al., 2020; Ellenburg et al., 2021). The incubation period and subsequent life stages of the DL vary widely depending on soil and air temperature. The incubation period ranges between 14 and 22 days and the hopper life stage can last for 35–45 days (NOA, 2016). Therefore, it is expected that egg laying occurred 3–10 weeks prior to hopper observations (Ellenburg et al., 2021) corresponding to vegetation green up. This analysis focused on the period from December 2019 to June 2020 time frame in the GHA (Figure 2). This time frame thus includes any areas that would be utilized for rangelands or croplands and would directly impact food security in the region.
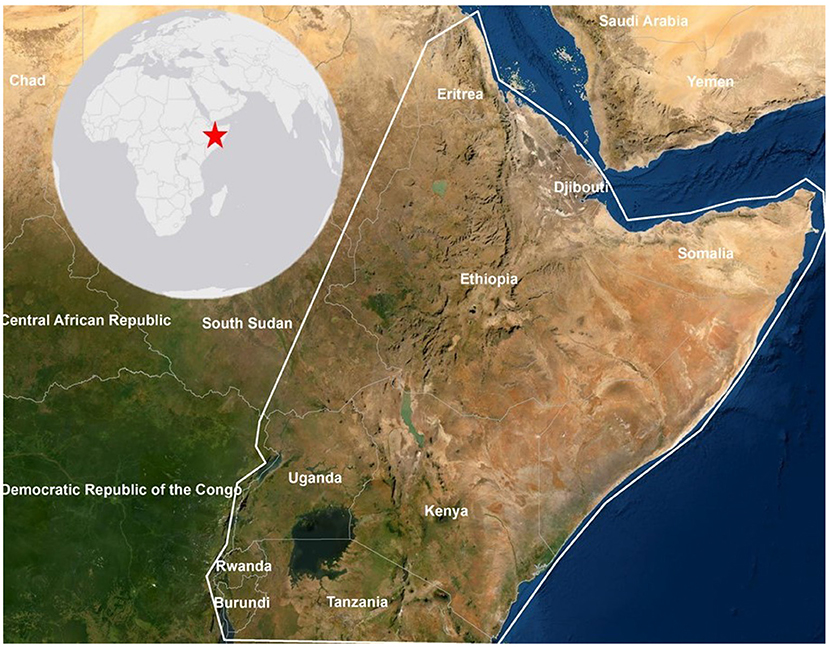
Figure 2. The study area includes Burundi, Djibouti, Eritrea, Ethiopia, Kenya, Rwanda, Somalia, parts of Sudan and South Sudan, Uganda, and Tanzania.
2.2. Data Sets
2.2.1. Remote Sensing Data
A wide variety of remotely sensed datasets were used in this study in order to complement spatial or temporal shortcomings of any particular mission (Table 1). Optical data from the Moderate Resolution Imaging Spectroradiometer (MODIS) sensor on board the AQUA and TERRA satellites offer a daily temporal resolution but are limited spatially at 250 m. Whereas the Landsat 8 and Sentinel-2 missions have revisit times of 16 and 5 days, respectively, but have much higher spatial resolutions (30 and 10 m). The relatively low revisit periods of the Landsat and Sentinel satellites often results in data gaps due to cloud cover. Thus, a harmonized Landsat-Sentinel (HLS) product was created in GEE according to the specifications outlined in Claverie et al. (2018). The HLS dataset was used in addition to using MODIS, Landsat 8, and Sentinel-2 separately to compute vegetation condition indices such as the NDVI (Rouse et al., 1974) and Modified Soil Adjusted Vegetation Index (MSAVI) (Qi et al., 1994).
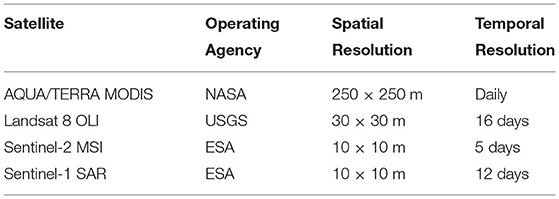
Table 1. Remote sensing datasets used in this study.
In addition to optical datasets, C-Band synthetic aperture radar (SAR) data from the Sentinel 1 missions were also used. SAR provides information about the texture of the Earth's surface and is not limited by cloud cover. Specifically, Sentinel-1 C-band vertical-vertical (VV) and vertical-horizontal (VH) backscatter are known to be sensitive to changes in vegetation conditions, such as damage caused by hail (Bell et al., 2020) and above ground biomass (AGB) (Pereira et al., 2018). Areas that have been damaged by DL are expected to have lower backscatter power due to a reduction in vegetation cover. As the cross-polarized signal is dominated by vegetation cover, rather than the surface (Woodhouse, 2005), the VH analysis is expected to be more useful for distinguishing potential locust impact.
2.2.2. Ground Data
The FAO maintains a publicly available database of locust reports (FAO, 2020b). These reports are compiled from many sources, but in most cases contain the geographic location of the sighting and the life cycle stage of the locust. The general stages of gregorious DL include egg, hopper bands, and swarm. After the eggs hatch, juvenile DL form large groups of hoppers or hopper bands. At this life stage the DL cannot fly. These observation points, particularly at the swarm and hopper band stages, were used as in-situ reference dataset for this study. Non-locust observations, where no DL were observed at that time and place, were acquired from PlantVillage and are available from March 2020. January and February had no non-locust locations with which to compare the swarm and band locations. Observations were not evenly distributed throughout the study period. Bands and none observations increased from December 2019 to June 2020. Swarm observations increased as well, except for a lull in May 2020.
In addition to the ground based data sets available through FAO, the researchers also compiled ancillary information. These ancillary datasets included survey data from the United States Agency for International Development. This supplementary information was used for qualitative comparisons of locust sighting locations.
2.3. Time Series Analysis
Using the HLS and MODIS data, time series at each of the band, swarm, and non-locust observations were analyzed for every available non-cloudy pixel. This analysis utilized vegetation indices such as NDVI and MSAVI to map the presence and health of vegetation. Typically NDVI is used to map vegetation, however MSAVI was developed to account for the impact of soil in areas with low vegetation density (QI1994119) such as is prevalent in GHA. Despite MSAVI's expected advantages in detecting actual vegetation conditions, the analysis showed that both NDVI and MSAVI had very similar temporal dynamics. Thus, only the NDVI results were used in this study for analysis and discussions.
The MODIS NDVI was compared to HLS NDVI over band, swarm, and non-locust observations based on the number of days before and after the observation. The HLS NDVI at the pixel corresponding to the band sighting was averaged with the surrounding eight pixels for all available scenes in the study period. This time series was then smoothed using cubic interpolation (McKinney, 2010) to remove anomalous highs and lows. NDVI before and after the event, i.e., the time of the band/swarm sighting, was divided by NDVI during the event. This is termed relative NDVI. Using relative NDVI normalizes the impact of the natural vegetative cycle and different timings of sighting. Relative NDVI from HLS was then compared with the equivalent MODIS NDVI. Two examples are presented here, located in Ethiopia (Figure 3). These sites were selected as representative of the region after a thorough analysis of random sites distributed across the GHA. It was expected that if damage due to DL was detected, the NDVI values would decrease after a band sighting by a larger amount for the higher resolution HLS data set when compared to the lower resolution MODIS data set.
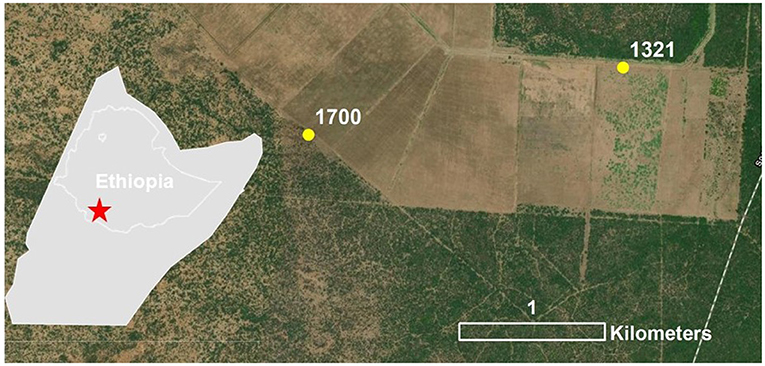
Figure 3. Band observation sites in Ethiopia where NDVI derived from HLS was compared with NDVI derived from MODIS.
2.4. Monthly Composites Analyses
2.4.1. Harmonized Landsat Sentinel 2 Analysis
Using the HLS data, NDVI and Hue were calculated on a monthly basis to account for regional cloud cover, particularly prevalent during the rainy seasons. The benefits of using NDVI were stated in the previous section. Hue was selected as some studies have found value in using the hue values as a proxy for vegetation condition in the arid and semi arid regions where locusts inhabit (Pekel et al., 2011). Hue, saturation, and value, can be converted from any band, however the red, green, blue, and SWIR bands (bands 4, 3, 2, 7, and 6, respectively) were used for this analysis. This transformation was completed for the HLS data set on a monthly scale. Median NDVI pixel values for each month from December 2019 to June 2020 were calculated. Monthly composites of median NDVI for the time period of 2015 (Sentinel 2 launch) through November 2019 were also created as a baseline reference period. This represented the longest term similar data set for comparison due to the recency of Sentinel 2 data.
2.4.2. Sentinel 1 Analysis
Cloud cover was frequently an issue, therefore, a multitemporal analysis of Sentinel 1 C-band data was conducted, as SAR data is able to penetrate through cloud cover (Woodhouse, 2005). Backscatter power for locust and non-locust locations were compared to see if there were changes indicating the presence of locust damage. First, the median backscatter was selected from a 3-month moving window over the study area for December 2019–June 2020. The resulting six median layers were extracted by known DL locations [band (N = 3,799) and swarm (N = 2,646)], and non-locust locations (N = 13,502) to see if there was a difference in the medians of these groups. Sightings were grouped by the same time periods as the Sentinel 1 imagery. VH and VV backscatter power were extracted by swarm and band sites and non-locust locations and compared. A similar analysis was repeated at a monthly time step to take greater advantage of the temporal resolution of Sentinel 1. A similar analysis was repeated at a monthly time step to take greater advantage of the temporal resolution of Sentinel-1. Single scenes, which would have taken full advantage of the higher temporal resolution of the Sentinel-1 dataset, were not investigated. Evaluating monthly medians also reduced potential impacts from speckle, or natural variation that occurs even over homogeneous surfaces, per Woodhouse (2005). Another reason for using the Sentinel-1 data at a monthly timescale was that it also made the analysis comparable to the one done using the Harmonized Landsat Sentinel-2 (HLS) dataset, which, due to cloud cover, was likewise generated at a monthly timescale. For that reason, use of Sentinel-1 imagery at a monthly timescale was therefore determined to be more appropriate.
3. Results
3.1. MODIS Time Series Analysis
The NDVI values were compared for MODIS and HLS at known band, swarm, and non-locust observation sites as a function of days before and after the observation date (Figure 4). Over locust and non-locust sites, the relative HLS NDVI varied more than the relative MODIS NDVI, indicating that the HLS may have recorded greater changes in vegetation than the MODIS. Sixteen days after the observation, the median relative HLS NDVI dropped slightly (<0.1) for band and non-locust sites while the median relative NDVI at swarm sites remained nearly the same. This indicates that the relative HLS NDVI is not immediately detecting notable vegetation change at locust locations.
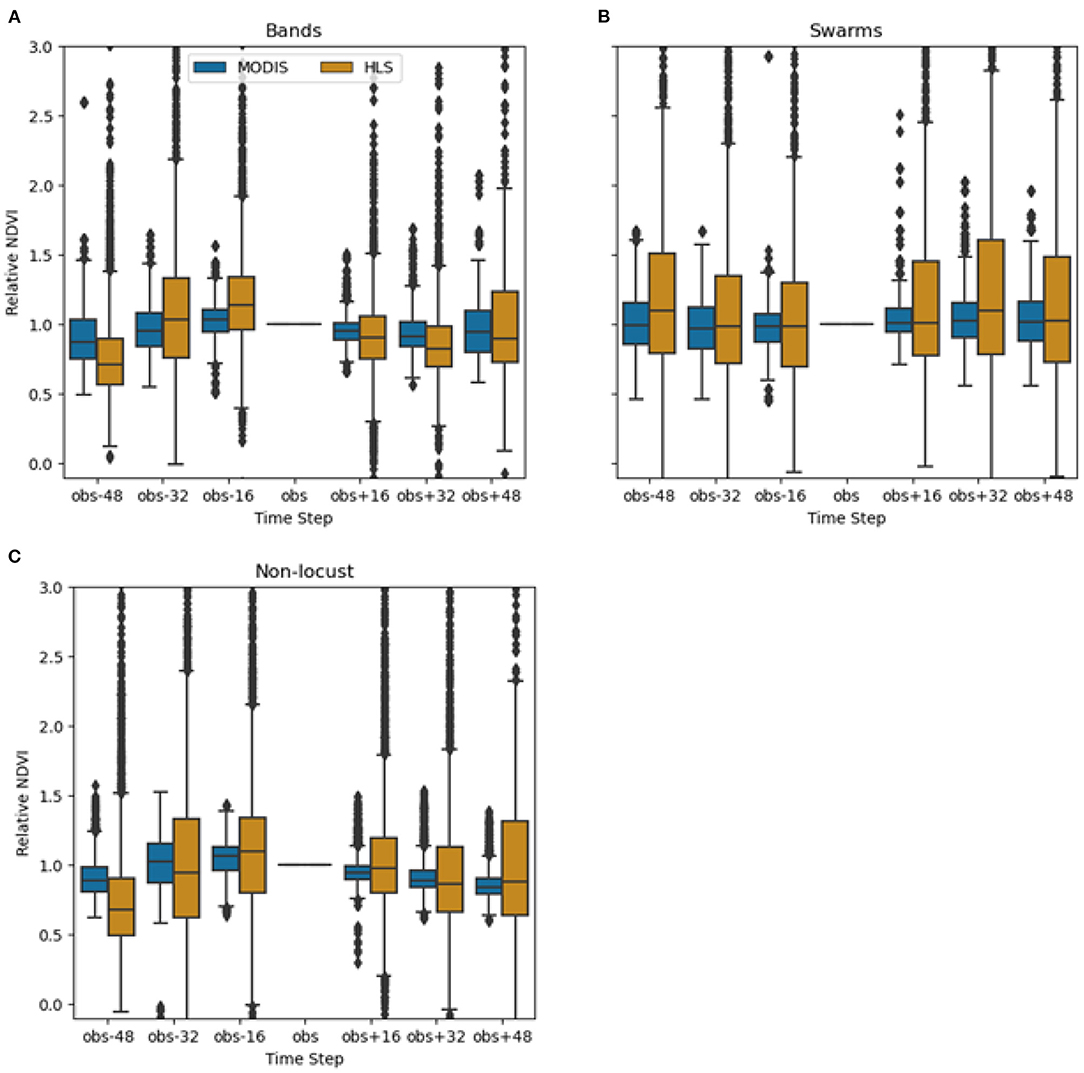
Figure 4. Relative NDVI of MODIS vs. HLS compared over band (A), swarm (B), and non-locust (C) sites [n = 36,820, n = 24,696, n = 72,863].
The case studies of individual band sites, #1321 (Figure 5B) and #1700 (Figure 5A), illustrated that the average relative NDVI over the average of the pixel corresponding to the band sighting and the surrounding eight pixels from the HLS followed the same trends as the relative NDVI from MODIS, although in general the magnitude of HLS NDVI values were lower. For example, NDVI lows occurred at site #1321 in October, February, and May for both datasets. Similarly, for site #1700, the peaks in November and June appeared in both datasets. Since NDVI from both HLS and MODIS follow the same general trends over the study period, the differences in the NDVI change between the HLS and MODIS during or after a band observation were potentially attributed to vegetation change occurring at a higher spatial resolution, for example DL damage. However, the NDVI trends at site #1321 and site #1700 do not convincingly demonstrate DL damage. At site #1321, the HLS NDVI decreased (<0.05) at the observation date. However, the MODIS NDVI also decreased (~0.1). This suggests that the vegetation change occurred over an area larger than would be expected than if it were due to DL damage. At site #1700, the HLS NDVI decreased (<0.05) while the MODIS NDVI increased (~0.05). This lack of a clear pattern in direction and magnitude of NDVI change between HLS and MODIS does not lend itself to identification of DL damage. Ultimately, investigating a higher resolution dataset with this method may yield interesting results for DL damage detection.
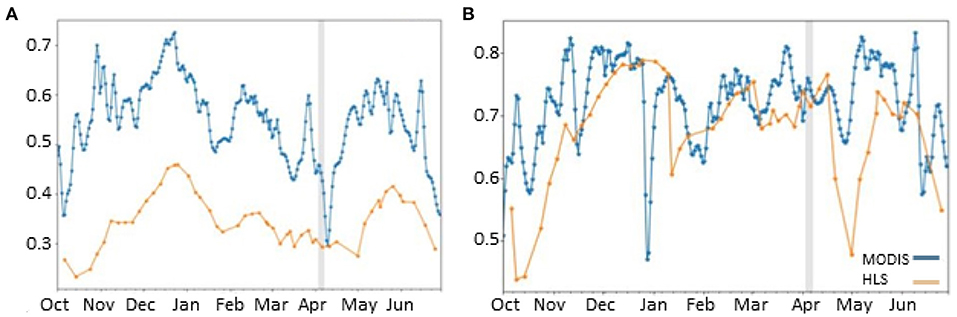
Figure 5. Time series of NDVI from MODIS and averaged HLS at site #1700 (A) and site #1321 (B). The vertical grey line indicates the date the band was observed.
3.2. Monthly Composites Analyses
3.2.1. Harmonized Landsat Sentinel-2 Analysis
The monthly HLS composite analysis did not show definitive evidence of damage. Band and swarm data sets were compared to non-locust points for the months of March through June 2020 using both NDVI (Figure 6A) and Hue calculated with the shortwave infrared band combination 7, 5, 4 (Figure 6B). Hue was also calculated using the natural color bands (4, 3, 2) and the shortwave infrared, near infrared, and red channels (6, 5, 4) but the pattern was very similar to the 7, 5, 4 combination and therefore only 7, 5, 4 is presented here.
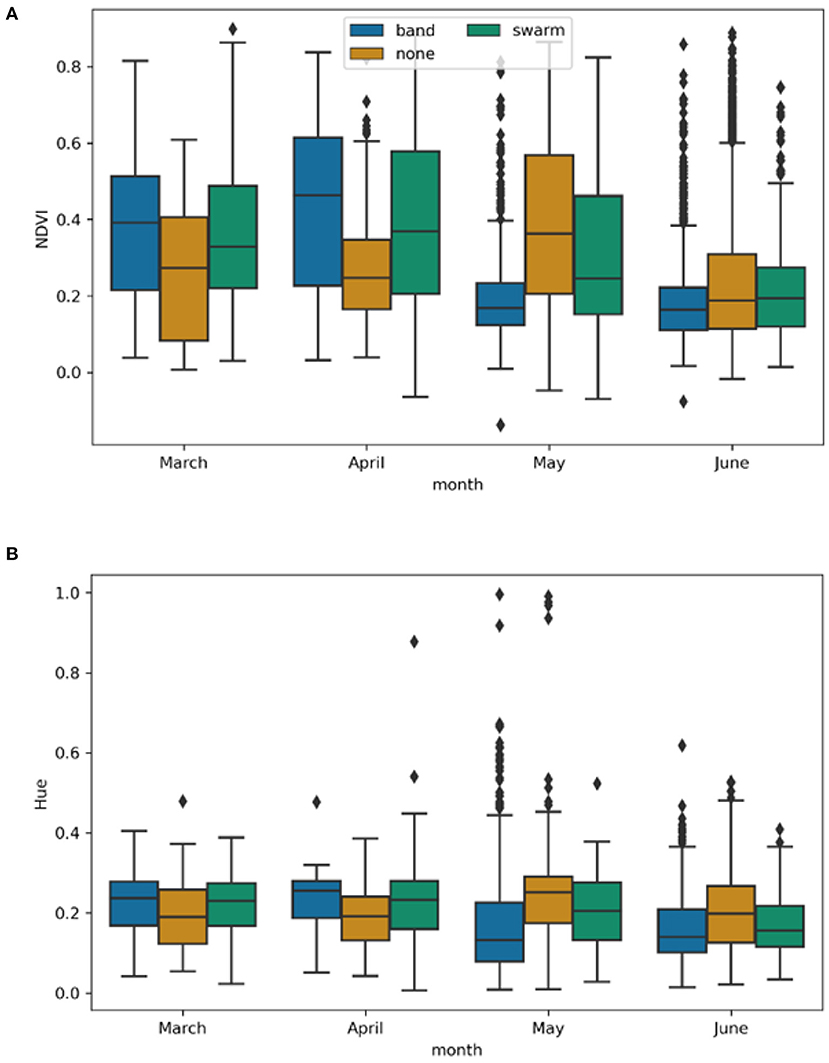
Figure 6. (A) NDVI values at locust swarm, band, and non locust observations for the months of March through June 2020. (B) Hue values from the 7, 5, 4 band combination at the locust swarm, band, and no locust observations for the months of March through June 2020. Neither index showed distinct differences between locust activity and non locust activity.
The NDVI values showed a normal distribution and student pair wise t-tests were performed for each month comparing band against non locust and swarm against non locust data points. All comparisons resulted in significant differences between the data sets with p-values < 0.05. In all months if damage was identified, we would have expected NDVI to be higher at the none points, however this was not the case. In March and April, NDVI is higher for the bands and swarms compared to the none points. The reverse is true in May, and in June the means are all very close. There was high variability in NDVI within each month, therefore even when an NDVI value was lower it was not conclusively due to locust activity.
The hue transformation showed a similar pattern to NDVI, but reduced the range of values toward 0. This made interpretation more difficult as the means became closer together and the variance remained large across all categories. In this case the use of hue as an index was less useful than NDVI.
3.2.2. Sentinel-1 Analysis
Results of the multitemporal analysis were inconclusive, suggesting that a shorter time frame could reveal more information than the multitemporal, 3-month composites. For the monthly analysis, the VV values for bands, swarm, and none points ranged −26 to 4 db whereas VH ranged from −33 to −4 db (Figure 7). Thus, the median backscatter power for VV tends to be higher than VH for all locust and non-locust locations. This trend is expected, as VV and VH respond differently to surface characteristics. More importantly, the differences between the median backscatter power of both swarm and band locations vs. the non-locust locations did not clearly signal vegetation change, including the presence of locust damage.
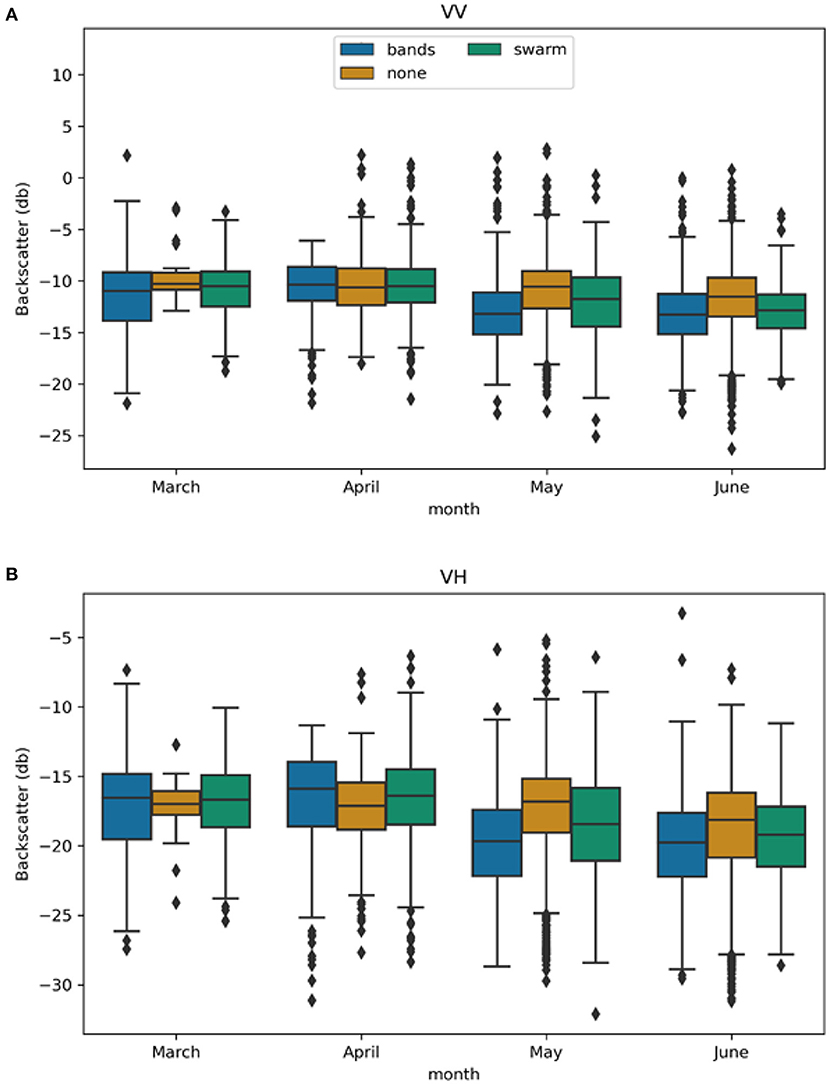
Figure 7. Box plots of monthly VV (A) and VH (B) median backscatter power from Sentinel 1 C-band at swarm, band, and non-locust locations for March through June 2020.
Taking a closer look at the median backscatter power for VH (Figure 7), for March and April, the median backscatter power for non-locust sites was less than the median backscatter power for bands and swarms. For March, the absolute difference between the non-locust the and swarm medians and the absolute difference between the non-locust and band medians were both <0.5 db. For April, the absolute difference between the non-locust and swarm medians was 0.7 db and the absolute difference between the non-locust and band medians was 1.2 db. For May and June, the median backscatter power for non-locust sites was greater than the median backscatter power for bands and swarms. For May, the absolute difference between the non-locust and swarm medians was 1.6 db and the absolute difference between the non-locust and band medians was 2.9 db. For June, the absolute difference between the non-locust and swarm medians was 1.0 db and the absolute difference between the non-locust and band medians was 1.6 db. In addition, the ranges for all location type had a large amount of overlap overall for each month.
Taking a closer look at the median backscatter power for VV (Figure 7), for March, May, and June, the median backscatter power for non-locust sites was greater than the median backscatter power for bands and swarms. For March, the absolute difference between the non-locust the and swarm medians and the absolute difference between the non-locust and band medians were both <1.0 db. For April, the median backscatter power for non-locust sites was less than the median backscatter power for bands and swarms. For June, the absolute difference between the non-locust and swarm medians and the absolute difference between the non-locust and band medians were both <2.0 db. For May, the absolute difference between the non-locust and swarm medians was 1.20 db and the absolute difference between the non-locust and band medians was 2.63 db. As with the VH, the ranges for all location types overlapped greatly each month. Thus, there is also no consistent pattern of VV or VH backscatter power that indicates locust damage at this temporal and spatial resolution with this method.
4. Discussion
Several methodologies were tested to attempt to detect DL impact, however, only the HLS monthly composite analysis showed very slight potential evidence of damage and only during March and April. There were several limitations, including spatial and temporal resolution, for each methodology that did not overcome their hypothesized utility. Time series data did not clearly indicate vegetation change. However, these data were very noisy and specific conclusions are uncertain. It is clear that spatial scale could play a role in damage detection of DL.
Leveraging SAR data was also challenging. There is not an extensive catalogue of openly available SAR data to compare current conditions with previous, as Sentinel 1A was launched in 2014 and 1B in 2016. This study chose to also focus on monthly medians which did not take full advantage of the temporal resolution of the Sentinel-1 data set. Future work may want to evaluate every available SAR image for changes in backscatter as opposed to monthly composites. Finally, speckle, or natural backscatter variation that occurs even over homogeneous surfaces (Woodhouse, 2005), may obscure the relatively small areas of locust damage.
There were several confounding factors that made this analysis challenging despite utilizing methods designed to overcome these limitations. Due to the intense rainfall from late 2019 into 2020, the region was exceptionally green. This reduced the utility of comparisons to similar years or anomaly analyses and we did not systematically incorporate these methods for that reason. This enhanced greenness not only made damage assessment challenging, but it also may reduce the successful application of such information for food security assessments. For example, regionally, pasture land had higher than normal vegetation due to the enhanced rainfall, and we could expect that grazing communities had sufficient fodder for their animals and therefore may not have experienced food insecurity despite DL impacts.
Seasonality can also play an important role in impact analysis. Natural senescence grasslands or crop harvesting in agricultural areas will also confound DL damage assessments using remotely sensed data. For this reason, disaggregating the vegetation cover by land use type may prove important in future analyses.
The Food Security and Nutrition Working Group (FSNWG) at the FAO completed several iterations of East African ground based DL impact assessments after harvest (FAO, 2020a, 2021). The first assessment involved interviews from over 10,000 agricultural households across East Africa in June and July of 2020. These interviews were conducted largely after the period included in our remote sensing analysis. They found roughly a third of livestock or cropping households reported losses, and half of those reporting indicated high losses (FAO, 2020a). These in-person interviews do not align temporally with the remotely sensed information we gathered from this study and were aggregated spatially to protect individual identities. Further, participants were asked to report presence or absence of locusts and did not provide exact dates that could have been correlated to results from this analysis. However, it is important to recognize that farmers are reporting damage while the remotely sensed information does not conclusively detect it.
In general the ground data collected by the FAO proved to be challenging to use as a proxy for damage. While the creation, deployment, and momentum around crowd sourced information is highly commendable in such a short period of time, it became clear through this analysis that a positive or negative locust sighting, and subsequent life stage, was not sufficient to support the identification of locust damage with remotely sensed data. Numerous characteristics associated with these DL populations may also have proven important. For example, size of the swarm, density, or activity of DL could have helped identify which DL points might be expected to show vegetation damage. While this type of information was available for some points, it was not available for the majority. In many cases, DL could have been reported while flying to other locations, so while the data we have show locust observations at a specific latitude and longitude, it is not known if damage would be expected at that location. Further, DL are capable of traveling extensively and quickly over vast distances. Thus, the same swarm may have been reported by several individuals in the same time period, diluting the relevant ground observation data. The successes of the application development and deployment show significant promise for future crowd sourced data, and what has been collected during the course of this upsurge has been incredibly valuable for ground based, real time DL monitoring and other DL applications such as supporting a finer resolution soil moisture product for DL breeding ground forecasting (Ellenburg et al., 2021). We hope this research will be able to inform application updates in order to create data that can be utilized more effectively for this purpose in the future.
Literature and personal testimonies show that Locust damage is sporadic yet highly destructive, similar to that of a tornado; leaving one field totally destroyed while their neighbor is spared (Krall and Herok, 1997; Latchininsky, 2013). The spatial and temporal resolution of the publicly available Earth observation datasets used for this study are unlikely to capture the level of detail associated with that destruction pattern, and may even leave time for vegetation regrowth before a new satellite observation can occur. The higher spatial resolution datasets, like the Sentinel 2 satellites (10 m) have 5 day revisit times during cloudless conditions, which are unlikely in this region. While a 10 m pixel may have a slight decline in greenness due to DL damage, it may not be large enough to convincingly identify decline. Therefore, establishing a decline in vegetation conditions due to DL with data that may not temporally align with cloudless before, during, and after satellite overpasses was challenging. Further, creating cloud free mosaics extends the temporal time scale in order to ensure cloud free pixels. In this region, during this time of year, even monthly scales had cloud contaminated pixels. An additional confounding factor is vegetation recovery. There is limited research on how vegetation damage from DL rebounds and with extended revisit time periods vegetation recovery may dilute a remotely sensed signal. MODIS data, at daily revisit times, and an extensive historical record might prove important, however the spatial scale of 250 × 250 m was too large in this case to assess the sporadic event. The results do show promise as high spatial resolution data sets were evaluated, therefore, there is potential for higher spatial resolution data from the private sector, such as Planet, to support these types of analyses although these data are not publicly available.
It seems as though both the complexities associated with tracking and recording ground observations of DL, and the limitations (spatial and temporal) associated with current publicly available EO capabilities compound to create circumstances that our current understanding of remote sensing cannot overcome. The influence of these confounding factors is challenging and frustrating, particularly in this area where utilizing remote sensing can be an incredibly powerful tool to help overcome data gaps and inform decisions. Nevertheless, as more sophisticated ground data techniques evolve, additional satellite capabilities come on line, and big data techniques become more accessible, there is potential to continue to explore remote sensing for these types of questions. This is particularly important to acknowledge as climate change is currently creating more erratic precipitation patterns in East Africa, which are predicted to become more unpredictable with time (Thornton et al., 2014). It is likely that these erratic precipitation patterns will create more opportunities for DL to survive and thrive in their current range and potentially expand that range to new regions. While this event was a once in 70 year disaster, it is unlikely that another 70 years will pass before seeing a similar event (Salih et al., 2020). Supporting the infrastructure to design and implement ground observations and remote sensing of vegetation conditions for food security are essential to building more resilient communities.
Data Availability Statement
Publicly available datasets from NASA, ESA, and FAO were analyzed in this study as indicated in the Data Sets section. Further inquiries can be directed to the corresponding author.
Author Contributions
EA, HB, EC, WL, and VM contributed to the research design and execution of the methods described. EA and HB took the lead on manuscript drafting with support from EC, WL, VM, RL, and CN. RL and CN supported research design and provided valuable inputs into the manuscript. All authors contributed to the article and approved the submitted version.
Funding
This research was funded by the joint U.S. Agency for International Development (USAID) and National Aeronautics and Space Administration (NASA) initiative SERVIR and particularly through the NASA Applied Sciences Capacity Building Program, NASA Cooperative Agreement NNM11AA01A. The Regional hubs, RCMRD, and AGHRYMET provided technical support and in country coordination in the development, implementation. and validation of the methodologies.
Conflict of Interest
The authors declare that the research was conducted in the absence of any commercial or financial relationships that could be construed as a potential conflict of interest.
Publisher's Note
All claims expressed in this article are solely those of the authors and do not necessarily represent those of their affiliated organizations, or those of the publisher, the editors and the reviewers. Any product that may be evaluated in this article, or claim that may be made by its manufacturer, is not guaranteed or endorsed by the publisher.
Acknowledgments
The authors would like to acknowledge the following groups and individuals for their support of this research and manuscript: The reviewers whose comments strengthened the manuscript. The editorial team from the Frontiers journal and special collection. The NASA SERVIR Science Coordination Office, particularly Rebekke Muench, Ashutosh Limaye, Eric Anderson, Jason Brent Roberts, Rob Griffin, and Daniel Irwin, the members of the EO-Locust working group, convened by WL and CN, including: FAO, USAID, ICIPE, and WFP members, among many others, members of the SERVIR West Africa, Eastern and Southern Africa and Hindu Kush Himalaya hubs, particularly Paul Bartel, Bako Mamane, Idrisa Maiga, Lilian Ndungu, and Faisal Qamer, and finally Keith Cressman for his Desert Locust wisdom.
References
Batten, A. (1969). The senegalese grasshopper Oedaleus senegalensis Krauss. J. Appl. Ecol. 6, 27–45. doi: 10.2307/2401299
Bell, J. R., Gebremichael, E., Molthan, A. L., Schultz, L. A., Meyer, F. J., Hain, C. R., et al. (2020). Complementing optical remote sensing with synthetic aperture radar observations of hail damage swaths to agricultural crops in the central United States. J. Appl. Meteorol. Climatol. 59, 665–685. doi: 10.1175/JAMC-D-19-0124.1
Chavez, P. S., and MacKinnon, D. J. (1994). Automatic detection of vegetation changes in the southwestern united states using remotely sensed images. Method Hotogramm. Eng. Remote Sens. 60, 571–583.
Claverie, M., Ju, J., Masek, J. G., Dungan, J. L., Vermote, E. F., Roger, J.-C., et al. (2018). The harmonized landsat and sentinel-2 surface reflectance data set. Remote Sens. Environ. 219, 145–161. doi: 10.1016/j.rse.2018.09.002
Collett, M., Despland, E., Simpson, S. J., and Krakauer, D. C. (1998). Spatial Scales of desert locust gregarization. Proc. Natl Acad. Sci. U.S.A. 95, 13052–13055. doi: 10.1073/pnas.95.22.13052
Cressman, K. (2013). Role of remote sensing in desert locust early warning. J. Appl. Remote Sens. 7:075098. doi: 10.1117/1.JRS.7.075098
Cressman, K. (2016). “Desert locust,” in Biol. Environ. Hazards, Risks, Disasters, eds Ramish Sivanpillai and John F. Shroder, MA, Waltham, USA Publisher: Elsevier. 87–105. doi: 10.1016/B978-0-12-394847-2.00006-1
Djibo, H., Faye, F. G., Ghaout, S., Lazar, M., Luzietoso, P. N., and Babah, M. A. O. (2006). Multilateral Evaluation of the 2003-05 Desert Locust Campaign E Towards a More Effective Response to Desert Locusts and their Impacts on Food Security, Livelihoods and Poverty Multilateral Evaluation of the 2003-05 Desert Locust Campaign. Food and Agriculture Organization of the United Nations.
Ellenburg, W. L., Mishra, V., Roberts, J. B., Limaye, A. S., Case, J. L., Blankenship, C. B., et al. (2021). Detecting desert locust breeding grounds: a satellite-assisted modeling approach. Remote Sens. 13, 1–11. doi: 10.3390/rs13071276
Genc, H., Genc, L., Turhan, H., Smith, S. E., and Nation, J. L. (2008). Vegetation indices as indicators of damage by the sunn pest (Hemiptera: Scutelleridae) to field grown wheat. Afr. J. Biotechnol. 7, 173–180.
Gómez, D., Salvador, P., Sanz, J., Casanova, C., Taratiel, D., and Casanova, J. L. (2018). Machine learning approach to locate desert locust breeding areas based on ESA CCI soil moisture. J. Appl. Remote Sens. 12:1. doi: 10.1117/1.JRS.12.036011
Gómez, D., Salvador, P., Sanz, J., and Casanova, J. L. (2020). Modelling desert locust presences using 32-year soil moisture data on a large-scale. Ecol. Indic. 117:106655. doi: 10.1016/j.ecolind.2020.106655
Homberg, U. (2015). Sky compass orientation in desert locusts-evidence from field and laboratory studies. Front. Behav. Neurosci. 9:346. doi: 10.3389/fnbeh.2015.00346
Klein, I., Oppelt, N., and Kuenzer, C. (2021). Application of remote sensing data for locust research and management-a review. Insects 12:233. doi: 10.3390/insects12030233
Krall, S., and Herok, C. (1997). “Economics of desert locust control,” in New Strategies in Locust Control, eds Stephan Krall, R. Peveling, and B.D. Diallo, Basel, Switzerland:(Springer), 401–413. doi: 10.1007/978-3-0348-9202-5_59
Latchininsky, A. V. (2013). Locusts and remote sensing: A review. J. Appl. Remote Sens. 7:075099. doi: 10.1117/1.JRS.7.075099
McKinney, W. (2010). “Data structures for statistical computing in python,” in Proceedings of the 9th Python in Science Conference, Vol. 445, eds S. van der Walt and J. Millman, TX:Austin, 51–56. doi: 10.25080/Majora-92bf1922-00a
Mukerji, M. K., and Gage, S. H. (1978). A model for estimating hatch and mortality of grasshopper egg populations based on soil moisture and heat1. Ann. Entomol. Soc. Am. 71, 183–190. doi: 10.1093/aesa/71.2.183
Nakalembe, C. (2020). Urgent and critical need for sub-Saharan African countries to invest in Earth observation-based agricultural early warning and monitoring systems. Environ. Res. Lett. 15, 1–3. doi: 10.1088/1748-9326/abc0bb
Nakalembe, C., Becker-Reshef, I., Bonifacio, R., Hu, G., Humber, M. L., Justice, C. J., et al. (2021). A review of satellite-based global agricultural monitoring systems available for Africa. Glob. Food Sec. 29:100543. doi: 10.1016/j.gfs.2021.100543
NOA (2016). Weather and Desert Locusts. Technical report, World Meteorological Organization and Food and Agriculture Organization of the United Nations.
Padgham, D. E. (1981). Hatching rhythms in the desert locust, Schistocerca gregaria. Physiol. Entomol. 6, 191–198. doi: 10.1111/j.1365-3032.1981.tb00641.x
Pekel, J. F., Vanbogaert, E., Defourny, P., Ceccato, P., Vancutsem, C., and Cressman, K. (2011). Development and application of multi-temporal colorimetric transformation to monitor vegetation in the desert locust habitat. IEEE J. Select. Top. Appl. Earth Observ. Remote Sens. 4, 318–326. doi: 10.1109/JSTARS.2010.2052591
Pener, J. M. (1991). Locust phase polymorphism and its endocrine relations. Adv. Insect Physiol. 23, 1–79. doi: 10.1016/S0065-2806(08)60091-0
Peng, W., Ma, N. L., Zhang, D., Zhou, Q., Yue, X., Khoo, S. C., et al. (2020). A review of historical and recent locust outbreaks: links to global warming, food security and mitigation strategies. Environ. Res. 191:110046. doi: 10.1016/j.envres.2020.110046
Pereira, L. O., Furtado, L. F., Novo, E. M., Santapos;Anna, S. J., Liesenberg, V., and Silva, T. S. (2018). Multifrequency and full-polarimetric SAR assessment for estimating above ground biomass and leaf area index in the amazon várzea wetlands. Remote Sens. 10:1355. doi: 10.3390/rs10091355
Qi, J., Chehbouni, A., Huete, A., Kerr, Y., and Sorooshian, S. (1994). A modified soil adjusted vegetation index. Remote Sens. Environ. 48, 119–126. doi: 10.1016/0034-4257(94)90134-1
Rouse, J. W., Haas, R. H., Deering, D. W., and Schell, J. A. (1974). Monitoring the vernal advancement and retrogradation (Green wave effect) of natural vegetation. Final Rep. RSC 4, 1–371.
Salih, A. A., Baraibar, M., Mwangi, K. K., and Artan, G. (2020). Climate change and locust outbreak in East Africa. Nat. Clim. Change 10, 584–585. doi: 10.1038/s41558-020-0835-8
Shrestha, S., Thakur, G., Gautam, J., Acharya, N., Pandey, M., and Shrestha, J. (2021). Desert locust and its management in Nepal: A review. J. Agric. Nat. Resour. 4, 1–28. doi: 10.3126/janr.v4i1.33197
Sword, G. A., Lecoq, M., and Simpson, S. J. (2010). Phase polyphenism and preventative locust management. J. Insect Physiol. 56, 949–957. doi: 10.1016/j.jinsphys.2010.05.005
Thornton, P. K., Ericksen, P. J., Herrero, M., and Challinor, A. J. (2014). Climate variability and vulnerability to climate change: a review. Glob. Change Biol. 20, 3313–3328. doi: 10.1111/gcb.12581
Wójtowicz, M., Wójtowicz, A., and Piekarczyk, J. (2016). Application of remote sensing methods in agriculture. Commun. Biomet. Crop Sci. 11, 31–50.
Keywords: locust, NDVI, vegetation, damage assessment, MODIS, harmonized landsat sentinel
Citation: Adams EC, Parache HB, Cherrington E, Ellenburg WL, Mishra V, Lucey R and Nakalembe C (2021) Limitations of Remote Sensing in Assessing Vegetation Damage Due to the 2019–2021 Desert Locust Upsurge. Front. Clim. 3:714273. doi: 10.3389/fclim.2021.714273
Received: 25 May 2021; Accepted: 25 August 2021;
Published: 27 September 2021.
Edited by:
Colin Kelley, Columbia University, United StatesReviewed by:
Indu J, Indian Institute of Technology Bombay, IndiaLeonardo Porcacchia, University of Amsterdam, Netherlands
Copyright © 2021 Adams, Parache, Cherrington, Ellenburg, Mishra, Lucey and Nakalembe. This is an open-access article distributed under the terms of the Creative Commons Attribution License (CC BY). The use, distribution or reproduction in other forums is permitted, provided the original author(s) and the copyright owner(s) are credited and that the original publication in this journal is cited, in accordance with accepted academic practice. No use, distribution or reproduction is permitted which does not comply with these terms.
*Correspondence: Emily C. Adams, ZW1pbHkuYy5hZGFtc0BuYXNhLmdvdg==