 Tufa Dinku
 Rija Faniriantsoa
 Shammunul Islam
 Gloriose Nsengiyumva
 Amanda Grossi
- 1Columbia Climate School, International Research Institute for Climate and Society, Colombia University in the City of New York, New York, NY, United States
- 2Institute of Remote Sensing, Jahangirnagar University, Dhaka, Bangladesh
Climate services can contribute to alleviating a range of climate-sensitive development challenges, including those of agricultural production and food security. However, the use of climate data for research and applications in Africa has been scanty, mainly due to poor availability of and access to quality climate data. Weather stations are sparse, and their number has been declining. Access to existing climate data is a challenge mainly because of national data policies, low financial investment, lack of dissemination capacity and tools, and high access costs. The ENACTS (Enhancing National Climate Services) initiative led by the International Research Institute for Climate and Society (IRI) at Columbia University has been tackling this problem by working with National Meteorological Services (NMS) in Africa and in other developing countries. This initiative helps NMS to improve data availability and quality, by combining quality-controlled data from national observation networks with satellite estimates for rainfall and climate model reanalysis products for temperature. This requires access to an easy-to-use and freely available tool for preforming the tasks required to generate the data, as well as using the generated data. Most NMS in Africa do not have access to such a tool. To meet this significant need, the IRI developed such a tool in-house. This is the Climate Data Tool (CDT), which is an open-source, R-based software with an easy-to-use a graphical user interface (GUI). It can be used for data organization, quality control, combining station data with satellite and reanalysis data, evaluating merged and inputs datasets, performing an array of analyses, and visualization. The CDT software has been evolving over that last seven years with inputs from the NMS themselves. Now, it has become a powerful and user-friendly tool, and has been installed in over 20 countries in Africa alone.
Introduction
There has always been a close relationship between socio-economic development, human wellbeing, and a varying and changing climate. However, climate change is expected to impede and undo development gains by increasing the frequency and severity of extreme weather events, shifting suitability zones for crops and diseases, and endangering coastal areas with sea-level rise (IPCC, 2014). These changes threaten many essential sectors such agriculture, forestry, water resources, tourism, transportation, energy, and health. However, because about 80% of the world's cultivated land is rain-fed (UNESCO, 2009), agriculture is widely regarded as the most climate-sensitive human activity and sector of all. Climate variability in agriculture not only affects the availability, access, and consumption of food, but also the income of smallholder farmers (Shumetie and Yismaw, 2018).
In the face of these challenges, “effective” use of climate information offers a way for agricultural practitioners to make better informed decisions at different levels, ultimately aiding them on their quest to make agriculture more resilient to increasingly erratic precipitation and temperature patterns. For example, it might inform which types of seed varieties, such as those that are drought or flood-resistant, an extension system promotes, or when a farmer chooses to plant.
No matter the decision at hand, the information should be useful, usable, and used to achieve the goals of climate risk management and adaptation. Climate services, defined by the Climate Services Partnership (2011) as “production, translation, transfer, and use of climate knowledge and information in climate-informed decision making and climate-smart policy and planning,” play a pivotal role in making this happen. However, even when researchers or meteorological agencies strive to produce information that users need, significant barriers may still remain that inhibit that potentially “useful” information from actually being “usable” (McNie, 2013; Vincent et al., 2018). Some of these barriers include the relevance of the information itself, which can be limited by problems with the underlying data—the spatial scale at which data is available, the quality of the data, or even the presence at all data observations.
As a result, information and products that are sorely needed for anticipating, managing, and responding to agriculture or food security risks triggered by climate extremes, as well as adapting to longer-term risks associated with climate change, can simply be limited (De Leeuw et al., 2014; Hansen et al., 2014; WMO, 2014).
This is the case in many places around the world, including most African countries. It is here that collection of climate data has been seriously inadequate, and even when available, poorly accessible (Dinku, 2019). Where data does exist, it is often of poor or inconsistent quality, limiting decision-makers at all levels from taking appropriate adaptive actions in the face of a changing and varying climate.
The Enhancing National Climate Services (ENACTS) initiative of the International Research Institute for Climate and Society (IRI), Columbia University, has been helping countries to address such gaps in data quantity and quality, as well as access to and use of climate information products by working closely with National Meteorological Services (NMS) in Africa and beyond (Dinku et al., 2014, 2018). These NMS have the primary responsibility to provide observed and forecast weather information, climate information, and warnings of impending hydro-climatic threats to a variety of users, and any limitations in their data are thus felt widely.
To ensure such limitations are addressed and the data upon which information is based is robust, the ENACTS approach works directly with NMS in Africa and other developing countries on data quality and availability issues. One of the core ways this is done is by combining quality-controlled data from national observation networks with satellite estimates for rainfall and climate model reanalysis products for temperature (Dinku et al., 2013, 2018).
This data blending process involves the organization of station and proxy data, quality control and check of station and proxy data, combination of quality-controlled station data with proxies, evaluation of the combined data, and further analysis and visualization of station and combined data.
However, many NMS do not have access to an easy-to-use and freely available tool for performing these and other tasks. To meet this need, the Climate Data Tool (CDT), was developed in-house by the IRI, and is now used by 24 countries in primarily in Africa, but also Asia and Latin America. CDT is an open-source, R-based software package with an easy-to-use a graphical user interface (GUI), which can be run under multiple operating systems, including Windows and Linux. The only system requirement is the installation of the latest version of R. After 5 years of evolution and thanks to the iterative feedback from NMS around Africa, CDT has now become a powerful, dynamic, intuitive, and user-friendly tool. The main functionalities of CDT include (see Figure 1):
• Organization of station and proxy data;
• Assessment of data availability;
• Assessment and correction of data quality;
• Merging station observation with proxies;
• Extraction of data from gridded products, including satellite, reanalysis and combined data products, at any point, for a selected box, and for any administrative boundary; and
• Analysis and visualization of station and gridded datasets.
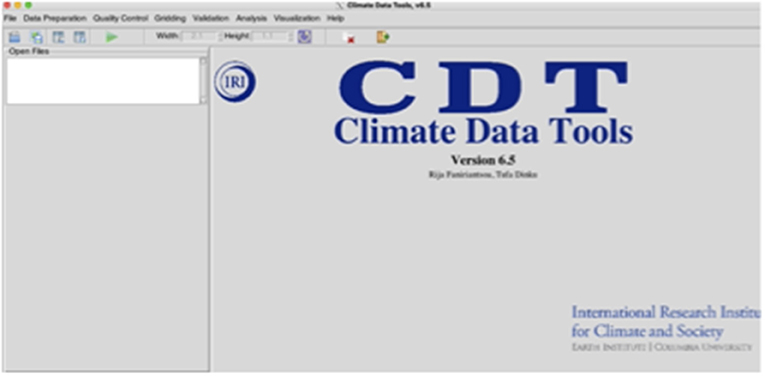
Figure 1. CDT graphical user interface.
Though it has a graphical user interface (GUI), CDT can also be run at script level for advanced users who need more flexibility. As any R-package, there are manuals for the different modules.
Implementation of CDT at NMS includes installation of the tool, as well as training. In other words, beyond just a technology or software package, implementation CDT also includes a standard training package. Technological and human resources are addressed in tandem. The training package is generally comprised of three steps:
• Theoretical background on the basics of climate data quality control, remote sensing of rainfall, climate reanalysis products, interpolation of climate data, and combination of climate data from different sources;
• Practical, hands-on training starting with installation of the system;
• Actual use of CDT for data quality control and generation of merged rainfall and temperature data for those who implement ENACTS.
The CDT has so far been installed in 15 ENACTS countries, nine non-ENACTS countries, and two Regional Climate Centers (RCCs) shown in Figure 2. Installation and training in the ENACTS countries and the two RCCs was done mostly by the IRI, while most of the installation and training in the non-ENACTS countries has been done by the RCCs.
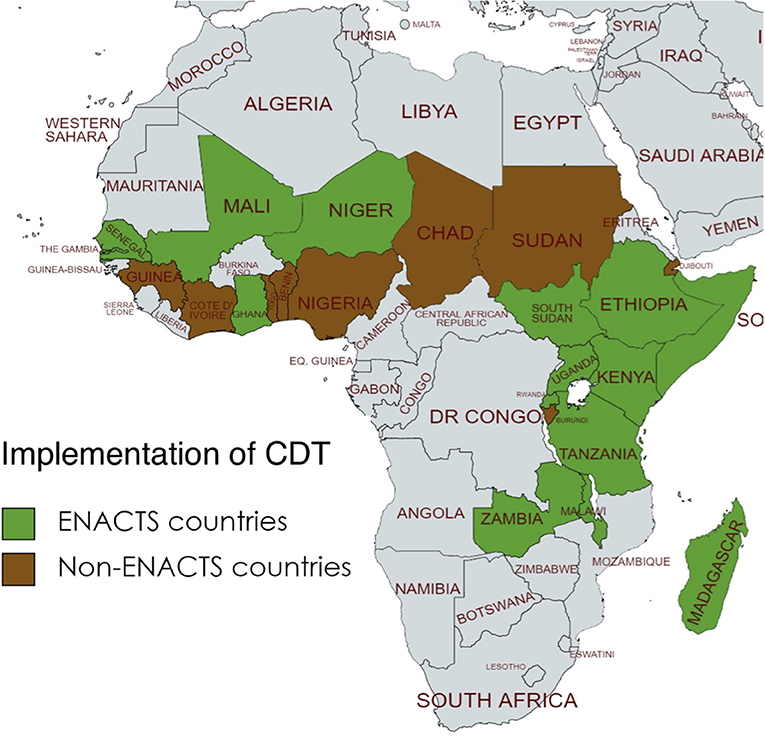
Figure 2. Countries where CDT has been implemented (installation and training) either as part of ENACTS implementation or independent of ENACTS (implemented by Regional Climate Centers).
The next section, Methodology, provides summary descriptions of the different CDT functionalities, while Section Results presents some results. The paper concludes with discussion in Section Discussion.
Methodology
The CDT allows users, particularly NMS staff, to perform an array of tasks, from data preparation to extensive analyses and visualizations. This is accomplished through an interactive GUI as well as command line execution within the R environment. The main modules that are accessed through the GUI include the following (Figure 1):
• Data preparation
• Quality control of station observations;
• Interpolation of station observations and merging data from different sources
• Validation of merged and other data
• Various analytical tools
• Visualization of stations and gridded data as well as analyses results
An overview of these different modules is presented below.
Data Preparation
The CDT offers a suite of operations dedicated to data preparation (Figure 3), which include organizing observations from meteorological stations, assessing availability of observations, downloading, and processing proxy data (satellite rainfall estimates and climate model reanalysis products). This can also be used for obtaining some ancillary data such as digital elevation models (DEM) and shape files for country administrative boundaries.
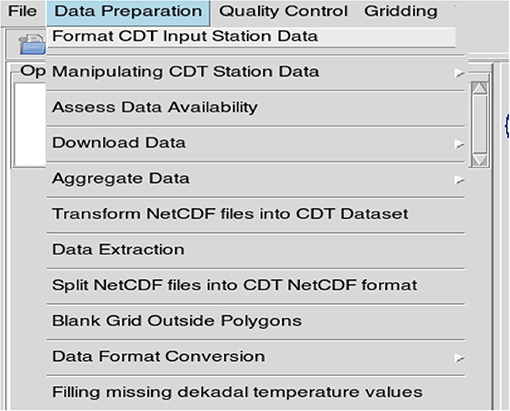
Figure 3. CDT data preparation menu.
Users can upload station data into CDT in text and comma-separated-values (CSV) formats. CDT can also use data from the WMO-supported climate data management systems (CDMS) used by NMS in Africa. It can directly access data from the CLINMSOFT database while data from other databases such CLISYS and CLIDAT have to be converted to text or CSV format firs. These input are converted into a format used by CDT for further analyses. This is a text file format, and CDT allows users to convert data into this format. The converted data can then be aggregated to different temporal scales, including pentad (5-day), dekadal (10-day), monthly and seasonal. CDT also lets the user explore availability of data in the NMS database (what is available and what is missing) using various formats including, tables, graphs of average number of stations reporting each year, graphs showing number of non-missing data per year for each station over the years, and percentage of data available for all stations plotted on a map. These offer a full picture of the available data, which is important information for both the NMS and their users.
Downloading and Processing Proxy and Ancillary Data
The CDT also allows users to download and process various proxy and ancillary data used in meteorological and climatological analysis. These include six different satellite rainfall estimates:
• ARC (Africa Rainfall Climatology; Novella and Thiaw, 2013);
• CHIRP/S (the Climate Hazards Group Infrared Precipitation and combined with station data; Funk et al., 2015).
• CMORPH [Climate Prediction Center (CPC) Morphing Techniques; Joyce et al., 2004],
• GPM (Global Precipitation Measurement Mission; Hou et al., 2014)
• PERSIANN (Precipitation Estimation from Remotely Sensed Information using Artificial Neural Networks; Nguyen et al., 2018)
• RFE [Famine Early Warning System NETwork (FEWS NET) satellite rainfall estimate; Xie et al., 2017],
• TAMSAT [Tropical Applications of Meteorology using SATellite and ground-based observations (TAMSAT); Grimes et al., 1999; Thorne et al., 2001]
• TMPA (TRMM Multi- Satellite Precipitation Analysis; Huffman et al., 2010).
There are also three climate reanalysis products that can be downloaded through CDT for generating merged temperature data:
• Japanese 55-year Reanalysis (JRA55);
• Modern-Era Retrospective Analysis 2 (MERRA2); and
• European Center for Medium-Range Weather Forecasts (ECMWF-ERA5).
The main advantage of CDT here is that the users can specify the spatial and temporal domain and time resolution of interest and download only the data they actually need. Most of these products can be downloaded either from the IRI Data Library (Blumenthal et al., 2014) or from the original data source for that particular data product. CDT can also be used to download ancillary data such as digital elevation models country administrative boundaries.
Once downloaded, the satellite and reanalysis data can be processed further using some simple aggregation functions such as sum, average, minimum, maximum, count, etc. These datasets could also be aggregated to coarser spatial resolutions. CDT uses NetCDF as a native gridded data format, but can also export data to other formats such as Climate Predictability Tool (CPT), GeoTiff, and GrADS.
Quality Control
Quality of climate data is a serious challenge for many countries in Africa (e.g., Dinku, 2019). This includes poor accuracy or precision of observations, as well as missing data. These errors can stem from multiple sources that include instrument error, observer error, digitization, summarization, etc. (reference). These errors need to be identified and fixed. However, many NMS lack appropriate tools to perform quality control or the capacity to use existing tools.
The CDT offers a robust quality check process for identifying and, when possible, fixing erroneous observations. The tool enables checking for a multitude of error types and presents the outputs in different formats that enables the NMS staff to easily identify the errors and fix or remove the data from the database. These could be done at different temporal scales including daily, dekadal, and monthly. The NMS staff have the options to replace suspicious values by a missing data code, replace the suspected values with correct observations, or leave the data as it is.
The quality check process implemented in CDT includes the following:
(i) checking for station coordinates;
(ii) checking for false zero values (for rainfall);
(iii) checking for suspicious observations (outliers); and
(iv) checking for homogeneity of climate time series.
Coordinate Check
It would be difficult to automatically check for the accuracy of the coordinates of a given station. Thus, CDT simply checks whether a station is located within the country boundary. It also displays the location of the stations on Google Map. The display enables the NMS staff to check whether the station is located where it is supposed to be. CDT can also check for duplicate and missing coordinates, which happen frequently.
False Zero Check
In many instances, observers may not enter zero values in the data register when there is no rainfall; instead, they may leave the specific dates on the register blank. The data register could also be blank for the days when observations were not taken (missing data). However, during data transfer to computers, data entry staff may enter both (zero observation and missing data) as zero, leading to false zeros. To check for false zeros, CDT compares the percentage of zero values for each month at the target station and the average of the neighboring stations. If the ratio of the stations zero count for that month is greater than a user-defined threshold, that month is flagged as suspicious. Then the NMS staff can choose to investigate or replace the suspicious month with missing data.
Checking for Outliers
There are different ways to check for outliers or suspicious observations. The methods implanted in CDT include, limit check, internal consistency check, temporal check, and spatial check. Limit check involves comparing an observation to previously defined upper and lower limits of the specific element for the specific climate. For instance, no negative values are expected for maximum temperature over locations in Africa, and there could also be upper limits for daily rainfall amounts.
In internal consistency checks, an observation is compared with other parameter values to see if they are physically or climatologically consistent, either instantly or for time series according to adopted observation procedures. Normally, more than one meteorological parameter is measured at an observing station at the same time. Some of these parameters are physically related and the internal consistency check tests if values of related parameters are free of contradictions. The only internal consistency check implemented in CDT is making sure minimum temperature is less than maximum temperature, and vice versa.
Temporal consistency checks if an observation of a given station for a given month is significantly different compared to the long time series for that particular month. This test is based on the fact that many climatological variables show significant serial correlation. In CDT, this comparison is done for each of the 12 months separately in order to make sure data from climatological periods (e.g., cold months vs. warm months) are not compared. The outputs are presented both in tabular and graphical formats, which will be shown in the next section. These presentations allow easy inspection of suspected values, and one can either keep or change these outlier values just by making changes directly on the table.
The spatial check compares the observation to be checked with the observations from nearby stations or the expected value at the station that is estimated using the observations from neighboring stations. This may be accomplished either by interpolation between observations, by checking against numeric prognostic values (on the basis of values from many different stations), or by comparing statistics. Those data for which there is a significant difference between the expected and actual observations are flagged as suspect. The following conditions are checked in CDT: isolated rainfall (rainfall observed at station of interest but surrounding stations reported zero), isolated zero (opposite of the previous one), and outlier (observation too high or too low compared to nearby observations). These suspected values can be viewed both in graphical and tabular formats. Values can be viewed on map with the options of adding administrative boundaries, digital elevation model as well as gridded proxy data. This enables use of background data (e.g., DEM for temperature and satellite estimates for rainfall) that provides additional information to decide whether the observation is actually an outlier. For instance, nearby station could report significantly different temperature observation because of the altitude at which they are located. A DEM background could be used to check if this is the case.
The user can correct the suspicious values in different ways. The easiest one would be replacing all suspected values with missing code. A better way would be consulting paper records to confirm whether the suspicious values is a wrong observation or just wrong entry, and in the latter case replace the suspicious value with the correct one. CDT offers both options. For the second option, the user just needs to enter the correct value to the table presenting the errors (Table 1), and then CDT will replace the value in the original data file. This is very convenient and saves NMS staff a lot of time.
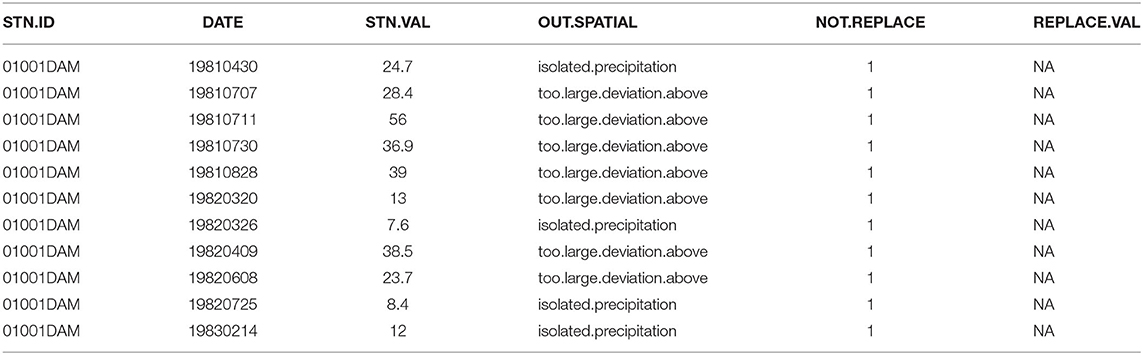
Table 1. Example table of errors in CDT.
Homogeneity Check
Homogeneity checks are used to determine if a climate time series is homogeneous over a period of time. Data inhomogeneity can affect the quality of climate studies, particularly the domain of climate trends, variability and climate extreme analysis. Inhomogeneity can stem from many factors such as changes in observational routine (Hansel et al., 2016), changes in instruments, observation methods, station relocation, etc. (Li-Juan and Zhong-Wei, 2012). Homogenization of climate data consists of two main parts: detecting breaks and adjusting the specific segment for inhomogeneity (Squintu et al., 2020). The CDT offers four approaches for detecting breaks in a climate time series. The first approach is Pettit test, which is a non-parametric rank-based method used for detecting shift in the mean value of the distribution of the variable under study (Mallakpour and Villarini, 2016). The other approach adapted in CDT is the normal standard test (SNHT) (Alexandersson and Moberg, 1997). The other two approaches use cumulative sum (CUMSUM) approach with and without trends (Gallagher et al., 2013). For adjusting inhomogeneities, CDT offers two methods: mean and quantile matching. Mean method compares the mean before and after the break and quantile matching compares quantiles before and after the break (Squintu et al., 2020).
Gridding
CDT's Gridding menu offers options for simple spatial interpolation using different methods, as well as combining station observations with gridded proxies such as satellite rainfall estimate and temperature reanalysis products. The latter option is a critical component of the ENACTS approach described earlier. The merging process can also be done in a cross-validation mode, which enables evaluation of the merged product.
Spatial Interpolation
CDT offers for spatial interpolation, which include nearest neighbor (Shope and Maharjan, 2015), nearest neighbor with elevation, inverse distance weighted average, modified Shephard (Renka, 1988), spheremap (Kluver et al., 2016), ordinary kriging, and universal kriging (Bargaoui and Chebbi, 2009). The tool enables users explore different methods as well as different parameters (grid seize and resolution, interpolation radius, minimum/maximum number of neighbors, variogram type, …etc.) for the different interpolation methods. Thus, users can choose the most suitable method and parameter for their specific needs. Interpolation can be done at multiple time steps (days, dekads, months, seasons, etc.). One can display and examine the outputs or can perform validation using independent datasets as described later in this section.
Merging Station Observations and Proxy Data
Combining observations from meteorological stations and proxies such as satellite rainfall estimates or climate model reanalysis products can help alleviate challenges with evaluability of data owing to sparse distributions of meteorological observations. In CDT, satellite rainfall estimates are combined with rain gauge measurements while reanalysis products are used for minimum and maximum temperature. CDT uses NetCDF data format both input and output gridded data. The approach adopted in CDT involves the following steps:
• Downscale proxy data (only for reanalysis for temperature);
• Use historical station data to calculate climatological adjustments factors;
• Apply the adjustment factors to all proxy data;
• Merge the output from the previous step with contemporaneous observations for each time step (day, pentad, dekad, month, etc.).
The reanalysis data would need to downscale the reanalysis data from its coarse resolution to a higher resolution (4 km ENACTS data). We can utilize lapse rate for each month to downscale reanalysis data. This involves using digital elevation model (DEM) and station temperature observations to Compute Downscaling Coefficients which are then applied to time series of reanalysis data.
Bias correction aims to remove the bias from proxy data using station data. CDT offers four approaches for mean bias correction: multiplicative bias with variable time step, or for each month, and quantile mapping with fitted distribution and quantile method with empirical distribution. First the correction factors are computed using any one of the four methods. This will create a file with bias coefficients associated with the method selected by the user. The next step would be applying the corrections to the time series of the satellite and reanalysis data.
Next, the bias-corrected time series of proxy data is merged with contemporaneous stations observations. CDT offers four different methods for merging proxy data with station data, which are, simple bias adjustment, Cressman scheme (Mateus et al., 2016), Barnes scheme (Rozante and Demerval, 2010), and regression kriging (Hengl et al., 2007).
Validation
The CDT tool offers a robust validation scheme both to assess the input proxy data, as well as the merged output data. There are several statistics that can be used for doing this comparison, and CDT offers an array of validation statistics, which include correlation coefficient, mean error, Nash-Sutcliffe efficiency coefficient, percent bias, probability of detection and false alarm ratio. The merged data could be validated either using independent data that was not used in the merging or using cross validation. Calculated validation statistics could be displayed as tables or could be visualized on maps.
Analysis and Visualization
Analysis
The CDT tool can perform number of data analyses that are pertinent to climate data analysis. The “Analysis” Menu bar offers different functionalities that include computing summary statistics (minimum, maximum, mean, median, number of missing values, 1st quartile, 3rd quartile and standard deviation), calculating some derived climate variables (e.g., calculating potential evapotranspiration), computing climatologies and anomalies, daily rainfall analysis (rainfall intensity, number of dry days, number of wet days, number of dry spells, and number of wet spells), rainy season characteristics (rainy season onset, rainy season cessation and rainy season length), climate extremes, and various spatial analyses. The results are presented in maps and different graphs such as line chart, bar plot, probability of exceeding for El Nino, La Nina or neutral years, anomaly bar plot, etc. These indices climate extremes are similar to those offered by CLIMDEX from this address: https://www.climdex.org/learn/indices/. Drought indices such as standardized precipitation index (SPI) and standardized precipitation evapotranspiration index can also be calculated using CDT. Figure 4 shows the CDT Analysis menu.
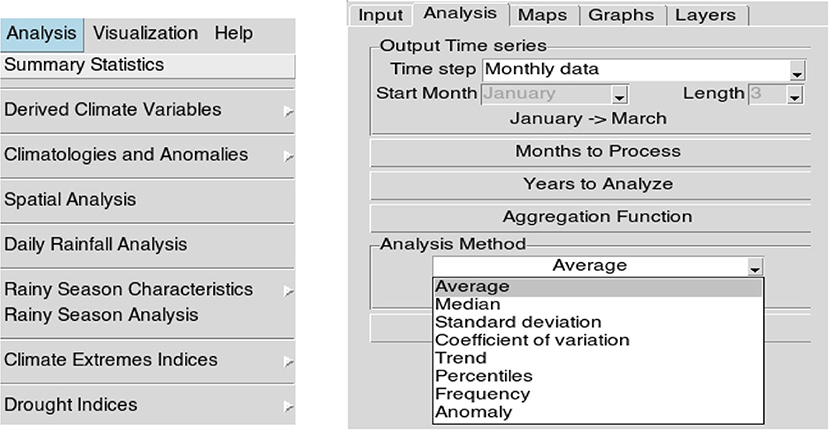
Figure 4. CDT analysis menu.
Visualization
The CDT tools offer an extensive visualization feature for presenting input data and the outputs of the different analyses performed. Many of these visualization tools are part of the specific analysis menu and include tables, graphs, and maps. However, CDT also has a separate Menu bar for visualizing different data types such as CDT stations data, CDT gridded data and NetCDF data. One can plot either a single NetCDF files, time sequence of NetCDF files (such as a time series), NetCDF files with multiple variables and even a combination of different data types such as station data and NetCDF data. The later allows users to compare data from different sources (e.g., station, satellite, and merged) as required.
Results
This section will illustrate the varied usage and multiple applications of the CDT tool presented above with examples. As the functionality of CDT is very extensive, only the salient features are covered here. The examples presented in this section are actual outputs from the relevant activities at the different NMS as part of the implementation of ENACTS.
Assessing Data Availability
This functionality offers NMS different options to look at the rainfall and temperature data available in their climate data base. This may sound trivial, but many NMS in Africa, and elsewhere, do not have an easy-to-use tool that enables them to clearly see what data are available, where and when these data are available, and what is missing. CDT presents data availability in tabular (Table 2), graph (Figures 5, 6), and map (Figure 7) formats. Table 2 summarizes the number of reported data for each year and month for a given station. Figure 5 shows the average number of stations that reported each year (in this case for rainfall), while Figure 6 compares how many stations were active and how any of the active stations were reporting for each year. The map in Figure 7 presents the percentage of data (relative to what is expected) available for each station over Zambia.
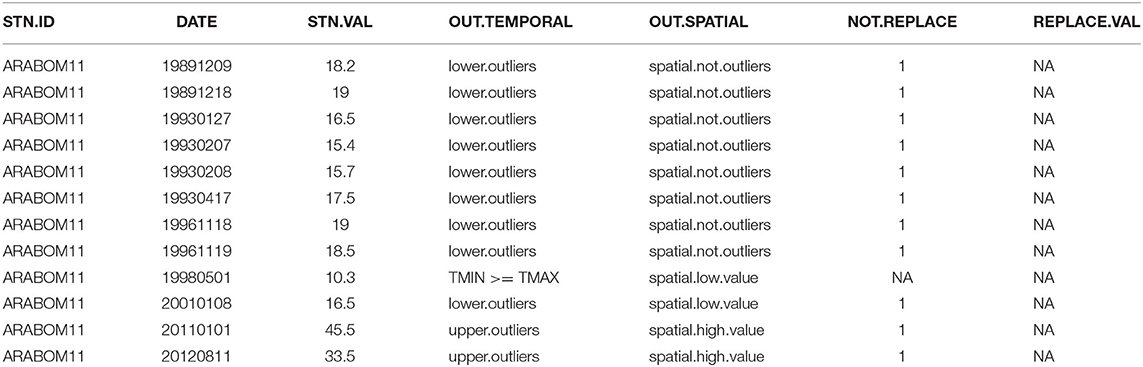
Table 2. Number of reported data for each year and month for a given station.
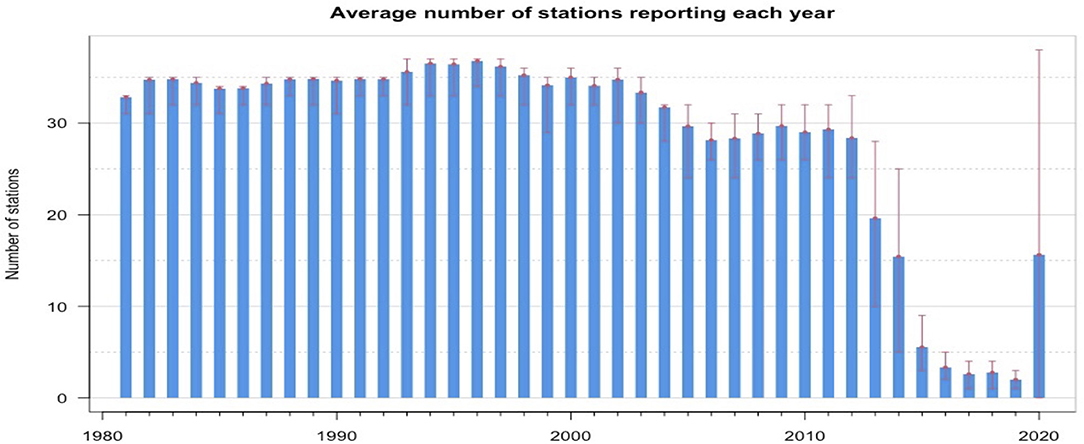
Figure 5. Average number of stations reporting observations for each year for precipitation. The red bar represents the minimum and maximum number of days with observations for each year.
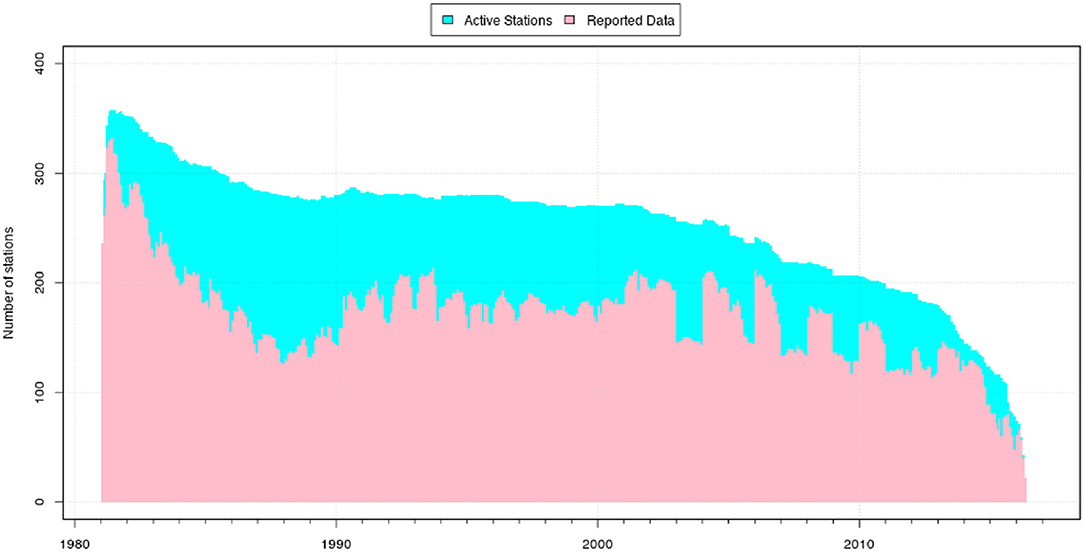
Figure 6. Active stations and reported data from the same stations.
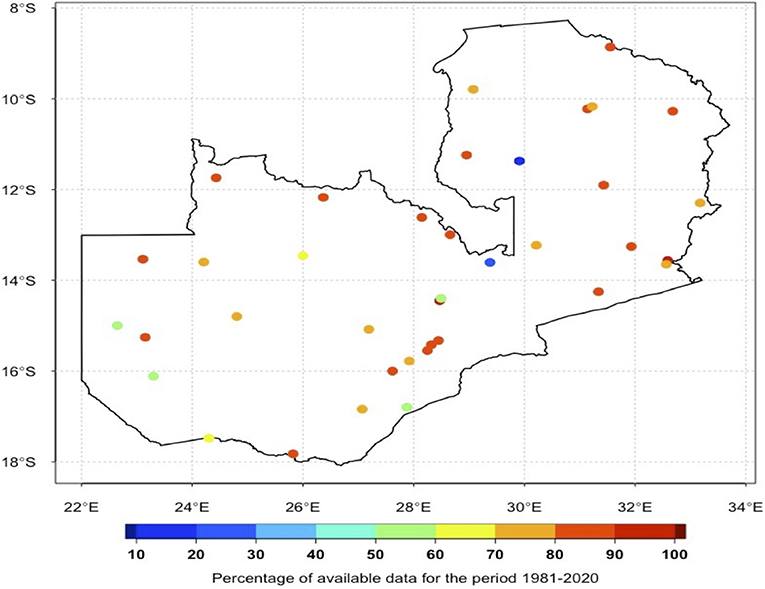
Figure 7. Percentage of available daily rainfall data from each station over Zambia during the period 1981–2020. This shows the completeness of the data for each station.
Quality Control
Quality control of station observation (rainfall and temperature) is one of the most useful functionalities of CDT. These involve checking station coordinates, as well as suspicious data outliers. The outliers are detected using both temporal and spatial checks. A temporal check is performed for each month to ensure that each observed value is consistent with the expected climatology of each station. Suspicious values detected by the quality test are flagged as outliers and would need to be checked by NMS staff. Figure 8 shows an example of CDT output from a temporal check for minimum temperature for the given station during the month of May. The red bars represent suspicious values identified by the quality check procedure. This figure shows both low and high extremes in consecutive years (1981–1983). The high extreme could be maximum temperature entered as minimum temperature, while the lower values could be data from another station. Sometimes, particularly for rainfall, it is possible that a station could revive a higher than usual rainfall amount. However, this may not happen just at one station. In such cases, would be good to compare the suspicions observation with values from the surrounding stations. This is part of the spatial check, which is demonstrated in Figure 9. In this figure, the extreme value (shown in red) is compared to observations from the neighboring stations (shown in blue). In this case, it is very unlikely that one station receives a daily rainfall amount of 307mm, while the neighboring station records zero rainfall. However, one may need to be careful when comparing temperature observations from nearby stations as nearby stations could have significantly different values because of elevations. The CDT enables comparison of neighboring stations with elevation as a background (Figure 10). Satellite rainfall estimates could also be used as a background when comparing rainfall observations from nearby stations.
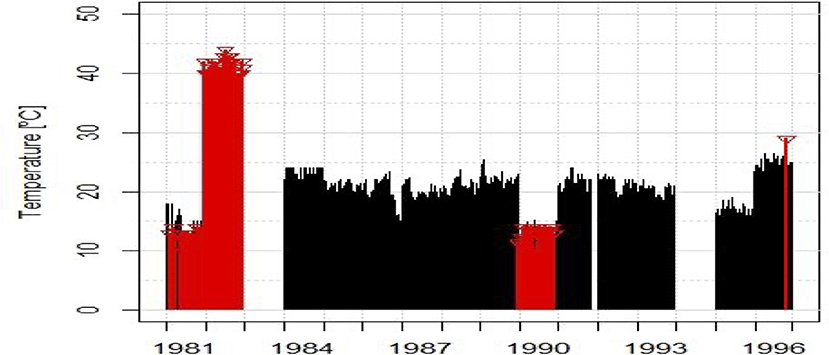
Figure 8. CDT output of temporal check for minimum temperature for the month of May. The red bars show what CDT identifies as outliers (values that are too large or too small compared to what is expected for that month). The blank spaces show missing data.
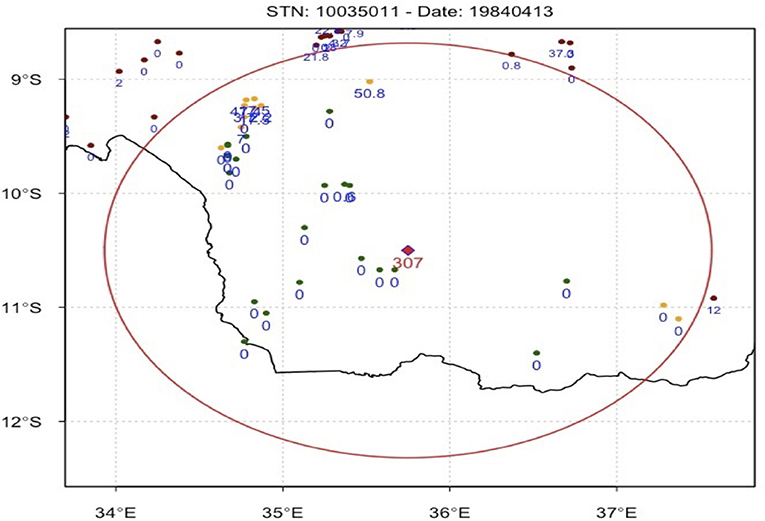
Figure 9. Result of CDT spatial check for daily rainfall, station ID: 10035011 on April 13, 1984. A value of 307 mm (red) is shown as an outlier comparted to the neighboring stations (all reporting zero rainfall).
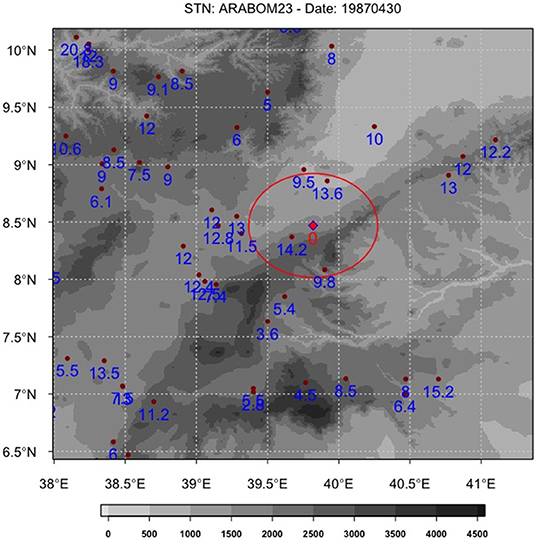
Figure 10. Comparison of temperature observations for neighboring stations with elevation as a background.
Merging Data
The next step after quality control is combining station observations with satellite or reanalysis proxies. This a very important step in implementing ENACTS, and it corresponds to the “Improving Availability” component of ENACTS. As described in the previous section, CDT provides different options for merging station observations and proxy data, starting with simple mean bias adjustment and then combining the bias adjusted proxy with contemporaneous station observations. Figure 11 presents the two inputs (station observation and satellite rainfall estimates), the intermediate output (bias adjusted satellite) and the final merged product. The approach for temperature is similar, except that the reanalysis data need to be downscaled. Figure 12 shows the different input and output products along with elevation map (DEM) used for downscaling.
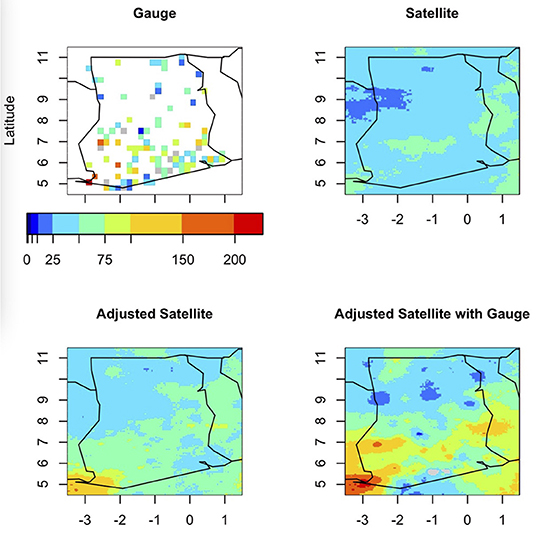
Figure 11. Station observation, satellite rainfall estimates, bias adjusted satellite output and final merged product (1983, June 2nd dekad).
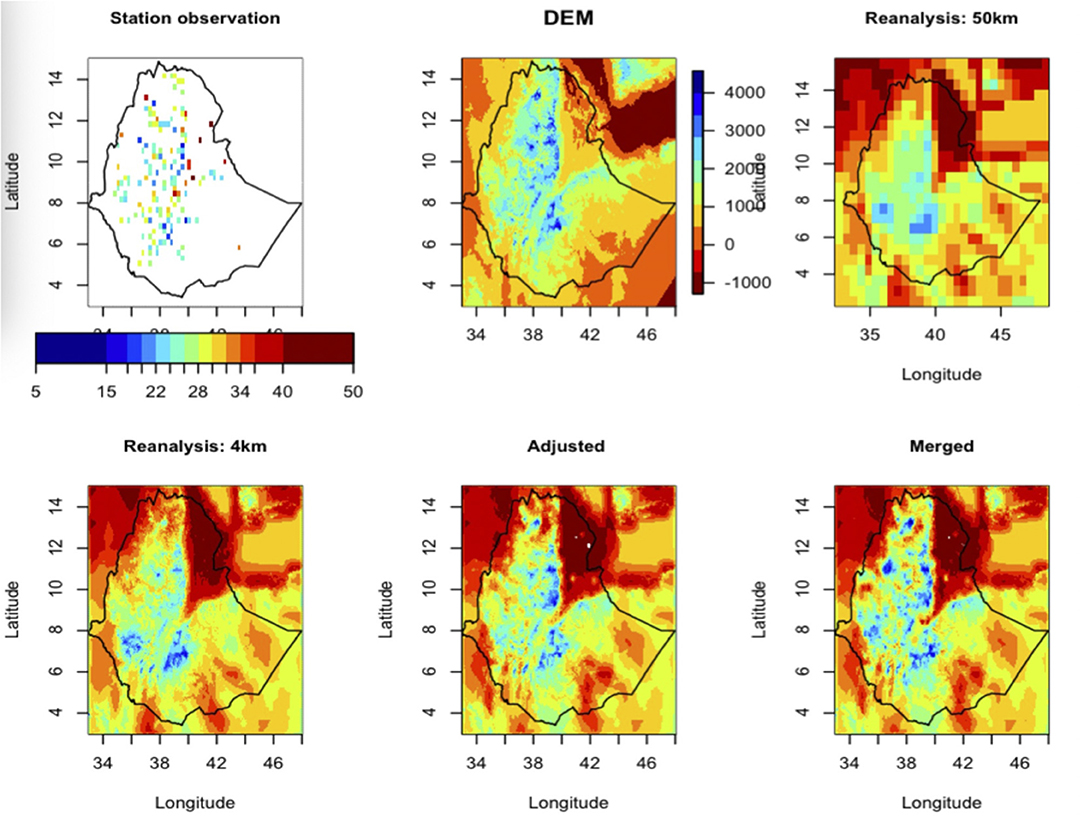
Figure 12. Similar as Figure 11 but for temperature, along with elevation map (DEM) (2000, May 15th).
Validation
In the implementation of ENACTS, validation is needed to evaluate the different satellite rainfall estimates and reanalysis products for a specific country as well as assess the accuracy merged products. However, the tool can also be used to evaluate any gridded climate data in NetCDF format. Thus, it could be used for research purposes as well. The evaluation of the merged data could be done either in a cross-validation approach or using different training and validation datasets. The validation uses different validation statics, including both categorical (mainly used for daily rainfall) and continuous variables. The output could be presented as a table (Table 3), graphs (e.g., scatter plots), and maps (Figures 13, 14). For instance, Figure 13, shows a plot of the probability of detection (POD) statics at station locations over Ethiopia. The main advantage of this kind of presentation would be to understand the spatial distributions of the errors. As shown in Figure 14, a background variable (such as DEM) could also be used to see the dependence of the errors on elevation or other factors.
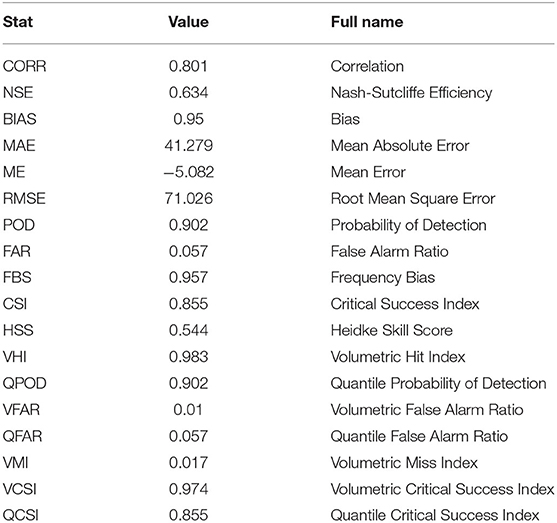
Table 3. Validation outputs.
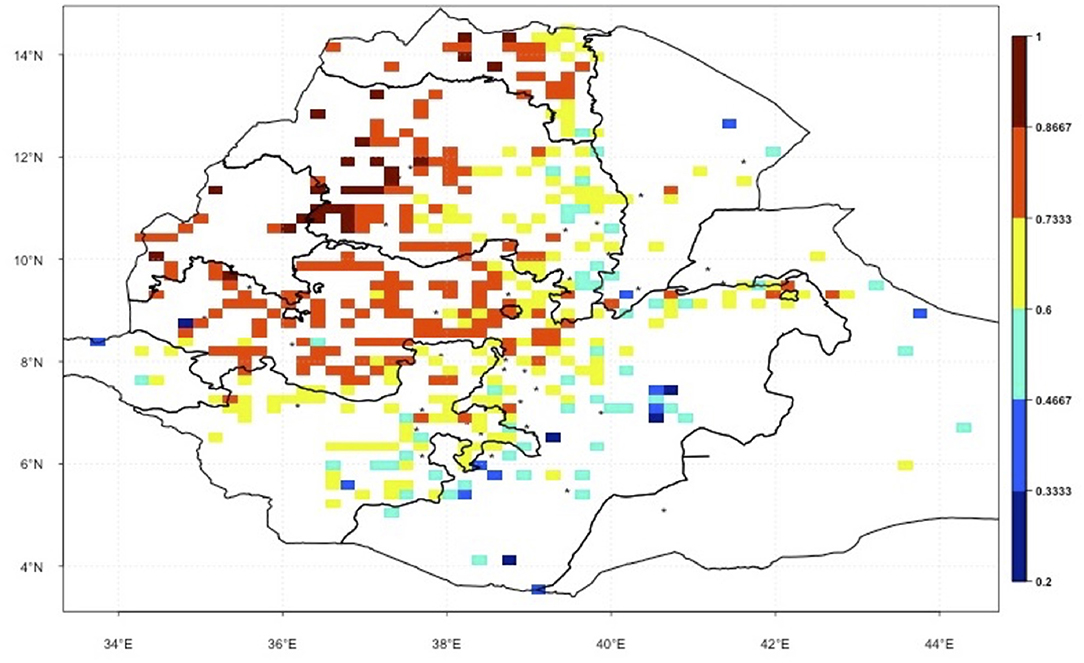
Figure 13. Probability of detection for daily rainfall over Ethiopia.
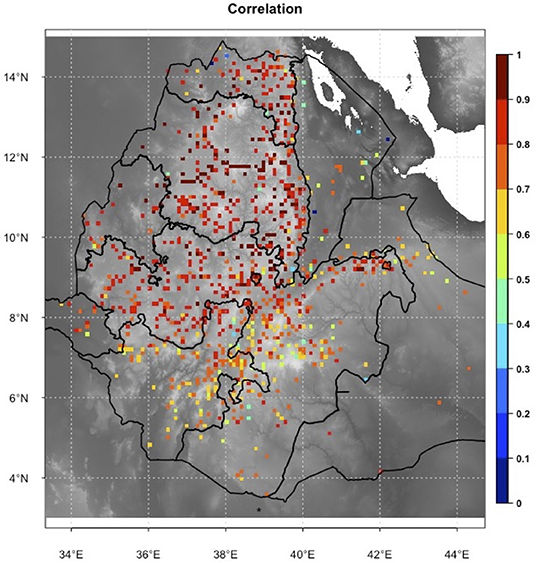
Figure 14. Correlation Coefficients from cross-validation of monthly RR plotted with DEM as background.
Analysis
As described in Section Methodology above, the Analysis menu offers an array of option for data analysis, ranging from summary statistics for station observations to more involved computations in spatial analysis. Outputs are presented in tabular and graphic formats. Figure 15 is an example of graphic output for onsets dates over Ethiopia. One strength of CDT in computing onset, cessation and length season is that different parts of the country could be treated separately with different onsets/cessation criteria. This enables definition of onsets/cessation that fits different agroclimatic zones.
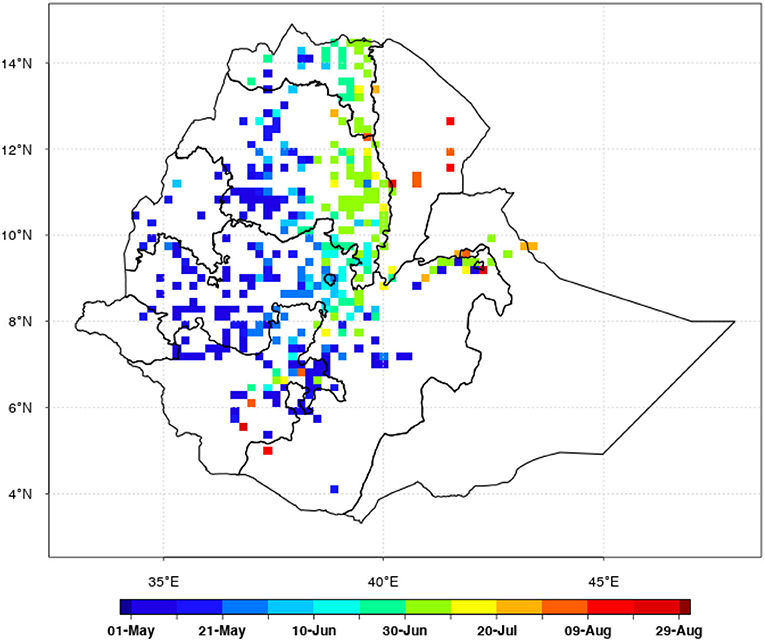
Figure 15. Example of map output for onsets dates over Ethiopia. Onset seems to start in May for the southwestern part of the country (blue color), and in August for the northeastern part of the country (red color).
Discussion
The Climate Data Tool (CDT) has been developed to address specific needs of National Meteorological Services (NMS), particularly in Africa. The understanding of the need of NMS comes from over two decades of International Research Institute for Climate and Society (IRI) engagement with NMS in Africa. The CDT is now being used by many NMS for organizing station and other proxy (e.g., satellite rainfall estimates and climate model reanalysis products) data, performing rigorous quality control of station data, combining station observations with relevant proxies, evaluating proxy and combined gridded datasets, preforming specific analyses and visualizing the results. The tool has undergone significant improvements over the last seven years, mainly in response to feedback from the NMS. This feedback is collected in three different ways: (i) while training the NMS staff; (ii) while working with NMS to generate ENACTS (Enhancing National Climate Services) datasets; and (iii) feedback sent by email either reporting issues or suggesting additional functionalities. As a result, CDT has now become an indispensable tool for the 24 NMS and the two RCCs in Africa and five NMS outside Africa that have implemented it. CDT has also started attracting the attention of universities as a tool for climate data analyses, and the IRI has been receiving requests for training. For instance, 28 teachers and graduate students were trained at Arba Minch University in Ethiopia during August 2021.
This is a tool designed to address specific challenges faced specifically by NMS, and it has been developed in consultation with NMS. This consolation process has helped in addressing most of the initial limitations of the tool. However, there are still some limitations that users need to be aware of. The first limitation is the fact that the tool is based on another tool (R), and users need to install the system before installing and running CDT. This could be an inconvenience for some users. Another limitation is that users cannot add their own statistical methods or replace the graphical software to improve visualization.
Limited input and outputs data formats could also be another inconvenience. For instance, many NMS wish to use CDT for organizing and processing data from Automatic Weather Stations (AWS), which come from different AWS systems, are in different formats, and may sit on different servers. We have come to understand that this is a serious problem many NMS, and we have started developing a separate tool to address this issue. The new tool, AWS Data Tool (ADT), has been implemented in two countries and there are already requests from many other NMS.
Training is a critical component in implementing CDT. The standard training (implemented as part of ENACTS) lasts about 2 weeks and includes theoretical training on basic concepts used in CDT; hands on training using NMS's own data; and on-the-job training for selected NMS staff.
Though developed with the needs of NMS mind, CDT can also be used by anyone interested in quality-control, analyses and visualization of climate data. For instance, we have recently trained students and staff from Arbamich University in Ethiopia. Availability of climate data outside the NMS, such as the SASSACAL (Muche et al., 2018) and TAHMO (van de Giensen et al., 2014), would also increase the use of CDT.
Going forward, CDT would need to be updated (both the software and training) where it has been implemented. NMS using CDT may also need technical support including trouble shouting. CDT would also need to expand to other countries in Africa. This would be a daunting task for the IRI alone. Implementation of CDT would be sustainable only if relevant capacity is built within the continent, preferably at regional level. The ultimate goal is to transfer CDT implementation to regional climate centers and limit IRI's role to technical support to the regional centers and keep on improving the tool. This would ensure sustainability as well as cost-effectiveness. The IRI has been building CDT–related expertise at two Regional Climate Centers (RCCs) in Africa. This capacity building and strategic partnership has been undertaken with the Intergovernmental Authority on Development (IGAD) Climate Prediction and Application Center (ICPAC) in East Africa, and the Agrometeorology, Hydrology, Meteorology (AGRHYMET) Regional Center in West Africa. These two RCCs have already started exploiting this capacity to strengthen and expand CDT in their respective regions. The AGRHYMET Regional Center has supported expansion of CDT to nine countries in the region with little or no support from the IRI, an encouraging demonstration of sustainable capacity building. ICPAC has also been supporting expansion of CDT to three new countries and has strengthened existing CDT installation (through tool update and more training) in many of the ENACTS countries in the East African region. This shows that capacity building at regional level is critical for sustainability as well as expanding the use of CDT. The RCCs provide much needed technical support and training to the NMS, which would have been both difficult and inefficient for the IRI alone to do. In many cases, there is a need to repeat the trainings either because of updated CDT version or owing to NMS staff turnover. The RCCs have been very helpful in this respect, re-training NMS where ENACTS has already been implemented and expanding it to non-ENACTS countries. In most cases, the RCCs have done the majority of these activities without the IRI's involvement and using their own funds and resources.
Data Availability Statement
The original contributions presented in the study are included in the article/supplementary material, further inquiries can be directed to the corresponding author/s.
Author Contributions
TD: tool co-developer, implementer, and lead author. RF: tool developer, implementer, and also contributed to manuscript writing. SI and GN: contributed to manuscript writing. AG: contributed to manuscript writing (final editing). All authors contributed to the article and approved the submitted version.
Conflict of Interest
The authors declare that the research was conducted in the absence of any commercial or financial relationships that could be construed as a potential conflict of interest.
Publisher's Note
All claims expressed in this article are solely those of the authors and do not necessarily represent those of their affiliated organizations, or those of the publisher, the editors and the reviewers. Any product that may be evaluated in this article, or claim that may be made by its manufacturer, is not guaranteed or endorsed by the publisher.
Acknowledgments
This work is undertaken as part of the Columbia World Project, ACToday, Columbia University in the City of New York. We would also like to thank the reviewers for their valuable contribution toward the improvement of the manuscript.
References
Alexandersson, H., and Moberg, A. (1997). Homogenization of Swedish temperature data. Part I: homogeneity test for linear trends. Int. J. Climatol. 17, 25–34. doi: 10.1002/(SICI)1097-0088(199701)17:1<25::AID-JOC103>3.0.CO;2-J
Bargaoui, Z. K., and Chebbi, A. (2009). Comparison of two kriging interpolation methods applied to spatiotemporal rainfall. J. Hydrol. 365, 56–73. doi: 10.1016/j.jhydrol.2008.11.025
Blumenthal, M. B., Bell, M., Del Corral, J., Cousin, R., and Khomyakov, I. (2014). IRI data library: enhancing accessibility of climate knowledge: the International Research Institute for Climate & Society: shaping the landscape of climate services. Earth Perspect. Transdiscipl. Enabled 1, 19. doi: 10.1186/2194-6434-1-19
Climate Services Partnership. (2011). What are Climate Services? Available online at: http://www.climate-services.org/about-us/what-are-climate-services/ (accessed September 17, 2021).
De Leeuw, J., Vrieling, A., Shee, A., Atzberger, C., Hadgu, K. M., Biradar, C. M., et al. (2014). The potential and uptake of remote sensing in insurance: a review. Remote Sens. 6, 10888–10912. doi: 10.3390/rs61110888
Dinku, T. (2019). “Challenges with availability and quality of climate data in Africa,” in Extreme Hydrology and Climate Variability, eds A. M. Mellese, W. Abtew, and G. Senay (Amsterdam: Elsevier Inc.). p. 584.
Dinku, T., Block, B., Sharoff, J., and Thmoson, M. (2014). Bridging critical gaps in climate services and applications in Africa. Earth Perspect. 1, 15. doi: 10.1186/2194-6434-1-15
Dinku, T., Hailemariam, K., Maidement, R., Tarnavsky, E., and Connor, S. J. (2013). Combined use of satellite estimates and raingauge observations to produce high-quality historical rainfall time series over Ethiopia. Int. J. Climatol. 34, 2489–2504. doi: 10.1002/joc.3855
Dinku, T., Thomson, M. C., Cousin, R., del Corral, J., Ceccato, P., Hansen, J., et al. (2018). Enhancing national climate services (ENACTS) for development in Africa. Climate Dev. 10, 664–672. doi: 10.1080/17565529.2017.1405784
Funk, C., Peterson, P., Landsfeld, M., Pedreros, D., Verdin, J., Shukla, S., et al. (2015). The climate hazards infrared precipitation with stations—a new environmental record for monitoring extremes. Sci. Data 2, 150066. doi: 10.1038/sdata.2015.66
Gallagher, C., Lund, R., and Robbins, M. (2013). Changepoint detection in climate time series with long-term trends. J. Clim. 26, 4994–5006. doi: 10.1175/JCLI-D-12-00704.1
Grimes, D. I. F., Pardo-Igúzquiza, E., and Bonifacio, R. (1999). Optimal areal rainfall estimation using raingauges and satellite data. J. Hydrol. 222, 93–108. doi: 10.1016/S0022-1694(99)00092-X
Hansel, S., Medeiros, D. M., Matschullat, J., Petta, R. A., and Silva, I. M. (2016). Assessing homogeneity and climate variability of temperature and precipitation series in the capitals of North-Eastern Brazil. Front. Earth Sci. 4, 1–19. doi: 10.3389/feart.2016.00029
Hansen, J. W., Zebiak, S., and Coffey, K. (2014). Shaping global agendas on climate risk management and climate services: an IRI perspective. Earth Perspect. 1, 13. doi: 10.1186/2194-6434-1-13
Hengl, T., Heuvelink, G. B. M., and Rossiter, D. G. (2007). About regression- kriging: from equations to case studies. Comput. Geosci. 33, 1301–1315. doi: 10.1016/j.cageo.2007.05.001
Hou, A. Y., Kakar, R. K., Neeck, S., Azarbarzin, A. A., Kummerow, C. D., Kojima, M., et al. (2014). The global precipitation measurement mission. Bull. Am. Meteorol. Soc. 95, 701–722. doi: 10.1175/BAMS-D-13-00164.1
Huffman, G. J., Adler, R. F., Bolvin, D. T., and Nelkin, E. J. (2010). “The TRMM multi-satellite precipitation analysis (TMPA),” in Satellite Rainfall Applications for Surface Hydrology, eds M. Gebremichael and F. Hossain (Dordrecht: Springer Science + Business Media). 3–22.
IPCC (2014). AR5 Synthesis Report: Climate Change 2014 — IPCC. Intergovernmental Panel on Climate Change. Available online at: https://www.ipcc.ch/report/ar5/syr/
Joyce, R. J., Janowiak, J. E., Arkin, P. A., and Xie, P. (2004). CMORPH: a method that produces global precipitation estimates from passive microwave and infrared data at high spatial and temporal resolution. J. Hydrometeorol. 5, 487–503. doi: 10.1175/1525-7541(2004)005<0487:CAMTPG>2.0.CO;2
Kluver, D., Mote, T., Leathers, D., Hendreson, G. R., Chan, W., and Robinson, D. A. (2016). Creation and validation of a comprehensive 1° by 1° daily gridded north american dataset for 1900–2009: snowfall. J. Atmos. Ocean. Tech. 33, 857–871. doi: 10.1175/JTECH-D-15-0027.1
Li-Juan, C., and Zhong-Wei, Y. (2012). Progress in research on homogenization of climate data. Adv. Climate Change Res. 3, 59–67. doi: 10.3724/SP.J.1248.2012.00059
Mallakpour, I., and Villarini, G. (2016). A simulation study to examine the sensitivity of the Pettitt test to detect abrupt changes in mean. Hydrol. Sci. J. 61, 245–254. doi: 10.1080/02626667.2015.1008482
Mateus, P., Laura, S., Giovanni, N., and Joao, C. (2016). Assessment of two techniques to merge ground-based and TRMM rainfall measurements: a case study about Brazilian Amazon Rainforest. GISience Remote Sens. 53, 689–706. doi: 10.1080/15481603.2016.1228161
McNie, E. C. (2013). Delivering climate services: organizational strategies and approaches for producing useful climate-science information. Weather Climate Soc. 5, 14–26. doi: 10.1175/WCAS-D-11-00034.1
Muche, G., Kruger, S., Hillmann, T., Josenhans, K., Ribeiro, C., Bazibi, M., et al. (2018). “SASSCAL WeatherNet: present state, challenges, and achievements of the regional climatic observation network and database,” in Climate Change and Adaptive Land Management in Southern Africa – Assessments, Changes, Challenges, and Solutions, Biodiversity & Ecology, 6, eds R. Revermann, K. M. Krewenka, U. Schmiedel, J. M. Olwoch, J. Helmschrot, and N. Jürgens (Göttingen; Windhoek: Klaus Hess Publishers), 34–43.
Nguyen, P., Ombadi, M., Sorooshian, S., Hsu, K., AghaKouchak, A., Braithwaite, D., et al. (2018). The PERSIANN family of global satellite precipitation data: a review and evaluation of products. Hydrol. Earth Syst. Sci. 22, 5801–5816. doi: 10.5194/hess-22-5801-2018
Novella, N. S., and Thiaw, W. M. (2013). African rainfall climatology version 2 for famine early warning systems. J. Appl. Meteorol. Climatol. 52, 588–606. doi: 10.1175/JAMC-D-11-0238.1
Renka, R. J. (1988). Multivariate interpolation of large sets of scattered data. Trans. Math. Softw. 4, 139–148. doi: 10.1145/45054.45055
Rozante, J., and Demerval, M. (2010). Combining TRMM and surface observations of precipitation: technique and validation over South America. Weather Forecast. 25, 885–894. doi: 10.1175/2010WAF2222325.1
Shope, C. L., and Maharjan, G. R. (2015). Modeling spatiotemporal precipitation: effects of density, interpolation, and land use distribution. Adv. Meteorol. 2015, 1–16. doi: 10.1155/2015/174196
Shumetie, A., and Yismaw, M. A. (2018). Effect of climate variability on crop income and indigenous adaptation strategies of households. Int. J. Climate Change Strategies Manage. 10, 580–595. doi: 10.1108/IJCCSM-04-2016-0039
Squintu, A. A., van der Schrier, G., Štěpánek, P., Zahradníček, P., and Tank, A. K. (2020). Comparison of homogenization methods for daily temperature series against an observation-based benchmark dataset. Theor. Appl. Climatol. 140, 285–301. doi: 10.1007/s00704-019-03018-0
Thorne, V., Coakeley, P., Grimes, D., and Dugdale, G. (2001). Comparison of TAMSAT and CPC rainfall estimates with raingauges, for southern Africa. Int. J. Remote Sens. 22, 1951–1974. doi: 10.1080/01431160118816
UNESCO (2009). The United Nations World Water Development Report 3: Water in a Changing World. UNESCO; Paris: Earthscan.
van de Giensen, N., Hut, R., and Selker, J. (2014). The trans-African hydro-meteorological observatory (TAHMO). WIREs Water 1, 341–348. doi: 10.1002/wat2.1034
Vincent, K., Daly, M., Scannell, C., and Leathes, B. (2018). What can climate services learn from theory and practice of co-production? Climate Serv. 12, 48–58. doi: 10.1016/j.cliser.2018.11.001
WMO (2014). Agriculture and Food Security Exemplar to the User Interface Platform of the Global Framework for Climate Services. Geneva, 35.
Keywords: climate, climate data, data quality, data errors, climate services, CDT, data tool
Citation: Dinku T, Faniriantsoa R, Islam S, Nsengiyumva G and Grossi A (2022) The Climate Data Tool: Enhancing Climate Services Across Africa. Front. Clim. 3:787519. doi: 10.3389/fclim.2021.787519
Received: 30 September 2021; Accepted: 06 December 2021;
Published: 28 February 2022.
Edited by:
Joerg Helmschrot, Stellenbosch University, South AfricaReviewed by:
Chandra Sekhar Bahinipati, Indian Institute of Technology Tirupati, IndiaSubimal Ghosh, Indian Institute of Technology Bombay, India
Torsten Weber, Climate Service Center Germany (GERICS), Germany
Copyright © 2022 Dinku, Faniriantsoa, Islam, Nsengiyumva and Grossi. This is an open-access article distributed under the terms of the Creative Commons Attribution License (CC BY). The use, distribution or reproduction in other forums is permitted, provided the original author(s) and the copyright owner(s) are credited and that the original publication in this journal is cited, in accordance with accepted academic practice. No use, distribution or reproduction is permitted which does not comply with these terms.
*Correspondence: Tufa Dinku, dHVmYUBpcmkuY29sdW1iaWEuZWR1