 Fuxia Yang
 Dongshou Fan
 Fei Xu2*
- 1College of Economics and Management, Huazhong Agricultural University, Wuhan, China
- 2School of Economics and Management, Anhui Normal University, Wuhu, China
It is important to explore the driving factors of the carbon emission intensity (CI) for China's planting under the dual pressures of adequate food supply and carbon neutrality. Previous studies separately investigate the impact of technical or structural factors on the total carbon emissions of China's agricultural sector, but few studies assess the comprehensive effects of these two. To this end, this paper incorporates the production-theoretical decomposition analysis (PDA) into the logarithmic mean Divisia index (LMDI) and decomposes the changes of CI into seven components, namely, two technical effects, four structural ones, and one regional layout effect. Based on the panel data of the agricultural sector for 31 provinces in China from 2001 to 2018, the contribution rates of the seven components to the changes of China's planting CI are computed. The results indicate that China's planting CI presents a downward trend with an average annual decreasing rate of 11.4% over the whole study period. The improvement in technical efficiency (TEFF) plays a dominant role in the decline of CI for planting with a contribution rate of 83.19%, followed by the output structure (OS) change (27.28%). In contrast, technical change (TECH) (8.00%) promotes the increase of CI. Further, the effects present significant regional heterogeneities. Specifically, TEFF contributes the highest share to the decline of CI for producing-sales balance areas (BA), and OS plays the greatest role in the decrease of CI for main grain-sales areas (MCA) during the entire study period. Accordingly, some policy recommendations are put forward on how to reduce the CI of China's planting.
Introduction
Global warming is one of the greatest challenges for humanity (Hoegh-Guldberg et al., 2019). The majority of developed countries have agreed to take steps to limit and even cut down anthropogenic carbon emissions. In this context, the reduction pathway for agricultural carbon emissions accounting for 10–20% of the global total emissions has attracted the attention of academia (Crippa et al., 2021). As for China, the world's largest developing country, the rapid development of its agricultural economy has caused massive carbon emissions. The CO2 emissions of the agricultural sector in China reached 241.1 million tons in 2017, which is 1.5 times that in 1995 (Han et al., 2018). Thus, it is significant for the achievement of China's carbon peaking to investigate driving factors of CO2 emissions for the agricultural sector.
Most of the existing literature focuses on the absolute mitigation of total CO2 emissions. However, for a developing country like China, the agricultural sector bears the burden of food supply for the population of 1.4 billion. Crop farming faces dual pressures to ensure food security while reducing its carbon emissions. Alternatively, the reduction of CI (CO2 emissions per unit of gross planting output) is more consistent with the current situation of emission abatement for developing economies. Thus, this paper aims to investigate the changes of the CI in China's planting and its driving factors.
Over the past two decades, the mitigation of carbon emission from the planting industry has received extensive attention (Huang et al., 2019; Zhang et al., 2019; Xiong et al., 2020; He et al., 2021). Some studies investigate the driving forces of total carbon emissions in China's agricultural sector (Wu et al., 2019, 2021; Long and Tang, 2021; Sui and Lv, 2021). There are three widely used decomposition approaches to explore the drivers of CO2 emissions, namely, structural decomposition analysis (SDA), index decomposition analysis (IDA), and production–theoretical decomposition analysis (PDA) (Ang, 2004). The SDA based on input–output tables (Wieland et al., 2017; Dong et al., 2018b; Jiang et al., 2021) is not applicable in the analysis of geoponic carbon emissions owing to the unavailability of input–output data of the agricultural sector (Liu and Feng, 2021). In merits of data availability and convenient analysis process, IDA, especially the logarithmic mean Divisia index (LMDI) method, has been widely used to identify the influencing factors of the agricultural CO2 emissions (Wang et al., 2014; Dong et al., 2016; Liu et al., 2017; Song and Zhang, 2017, 2019; Zhang et al., 2018; Song et al., 2019). Some studies utilize the LMDI method to probe the impact of structural changes on total agricultural CO2 emissions, including economic structure, agricultural output structure (OS), energy consumption structure, and population distribution structure (Li et al., 2020; Pakrooh et al., 2020). However, the abovementioned analysis pays little attention to the roles of technical changes (TECH) for CO2 emissions. In this respect, a few studies explain energy intensity (EI), one of the components resulting from LMDI, as a proxy of TECH to capture the effect of technological progress on CO2 emissions. However, the index “intensity” may overestimate the contributions of technological change due to the incorporation of the improvement of resource allocation efficiency across industries (Lin and Xu, 2019).
To explore the impact of technological progress and technological efficiency on emissions, Pasurka (2006) first conducted PDA based on the production theory. Subsequently, Wang (2011) introduced the Shepard direction distance function into the framework to further capture the substitution effect between inputs. With the enhancement of the computability of PDA, it is gradually developed to investigate the effect of technological factors on EI changes (Zhou and Ang, 2008; Du and Lin, 2015; Chen and Duan, 2016; Wang and Zhou, 2018). However, the PDA model cannot give a full picture of economic structural changes due to the symmetry of structural components decomposed by the output distance function (Tan and Lin, 2018). In order to take the advantages of LMDI and PDA, the existing literature attempts to combine the two to investigate the effects of structural changes and TECHs on CO2 emissions (Dong et al., 2018a; Zha et al., 2019; Liu and Feng, 2021). Currently, few studies apply this method to analyze the change of carbon intensity for the agricultural sector.
To this end, this paper tries to incorporate PDA into the LMDI to decompose the changes of carbon intensity for China's planting. Based on the panel data of the agricultural sector for 31 provinces in China from 2001 to 2018, we calculate the contribution rates of each component and analyze their heterogeneities across regions. Our study is different from previous literature in three ways. At first, differing from the existing studies focusing on either the impact of technological progress or that of output restructuring, we investigate the simultaneous effects of the two factors on the carbon intensity of China's planting. Secondly, distinguished from the technological progress measured by EI in previous analysis, the present paper strips the TECH element from the variation of EI. Finally, in the context of China's food security strategy, the agricultural resource endowments of one province may affect the regional pattern of carbon emissions. Thus, this paper divide the sample into three sub-regions, namely, the main grain-production areas (MPA), the producing-sales balance areas (BA), and the main grain-sales areas (MCA), to analyze the heterogeneities of the drivers of CI across regions.
The remainder of this paper is organized as follows: Section Methodologies decomposes the change of the carbon intensity by incorporating the PDA into the LMDI method; Section Data sources gives more details of the sources of data used in this paper; some results are presented in Section Results and discussions; and Section Conclusions and policy implications concludes the paper and puts forward some policy recommendations.
Methodologies
LMDI Model
As one of IDA decomposition approaches, the LMDI has been widely applied to explore the drivers of carbon emissions owing to its properties of aggregation, zero value, and robustness (Ang, 2005). Up to now, there are two widely used construction methods, the additive formula and the multiplicative one (Ang, 2015). Considering that this paper aims to investigate the relative changes in driving forces of China's planting carbon intensity, the multiplicative LMDI is employed. The decomposition process is written as
where CI represents the carbon emission intensity in planting; CEi = CO2i/Ei denotes CO2 emissions per unit agrochemical energy (fertilizer, pesticide, plastic mulch, irrigation, plowed by tractor, diesel) in province i, which reflects a comprehensive carbon emission coefficient of the six carbon sources. REi = Yi/Y is the ratio of the crop farming output of province i to the national planting output, which shows the regional layout of China's crop farming. EIi = Ei/Yi measures the agrochemical energy consumption per unit GDP in province i, i.e., the agrochemical EI. The larger the EIi, the greater the EI and the lower the energy efficiency.
According to the multiplicative LMDI method, the intertemporal changes of CI are decomposed into
where
CEt,t+1, REt,t+1, and EIt,t+1 represent inter-period changes of CE, RE, and EI, respectively. L(CIit+1, CIit)/L(CIt+1, CIt) is a weight function (Ang, 2004).
PDA Model
Actually, the agrochemical EI is also affected by other factors such as technical efficiency (TEFF), TECH, and variations of input in crop farming. In order to capture more details about driving forces of EI, the PDA model is embedded in the LMDI framework in this section. Considering that EI is equivalent to the inverse of energy productivity (EP) (gross output per unit of energy), we first decompose the EP and then take its inverse.
According to the production-theory decomposition analysis framework conducted by Wang (2007), the change of EP from period t to t + 1 can be decomposed as follows:
where the input variables include labor , land , agrochemical energy (from six sources)1 , and crop farming outputs (from four sectors)2 ; lit = Lit/Eit3 and sit = Sit/Eit, respectively, denote the labor–energy ratio and land–energy ratio; and represents the output composition, here .
In Equation (3), we use the technology of period t as a reference. TEFFit measures the inter-period change of technical efficiency; TECH(t + 1) is the technological progress; PEPCHit depends on the changes in the labor–energy ratio, land–energy ratio, and output composition from t to t + 1. To obtain more specific components of PEPCHit, it can be decomposed further:
Substituting Equation (4) into Equation (3), EPit+1/EPit could be rewritten as
To avoid the impact of arbitrarily employing a reference technology on the intertemporal changes of EP, we define (EPit+1/EPit) as the geometric mean of and ; we obtain that
According to EI = 1/EP, the changes of EI over time can be decomposed into the following:
Therefore, is rewritten as
Ultimately, we substitute Equation (8) into Equation (2) and obtain that
The intertemporal changes of carbon emission intensity (CI) have been decomposed into seven components, namely, two technical effects (TEFFt,t+1 and TECHt,t+1), four structural ones (OSt,t+1, LEt,t+1, SEt,t+1, and CEt,t+1), and one regional layout effect (REt,t+1). We define the following formula:
where Ratet,t+1 is the contribution rates of each component to the intertemporal changes of CI. It is <1, which means that the F factor promotes the decrease of CI.
Data Sources
Since CO2 emissions of the planting industry are not available in the official statistical databases in China, the CO2 emissions of crop farming in this analysis are computed by agrochemical energy consumption, including fertilizers, pesticides, plastic mulch, irrigation, plowing by a tractor, and diesel. The calculation formula is as follows:
where Ej is the carbon source j and δj represents its emission coefficient, whose value is shown in Table 1.
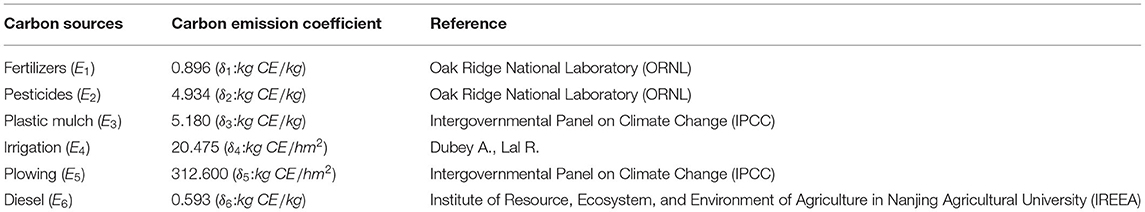
Table 1. The carbon emission coefficient of major crop farming sources.
In addition, we collect the datasets of planting output, labor input, land usage, and agrochemical energy consumption, which covers 31 administrative provinces of China over the period 2001–2018. Moreover, the 31 provinces are grouped into three sub-regions4 to investigate the trend and driving factors of CI's changes at the regional level: MPA, MCA, and producing-sales BA (see Figure 1).
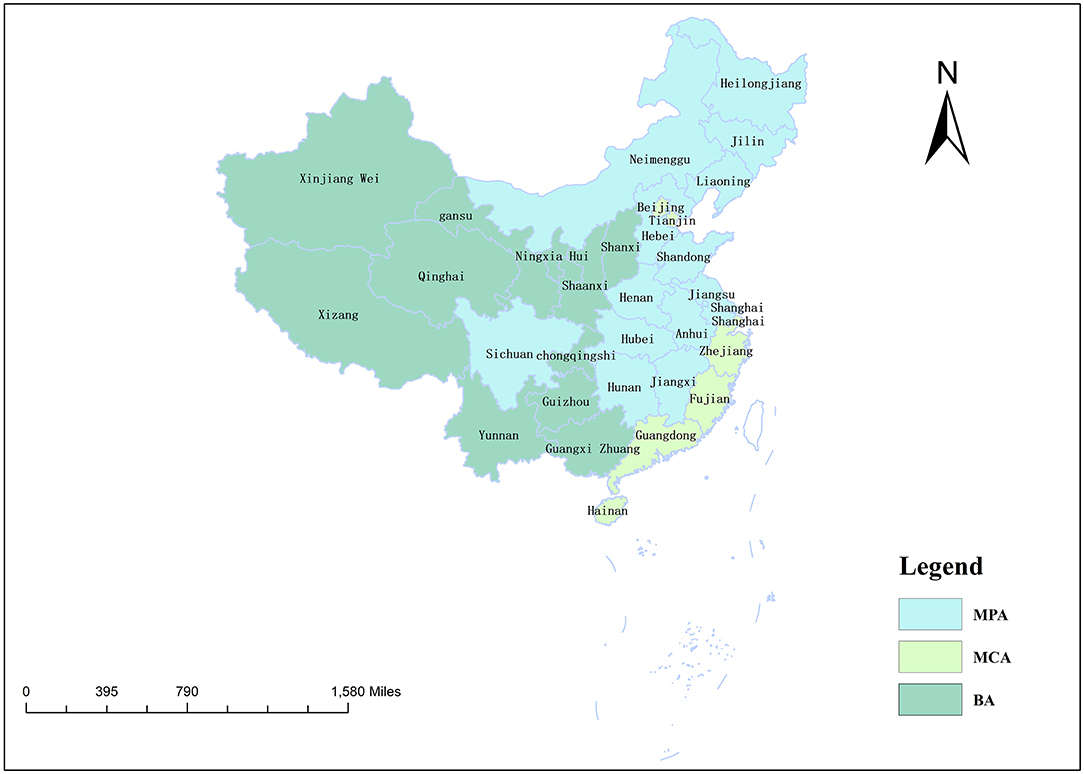
Figure 1. Distribution of food production areas in China.
The basic data mainly derive from the China Rural Statistical Yearbook (CRSY), published by China National Bureau of Statistics. The following is a detailed description of the variables involved in this paper.
As for variables involved in the LMDI model, the CO2 emissions are calculated by using Equation (10), where the amount of fertilizers (E1), pesticides (E2), plastic mulch (E3), irrigation (E4), plowing (E5), and diesel (E6) is directly from CRSY (2001–2018). Data on gross planting output (Y) consisting of grain crops (Y1), oil-bearing crops (Y2), vegetables (Y3), and other crops (Y4) are obtained from CRSY, which is at the 2000 price level to eliminate inflation. As to variables involved in the PDA model, the total sown area of crops is chosen as a proxy of the land input. Considering that the labor input of planting cannot be obtained directly from CRSY, it is calculated by multiplying the number of employees at the end of the year in the agricultural sector by the proportion of the planting output to the total output of this sector. The amount of each carbon source is converted into the equivalent of diesel5 and then added up to measure the total agrochemical energy consumption.
Results and Discussions
Changes of CO2 Emission Intensity in China's Planting
According to Equation (10), the carbon emissions of each province during the period of 2001–2018 are calculated and then added up to obtain the total carbon emissions for China's planting. Subsequently, the total carbon emissions of each year are divided by the corresponding gross output of China's plantation to acquire the CI of each year at the national level. The results are shown in Figure 2.
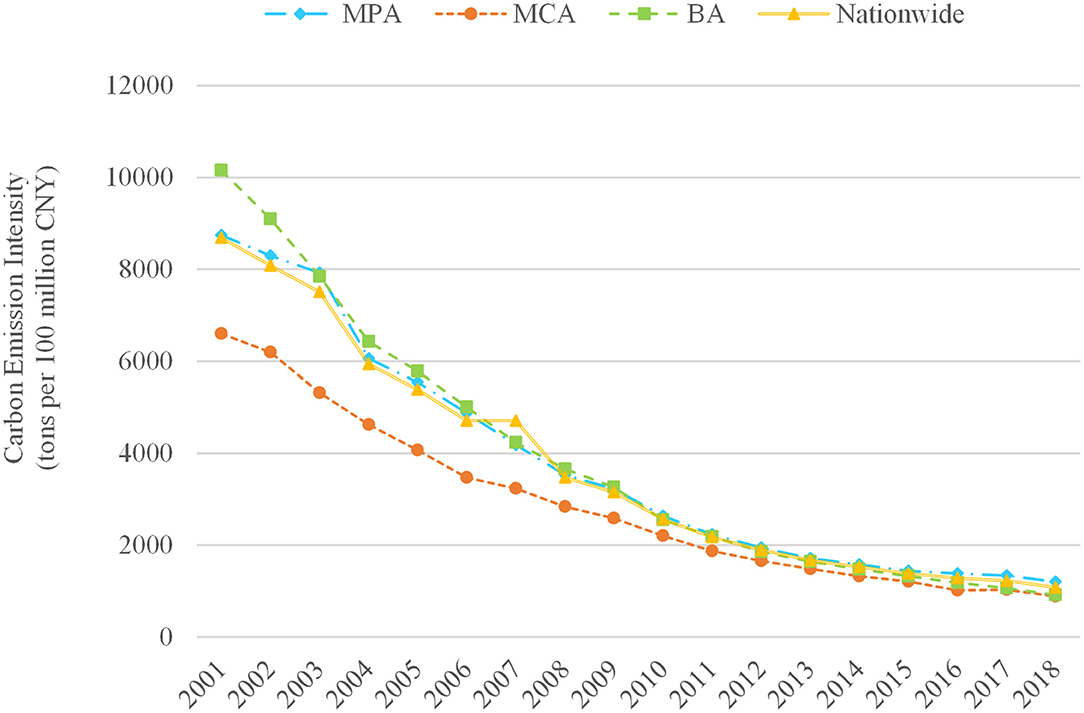
Figure 2. The variation trend of carbon intensity of China's planting from 2001 to 2018.
As can be observed in Figure 2, the CI experiences a continuous decline both at national and regional levels over the whole study period. The planting CI at the national level reduces from 8,684.36 tons per 100 million CNY in 2001 to 1,082.79 million tons per 100 million CNY in 2018, with an average annual decreasing rate of 11.4%, which dropped by 87.5% cumulatively. At the regional level, the carbon intensity of MCA is the lowest among the three regions, and the CI of MPA is lower than that of BA throughout the sample period except for 2007. After 2011, the CIs in three regions show a trend of convergence.
Analysis of Driving Factors of CI in China's Planting
Based on Equation (9), the contribution rate of each component from 2001 to 2018 can be calculated. Since the economic planning in China is adjusted every 5 years, we divide the entire study period into four economic stages: the 10th “Five Year Plan” (FYP) (2001–2006), 11th FYP (2006–2011), 12th FYP (2011–2016), and 13th FYP (2016–2018). The accumulative contribution rates of each factor in four economic stages and the whole sample time are described in Figure 3, respectively.
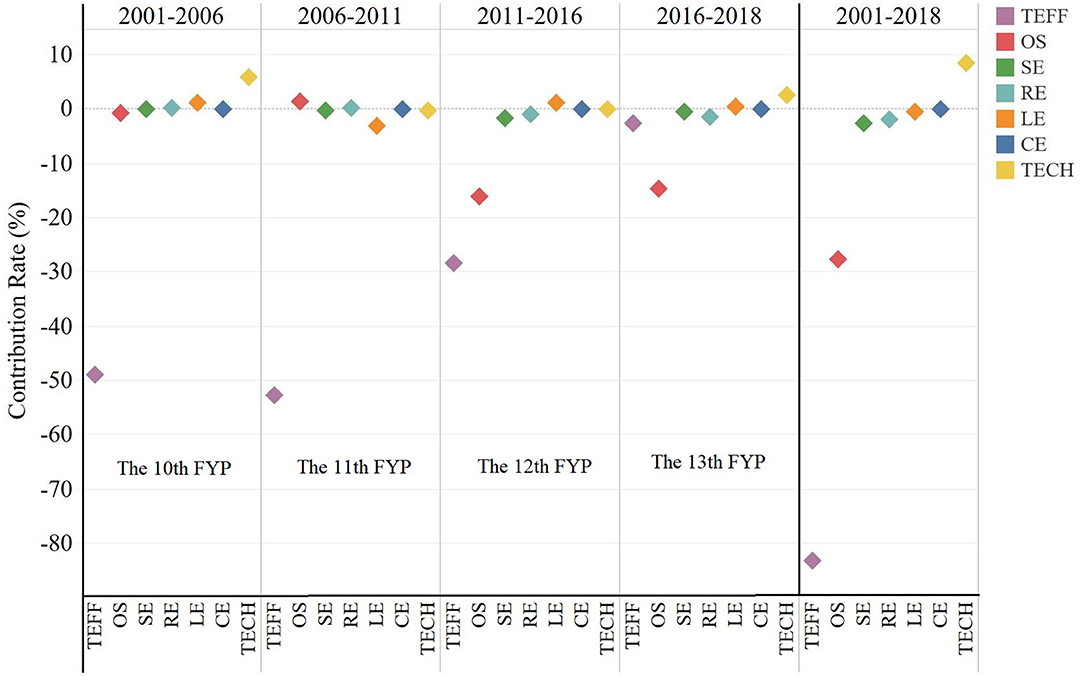
Figure 3. Contribution rate of each driving factor in different periods at national level.
As we observe in Figure 3, during the entire examined period (2001–2018), TEFF effect (−83.22%) and OS effect (OS: −27.72%) play the dominant roles in the decline of CI for planting in China, followed by land-agrochemical energy substitution effect (–SE: 2.52%), regional effect (RE: −1.91%), and labor-agrochemical energy substitution effect (LE: −0.57%), while the TECH (8.52%) shows a positive effect on changes of CI. We can observe that land-agrochemical energy SE, LE, CE, and RE have almost negligible and stable impact on the planting CI in each economic stage. Thus, the evolutions of TEFF, TECH, and OS at different economic stages are mainly investigated in the next section.
As for TEFF, the negative value of its contribution rate indicates that the improvement of TEFF curbs the increase of CI. As shown in Figure 3, during the 10th FYP, 11th FYP, 12th FYP, and 13th FYP, the contribution rate of this factor is −49.01, −52.78, −28.45, and −2.61%, respectively. This means that the contribution of TEFF has witnessed a sharp decline since the 12th FYP. The reasons may be that the Chinese government implemented a series of agricultural support policies during the 10th and the 11th FYP. For instance, in order to stimulate the inspiration of farmers to cultivate grains, the central government abolished the agricultural tax and carried out four agricultural subsidies (seed subsidy, grain direct subsidy, farm-machinery subsidy, and comprehensive subsidy). These measures affect farmers' production decisions and inspire them to use clean agrochemical energy.
For the OS effect, it has little effect on the change in the CI of crop farming over the periods of the 10th FYP and 11th FYP (see Figure 3). However, it gradually promotes the decline of CI since 2011, and upturn as a leading role in the period of 2016–2018. This result may be explained by the non-grain-planting structure. As shown in Figure 4, the share of staple crops in the gross output of planting has declined since 2011, while those of vegetables and other crops have increased. Since the greenhouse gases (such as methane) are mainly derived from staple crops (rice, corn, and wheat), and the carbon sink caused by vegetables, the planting structure has actually transferred from the high-carbon pattern to a low-carbon one.

Figure 4. Changes in the output structure of China's crop industry (2001–2018).
As shown in Figure 3, TECH effect contributes the increase of CI in the 10th FYP with a rate of 5.89%. This result implies that the technological progress in China's planting promotes the usage of high-carbon input, and thus increases the CI. This conclusion is contrary to that of previous studies, which insist that technology improvement in planting cuts down CO2 emissions. The reasons may be explained by the “rebound effect” (Thomas and Azevedo, 2013; Ghosh and Blackhurst, 2014; Zhang et al., 2017; Du et al., 2019). Specifically, increasing production-oriented technological progress probably affect the substitution of agrochemical energy and other inputs (substitution effect) and the actual income of farmers (income effect) through its impact on prices of agrochemical energy, which may stimulate famers' consumption of agrochemical materials and then boost CI. However, during the 11th FYP, the 12th FYP, and the 13th FYP periods, the effect of technological progress in promoting CI gradually weakened. It can be inferred from this result that technological progress in planting is gradually shifting toward green. The reason is that the Chinese government starts to take measures to promote green agricultural production alleviating the degradation of agroecosystems. For example, they increase the investment in green technologies related to soil testing and fertilizer application, soil pollution control, and precision in agricultural and ecological recycling technologies.
Heterogeneity of Drivers of Planting CI Across Regions
As observed in Figure 5, the direction of influence of each component on CI in every region is similar to that of the whole country. However, there are significant differences in the value of contribution rate of each driver for CI across regions.
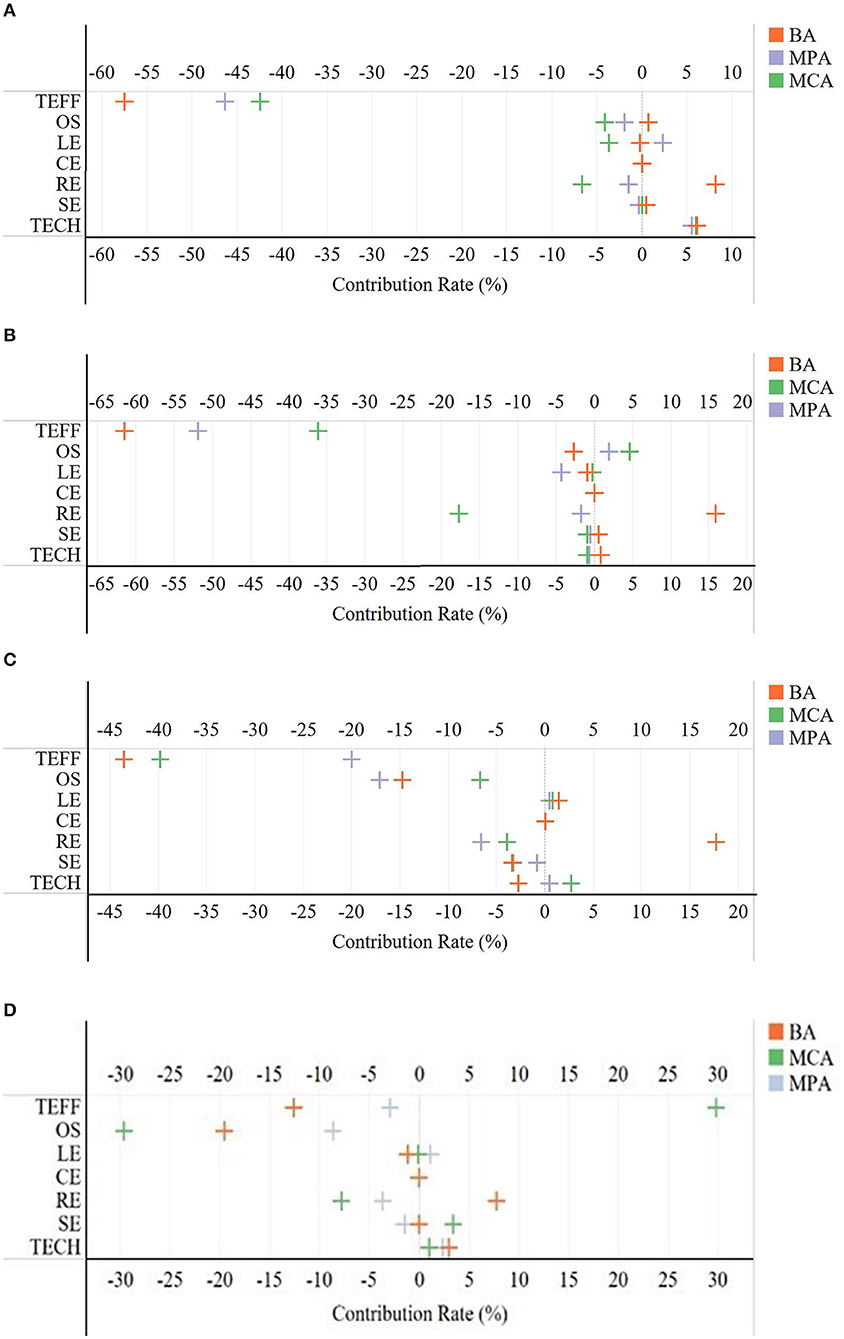
Figure 5. Decomposition results in three regions at different periods. (A) 2001–2006, (B) 2006–2011, (C) 2011–2016, and (D) 2016–2018.
As presented in Figure 5A, during the 10th FYP, the contribution rate of TEFF to the decline of CI in BA is the highest. The reason for this may be that self-sufficiency of food is available in BA, whose input allocation is likely to be primarily through market mechanisms. In contrast, China's grain production mainly depends on the MPA, so government support policies mainly favor this region to ensure national food security. These excessive policy interventions may enhance the TEFF of planting, but they also lead to the distortion of the factor market and the abuse of fertilizers and pesticides. As for OS, its contribution to the drop of CI in MCA is the highest among three regions. The potential reason lies in that the MCA includes Beijing, Tianjin, Shanghai, Zhejiang, Fujian, Guangdong, and Hainan, in which there are a small number of commercial crops. The planting OS in this area is constant. However, in MPA and MCA, periodic oversupply of food and other agricultural products may result in an uncoordinated OS.
As shown in Figure 5B, in the 11th FYP, the role of TEFF in the decrease of CI is similar to that in the 10th FYP no matter what the region is. The steady implementation of the agricultural policies and the government's efforts to stabilize grain production may result in this result. Differing from the TEFF, the contribution rates of OS to the falling of CI of BA and MPA are more than that of MCA. The outline of the 11th proposed to optimize the layout of agricultural production, promote the industrialization of agriculture, and adjust the structure of grain production. Moreover, these measures were primarily implemented in BA and MPA, which may lead to the rationalization of the agricultural structure.
During the 12th FYP, the TEFF contribution rate in MPA is the smallest among the three regions (see Figure 5C). The potential reasons for these results may be the simultaneous increase of three quantities in food production. China has been in a situation of grain supply shortage for a long time in the past, so it has been pursuing an increase in grain production. However, domestic agricultural production costs are still on an upward trajectory in this period. Since 2015, with rising land rent, labor costs, and machinery operating costs, there has been a “triple increase” in grain production, stocks, and imports. It may lead to the low TEFF of the planting in MAP. However, for OS in MPA, its contribution is stronger than other regions. The probable reason lies in the supply-side structural reform of agriculture of China, which proposed to remove capacity, reduce costs, and make up for shortcomings in the agricultural sector through structural adjustment.
As depicted in Figure 5D, the contribution rates of the TEFF effect in BA, MPA, and MCA are −12.60, −2.88, and 29.86% in the 13th FYP period, respectively. This result may derive from the “reform plan for establishing a green-ecology-oriented agricultural subsidy system” promulgated by the Chinese government in 2016. Accordingly, seed subsidy, grain direct subsidy, and comprehensive subsidy were combined into subsidies for arable land protection and moderate-scale operation. These measures may promote the amelioration of TEFF in BA and MPA. With respect to the OS effect, its contribution rates in BA, MPA, and MCA are −19.55, −8.64, and −29.65%, respectively. It may be related to the National Plan for the Structural Adjustment of the Plantation Industry (2016–2020) issued by the Ministry of Agriculture on April 28, 2016, which specified the tasks for the structural adjustment of the planting. In particular, it includes building a variety structure that adapts to market demand, a regional structure with coordinated production and ecology, and a farming system that combines land use and land raising. In terms of variety structure, the plan proposes that priority be given to developing high-quality agricultural products such as high-protein soybeans and actively developing special processing varieties like high-starch potatoes.
Conclusions and Policy Implications
With the dual pressures of food supply and carbon reduction, the CO2 intensity of China's planting has gradually become a key indicator in the effort of the agricultural sector to curb emissions. Incorporating PDA into the LMDI, this paper conducts a comprehensive framework to simultaneously explore the impact of both technological and structural effects on changes in China's planting carbon intensity. Based on this developed framework, the variations of crop farming CI are decomposed into TEFF effect, OS effect, TECH effect, land-agrochemical energy ratio, labor-agrochemical energy ratio, regional effect, and emission coefficient effect. Moreover, the contribution rate of each factor for the agricultural sector for 31 provinces in China from 2001 to 2018 has been evaluated and analyzed, respectively.
The results indicate that China's planting carbon intensity has witnessed a continuous decline. Examining the sources of the CO2 intensity decrease of planting, we find that TEFF effect plays a dominant role whether at the national or regional level, followed by the OS effect. In contrast, TECH effect promotes the growth of CI. Analysis of regional differences demonstrates the following: (1) During the whole observed period, the TEFF component in BA and MPA shows a larger contribution for the decline of CI than that of MCA. (2) With respect to the OS effect, it presents the greatest contribution for the decline of CI in MCA, and the effect is relatively weak in BA and MPA. (3) Nevertheless, the positive effects of TECH on CI changes almost have no differences among three regions. (4) The contribution rate of each factor is relatively unstable across regions and economic stages due to the frequent implementation of agricultural support policies.
Based on the conclusions drawn from the above analysis, some valuable policy implications can be put forward for the Ministry of Agricultural and Rural Affairs of China in low-carbon development of planting industry. At first, considering that TEFF effect plays a major role in prompting China's planting carbon intensity decline, future policy should continue to optimize the allocation of agricultural resources. Especially the BA and MPA may proceed to control the excessive inputs of fertilizers and pesticides and promote land transfer for achievement of a moderate planting operation scale. Secondly, since the adjustment of the planting OS is conducive to falling of CI, cultivate new crop varieties with high yield and low carbon emissions in the future. Thirdly, because the TECHs played a positive role in the alteration of CI, it is urgent to increase the investment in green technologies related to soil testing and fertilizer application, soil pollution control, and precision in agricultural and ecological recycling technologies.
This paper does not decompose the CI of various crops at the provincial level due to the availability of data. Hence, the decomposition and analysis of regional heterogeneity results can be more precise in future works. Moreover, the method of calculating the total carbon emissions in the agricultural sector is controversial, and this paper just adopted the common practice of existing research, which did not take the carbon sink of planting into consideration. It is therefore worthwhile to improve the measurement.
Data Availability Statement
The original contributions presented in the study are included in the article/supplementary material, further inquiries can be directed to the corresponding author/s.
Author Contributions
DF wrote the full text under the guidance of FY. FY was involved on many detailed discussions about the content of the manuscript, revising, reviewing, and giving a number of valuable crucial suggestions. FY shared the code about the calculation of PDA. FX gave the constructive suggestions on the structure of the paper, the rationality of calculation methods, and the interpretation of the results. All authors contributed to the article and approved the submitted version.
Funding
Financial supports from Natural Science Foundation of China (Grant Nos. 71874064 and 72073105), Key Projects of National Social Science Fund (Grant No. 20&ZD092), and the Fundamental Research Funds for Central Universities (Grant No. 2662021JGPYR01) are greatly acknowledged.
Conflict of Interest
The authors declare that the research was conducted in the absence of any commercial or financial relationships that could be construed as a potential conflict of interest.
Publisher's Note
All claims expressed in this article are solely those of the authors and do not necessarily represent those of their affiliated organizations, or those of the publisher, the editors and the reviewers. Any product that may be evaluated in this article, or claim that may be made by its manufacturer, is not guaranteed or endorsed by the publisher.
Acknowledgments
The authors would like to thank the editor and three reviewers for their valuable comments and suggestions.
Footnotes
1. ^The six sources are fertilizers, pesticides, plastic mulch, irrigation, plowing by a tractor, and diesel.
2. ^The four sectors are grain crops, oil-bearing crops, vegetables, and other crops.
3. ^.
4. ^The division is based on Opinions on the Reform and Improvement of Comprehensive Agricultural Development Policies and Measures issued by the Ministry of Finance of the People's Republic of China.
5. ^For example, 1 kg of fertilizer causes 0.896 kg of CO2, and 1 kg of diesel produces 0.593 kg of CO2, which means that carbon emissions from 1 kg of fertilizer are equivalent to that of 1.511 kg diesel.
References
Ang, B. W. (2004). Decomposition analysis for policymaking in energy. Energy Policy 32, 1131–1139. doi: 10.1016/s0301-4215(03)00076-4
Ang, B. W. (2005). The LMDI approach to decomposition analysis: a practical guide. Energy Policy 33, 867–871. doi: 10.1016/j.enpol.2003.10.010
Ang, B. W. (2015). LMDI decomposition approach: A guide for implementation. Energy Policy 86, 233–238. doi: 10.1016/j.enpol.2015.07.007
Chen, L., and Duan, Q. (2016). Decomposition analysis of factors driving CO2 emissions in Chinese provinces based on production-theoretical decomposition analysis. Nat. Hazards 84, 267–277. doi: 10.1007/s11069-016-2313-1
Crippa, M., Solazzo, E., Guizzardi, D., Monforti-Ferrario, F., Tubiello, F. N., and Leip, A. (2021). Food systems are responsible for a third of global anthropogenic GHG emissions. Nat. Food 2, 198–209. doi: 10.1038/s43016-021-00225-9
Dong, B., Zhang, M., Mu, H. L., and Su, X. M. (2016). Study on decoupling analysis between energy consumption and economic growth in Liaoning Province. Energy Policy 97, 414–420. doi: 10.1016/j.enpol.2016.07.054
Dong, F., Gao, X. Q., Li, J. Y., Zhang, Y. Q., and Liu, Y. J. (2018a). Drivers of China's industrial carbon emissions: evidence from joint PDA and LMDI approaches. Int. J. Environ. Res. Public Health 15, 2712. doi: 10.3390/ijerph15122712
Dong, F., Yu, B., Hadachin, T., Dai, Y., Wang, Y., Zhang, S., et al. (2018b). Drivers of carbon emission intensity change in China. Resour. Conserv. Recycl. 129, 187–201. doi: 10.1016/j.resconrec.2017.10.035
Du, K., and Lin, B. (2015). Understanding the rapid growth of China's energy consumption: a comprehensive decomposition framework. Energy 90, 570–577. doi: 10.1016/j.energy.2015.07.079
Du, Q., Li, Z., Li, Y., Bai, L., Li, J., and Han, X. (2019). Rebound effect of energy efficiency in China's construction industry: a general equilibrium analysis. Environ. Sci. Pollut. Res. 26, 12217–12226. doi: 10.1007/s11356-019-04612-5
Ghosh, N. K., and Blackhurst, M. F. (2014). Energy savings and the rebound effect with multiple energy services and efficiency correlation. Ecol. Econ. 105, 55–66. doi: 10.1016/j.ecolecon.2014.05.002
Han, H., Zhong, Z., Guo, Y., Xi, F., and Liu, S. (2018). Coupling and decoupling effects of agricultural carbon emissions in China and their driving factors. Environ. Sci. Pollut. Res. 25, 25280–25293. doi: 10.1007/s11356-018-2589-7
He, Y., Zhu, S., Zhang, Y., and Zhou, Y. (2021). Calculation, elasticity and regional differences of agricultural greenhouse gas shadow prices. Sci. Total Environ. 790:148061. doi: 10.1016/j.scitotenv.2021.148061
Hoegh-Guldberg, O., Jacob, D., Taylor, M., Guillen Bolanos, T., Bindi, M., Brown, S., et al. (2019). The human imperative of stabilizing global climate change at 1.5 degrees C. Science 365, eaaw6974. doi: 10.1126/science.aaw6974
Huang, X., Xu, X., Wang, Q., Zhang, L., Gao, X., and Chen, L. (2019). Assessment of agricultural carbon emissions and their spatiotemporal changes in China, 1997–2016. Int. J. Environ. Res. Public Health 16, 3105. doi: 10.3390/ijerph16173105
Jiang, M., An, H., Gao, X., Jia, N., Liu, S., and Zheng, H. (2021). Structural decomposition analysis of global carbon emissions: the contributions of domestic and international input changes. J. Environ. Manage. 294:112942. doi: 10.1016/j.jenvman.2021.112942
Li, N., Wei, C., Zhang, H., Cai, C., Song, M., and Miao, J. (2020). Drivers of the national and regional crop production-derived greenhouse gas emissions in China. J. Clean. Prod. 257:120503. doi: 10.1016/j.jclepro.2020.120503
Lin, B., and Xu, M. (2019). Quantitative assessment of factors affecting energy intensity from sector, region and time perspectives using decomposition method: a case of China's metallurgical industry. Energy 189:116280. doi: 10.1016/j.energy.2019.116280
Liu, N., Ma, Z. J., and Kang, J. D. (2017). A regional analysis of carbon intensities of electricity generation in China. Energy Econ. 67, 268–277. doi: 10.1016/j.eneco.2017.08.018
Liu, Y., and Feng, C. (2021). What drives the decoupling between economic growth and energy-related CO2 emissions in China's agricultural sector? Environ. Sci. Pollut. Res. 28, 44165–44182. doi: 10.1007/s11356-021-13508-2
Long, D. J., and Tang, L. (2021). The impact of socio-economic institutional change on agricultural carbon dioxide emission reduction in China. PLoS ONE 16:e0251816. doi: 10.1371/journal.pone.0251816
Pakrooh, P., Hayati, B., Pishbahar, E., Nematian, J., and Brannlund, E. R. (2020). Focus on the provincial inequalities in energy consumption and CO2 emissions of Iran's agriculture sector. Sci. Total Environ. 715:137029. doi: 10.1016/j.scitotenv.2020.137029
Pasurka, C. A. (2006). Decomposing electric power plant emissions within a joint production framework. Energy Econ. 28, 26–43. doi: 10.1016/j.eneco.2005.08.002
Song, Y., and Zhang, M. (2017). Using a new decoupling indicator (ZM decoupling indicator) to study the relationship between the economic growth and energy consumption in China. Nat. Hazards 88, 1013–1022. doi: 10.1007/s11069-017-2903-6
Song, Y., and Zhang, M. (2019). Research on the gravity movement and mitigation potential of Asia's carbon dioxide emissions. Energy 170, 31–39. doi: 10.1016/j.energy.2018.12.110
Song, Y., Zhang, M., and Shan, C. (2019). Research on the decoupling trend and mitigation potential of CO2 emissions from China's transport sector. Energy 183, 837–843. doi: 10.1016/j.energy.2019.07.011
Sui, J., and Lv, W. (2021). Crop production and agricultural carbon emissions: relationship diagnosis and decomposition analysis. Int. J. Environ. Res. Public Health 18:8219. doi: 10.3390/ijerph18158219
Tan, R., and Lin, B. (2018). What factors lead to the decline of energy intensity in China's energy intensive industries? Energy Econ. 71, 213–221. doi: 10.1016/j.eneco.2018.02.019
Thomas, B. A., and Azevedo, I. L. (2013). Estimating direct and indirect rebound effects for U.S. households with input–output analysis. Part 2: simulation. Ecol. Econ. 86, 188–198. doi: 10.1016/j.ecolecon.2012.12.002
Wang, C. (2007). Decomposing energy productivity change: a distance function approach. Energy 32, 1326–1333. doi: 10.1016/j.energy.2006.10.001
Wang, C. (2011). Sources of energy productivity growth and its distribution dynamics in China. Resour. Energy Econ. 33, 279–292. doi: 10.1016/j.reseneeco.2010.06.005
Wang, H., and Zhou, P. (2018). Multi-country comparisons of CO2 emission intensity: the production-theoretical decomposition analysis approach. Energy Econ. 74, 310–320. doi: 10.1016/j.eneco.2018.05.038
Wang, W. W., Liu, X., Zhang, M., and Song, X. F. (2014). Using a new generalized LMDI (logarithmic mean Divisia index) method to analyze China's energy consumption. Energy 67, 617–622. doi: 10.1016/j.energy.2013.12.064
Wieland, H., Giljum, S., Bruckner, M., Owen, A., and Wood, R. (2017). Structural production layer decomposition: a new method to measure differences between MRIO databases for footprint assessments. Econ. Syst. Res. 30, 61–84. doi: 10.1080/09535314.2017.1350831
Wu, S., Hu, S., and Frazier, A. E. (2021). Spatiotemporal variation and driving factors of carbon emissions in three industrial land spaces in China from 1997 to 2016. Technol. Forecast. Soc. Change 169:120837. doi: 10.1016/j.techfore.2021.120837
Wu, Y., Tam, V. W. Y., Shuai, C., Shen, L., Zhang, Y., and Liao, S. (2019). Decoupling China's economic growth from carbon emissions: empirical studies from 30 Chinese provinces (2001–2015). Sci. Total Environ. 656, 576–588. doi: 10.1016/j.scitotenv.2018.11.384
Xiong, C. H., Chen, S., and Xu, L. T. (2020). Driving factors analysis of agricultural carbon emissions based on extended STIRPAT model of Jiangsu province, China. Growth Change 51, 1401–1416. doi: 10.1111/grow.12384
Zha, D. L., Yang, G. L., and Wang, Q. W. (2019). Investigating the driving factors of regional CO2 emissions in China using the IDA-PDA-MMI method. Energy Econ. 84, 104521. doi: 10.1016/j.eneco.2019.104521
Zhang, L., Pang, J., Chen, X., and Lu, Z. (2019). Carbon emissions, energy consumption and economic growth: evidence from the agricultural sector of China's main grain-producing areas. Sci. Total Environ. 665, 1017–1025. doi: 10.1016/j.scitotenv.2019.02.162
Zhang, M., Bai, C. Y., and Zhou, M. (2018). Decomposition analysis for assessing the progress in decoupling relationship between coal consumption and economic growth in China. Resourc. Conserv. Recyling 129, 454–462. doi: 10.1016/j.resconrec.2016.06.021
Zhang, Y.-J., Peng, H.-R., and Su, B. (2017). Energy rebound effect in China's Industry: an aggregate and disaggregate analysis. Energy Econ. 61, 199–208. doi: 10.1016/j.eneco.2016.11.011
Keywords: planting industry, carbon emission intensity, decomposition, LMDI-PDA, driving factors
Citation: Yang F, Fan D and Xu F (2022) Driving Factors of Carbon Emission Intensity for China's Planting: A Combination of LMDI and PDA. Front. Clim. 3:798339. doi: 10.3389/fclim.2021.798339
Received: 20 October 2021; Accepted: 06 December 2021;
Published: 03 February 2022.
Edited by:
Hongbo Duan, University of Chinese Academy of Sciences, ChinaReviewed by:
Ming Zhang, China University of Mining and Technology, ChinaJiahai Yuan, North China Electric Power University, China
Copyright © 2022 Yang, Fan and Xu. This is an open-access article distributed under the terms of the Creative Commons Attribution License (CC BY). The use, distribution or reproduction in other forums is permitted, provided the original author(s) and the copyright owner(s) are credited and that the original publication in this journal is cited, in accordance with accepted academic practice. No use, distribution or reproduction is permitted which does not comply with these terms.
*Correspondence: Dongshou Fan, ZmRzaHphdUAxNjMuY29t; Fei Xu, d3N4ZmFobnVAMTYzLmNvbQ==