 Xiaolin Zhang
 Takashi Mochizuki
- Department of Earth and Planetary Sciences, Kyushu University, Fukuoka, Japan
We examined the interannual variations in sea surface height (SSH) over the northwestern Indian Ocean during 1993–2016, by using in situ observations along the east coast of the Arabian Peninsula together with satellite observations, objective analysis, and reanalysis. Focusing on the impacts of the Indian summer monsoon relative to the El Niño Southern Oscillation (ENSO) and the Indian Ocean Dipole (IOD) modes, we found that the monsoon predominantly controls the summertime SSH variations at the in situ observatories, consistent with satellite observations. The monsoon is closely related to the SSH at a specific observatory in almost all seasons, whereas the wintertime SSH is strongly influenced by ENSO and IOD at other observatories. These SSH variations with local modulations in the coastal area were accompanied by basin-scale variations. The reduced southwesterly monsoon wind, for example, is found with the reduced ocean upwelling narrowly confined near the coast and the upper ocean temperature rise implying reduced meridional heat transport over the south of the Arabian Peninsula.
Introduction
The sea surface height (SSH) anomaly is a useful indicator to verify prediction skills and to discuss the predictability of global, regional, and local climate variability, since it is a two-dimensional variable corresponding to vertically integrated states of the upper ocean (e.g., ocean heat content and horizontal ocean circulation), and usually, it represents a larger signal-to-noise ratio, compared to sea surface temperature (SST) and ocean current velocity at a specific depth (e.g., Mochizuki et al., 2010, 2012). Improved knowledge of global SSH fluctuations, directly measured by satellites in recent years, enables us to enhance our ability to verify climate predictions and our understanding of underlying atmosphere-ocean coupled mechanisms. It is known that the SSH anomaly is dynamically and/or thermodynamically linked to ocean upwelling, which is characterized by changes in the 20°C isothermal layer depth (referred to as D20) and is mainly forced by wind stress, heat flux, and freshwater. Wind stress dynamically leads to major changes in thermocline upwelling (D20 shoaling) and SSH anomalies through Ekman divergence. The surface heat flux produces baroclinic pressure signals in the upper ocean on a horizontally larger scale than the baroclinic radius of deformation, giving rise to regional SSH anomaly signals (Huang and Jin, 2002). The freshwater flux gives rise to barotropic pressure signals in the upper ocean, and these signals are quickly dispersed into the world's oceans, resulting in the formation of negligible anomalies in the SSH field (Huang and Jin, 2002).
In recent satellite measurements, interannual SSH fluctuations over the Indian Ocean have been observed to be strong in the tropical area and along the east coast of the northern area (i.e., the Arabian Sea and the Bay of Bengal; see the left panels of Figure 5 in Zhang and Han, 2020). In tropical areas, in particular, a number of studies have revealed that interannual SSH variations are closely related to the El Niño Southern Oscillation (ENSO) and Indian Ocean Dipole (IOD) mode (e.g., Masumoto and Meyers, 1998; Chambers et al., 1999; Le Blanc and Boulanger, 2001; Rao et al., 2002; Feng and Meyers, 2003; Feng et al., 2004; Yu et al., 2005; Yuan and Liu, 2009; Chakravorty et al., 2014; McPhaden and Nagura, 2014; Menezes and Vianna, 2019). Several mechanisms have been discussed in terms of the contribution of Indian Ocean thermocline upwelling (e.g., using the D20 anomaly). Tozuka et al. (2010) suggested that the interannual D20 anomaly in the western Indian Ocean upwelling zone is primarily caused by local Ekman pumping and Rossby waves generated by surface winds in the central and eastern Indian Oceans. The influence of remote forcing from the Pacific via the Indonesian Throughflow is weak in this area, even though it has significant contributions to the southeastern Indian Ocean (e.g., Potemra, 2001; Trenary and Han, 2012; Deepa et al., 2018). Rossby waves may also play an important role in regulating the interannual variability of the sea level over the southern Indian Ocean (Woodberry et al., 1989; Périgaud and Delecluse, 1992, 1993; Zhuang et al., 2013). Based on these results, Zhang and Han (2020) attempted to reproduce the interannual variability of tropical Indian Ocean upwelling using a conventional static linear regression model and a Bayesian dynamical linear model. By taking into account the surface wind changes associated only with ENSO and IOD as the atmospheric forcing, they demonstrated that the dynamical responses to local wind stress, together with the additional contribution of the oceanic Rossby wave propagation, reproduce the tropical Indian Ocean upwelling variability, as in satellite-based observations.
Although many studies have found interannual SSH variability over the Arabian Sea and the Bay of Bengal (e.g., Han and Webster, 2002; Suresh et al., 2018), particularly in relation to ENSO and IOD (i.e., Aparna et al., 2012; Sreenivas et al., 2012; Parekh et al., 2017), the conventional model of Zhang and Han (2020) did not accurately simulate the SSH anomalies along the east coast of the Arabian Peninsula and the Indian subcontinent as in the satellite-based observations, in contrast to the tropical area. In fact, Aparna et al. (2012) mainly focused on the Bay of Bengal, and their results showed that the ENSO and IOD contributions through wind-induced ocean upwelling in the western Indian Ocean can be limited to the tropical area (i.e., south of 15°N) rather than the east coast of the Arabian Peninsula, except for IOD-related wind anomalies in boreal autumn. These results suggest that other climate modes, such as the Indian summer monsoon, may contribute more directly to interannual SSH fluctuations along the east coast of the Arabian Peninsula, where seasonal monsoon forcing dominates the climate and is commonly influenced by ENSO and IOD (Schott and McCreary, 2001; Schott et al., 2009). When focusing on wind stress, for example, the Indian monsoon is dominantly observed over the northern Indian Ocean, characterized by southwesterly and northeasterly winds over the Arabian Sea in summer and winter, respectively. Therefore, we analyzed the global observations, analysis, and reanalysis together with local tide gauge data along the Arabian Peninsula using linear regression (Zhang and Han, 2020) to evaluate the relative importance of the Indian monsoon in addition to ENSO and IOD in controlling the interannual SSH variations along the east coast of the Arabian Peninsula and accompanying changes in the northwestern Indian Ocean. We clarify the monsoon-related fluctuations in in situ tide gauge and satellite observation datasets, particularly focusing on the differences between the ENSO and IOD. We also discuss the accompanying atmospheric–ocean changes in the northwestern Indian Ocean, where the SSH fluctuations are observed to be strongest in the coastal area. The atmosphere–ocean interaction in the northern Indian Ocean has recently attracted much attention as part of the so-called Indian Ocean basin warming, which is sometimes observed after an ENSO event (e.g., Xie et al., 2009; Chowdary et al., 2010) and possibly impacts the summertime rainfall over East Asia (e.g., Kosaka et al., 2013; Takaya et al., 2021).
The remainder of this article is organized as follows. We describe the observed, analyzed, and reanalyzed datasets in Section 2. In Section 3, we verify the interannual SSH variations in in situ observations of sea level along the Arabian Peninsula using satellite observations. We clarify the statistical relationships between these local SSH variations and ENSO, IOD, and the Indian summer monsoon in Section 4. In Section 5, we discuss the possible contributors to these local SSH variations in the northwestern Indian Ocean. A summary is presented in Section 6.
Observed, analyzed, and reanalyzed datasets
We used in situ sea level data compiled by the University of Hawaii Sea Level Center (https://www.psmsl.org/data/obtaining/map.html). We used tide gauge data from three observatories along the east coast of the Arabian Peninsula, given as follows: Muscat B (23.6°N, 58.6°E; 2009–2018) is the capital city located in northeast Oman; Masirah (20.7°N, 58.9°E; 1996–2018) is an island close to the east coast of mainland Oman in the Arabian Sea; and Salalah (16.9°N, 54.0°E; 1994–2018) is located in southern Oman. The locations of these observatories are shown in Figure 2. We also used global observations of SSH anomalies derived from the 1/4° monthly Archiving, Validation, and Interpretation of Satellite Oceanography (AVISO) data from 1993 to 2016.
The values of D20, representing the ocean thermocline depth and reflecting the contribution of wind-forced SSH anomalies (e.g., upwelling), were calculated using monthly ocean temperature data from the European Center for Medium-Range Weather Forecast (ECMWF) Ocean Reanalysis System 4 (ORAS4) for 1958–2016 (Balmaseda et al., 2013). The net heat flux at the sea surface on a 1° × 1° spatial grid was taken from version 3 of the Objective Analyzed Air-Sea Fluxes (OAFlux_V3) compiled at the Woods Hole Oceanographic Institute. We used data covering the period 1985–2009, which have been validated against in situ flux measurements in the Indian Ocean (Yu and Weller, 2007; Yu et al., 2007). Monthly wind stress data, with a resolution of 0.75°, are available from the ERA-Interim reanalysis compiled by the ECMWF. An objective analysis of the upper ocean temperature was conducted by the Meteorological Research Institute, Japan Meteorological Agency (Ishii et al., 2017). In the following sections, we analyze monthly anomalies relative to the seasonal cycle in climatology using data available from 1993 to 2016.
Interannual SSH fluctuations from in situ and satellite sea level data
Long-term measurements of in situ sea level by tide gauges are available from permanent service data. The interannual SSH variation is strongest along the east coast of the Arabian Peninsula, as well as in the tropical areas. The left panels of Figure 1 show the monthly anomalies of the sea level at the Muscat, Masirah, and Salalah observatories (see green circles in Figure 2 for the locations of these observatories). Even though these observatories offer data with different record lengths and missing data are found in some periods, interannual fluctuations together with seasonal fluctuations are verified at each observatory. The interannual fluctuation in the in situ data shows a time series similar to that of the AVISO satellite observations at the nearest grid point to each observatory. For example, the correlation values between the two observational datasets in the interannual SSH fluctuation during July–September were 0.51, 0.58, and 0.83 at Muscat, Masirah, and Salala observatories, respectively. In addition, seasonal changes in the amplitudes of the interannual fluctuations were consistent with the AVISO observations (right panels of Figure 1). The SSH fluctuation at Muscat shows seasonal peaks in autumn and winter (Figure 1D), whereas both observations at Masirah also show large amplitudes in summer (Figure 1E). The SSH in Salalah showed relatively weak seasonality (Figure 1F).
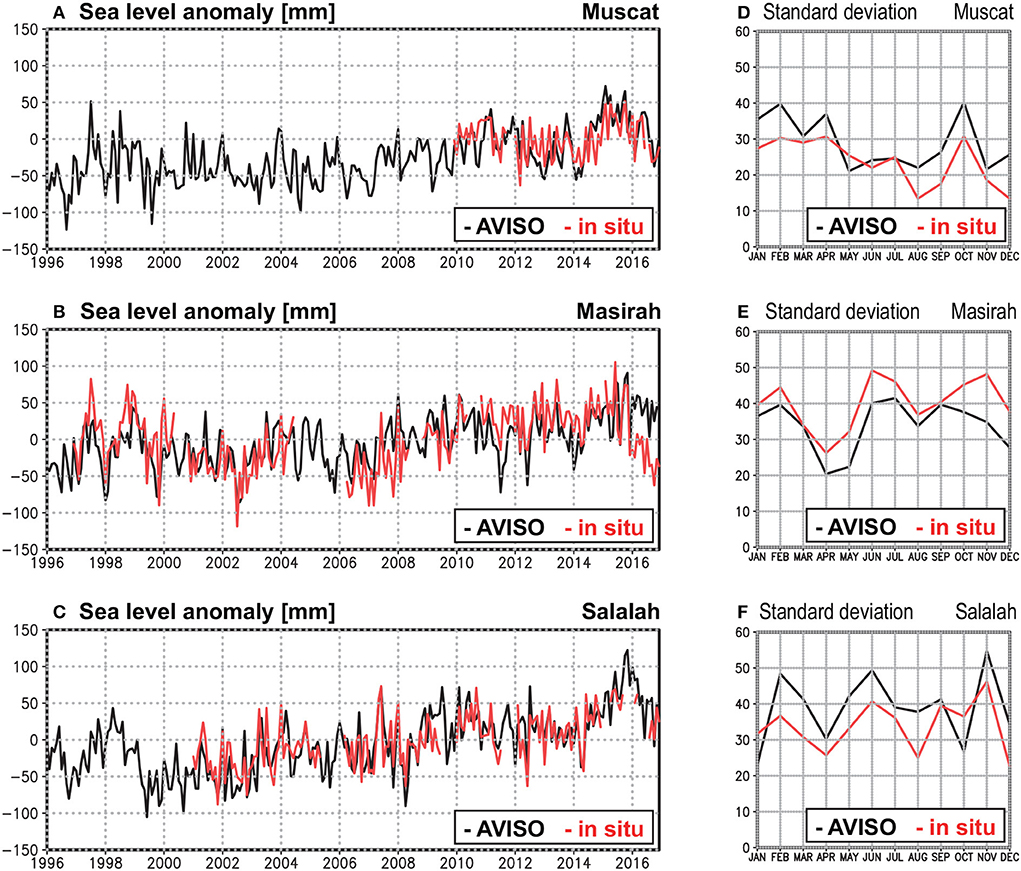
Figure 1. (Left) Monthly anomalies of the observed sea level data at (A) Muscat B (23.6°N, 58.6°E), (B) Masirah (20.7°N, 58.9°E), and (C) Salalah (16.9°N, 54.0°E) observatories. Red and black lines represent in situ and AVISO satellite observations, respectively. (Right) Standard deviations of the observed sea level fluctuations for each calendar month at (D) Muscat B, (E) Masirah, and (F) Salalah observatories. For both the in situ (red lines) and satellite (black lines) observations, standard deviation values are calculated using the data in the period when the in situ data are available.
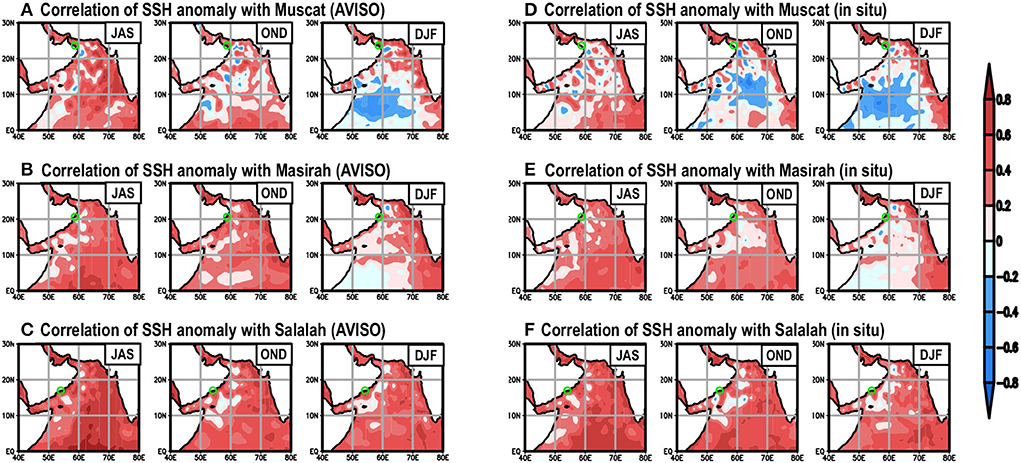
Figure 2. (A) Correlation maps of AVISO-derived SSH anomalies with the AVISO-derived SSH at Muscat B observatory in July–September, October–December, and December–February. Plotted values are calculated using the data in the period when the in situ data are available. A green circle denotes the location of the Muscat B observatory. (B,C) Are as in (A), but show the correlations with AVISO-derived SSH at the Masirah and Salalah observatories, respectively. Green circles denote the location of Masirah and Salalah, respectively. (D–F) Are the same as in (A–C), respectively, except for the correlations with the in situ SSH data.
The large-scale SSH variations associated with the in situ observations (right panels of Figure 2) agree with those of the AVISO data (left panels of Figure 2) over the Arabian Sea. It should be noted that the spatial patterns depend on the location of the referenced observatory and the season. Positive correlations were always observed along the west coast of the Indian subcontinent. Both in situ and satellite observations at Salalah were accompanied by positive correlations over almost the entire Arabian Sea (Figures 2C,F), while negative correlations with the SSH fluctuation at Muscat were found in subtropical areas, particularly in autumn and winter (Figures 2A,D). These differences in spatial patterns may correspond to a climate mode that can predominantly control SSH fluctuation at each observatory, as described in the following sections.
Climate indices and their relation to local SSH fluctuations
We defined the indices of ENSO, IOD, and the Indian summer monsoon (hereafter referred to simply as monsoon) to clarify the relationships between SSH and climate modes. The ENSO (NINO3.4 index) and IOD (dipole mode index) indices were defined using SST time series after 1870 in the Hadley Center Global Sea Ice and Sea Surface Temperature (HadISST) dataset (Rayner et al., 2003). We used the Webster and Yang Index (Webster and Yang, 1992), defined as the area averages (0°-20°N, 40°E−110°E) of the vertical shear in zonal wind speed between 850 and 200 hPa, to represent the states of the Indian summer monsoon (hereafter referred to as the monsoon index). Three-month averages of the ENSO, IOD, and monsoon indices peaked seasonally in November–January, September–November, and June–August, respectively. We defined the interannual variation of a specific index using the index values in its peak season only. In the AVISO observation, the tropical SSH anomalies peaked in the seasons when ENSO and IOD signals were strongest, while the SSH anomalies along the Arabian Peninsula were observed in almost all seasons, including the boreal summer (Zhang and Han, 2020). Figure 3 represents the interannual variations in ENSO, IOD, and monsoon indices during the period 1993–2016, reversing the sign of the monsoon index for convenience. The ENSO index correlates well with the IOD index (correlation coefficient of 0.63) and monsoon index (correlation coefficient of −0.61), and the correlation value between IOD and monsoon indices is −0.32; it is known that ENSO (and IOD) is related to the Indian summer monsoon (e.g., Wu and Liu, 1995; Ohba and Ueda, 2005; Yang et al., 2007; Xie et al., 2009; Chowdary et al., 2010).
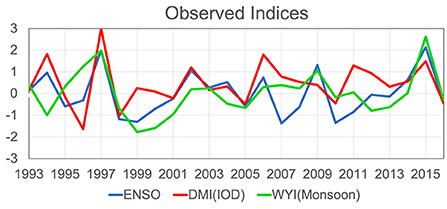
Figure 3. Interannual changes of the observed ENSO (blue line), IOD (red line), and Indian summer monsoon indices (green line). All indices are normalized during the period 1993–2016. ENSO, IOD, and Indian summer monsoon indices are the so-called NINO3.4 index, Dipole Mode Index (DMI), and Webster and Yang Index (WYI), respectively.
We estimated the individual contribution of each climate mode (ENSO, IOD, and monsoon) on SSH fluctuations using a static linear regression. We calculated the local SSH linearly regressed onto the normalized climate indices on a seasonal basis (Figure 4). Plotted regression values are the 3-month averages with a lag of 0 to 11 months relative to the specific 3 months referred for defining each climate index. At Muscat and Masirah, the monsoon dominantly contributes to SSH fluctuations in summer and autumn, probably with a lag of a few months (Figures 4A,B). The ENSO and IOD also show some contributions because these time series are correlated (see Figure 3). During the peak season of monsoon contribution, the ratio of the regression value to the standard deviation of the observed fluctuation exceeds 0.6 at Muscat, satisfying a significant level (Figure 4A), whereas the contribution at Masirah is relatively small and below a significant level (Figure 4B). The in situ data show slightly weaker but quite similar plots for each observatory (Figures 4D,E). In contrast, ENSO and/or IOD primarily contribute to SSH fluctuations in winter after the peak season of ENSO. The monsoon is closely related to the SSH fluctuation at Salalah in all seasons and usually contributes over 40% of the total amplitude (Figures 4C,F). Note that because these ENSO, IOD, and monsoon indices are not orthogonal to each other, as described above, Figure 4 illustrates the relative importance of each climate mode as a basis function to account for more variance solely.
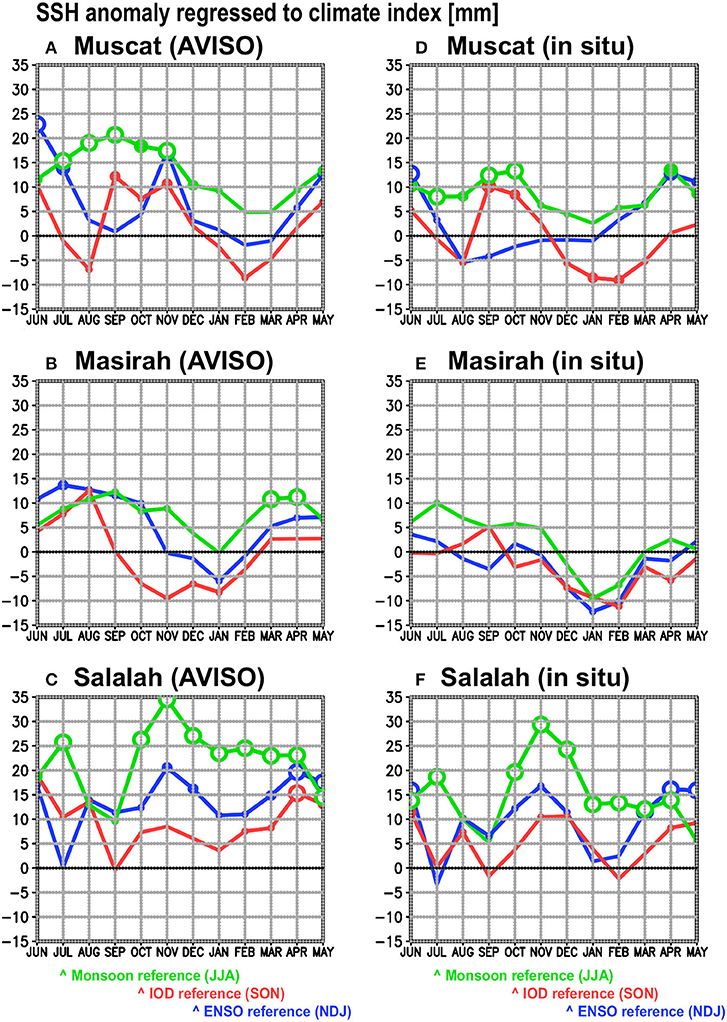
Figure 4. Lagged regressions of AVISO-derived SSH anomalies to normalized climate indices at the (A) Muscat B, (B) Masirah, and (C) Salalah observatories, respectively. Blue, red, and green lines represent the regressed values of ENSO, IOD, and Indian summer monsoon indices, respectively. Plotted values are 3-month averages with a lag of 0–11 months from the reference month of each climate indices and are calculated using the data in the period when the in situ data are available. White circles indicate that the regression values are significant at a 95% confidence limit in a one-side Student's t-test. Small, medium, and large colored circles are plotted when the ratio of the regression value to the standard deviation of the observed SSH fluctuation (see right panels of Figure 1) exceeds 0.2, 0.4, and 0.6, respectively. (D–F) Are the same as in (A–C), respectively, but show the in situ SSH anomalies.
Discussion of possible contributors to local SSH fluctuations
The correlation maps with climate indices should provide insights into the underlying process. The AVISO-derived SSH correlated with the climate indices, for example, in the 1-month lagged correlation, indicates that the spatial patterns depend on the climate modes, particularly in the coastal areas, in addition to showing overall high correlations over the northwestern Indian Ocean (Figure 5). Associated with ENSO and IOD, the wintertime SSH was strongly correlated with these indices in the western tropical Indian Ocean (bottom panels of Figure 5), which is consistent with numerous studies (Saji, 2018). At the same time, negative correlations with the ENSO and IOD indices were found in the coastal areas of the Indian subcontinent and the Persian Gulf (bottom panels of Figure 5), suggesting a contribution from the West Indian Coastal Current, which flows northward in winter and is known to be largely controlled by remote forcing rather than local wind (Schott and McCreary, 2001). This negative correlation in coastal areas was not clearly detected as a monsoon-related signal. These wintertime spatial patterns (DJF of Figures 5A,B) are similar to the correlations with the wintertime SSH observed at Muscat (DJF of Figures 2A,D), which is consistent with the large contribution of ENSO and/or IOD in winter SSH fluctuations at Muscat (Figures 4A,D).
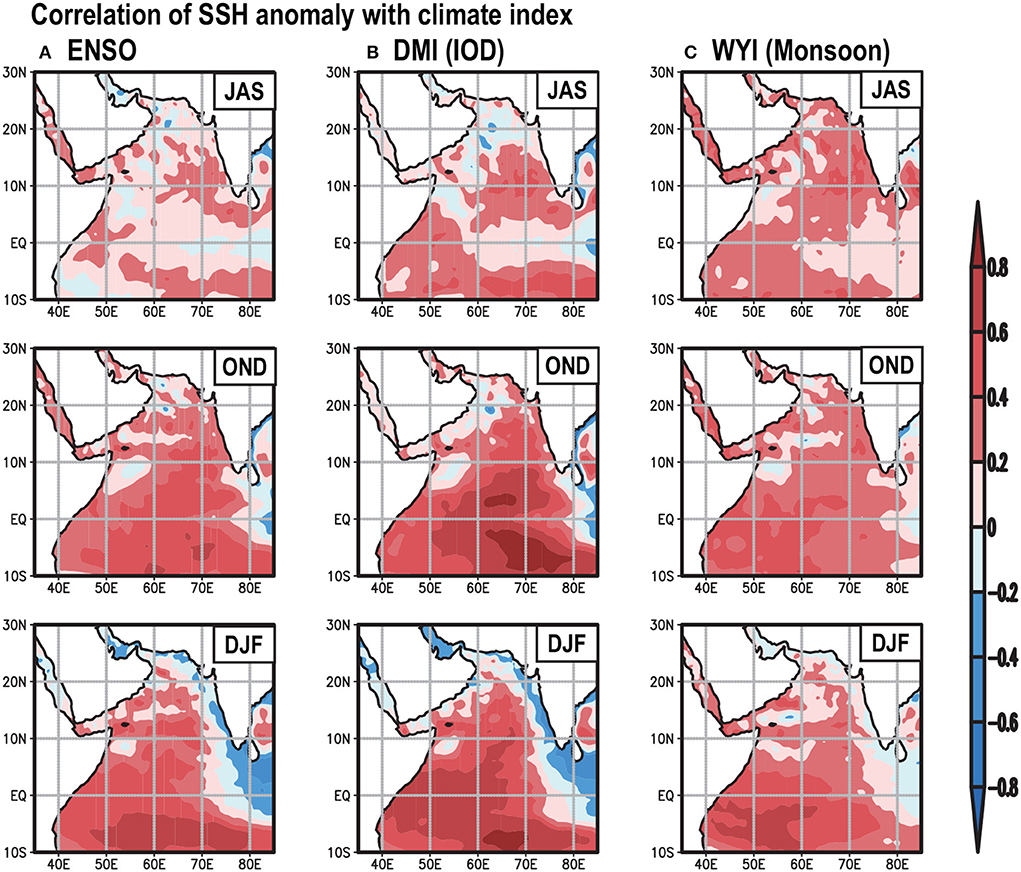
Figure 5. (A) Correlation maps of AVISO-derived SSH anomalies with ENSO index in July–September (upper panel), October–December (middle panel), and December–February (bottom panel) during the period 1993–2016. (B,C) Are as in (A), but show a correlation with the IOD index and monsoon index, respectively.
On the contrary, in summer, the positive SSH correlation with the monsoon index was widely spread over the coastal areas of the Arabian Peninsula in addition to the Indian subcontinent (top panels of Figure 5), showing spotted signals even along the Arabian Peninsula. The monsoon-related pattern corresponds to the correlation map with the in situ SSH data at Salalah (Figures 2C,F). In fact, positive correlations were found particularly around Salalah in all seasons, which is in good agreement with the dominant contribution of the monsoon in the SSH fluctuation at Salalah (Figures 4C,F). Salalah is known as a local upwelling wedge that is located north of the downstream of the Somali Current (i.e., the so-called Socotra Eddy and Great Whirl; Schott and McCreary, 2001), and a northward flowing coastal current, called the Ras al Hadd Jet, is observed in summer.
Regressions relevant to ocean upwelling using the monsoon index illustrate regional rather than local changes (Figure 6). Deep anomalies in D20, a good proxy for estimating the strength of ocean upwelling due to wind stress changes (Qiu, 2002), were clearly found along the entire southeast coast of the Arabian Peninsula in relation to the monsoon (Figure 6c) rather than ENSO and IOD (Figures 6a,b). The weak southwesterly wind reduced the coastal ocean upwelling and formed a negative Ekman upwelling anomaly (Figure 6f). Note that for the ocean upwelling that decreased with the reduced winds observed in the early 1990s, Shi et al. (2000) indicated that the upwelled waters originated near the coast rather than from open ocean upwelling. Another possible contributor is the reduction in southward ocean heat transport associated with the weakening of summer monsoon circulation (Loschnigg and Webster, 2000). Swapna et al. (2017) indicated that the decreased southward heat transport, which weakens the Indian Ocean cross-equatorial current (Miyama et al., 2003; Chirokova and Webster, 2006; Schoenefeldt and Schott, 2006), increases heat storage and sea level in the northern Indian Ocean. Loschnigg et al. (2003) demonstrated that meridional heat transport can work on interannual timescales accompanied by subsequent ENSO and IOD signals in the tropics. The high temperature in the upper ocean, together with the enhanced heat release at the sea surface under the reduced southwesterly (Figure 6i), implies this process, while it spreads over the southeast of the Arabian Peninsula, suggesting effective contribution at Salalah.
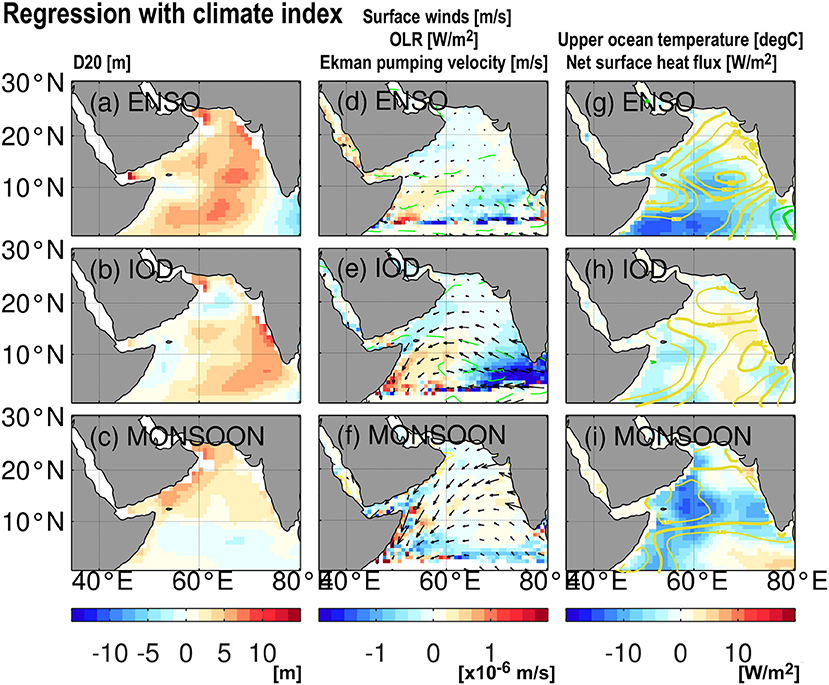
Figure 6. Regression maps of D20 anomalies with (a) ENSO, (b) IOD, and (c) monsoon indices in the peak seasons during the period 1993–2016. Central panels (d–f) are as in the left panels, but show the regression maps of surface winds (vectors), outgoing longwave radiation (OLR) (contours), and Ekman pumping velocity (shades). Yellow and green contours represent positive and negative values, respectively. The contour interval is 2.5 Wm−2. Right panels (g–i) are as in the left panels, but show the regression maps of net heat flux at the sea surface (shades) during the period 1993–2009 and the vertically averaged ocean temperature upper 300 m depth (contours). Positive and negative heat flux values represent the heat input and output of the ocean, respectively. Yellow and green contours represent positive and negative values, respectively. The contour interval is 0.05°C.
Summary
We examined interannual SSH variations over the northwestern Indian Ocean during 1993–2016, by using in situ observations along the east coast of the Arabian Peninsula together with satellite observations, objective analysis, and reanalysis. Focusing on the impacts of the Indian summer monsoon relative to ENSO and IOD, we found that the monsoon predominantly controls the summertime SSH variations at the in situ observatories, which is consistent with satellite observations. The monsoon is closely related to the SSH at the Salalah observatory in almost all seasons, whereas the wintertime SSH is strongly influenced by ENSO and IOD at the Muscat and Masirah observatories. These SSH variations with local modulations in the coastal area were accompanied by basin-scale variations, and we also discussed the potential contributions of the large-scale variability associated with these climate modes. The surface wind changes associated with the monsoon can contribute regionally to SSH variations through changes in the ocean upwelling anomaly narrowly confined near the coast and the meridional heat transport anomaly spreading more widely over the south of the Arabian Peninsula.
We primarily attempted to understand the relative importance of the contribution of climate indices to local SSH fluctuations along the Arabian Peninsula. Our discussion suggests that wind stress can work as the dominant factor, showing consistency in other physical variables, while a detailed discussion of physical processes can enhance our understanding in the future. The contribution of ocean eddies can also play an important role in realizing local sea level fluctuations at specific observatories and narrowly confined SSH anomalies due to ocean upwelling (e.g., Trott et al., 2019). High-resolution modeling is an effective means of discussing the potential influences of mesoscale ocean eddies and topography. For example, the Muscat observatory is located in the northeast of the Arabian Peninsula and the Gulf of Oman, rather than the Arabian Sea, which forms the northeastern periphery. The relative importance of ENSO, IOD, and monsoons can be sensitive to the complicated topography at a specific observatory.
Data availability statement
The original contributions presented in the study are included in the article/supplementary materials, further inquiries can be directed to the corresponding author.
Author contributions
XZ proposed the research direction. TM specified the research target. All authors analyzed the data, created figures, discussed the research results, and wrote the manuscript. All authors contributed to the article and approved the submitted version.
Funding
This work was supported by JSPS KAKENHI, Grant Numbers JP19H05703 and JP17K05661.
Acknowledgments
We gratefully acknowledge the discussions with Drs. Ruixin Huang, Mikhail Karpytchev, Yu Kosaka, and Tomoki Tozuka for their significant improvements to our work. We also thank Dr. S. Behera and the two reviewers for their helpful comments.
Conflict of interest
The authors declare that the research was conducted in the absence of any commercial or financial relationships that could be construed as a potential conflict of interest.
Publisher's note
All claims expressed in this article are solely those of the authors and do not necessarily represent those of their affiliated organizations, or those of the publisher, the editors and the reviewers. Any product that may be evaluated in this article, or claim that may be made by its manufacturer, is not guaranteed or endorsed by the publisher.
References
Aparna, S. G., McCreary, J. P., Shankar, D., and Vinayachandran, P. N. (2012). Signatures of Indian ocean dipole and El Nino-southern oscillation events in sea level variations in the Bay of Bengal. J. Geophys. Res. Oceans 117, 8055. doi: 10.1029/2012JC008055
Balmaseda, M. A., Trenberth, K. E., and Källén, E. (2013). Distinctive climate signals in reanalysis of global ocean heat content. Geophys. Res. Lett. 40, 1754–1759. doi: 10.1002/grl.50382
Chakravorty, S., Gnanaseelan, C., Chowdary, J. S., and Luo, J.-J. (2014). Relative role of El Nino and IOD forcing on the southern tropical Indian Ocean Rossby waves. J. Geophys. Res. Oceans 119, 9713. doi: 10.1002/2013JC009713
Chambers, D. P., Tapley, B. D., and Stewart, R. H. (1999). Anomalous warming in the Indian Ocean coincident with El Niño. J. Geophys. Res. 104, 3035–3047. doi: 10.1029/1998JC900085
Chirokova, G., and Webster, P. J. (2006). Interannual variability of Indian Ocean heat transport. J. Clim. 19, 1013–1031. doi: 10.1175/JCLI3676.1
Chowdary, J. S., Xie, S.-P., Lee, J.-Y., Kosaka, Y., and Wang, B. (2010). Predictability for summer Northwest Pacific climate in 11 coupled model hindcasts: local and remote forcing. J. Geophys. Res. 115, D22121. doi: 10.1029/2010JD014595
Deepa, J. S., Gnanaseelan, C., Kakatkar, R., Parekh, A., and Chowdary, J. S. (2018). The interannual sea level variability in the Indian Ocean as simulated by an ocean general circulation model. Int. J. Climatol. 38, 1132–1144. doi: 10.1002/joc.5228
Feng, M., Li, Y., and Meyers, G. (2004). Multidecadal variations of Fremantle sea level: footprint of climate variability in the tropical pacific. Geophys. Res. Lett. 31, L16302. doi: 10.1029/2004GL019947
Feng, M., and Meyers, G. (2003). Interannual variability in the tropical Indian ocean: a 2-year time scale of Indian ocean dipole. Deep-Sea Res. II 50, 2263–2284. doi: 10.1016/S0967-0645(03)00056-0
Han, W., and Webster, P. (2002). Forcing mechanisms of sea level interannual variability in the Bay of Bengal. J. Phys. Oceanogr. 32, 216–239. doi: 10.1175/1520-0485(2002)032<0216:FMOSLI>2.0.CO;2
Huang, R. X., and Jin, X. (2002). Sea surface elevation and bottom pressure anomalies due to thermohaline forcing, Part I: isolated perturbations. J. Phys. Oceanogr. 32, 2131–2150. doi: 10.1175/1520-0485(2002)032<2131:SSEABP>2.0.CO;2
Ishii, M., Fukuda, Y., Hirahara, H., Yasui, S., Suzuki, T., and Sato, K. (2017). Accuracy of global upper ocean heat content estimation expected from present observational data sets. Sci. Online Lett. Atmos. 13, 163–167. doi: 10.2151/sola.2017-030
Kosaka, Y., Xie, S.-P., Lau, N.-C., and Vecchi, G. A. (2013). Origin of seasonal predictability for summer climate over the Northwestern Pacific. Proc. Natl. Acad. Sci. U. S. A. 110, 7574–7579. doi: 10.1073/pnas.1215582110
Le Blanc, J.-L., and Boulanger, J.-P. (2001). Propagation and reflection of long equatorial waves in the Indian Ocean from TOPEX/POSEIDON data during the 1993–1998 period. Clim. Dyn. 17, 547–557. doi: 10.1007/s003820000128
Loschnigg, J., Meehl, G. A., Webster, P. J., Arblaster, J. M., and Compo, G. P. (2003). The Asian monsoon, the tropospheric biennial oscillation, and the Indian ocean zonal mode in the NCAR CSM. J. Clim. 16, 1617–1642. doi: 10.1175/1520-0442(2003)016<1617:TAMTTB>2.0.CO;2
Loschnigg, J., and Webster, P. J. (2000). A coupled ocean-atmosphere system of SST modulation for the Indian Ocean. J. Clim. 13, 3342–3360. doi: 10.1175/1520-0442(2000)013<3342:ACOASO>2.0.CO;2
Masumoto, Y., and Meyers, G. (1998). Forced Rossby waves in the southern tropical Indian ocean. J. Geophys. Res. 103, 27589–27602. doi: 10.1029/98JC02546
McPhaden, M. J., and Nagura, M. (2014). Indian ocean dipole interpreted in terms of recharge oscillator theory. Clim. Dyn. 42, 1569–1586. doi: 10.1007/s00382-013-1765-1
Menezes, V. V., and Vianna, M. L. (2019). Quasi-biennial Rossby and Kelvin waves in the south Indian ocean: tropical and subtropical modes and the Indian ocean dipole. Deep-Sea Res. II 166, 43–63. doi: 10.1016/j.dsr2.2019.05.002
Miyama, T., McCreary, J. P., Jensen, T. G., Loschnigg, J., Godfrey, S., and Ishida, A. (2003). Structure and dynamics of the Indian-ocean cross-equatorial cell. Deep-Sea Res. II 50, 2023–2047. doi: 10.1016/S0967-0645(03)00044-4
Mochizuki, T., Chikamoto, Y., Kimoto, M., Ishii, M., Tatebe, H., Komuro, Y., et al. (2012). Decadal prediction using a recent series of MIROC global climate models. J. Meteor. Soc. Jpn. 90, 373–383. doi: 10.2151/jmsj.2012-A22
Mochizuki, T., Ishii, M., Kimoto, M., Chikamoto, Y., Watanabe, M., Nozawa, T., et al. (2010). Pacific decadal oscillation hindcasts relevant to near-term climate prediction. Proc. Natl. Acad. Sci. U. S. A. 107, 1833–1837. doi: 10.1073/pnas.0906531107
Ohba, H., and Ueda, H. (2005). Basin-wide warming in the equatorial Indian ocean associated with El Nino. Sci. Online Lett. Atmos. 1, 89–92. doi: 10.2151/sola.2005-024
Parekh, A., Gnanaseelan, C., Deepa, J. S., Karmakar, A., and Chowdary, J. S. (2017). “Sea level variability and trends in the North Indian Ocean,” in Observed Climate Variability and Change Over the Indian Region. New York, NY: Springer. pp. 181–192. doi: 10.1007/978-981-10-2531-0_11
Périgaud, C., and Delecluse, P. (1992). Annual sea level variations in the southern tropical Indian ocean from geosat and shallow-water simulations. J. Geophys. Res. 97, 20169–20178. doi: 10.1029/92JC01961
Périgaud, C., and Delecluse, P. (1993). Interannual sea level variations in the tropical Indian ocean from geosat and shallow water simulations. J. Phys. Oceanogr. 23, 1916–1934. doi: 10.1175/1520-0485(1993)023<1916:ISLVIT>2.0.CO;2
Potemra, J. T. (2001). Contribution of equatorial pacific winds to southern tropical Indian ocean rossby waves. J. Geophys. Res. 106, 2407–2422. doi: 10.1029/1999JC000031
Qiu, B. (2002). Large-scale variability in the midlatitude subtropical and subpolar north pacific ocean: observations and causes. J. Phys. Oceanogr. 32, 353–375. doi: 10.1175/1520-0485(2002)032<0353:LSVITM>2.0.CO;2
Rao, S. A., Behera, S. K., Masumoto, Y., and Yamagata, T. (2002). Interannual subsurface variability in the tropical Indian ocean with a special emphasis on the Indian ocean dipole. Deep-Sea Res. II 49, 1549–1572. doi: 10.1016/S0967-0645(01)00158-8
Rayner, N. A., Parker, D. E., Horton, E. B., Folland, C. K., Alexander, L. V., Rowell, D. P., et al. (2003). Global analyses of sea surface temperature, sea ice, and night marine air temperature since the late nineteenth century. J. Geophys. Res. 108, 4407. doi: 10.1029/2002JD002670
Saji, N. H. (2018). The Indian ocean dipole. Oxf. Res. Encycl. Clim. Sci. 2018, 619. doi: 10.1093/acrefore/9780190228620.013.619
Schoenefeldt, R., and Schott, F. A. (2006). Decadal variability of the Indian ocean cross-equatorial exchange in SODA. Geophys. Res. Lett. 33, 25891. doi: 10.1029/2006GL025891
Schott, F. A., and McCreary, J. P. (2001). The monsoon circulation of the Indian ocean. Prog. Oceanogr. 51, 1–123. doi: 10.1016/S0079-6611(01)00083-0
Schott, F. A., Xie, S.-P., and McCreary, J. P. (2009). Indian ocean circulation and climate variability. Rev. Geophys. 47, RG1002. doi: 10.1029/2007RG000245
Shi, W., Morrison, J. M., Bohm, E., and Manghnani, V. (2000). The Oman upwelling zone during 1993, 1994, and 1995. Deep-Sea Res. II 47, 1227–1247. doi: 10.1016/S0967-0645(99)00142-3
Sreenivas, P., Gnanaseelan, C., and Prasad, K. V. S. R. (2012). Influence of El Nino and Indian ocean dipole on sea level variability in the Bay of Bengal. Glob. Planet. Change 2012, 80–81. doi: 10.1016/j.gloplacha.2011.11.001
Suresh, I., Vialard, J., Lengaigne, M., Izumo, T., Parvathi, V., and Muraleedharan, P. M. (2018). Sea level interannual variability along the west coast of India. Geophys. Res. Lett. 45, 12440–12448. doi: 10.1029/2018GL080972
Swapna, P., Jyoti, J., Krishnan, R., Sandeep, N., and Griffies, S. M. (2017). Multidecadal weakening of Indian summer monsoon circulation induces an increasing Northern Indian Ocean sea level. Geophys. Res. Lett. 44, 74706. doi: 10.1002/2017GL074706
Takaya, Y., Kosaka, Y., Watanabe, M., and Maeda, M. (2021). Skillful predictions of the Asian summer monsoon 1 year ahead. Nat. Commun. 12, 1–8. doi: 10.1038/s41467-021-22299-6
Tozuka, T., Yokoi, T., and Yamagata, T. (2010). A modeling study of interannual variations of the seychelles dome. J. Geophys. Res. 115, C04005. doi: 10.1029/2009JC005547
Trenary, L., and Han, W. (2012). Intraseasonal to interannual variability of South Indian ocean sea level and thermocline: remote vs. local forcing. J. Phys. Oceanogr. 42, 602–627. doi: 10.1175/JPO-D-11-084.1
Trott, C. B., Subrahmanyam, B., Chaigneau, A., and Roman-Stork, H. L. (2019). Eddy-induced temperature and salinity variability in the Arabian Sea. Geophys. Res. Lett. 46, 81605. doi: 10.1029/2018GL081605
Webster, P. J., and Yang, S. (1992). Monsoon and ENSO: selectively interactive systems. Quart. J. Roy. Meteor. Soc. 118, 877–926.
Woodberry, K. E., Luther, M. E., and Brien, J. J. O. (1989). The wind-driven seasonal circulation in the southern tropical Indian Ocean. J. Geophys. Res. 94, 17985–18002. doi: 10.1029/JC094iC12p17985
Wu, G. X., and Liu, H. (1995). Neighborhood response of rainfall to tropical sea surface temperature anomalies Part I: numerical experiment. Chin. J. Atmos. Sci. 19, 422–434.
Xie, S.-P., Hu, K., Hafner, J., Tokinaga, H., Du, Y., Huang, G., et al. (2009). Indian ocean capacitor effect on indo-western pacific climate during the summer following El Nino. J. Clim. 22, 730–747. doi: 10.1175/2008JCLI2544.1
Yang, J., Liu, Q., Xie, S.-P., Lin, Z., and Wu, L. (2007). Impact of the Indian ocean SST basin mode on the Asian summer monsoon. Geophys. Res. Lett. 34, L02708. doi: 10.1029/2006GL028571
Yu, L., Jin, X., and Weller, R. A. (2007). Annual, seasonal, and interannual variability of air-sea heat fluxes in the Indian Ocean. J. Clim. 20, 3190–3209. doi: 10.1175/JCLI4163.1
Yu, L., and Weller, R. A. (2007). Objectively analyzed air-sea heat fluxes for the global ice-free oceans (1981–2005). Bull. Am. Meteor. Soc. 88, 527–540. doi: 10.1175/BAMS-88-4-527
Yu, W. D., Xiang, B. Q., Liu, L., and Liu, N. (2005). Understanding the origins of interannual thermocline variations in the tropical Indian Ocean. Geophys. Res. Lett. 32, 1–4. doi: 10.1029/2005GL024327
Yuan, D., and Liu, H. (2009). Long-wave dynamics of sea level variations during Indian ocean dipole events. J. Phys. Oceanogr. 39, 1115–1132. doi: 10.1175/2008JPO3900.1
Zhang, X., and Han, W. (2020). Effects of climate modes on interannual variability of upwelling in the tropical Indian ocean. J. Clim. 33, 1547–1573. doi: 10.1175/JCLI-D-19-0386.1
Keywords: sea surface height, Indian summer monsoon, tide gauge, ocean upwelling, coastal winds
Citation: Zhang X and Mochizuki T (2022) Sea surface height fluctuations relevant to Indian summer monsoon over the northwestern Indian Ocean. Front. Clim. 4:1008776. doi: 10.3389/fclim.2022.1008776
Received: 01 August 2022; Accepted: 14 October 2022;
Published: 08 November 2022.
Edited by:
Swadhin Kumar Behera, Japan Agency for Marine-Earth Science and Technology (JAMSTEC), JapanReviewed by:
P. Swapna, Indian Institute of Tropical Meteorology (IITM), IndiaMing Feng, Commonwealth Scientific and Industrial Research Organisation (CSIRO), Australia
Copyright © 2022 Zhang and Mochizuki. This is an open-access article distributed under the terms of the Creative Commons Attribution License (CC BY). The use, distribution or reproduction in other forums is permitted, provided the original author(s) and the copyright owner(s) are credited and that the original publication in this journal is cited, in accordance with accepted academic practice. No use, distribution or reproduction is permitted which does not comply with these terms.
*Correspondence: Takashi Mochizuki, bW9jaGl6dWtpLnRha2FzaGkuODE3QG0ua3l1c2h1LXUuYWMuanA=