 Charuni Pathmeswaran
 Alex Sen Gupta
 Sarah E. Perkins-Kirkpatrick
 Melissa Anne Hart
- 1ARC Centre of Excellence for Climate Extremes, University of New South Wales, Sydney, NSW, Australia
- 2Climate Change Research Centre, University of New South Wales, Sydney, NSW, Australia
- 3School of Science, University of New South Wales, Canberra, ACT, Australia
Despite numerous studies examining terrestrial or marine heatwaves independently, little work has investigated potential associations between these two types of extreme events. Examination of a limited number of past events suggests that certain co-occurring terrestrial and marine heatwaves have common drivers. Co-occurring events may also interact via local land-sea interactions, thereby altering the likelihood of these events. This study explores possible links between adjacent coastal marine and terrestrial heatwaves around Australia using observation and reanalysis data. We find a significant increase in the number of terrestrial heatwave days in the presence of an adjacent co-occurring marine heatwave along the coastal belt of Australia. In most regions, this increase persists at least 150 km inland. This suggests that processes operating beyond the narrow coastal belt are important in most regions. We also show that synoptic conditions driving a terrestrial heatwave in three locations around Australia are conducive for warming the ocean, which would increase the likelihood of a marine heatwave occurring. However, ocean state must also be conducive to reach MHW conditions. Our findings suggest that co-occurring terrestrial and marine heatwaves co-occur more frequently than chance would dictate, and that large scale synoptics may be conducive to both coastal terrestrial and marine heatwaves.
Introduction
Heatwaves are prolonged periods of extreme temperature (Perkins and Alexander, 2013), impacting a wide range of sectors including public health, agriculture, infrastructure and transportation. Thousands of deaths due to heat stress have been attributed to terrestrial heatwaves in Europe in 2003 (Coumou and Rahmstorf, 2012), Russia in 2010 (Russo et al., 2015) and India in 2015 (Ghatak et al., 2017). The Russian agricultural sector experienced a major setback after the 2010 heatwave which resulted in a 30% loss in grain harvest (Barriopedro et al., 2011). A heatwave in southeast Australia in 2009 caused the buckling of railway tracks and the “bleeding” of roads made of bitumen, thus taking a toll on the rail and road transport infrastructure in Melbourne (McEvoy et al., 2012).
Terrestrial heatwaves are usually associated with persistent synoptic conditions often associated with a high pressure system. These high pressure systems result in subsidence in their core, giving rise to adiabatic warming which results in the anomalously high surface air temperatures experienced during a heatwave (Black et al., 2004; Pfahl and Wernli, 2012). They are also associated with few clouds/clear skies which increase incoming shortwave radiation to the surface, and reduced winds which cause reduced evaporative cooling (Miralles et al., 2014; Perkins, 2015) and by surface sensible heating caused by warm air advection (Quinting et al., 2018), all of which result in prolonged hot conditions at the surface.
Heatwaves are not only limited to land but are increasingly being investigated in the marine environment (Lima and Wethey, 2012; Oliver et al., 2018, 2020; Holbrook et al., 2020; Sen Gupta et al., 2020). Although past studies have examined anomalously warm sea surface temperature (SST) events, the term “Marine Heatwave” (MHW) was not coined until Pearce et al. (2011) published their study about the 2010/11 “Ningaloo Nino” event. This event coincided with an extremely strong La Nina event and persisted for over 8 weeks, with SSTs along the West Australian coastline exceeding average conditions by 3–5°C. MHW impacts include widespread mortality of marine organisms, changes in species distribution and reduced carbon sequestration due to high mortality of sea grasses and other habitat forming species (Smale et al., 2019). These impacts can have important socio-economic consequences. Fishing industries were negatively affected during the 2012 north east Pacific warming event, leading to economic instability (Mills et al., 2013; Cavole et al., 2016). Similarly, the 2016 MHW in the Great Barrier Reef resulted in the degradation of the coral reefs (Hughes et al., 2018) which impacted the distribution of coral fisheries (Brown et al., 2021).
Marine heatwaves are generally caused by local processes such as increased atmosphere-ocean heat fluxes and anomalous ocean advection and mixing. These local processes may be influenced by atmospheric (or possibly oceanic) teleconnections (Hobday et al., 2016; Oliver et al., 2017; Holbrook et al., 2020). The 2015/16 Tasman Sea MHW was primarily caused by warm water advection associated with an anomalously strong East Australian Current (Oliver et al., 2017). In contrast, the 2017/18 Tasman Sea MHW was largely caused by air-sea heat fluxes (Perkins-Kirkpatrick et al., 2018), where a strong and persistent high-pressure system reduced cloud cover and weakened the winds, thereby increasing shortwave radiation and reduced evaporative cooling.
Compared to numerous studies that have independently examined terrestrial or marine heatwaves, research on any possible association between the two is emerging, with some regional studies evident. This is important because the ecological impact and economic consequences of these co-occurring heatwaves could be greater than that of an individual event. Ruthrof et al. (2018) showed that a heatwave spanning across both the terrestrial and marine environments in Western Australia caused alteration of species distributions and mortality of some species in both the terrestrial and marine environments. There is also the increased risk of heat stress in coastal areas during co-occurring heatwaves. Potentially strong interactions between very warm and humid air over MHWs that is advected over land could trigger record-breaking heat stress levels, especially in coastal locations (Pal and Eltahir, 2016; Raymond et al., 2020).
Examination of a limited number of past events suggest that co-occurring terrestrial and marine heatwaves may have common drivers (Schlegel et al., 2017; Rodrigues et al., 2019; Salinger et al., 2019). In addition, co-occurring events could interact with each other via local land-sea interactions, thereby altering the characteristics of one or both events. For example, Rodrigues et al. (2019) explored the physical mechanisms governing the terrestrial heatwave and drought in South America in 2013/14 concurrent with the marine heatwave in the South Atlantic. A persistent blocking high pressure system was associated with subsidence, few clouds and clear skies, reduced winds, and warm air advection, resulting in prolonged hot conditions at the surface, leading to a terrestrial heatwave in South America (Mekonnen et al., 2015). At the same time, the persisting high led to an increase in short wave radiation into the ocean and reduced latent heat losses associated with weak winds causing an anomalous increase in SSTs (Rodrigues et al., 2019), resulting in a concurrent marine heatwave.
Interactions between land and ocean can also increase the likelihood of co-occurring local events. In 2003, anomalous SST warming in the Mediterranean Sea occurred as a result of higher rates of air-sea heat flux caused by the atmospheric heatwave over Europe in 2003, in combination with subdued winds, resulting in positive sea surface temperature anomalies (Sparnocchia et al., 2006; Olita et al., 2007; Garrabou et al., 2009). Similarly, Karnauskas (2020) suggested that the terrestrial heatwave that swept through south-eastern Australia and north to the state of Queensland, played a dominant role in the 2015/16 MHW in the Great Barrier Reef, by advecting warm air from the land over the ocean and thereby amplifying and extending the SST anomaly through turbulent heat fluxes.
Although not explicitly analyzed as a co-occurring event, Schlegel et al. (2017) examined atmospheric and oceanic patterns associated with coastal marine heatwaves in southern Africa. They studied the SSTs, surface air temperatures and atmospheric circulation during marine heatwaves near the coast of southern Africa. They found that coastal marine heatwaves were often associated with warm atmospheric temperatures over the subcontinent as well as with onshore and alongshore winds. This study was one of the earlier indicators of the potential association between marine heatwaves and warmer land temperatures, with the possibility of this leading to co-occurring heatwave events. Coastal marine regions are subject to a higher temperature fluctuation due to shallower waters and hence are more sensitive to the short-term and local forcing (Schlegel et al., 2017).
In this study we strive to understand the potential links between co-occurring terrestrial and marine heatwaves in Australia. To our knowledge, previous studies have not explicitly examined co-occurring terrestrial and marine heatwaves in Australia. However, with heatwaves in Australia (Perkins and Alexander, 2013; Perkins, 2015; Jyoteeshkumar reddy et al., 2021) and the surrounding oceans (Oliver et al., 2018) becoming more frequent and lasting longer, there is a growing need to study co-occurring events in this region.
The key objective of this study is to investigate if marine heatwaves increase the frequency of terrestrial heatwaves. In doing so, we also propose a framework to gain a better understanding about co-occurring terrestrial and marine heatwaves. In section Changes in the Probability of THW Days in the Presence of MHW Conditions we investigate if marine heatwaves are associated with an increase in the likelihood of coastal terrestrial heatwaves. In section Difference in Heatwaves Characteristics Between Co-occurring and Stand-Alone THWs we evaluate how heatwave characteristics such as severity and duration may differ between stand-alone and co-occurring heatwaves. In section Composite Analysis we assess the synoptic conditions during stand-alone THW and MHWs in three case study regions and investigate how these conditions may differ from co-occurring events.
Methods
Observations of Atmospheric and Sea Surface Temperature
To identify MHWs and their characteristics we use high resolution (°) daily gridded SST data obtained from the National Oceanic and Atmospheric Administration Optimum Interpolation Sea Surface Temperature (NOAA OISST) V2.0 from the Advanced Very High-Resolution Radiometer satellite (Reynolds et al., 2007) for the time period 1982–2018.
To identify THWs and to examine the atmospheric conditions associated with heatwaves we use the European Center for Medium-Range Weather Forecasts ERA-5 reanalysis from 1982 to 2018, also with a ° spatial resolution (Hersbach et al., 2020). ERA5 combines a large number of historical observations into global estimates using advanced modeling and data assimilation systems. ERA5 provides hourly estimates of atmospheric, land and ocean climate variables, making it a consistent dataset that can be used for heatwave detection as well as composite analyses.
Heatwave Detection and Severity Calculation
To identify THWs in Australia (113–154°E, 10–44°S), we use the Perkins and Alexander (2013) definition by using the daily maximum surface air temperature (SAT) from ERA5. A THW is defined as a period of time during which the daily maximum air temperature exceeds the climatological daily 90th percentile for a minimum of 3 consecutive days.
Using the NOAA OISST data from 1982 to 2018 around Australia (90–180°E, 0–60°S), a MHW is defined as periods during which the daily mean SST exceeds the climatological daily 90th percentile for a minimum of five consecutive days, adapted from Hobday et al. (2016; for consistency with the THW definition, we did not combine MHW that fell below the threshold for <2 days).
Daily climatological mean and 90th percentile values for both THWs and MHWs were calculated based on a 30-year baseline period from 1983 to 2012 following Hobday et al. (2018), based on the first availability of global satellite NOAA OISST dataset. In line with the definitions used by Perkins and Alexander (2013) and Hobday et al. (2016), for each day of the year the 90th percentile was calculated using daily temperature values within an 11-day or 15-day window centered on that day, for marine and THWs, respectively. The use of a moving window provides a more robust estimate of percentile values by providing a larger sample size. Both climatological percentile time series were subsequently smoothed using a 31-day moving window to generate smoothly varying climatologies. The 30-year period between 1983 and 2012 was defined as the baseline.
The 5-day minimum MHW criteria was selected based on a sensitivity study that showed that for durations shorter than 5 days there were more MHWs in the tropics than elsewhere, and for durations longer than 5 days there were fewer than one MHW per year in many regions (Hobday et al., 2016). They showed that 5 days was appropriate for capturing a somewhat uniform number of MHW events globally. The 11 and 15 day windows, similarly follows the standard approaches recommended in the above studies.
Once the heatwaves were detected, the severity of both MHWs and THWs was calculated following the Hobday et al. (2018) MHW categorization scheme (Figure 1). Severity is defined as the ratio between the difference between observed SST and climatology and the difference between 90th percentile threshold and climatology. It is a continuous form of the discrete categorization scheme developed by Hobday et al. (2018).
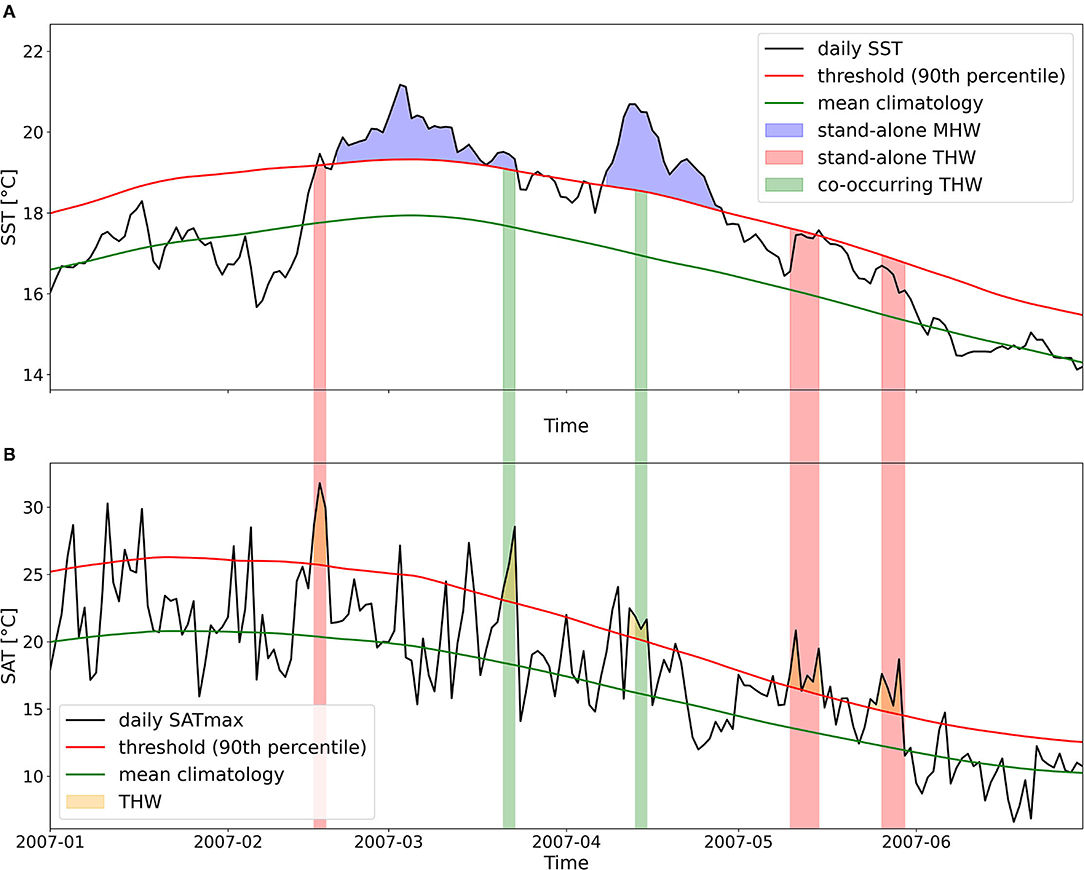
Figure 1. Schematic illustrating stand-alone and co-occurring heatwaves. (A) SST and (B) SAT from (42.12S, 149.9E) and (42S, 148E) respectively. Each MHW is divided into its build-up and decay phases based on the maximum SST of the event. THW may co-occur with the build-up or decay phases of MHW (green bars) or independently of a MHW (red bars).
Changes in the Probability of THWs in the Presence of MHWs
To assess if THWs are more likely to occur in the presence of an adjacent MHW we analyzed the occurrence rates of such events on pairs of coastal and adjacent ocean cells. Our motivation for choosing single adjacent grid cells was to be able to examine how relationships vary as we move inland. We stress that in this analysis we are not examining causality. Stand-alone terrestrial heatwave days were identified when there were no contemporaneous MHW in the adjacent ocean cell. Co-occurring heatwave days were defined as the days in which a terrestrial heatwave is completely encompassed by a marine heatwave (Figure 1). To quantify if terrestrial heatwaves occurred more frequently in the presence of a marine heatwave, the proportion of co-occurring heatwave days relative to stand-alone heatwave days was calculated for each grid cell around the coast of Australia. This value is referred to as the “occurrence ratio” A ratio of 1 would indicate that the number of co-occurring and stand-alone THW days are equal. To test if the proportion is significantly larger than would be expected by chance, a Monte Carlo analysis was performed. For a given grid point, the timeseries of THW days was randomized 10,000 times (simulations), while keeping the contiguous THW days intact (so as to keep the temporal characteristics of the THW time series the same), and the MHW timeseries was left unchanged. To achieve this, for each simulation, the THW series was split at a randomly selected point, and the positions of the two segments were swapped with each other. For each random simulation, the associated occurrence ratio was calculated to generate a probability distribution against which the observed occurrence ratio could be compared. Where the observed ratio was higher than 99% of the randomized simulations, we considered the likelihood of co-occurring THWs to be significantly enhanced.
The analysis was repeated for all coastal grid cells around Australia and their closest marine grid cell.
The ERA5 dataset is a combined dataset, because of which, data over the coast could inadvertently capture data over the ocean. Alternatively, we could have used the ERA5-Land dataset to ensure that the data on the coastal areas is in fact data over land. However, ERA5-Land is produced at higher resolution and forced by ERA5 atmospheric parameters with lapse rate correction but with no additional data assimilation (Muñoz-Sabater et al., 2021). The ERA5 and the NOAA OISST datasets are at 0.25° resolution however there is a 0.125° offset between the two grids. This offset could also result in some coastal cells being contaminated by temperatures from over the ocean. To exclude this possibility, we have calculated the exceedance ratios moving (0.5°, 0.75°, 1.0°, 1.25°, and 1.5°) inland.
Changes in Heatwave Characteristics
In addition to affecting the likelihood of a THW, we might also expect MHWs to influence the characteristics of THWs. To examine this, we calculated the percentage change in mean severity and mean duration of co-occurring (CO) compared to stand-alone (noCO) terrestrial heatwaves at each coastal grid cell (0.5° inland). Statistical significance of the difference between standalone and co-occurring intensities was determined using a Student's t-test. Here, a co-occurring terrestrial heatwave is defined as a THW that is fully encompassed within a MHW. A stand-alone terrestrial heatwave is one that occurs independently of a MHW.
Composite Analysis
To examine whether common synoptic drivers play a role in the generation of co-occurring terrestrial and marine heatwaves, we carried out an event-based composite analysis to determine if there are significant differences between the synoptic conditions during co-occurring and stand-alone terrestrial and marine heatwave events. To do this we calculated the composite means of anomalies of variables that are important in controlling local heating: mean sea level pressure (MSLP), wind speed and direction, downward shortwave radiation (SWR), latent & sensible heat flux (LHF & SHF) and specific humidity, surface moisture from ERA5. The daily anomalies were calculated relative to the 1983–2012 climatological period, in line with the heatwave calculations. As the analysis is specific to THW/MHW at a particular location, we apply this analysis to three case study locations where there have been record-breaking MHWs in the recent past (Feng et al., 2013; Oliver et al., 2017; Karnauskas, 2020): Ningaloo region (23.25°S 113.5°E), Hobart (43°S 148.25°E) and Townsville (19.25°S 147.25°E). These coastal locations are important for economic growth (eg: tourism) and are also close to vulnerable ecosystems such as coral reefs or kelp forests.
After the MHWs were identified, composite means were calculated for the build-up and decay phases of the MHW event. Each MHW was split into two phases on either side of the maximum SSTs (Figure 1). Additionally, for MHW detection, we extend our analysis 2-days on either side of the event (i.e., tstart-2 to tend+2). Inspection of the SST timeseries for MHWs indicates that these shoulder periods are usually associated with strong warming at the start and cooling at the end of the events.
Results
A challenge in understanding the link between THWs and MHWs, is that these events are (by definition) rare, and co-occurring events will be even rarer. When looking at all events pooled across the coastal belt of Australia, we see that THWs and MHWs occurred 2 to 5 times a year at a location (interquartile range, Figure 2D). Co-occurring events are rarer, in many years there will be no such events at a given location (Figure 2D).
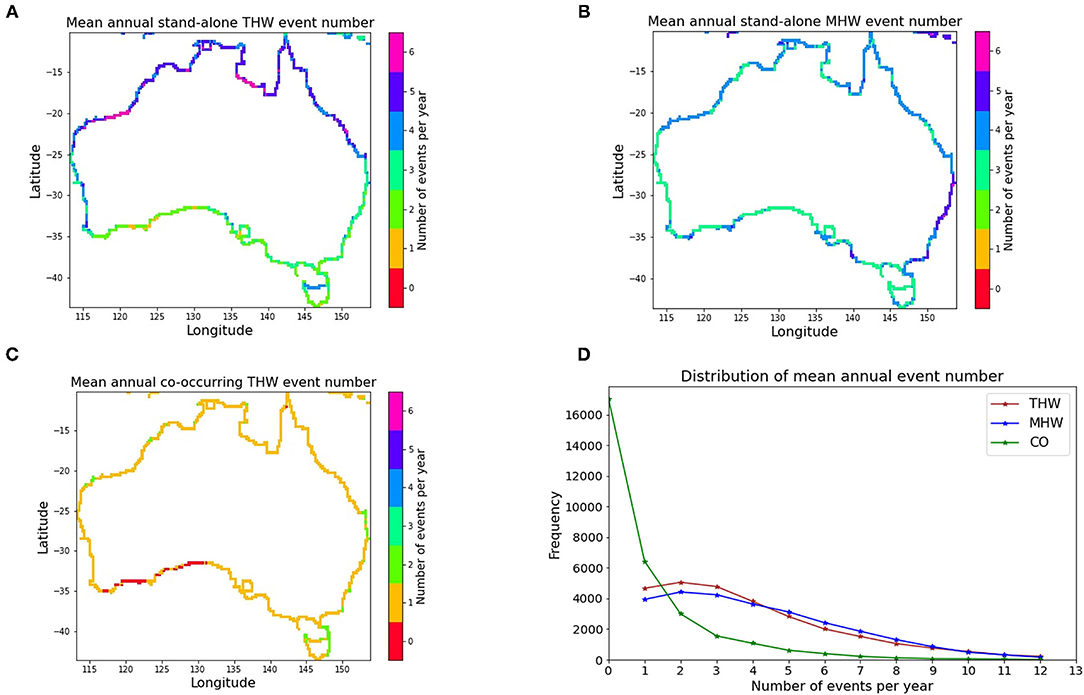
Figure 2. Annual heatwave events averaged for each coastal grid cell for (A) stand-alone THWs, (B) stand-alone MHWs and (C) co-occurring THWs. (D) Frequency distribution of annual mean terrestrial, marine and co-occurring heatwave numbers for all [828] 0.5° grid cells around the coastal belt of Australia from 1982 to 2018.
When looking at the annual event numbers for each grid cell along the coast of Australia, there were on average between 1 and 6 terrestrial heatwaves a year, with a strong latitudinal dependence (Figure 2A). In the northern coastal belt, there were typically more (4–6) THWs than along the south (1–3) each year. On the other hand, we do not see a strong north south difference for MHWs. Because of this, annual number of MHWs (3–4) tend to be lower than THWs north of ~25°S, while along the southern coast, there are more (36) MHWs (Figure 2B) than (1–4) THWs. Co-occurring terrestrial heatwaves occurred on average approximately once every year across most of the coast, however in some coastal grid cells there were years during which there were no such events (Figure 2C). The higher number of THWs along the northern coastal belt is consistent with lower frequency atmospheric variability in the tropics. Indeed, examination of the lagged temporal autocorrelation of various atmospheric variables, demonstrates that Townsville (in northern Australia) is subject to much lower frequency variability than Hobart (southern Australia; Supplementary Figure 7).
When looking at all pooled events across the coastal belt of Australia during the study period of 1982–2018, we see that stand-alone and co-occurring THWs typically last between 3 and 5 days whereas MHWs typically last between 6 and 12 days interquartile range, Figure 3D).
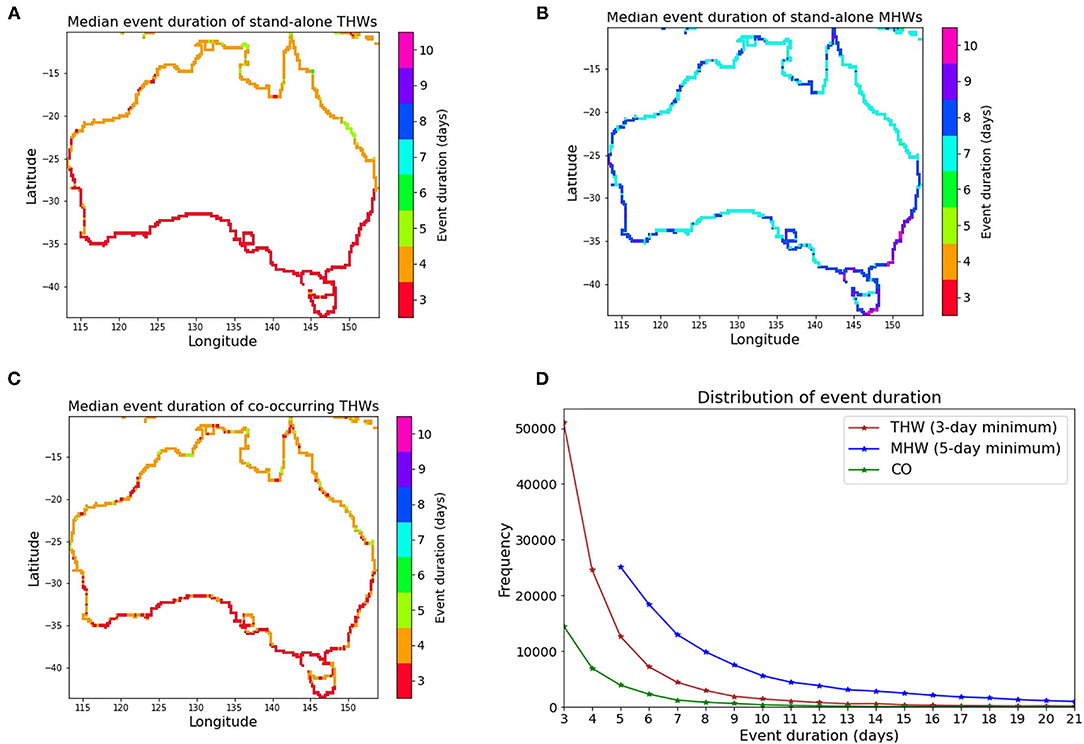
Figure 3. Distribution of median event duration of (A) stand-alone THWs, (B) stand-alone MHWs and (C) co-occurring THWs. (D) Frequency distribution of event duration of terrestrial, marine and co-occurring heatwaves for all 0.5° grid cells around the coastal belt of Australia from 1982 to 2018.
When looking at the median event duration of events for each grid cell along the coast of Australia, most stand-alone terrestrial heatwaves lasted 3–4 days (interquartile range, Figure 3A). There is a clear north-south difference in the duration, with longer THWs found across the north of Australia. Stand-alone MHWs around the coastal belt of Australia typically lasted for 7–8 days on average, with the longer events generally along the SE coast of Australia (Figure 3B). The median duration of co-occurring THWs showed similar latitudinal variation to their stand-alone counterparts. However, there were areas along the southern coast where co-occurring events lasted longer than stand-alone THWs (Figure 3C). This is not particularly surprising, given that this data will be much noisier with the reduced sample size.
As the ocean warms, characteristics of temperature extremes would intensify resulting in an increase in MHWs (Oliver et al., 2018). Similarly, terrestrial heatwaves are increasing in frequency, duration and cumulative heat (Perkins-Kirkpatrick and Lewis, 2020). To examine how heatwaves are changing over time, we calculated the trend in the number of heatwave events per year. Almost all the coastal cells around Australia showed a significant increase in the frequency (i.e., number of discrete THW events per year) of terrestrial heatwaves between 1982–2018. Some areas, such as those near the Great Barrier Reef and in NE Tasmania, showed an increasing trend of 3 annual terrestrial heatwaves per decade (Figure 4A). This means that in those regions there are ~11 more terrestrial heatwaves in a year in 2018 compared to 1982.
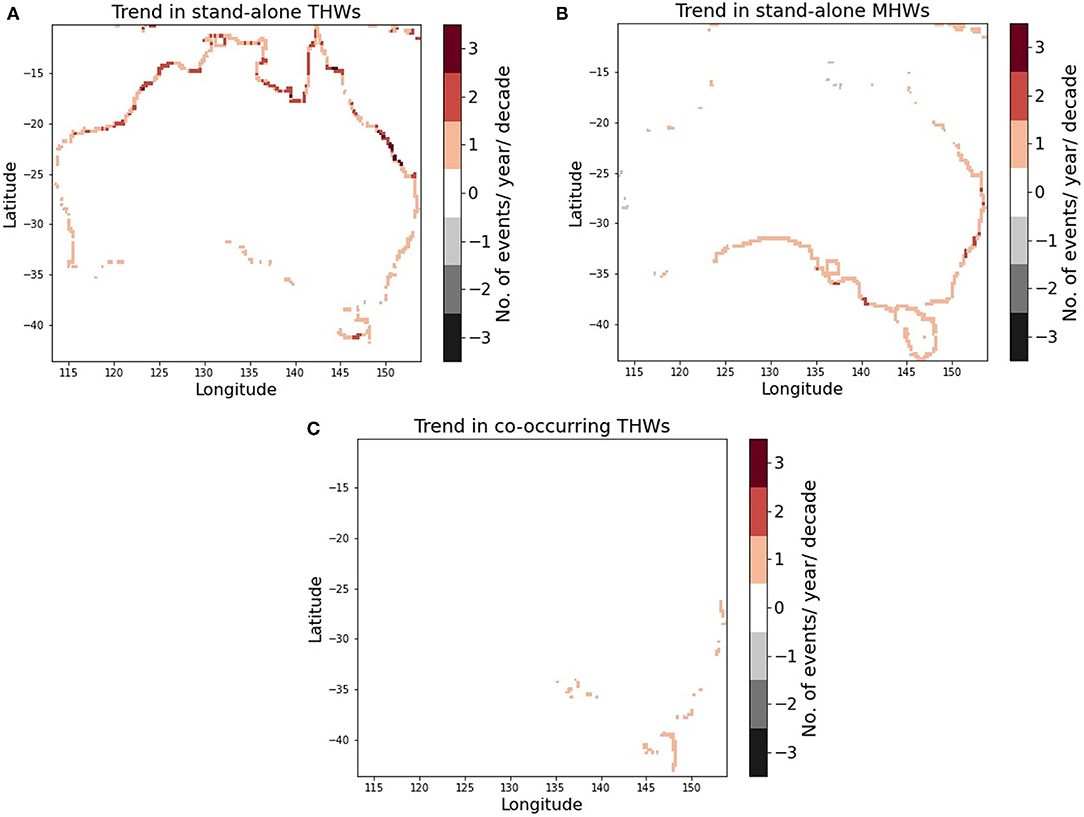
Figure 4. Trend in the number of events per year per decade of (A) terrestrial heatwaves, (B) marine heatwaves and (C) co-occurring events along the coastal belt of Australia. The trends were calculated for pairs of adjacent cells 0.5° inland for all events from 1982 to 2018. Trends are computed by Sen's Kendall slope estimator, which is nonparametric and is robust against outliers and data that is not normally distributed (Sen, 1986). Trends are only shown where they are statistically significant at the 5% level.
Marine heatwaves in approximately half of the coastal cells around Australia show a significant increase in occurrence between 1982 and 2018. Only a few isolated locations show significant but weak negative trends. The largest positive trends are found along the SE coastal belt of the mainland as well as some areas close to the Southern coast (Figure 4B). Trend values of 2 MHW per year per decade indicate that by 2018 there are about seven more discrete marine heatwaves in a year compared to 1982. The positive trends are likely due to increase in background warming. The dominance of long-term warming as opposed to changes in variability was demonstrated by Oliver (2019) for MHWs.
Despite seeing a positive decadal trend in annual THWs and MHWs along large parts of the coastal belt of Australia, only a few coastal cells such as the SE coast and eastern Tasmania show a significant positive trend in co-occurring THWs (Figure 4C). When co-occurring events are concerned, the sample size is much smaller compared to stand-alone events, and there are many years during which there is no overlap between THWs and MHWs (Figure 2D).
Changes in the Probability of THW Days in the Presence of MHW Conditions
To identify any relationship between terrestrial and marine heatwaves, we tested if there was a higher likelihood for coastal terrestrial heatwaves in the presence or absence of adjacent marine heatwaves.
To illustrate the analysis, Figure 5A shows that for a location situated near the Great Barrier Reef (GBR), the occurrence ratio was 0.82. This means that co-occurring THW days occurred 82% of the time compared to stand-alone THW days. Based on our Monte Carlo analysis (Figure 5A), if there were no causal relationship between THW and MHWs, we would expect the occurrence ratio to be between 13 and 34% (i.e., the 1st and 99th percentile range). Therefore, this occurrence ratio is highly unlikely to occur by chance. This suggests that co-occurring events are either influenced by a common driver or are influencing each other through local land-sea interactions.

Figure 5. (A) Occurrence ratio and the associated randomized (Monte Carlo) PDF and 99th percentile of the distribution of co-occurring events at 21.00°S 148.75°E (GBR region). (B) Exceedance ratio (i.e., ratio between occurrence ratio and 99th percentile of Monte Carlo simulations) for all coastal/adjacent ocean cell pairs around Australia. The ratios are calculated for pairs of adjacent cells 0.5° inland, 0.75° inland, 1.0° inland, 1.25° inland, and 1.5° inland.
To provide a measure of the deviation of the observed occurrence ratio from the random distribution, we define an exceedance ratio. This is the ratio between the occurrence ratio and the 99th percentile of the associated randomized Monte Carlo distribution at a given grid cell. An exceedance ratio >1 indicates that the co-occurring events are more likely than chance at the 99th percentile level.
The exceedance ratio exceeds 1 for all coastal cells indicating a significant increase in the likelihood of terrestrial heatwave days in the presence of a marine heatwave (Figure 5B). This effect appears to be strongest off NE parts of Australia, SE Australia, and near the Great Australian Bight (Figure 5B). The exceedance ratio drops off as we move inland off the coast of NE Australia. However, in SE Australia and near the Great Australian Bight, exceedance ratios remain similar as we move inland. When all the coastal points are pooled, the exceedance ratio drops off as we move inland (Supplementary Figure 1). Where there is a rapid drop-off, it would suggest that the THWs are being influenced by the adjacent ocean (or MHWs are being influenced by the adjacent land); where they stay similar it suggests that large scale processes are likely more important.
Difference in Heatwaves Characteristics Between Co-occurring and Stand-Alone THWs
If MHWs act to modify THWs we might expect the severity and duration of co-occurring THWs to change systematically compared to stand alone events. To test this, we examined how these characteristics differ between stand-alone and co-occurring THWs.
By examining the differences in mean severity between co-occurring and stand-alone THWs, we find that there is no overall increase in severity. Most coastal cells do not show a significant change. The limited regions where the difference is statistically significant show an increase in severity (Figure 6A). For event duration, significant changes occur only in certain areas in Western Australia, where the duration of co-occurring events increases by 10–40% compared to stand-alone events (Figure 6B).
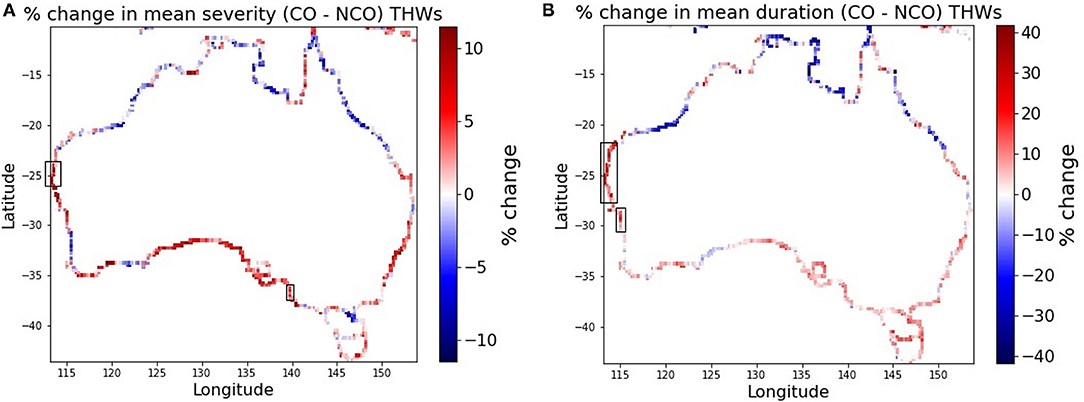
Figure 6. (A) Percentage change in mean severity between co-occurring and stand-alone events (B) Percentage change in mean duration between co-occurring and stand-alone events. Black boxes indicate areas where the changes are significant at a 5% significance level.
Composite Analysis
We have seen that in some areas the exceedance ratio drops off as we move away from the coast. This suggests that the relationship between THWs and MHWs may result, in part, due to local coastal processes. However, we have also seen that across most of coastal Australia, the ratio remains similar as we move inland (at least to a distance of 150 km from the coast), suggesting that large scale processes may be playing a role. This means that co-occurrence may be elevated if certain synoptic conditions favor both types of events. In this section, we examine the synoptic conditions associated with stand-alone and co-occurring events for three selected locations where record-breaking MHWs have occurred in the past.
Townsville
The city of Townsville is on the northeast coast of Queensland adjacent to the Great Barrier Reef. By composting all discrete stand-alone THW events for Townsville, we find that these are typically associated with broad warming across NE Australia, with the strongest warming near the coast next to the Great Barrier Reef. This suggests that stand-alone THWs in Townsville are driven by large-scale synoptic conditions and not purely local processes. The composite shows negative mean sea level pressure anomalies off the SE coast of Australia, which result in strong south-westerly wind anomalies extending across SE Australia and the north-westerly off-shore winds (Figure 7a) causing a reduction in the strength of the mean winds (Supplementary Figure 2F). The absolute surface air temperature is cooler offshore (Supplementary Figure 2C). As such the southwesterlies over land may inhibit the onshore transport of cooler marine air allowing a build-up of heat in this area (Figure 7a). In addition, the anomalous southwesterlies over land move across a region subject to anomalous sensible heating of the atmosphere (Supplementary Figure 2I). This warming of air, as it is advected toward the coast is consistent with mechanisms proposed for terrestrial heatwaves in Brisbane, situated on the coast further to the south (Quinting et al., 2018). Using lagrangian backtracking, Quinting et al. (2018) also demonstrated the importance of adiabatic warming as a result of subsidence of air parcels in generating THWs. Locally we find strong shortwave warming that reaches more than 40 W/m2 around Townsville (Figure 8D). This is mainly partitioned into additional sensible heating from the land to the overlying atmosphere, conducive for the THW.
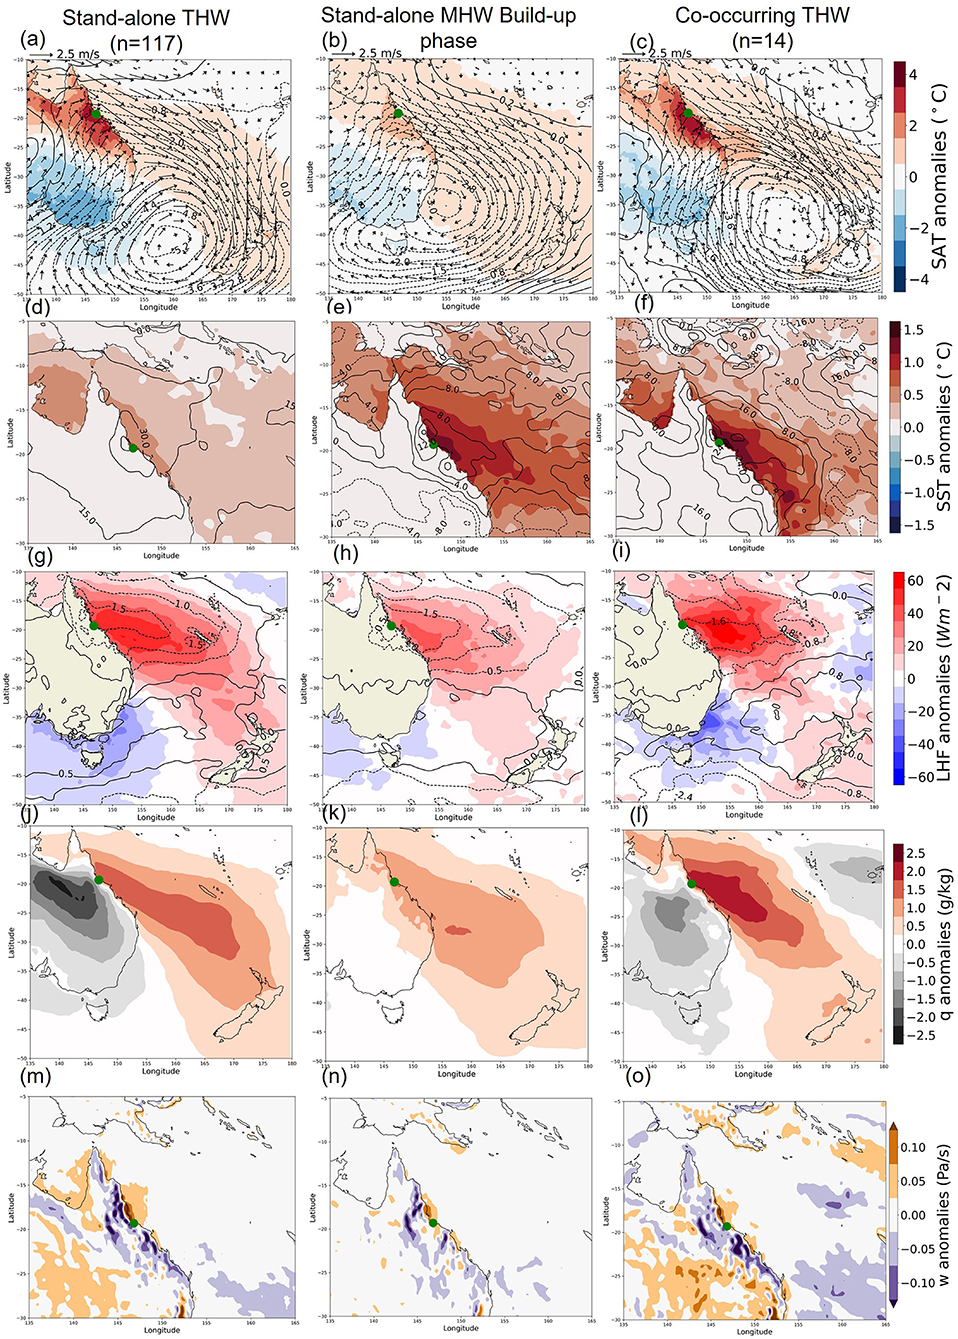
Figure 7. Composite synoptic conditions for stand-alone THWs (left column), stand-alone MHW build-up (center) and co-occurring THW (right column) in Townsville. (a–c) show SAT anomalies (shaded), MSLP anomalies (line contours) and wind vectors. (d–f) show SST anomalies (shaded) and SWR anomalies (line contours). (g–i) show LHF anomalies (shaded) and windspeed anomalies (line contours). (j–l) show specific humidity anomalies. (m–o) show vertical velocity anomalies at 850 hPa. Negative LHF implies a flux of heat from the land/ocean surface to the atmosphere.
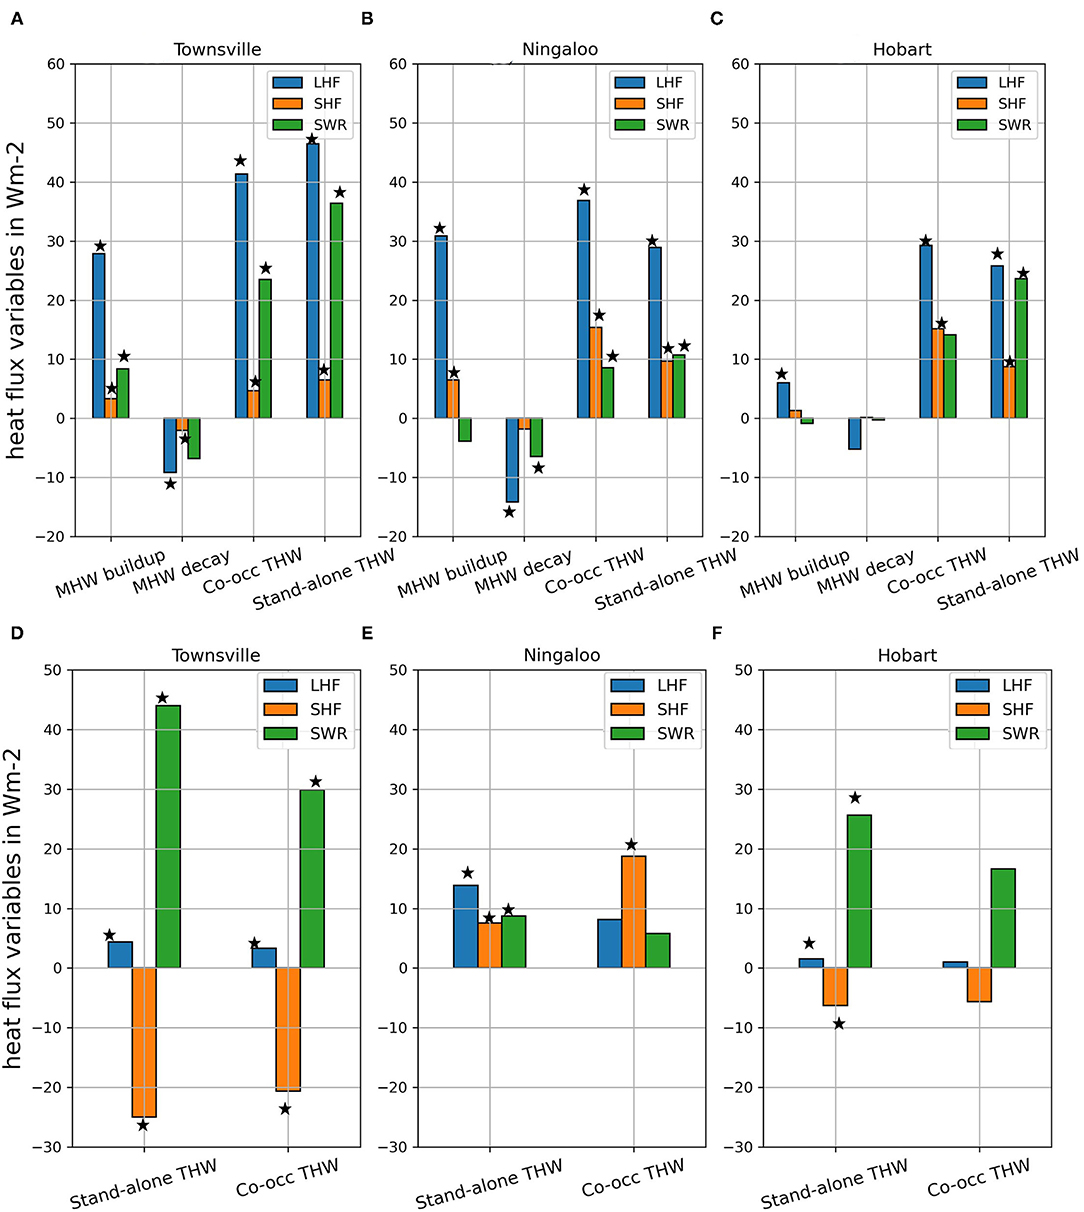
Figure 8. Composite means of latent heat flux, sensible heat flux and shortwave radiation anomalies over ocean points during stand-alone MHW, build-up and decay phases, co-occurring THWs and stand-alone THWs for (A) Townsville, (B) Ningaloo and (C) Hobart; composite means of latent heat flux, sensible heat flux and shortwave radiation anomalies over adjacent land points during stand-alone THW and co-occurring THWs for (D) Townsville, (E) Ningaloo and (F) Hobart. Negative LHF and SHF implies a flux of heat from the land/ocean surface to the atmosphere. Asterisks indicate that the composite mean is significantly different from 0 (p < 0.05) based on a Student t-test.
Interestingly, the synoptic conditions associated with these stand-alone THWs also drive a large latent heat flux over the adjacent ocean (Figure 7g). The surface latent heat flux pattern is congruent with the strong specific humidity (Figure 7j) and negative windspeed anomalies (Figure 7g), two of the primary factors controlling latent heat transfer. This high specific humidity may result from additional moisture being advected from tropical regions (Supplementary Figure 3) by the northerly winds.
To examine the MHWs, which generally build up (and decay) more gradually by the accumulation (or loss) of heat into the ocean mixed layer, we look at composites associated with the build-up and decay phases of the MHW separately. The MHWs in the GBR are associated with strong SST anomalies in the region, with the strongest anomalies close to the NE coast off Queensland (Figure 7e).
The synoptic conditions during the MHW build-up are similar to the stand-alone THW, including qualitatively similar wind (Figures 7a,b) and LHF anomalies (Figures 7g,h). This suggests that similar synoptic conditions are conducive to both types of events. Indeed, the composites of co-occurring THWs in Townsville show similar synoptic conditions to both the stand-alone THWs and MHW build-up phase (Figure 7c). Given the similarity in synoptic conditions, the presence or absence of a MHW may also relate to the state of the ocean heat content, mixed layer depth prior to the MHW onset. A shallower mixed layer, for example, would mean that the same net heat flux would generate a larger surface warming.
During the decay phase of stand-alone MHWs in Townsville, the wind anomalies, shortwave radiation flux (Supplementary Figure 4D) and latent heat flux anomalies are all weak (Supplementary Figure 4G). These weak heat flux anomalies suggest that the synoptic conditions are less consistent across different events, compared to the build-up phases.
Ningaloo Region
The Ningaloo Region is located on the northwest coast of Western Australia, adjacent to the Ningaloo Reef. By composting all stand-alone THW periods for Ningaloo, we find that these are typically associated with broad warming across western Australia, with strongest warming near the NW coast. The composite shows positive mean sea level pressure anomalies off the western coast of Australia, which result in strong easterly to south-easterly winds (Figure 9a). The positive SHF anomaly (i.e., additional heat transfer from the atmosphere to the land surface; Figure 8E), suggests that non-local factors are playing an important role in generating the THW at this location. Given composite surface air temperatures do not increase inland toward the east (Supplementary Figure 2B), and sensible heating anomaly composites across NW Australia are weak (Supplementary Figure 2H), advection of anomalously warm air from the interior does not appear to be important. However, absolute temperatures over the adjacent ocean were typically cooler (average difference 10°C) during the THW events. Therefore, there is the possibility of any onshore movement of cooler maritime air being suppressed by these strong anomalous easterlies blowing offshore (Figure 9a).
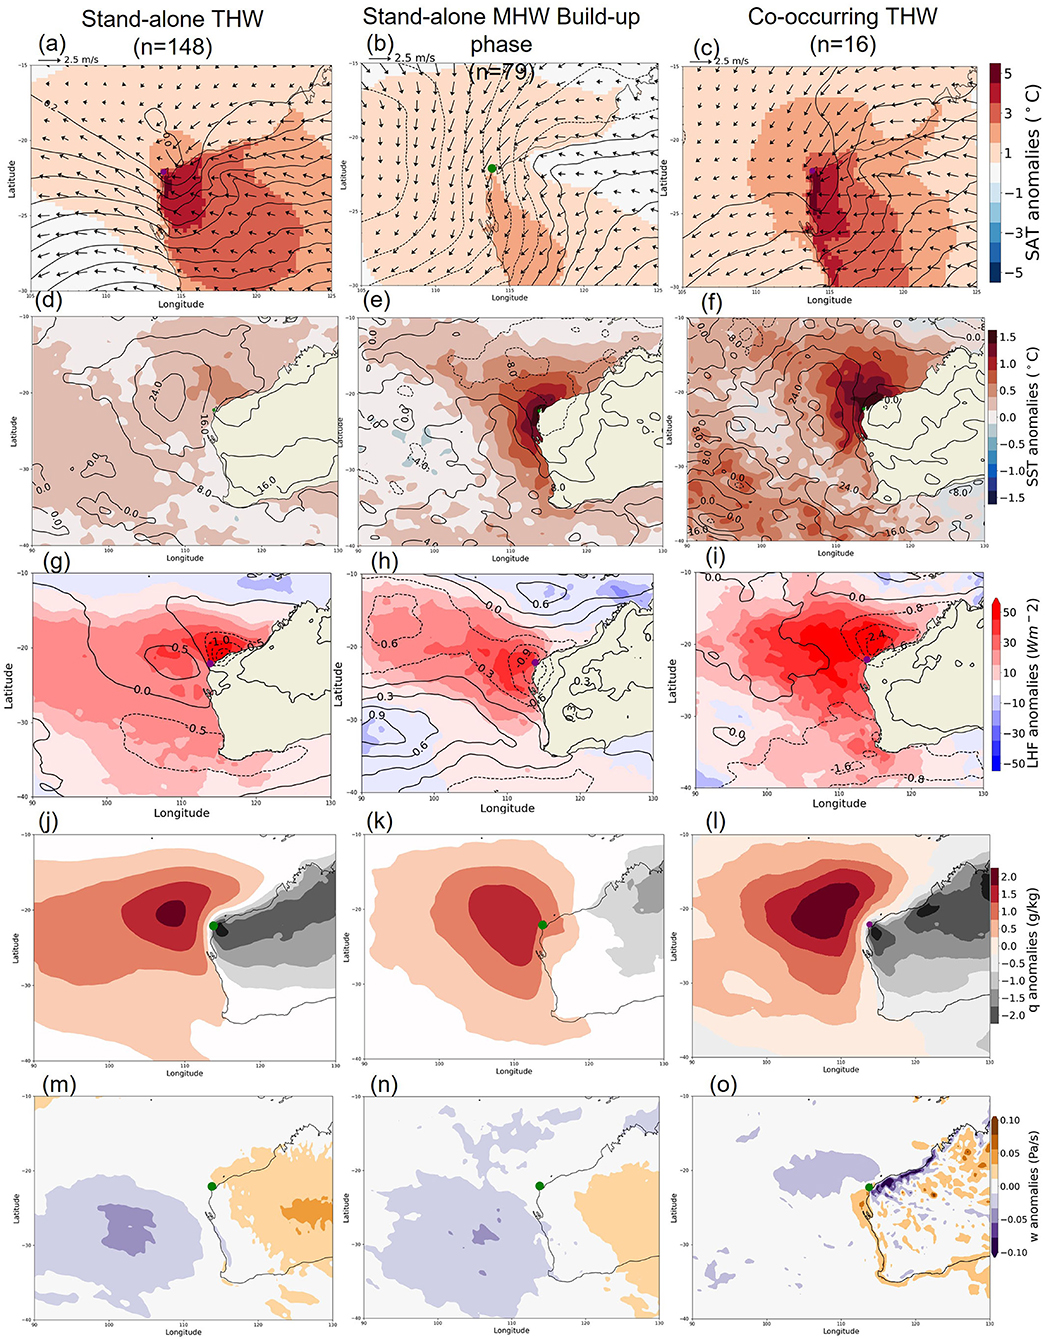
Figure 9. Composite synoptic conditions for stand-alone THWs (left column), stand-alone MHW build-up (center) and co-occurring THW (right column) in Ningaloo. (a–c) show SAT anomalies (shaded), MSLP anomalies (line contours) and wind vectors. (d–f) show SST anomalies (shaded) and SWR anomalies (line contours). (g–i) show LHF anomalies (shaded) and windspeed anomalies (line contours). (j–l) show specific humidity anomalies. (m–o) show vertical velocity anomalies at 850 hPa. Negative LHF implies a flux of heat from the land/ocean surface to the atmosphere.
As with the stand-alone THWs in Townsville, we find a strong latent heat flux into the ocean. For the stand-alone THWs in Ningaloo, this heat flux extends off the north-western coast of Australia (Figure 9g). Again, this strong LHF anomaly signal is associated with an increase in specific humidity (Figure 9j). The northern part of this specific humidity anomaly could be due to the anomalous north easterlies bringing more moisture from the tropics (Supplementary Figure 3), while further south the elevated specific humidity anomaly may be more related to anomalous vertical advection of moisture (Figure 9m). There is also a strong weakening of wind close to the coast to the north of the Ningaloo region (Figure 9g) which is collocated with the largest LHF anomalies.
MHWs in the Ningaloo region are associated with more widespread strong SST anomalies off the NW coast of western Australia, (Figure 9e). During the build-up phase of stand-alone MHWs, the anomalous northerly winds (Figure 9b) would result in widespread wind speed decreases. This could drive anomalous onshore (downwelling favorable) Ekman transport and suppressed vertical mixing, both of which could be playing a role in the build-up of the MHWs. During the 2010/11 Ningaloo Nino event record northerly wind anomalies off the Western Australian coast resulted in an intensification of the Leeuwin current and abnormally high SSTs in the Ningaloo region (Feng et al., 2013). The negative pressure anomalies and associated anomalous northerly winds also help to increase the advection of warm water as part of the Leeuwin current. As in the case of standalone THW, there are strong positive latent heat flux anomalies (Figure 9h), that are collocated with regions of weaker wind speeds, and specific humidity increase (Figure 9k). The latent heat flux is substantially larger than shortwave radiation anomalies during the MHW build-up (Figure 8B). The influence of latent heat flux on the build-up of MHWs at this location is consistent with findings by Kataoka et al. (2014) and Marshall et al. (2015) in relation to the Ningaloo Nino.
Unlike Townsville, the synoptic conditions for standalone MHW and THW are quite different to each other (Figures 9a,b). However, looking at composites for co-occurring events (during MHW build-up; Figure 9c), we find that the anomalous winds are similar to a combination of the stand-alone THWs (easterlies) and MHW build-up (north-easterlies) composites.
While the SWR and LHF anomalies during the decay are significant (Figure 8B), the composites of the synoptic conditions are relatively weak compared to build-up (Supplementary Figure 4B). This suggests that the decay phase is less strongly tied to a particular synoptic system.
Hobart
Hobart is located in southeast Tasmania adjacent to the Tasman Sea. By compositing all stand-alone THW periods for Hobart, we find that these are typically associated with broad warming across an extended area of Tasmania and mainland SE Australia (Figure 10a). This indicates that standalone Hobart THWs are associated with large scale synoptic conditions and not purely local processes.

Figure 10. Composite synoptic conditions for stand-alone THWs (left column), stand-alone MHW build-up (center) and co-occurring THW (right column) in Hobart. (a–c) show SAT anomalies (shaded), MSLP anomalies (line contours) and wind vectors. (d–f) show SST anomalies (shaded) and SWR anomalies (line contours). (g–i) show LHF anomalies (shaded) and windspeed anomalies (line contours). (j–l) show specific humidity anomalies. (m–o) show vertical velocity anomalies at 850 hPa. Negative LHF implies a flux of heat from the land/ocean surface to the atmosphere.
Stand-alone THWs in Hobart are generally associated with strong positive mean sea level pressure anomalies centered to the east of Tasmania and low-pressure anomalies toward the center of the Great Australian Bight (Figure 10a). This results in strong north/north easterly winds that would advect warmer air temperatures from the mainland and from above the warmer waters off eastern Australia (Figure 10a, Supplementary Figure 2D). These results are consistent with Parker et al. (2014), who found that terrestrial heatwaves in SE Australia are generally associated with high-pressure systems over the Tasman Sea, which causes the movement of warm continental air in a northerly flow over the southeast of the mainland, giving rise to extreme temperatures. Locally there is a large increase in shortwave radiation during stand-alone THWs. However, this does not translate to a corresponding increase in sensible warming of the surface air (Figure 8F).
As with the stand-alone THWs in Townsville and Ningaloo, we see that the synoptic conditions associated with these stand-alone THWs also drive a large latent heat flux over the adjacent ocean (Figure 10g). Although latent heat flux is dependent on both surface wind speed and specific humidity, we can see that the winds do not play a large role (Figure 10g). Instead, the surface latent heat flux pattern is congruent with the strong specific humidity (Figure 10j) signal found around Tasmania. This high specific humidity may result from the advection of relatively moist marine air from the east of the mainland by the anomalous northeasterlies. In addition, we find strong ascent (Figure 10m) associated with much of the specific humidity anomaly, suggesting that there is less subsidence of drier air from the upper to the lower levels.
MHWs in the Tasman Sea are associated with strong SST anomalies in the region, with the strongest anomalies close to the eastern coast of Tasmania (Figure 10e). During the build-up phase of stand-alone MHWs, positive MSLP anomalies are found to the southeast of Tasmania. The high pressure system is associated with easterly surface wind anomalies (Figure 10b) along its northern flank that oppose the prevailing winds (Supplementary Figure 2A), resulting in weaker total wind speed. Despite this, latent heat anomalies are weak (compared to stand-alone THW; Figure 10h) as the specific humidity anomalies are small (10k). The weak warming LHF and cooling SW anomalies (Figure 8C) mean that the net heat fluxes into the ocean are small. This suggests that ocean processes, such as reduced vertical mixing due to the reduced winds or southward Ekman transport anomalies, associated with the anomalous easterlies could be contributing to the build-up of the marine event (Sen Gupta et al., 2020).
Unlike in Ningaloo, we can see that the synoptic conditions (Figures 10a,c) and heat fluxes (Figure 8F) are similar between stand-alone and co-occurring THWs in Hobart. This suggests that the co-occurrence of a MHW depends on ocean preconditioning.
During the decay phase of stand-alone MHWs, negative pressure anomalies are located south-west of Tasmania, associated with anomalous north westerly winds (Supplementary Figure 4C) and associated increases in windspeed anomalies. This increases latent heat losses (Supplementary Figure 4I) and may also enhance cooling through vertical mixing.
Discussion
There has been an emerging interest in co-occurring terrestrial and marine heatwaves, with some regional studies that examined THW/MHWs in southern Africa, southwest Atlantic and the Tasman Sea (Schlegel et al., 2017; Rodrigues et al., 2019; Salinger et al., 2019). To our knowledge, there has not been any discussion around co-occurring heatwaves in Australia except for a case study by Karnauskas (2020) who suggests that the 2016 Great Barrier Reef warming event was intensified by a co-occurring terrestrial heatwave. Our study is the first of its kind to investigate the potential link between co-occurring terrestrial and marine heatwaves more broadly around Australia.
If MHWs are amplifying THWs, then we might expect the severity and duration of co-occurring events to be greater than stand-alone events. The majority of the coastal cells did not show a significant change in either metric. However, in some areas in Western Australia, THWs were more severe, and lasted longer, in the presence of a MHW. The significant increase in severity and duration of co-occurring heatwaves in these areas could have compounding impacts on both terrestrial and marine ecosystems such as what was observed during the 2010/11 Ningaloo Nino event (Ruthrof et al., 2018).
Along the coastal belt of Australia, co-occurring THWs occur on average once every year. Despite these events being rare, this study investigated the observational link between co-occurring THWs and MHWs. We found a significant increase in the likelihood of THW days in the presence of MHWs, at all coastal points. In most cases, the influence of MHWs on THW occurrence remained high moving inshore by approximately 150 km. This suggests that large-scale synoptic conditions may act to enhance warming in both the coastal ocean and land.
We examined the large-scale synoptic conditions for three coastal regions around Australia. The stand-alone THWs at the three locations were typically associated with broad warming across land. Sensible heating appeared to play an important role in the formation of THWs in Townsville, similar to what was suggested by Quinting et al. (2018) for the heatwaves in Brisbane. At these locations, the anomalous winds were strongly offshore suggesting that suppressed movement of relatively cool marine air onto the coast may also be important for THWs. In Hobart, the strong north easterly winds appear to advect warmer air temperatures from the mainland and from above the warmer waters off eastern Australia giving rise to THWs at this location.
Interestingly the synoptic conditions associated with stand-alone THWs in all three locations also generated large latent heat fluxes into the adjacent ocean for all three regions, typically larger than the LHFs that persisted during standalone MHW build-up. The synoptic conditions that generate a THW are therefore conducive for warming the ocean. This could help explain the increased likelihood of co-occurring heatwaves.
Given the similarity between the synoptic conditions between stand-alone THWs and co-occurring events at all three locations, the occurrence of a MHW may relate to ocean preconditioning; i.e., even if synoptic conditions conducive for ocean warming are present, the ocean may not warm enough to generate a MHW due to the ocean starting from relatively cold conditions, or the presence of deep mixed layers would mean that any warming occurs more slowly. By examining composites of mixed layer depth and ocean heat content during the week leading up to the events, we found that the mixed layer was shallower (Supplementary Figure 5) in Hobart and ocean heat content was higher in Townsville and Hobart (Supplementary Figure 6) in the lead up to co-occurring events compared to stand-alone THWs. This is consistent with ocean preconditioning being important. We note however that MHWs are by definition periods of higher OHC and surface intensified heating would tend to shoal the mixed layer. As a result, it is difficult to establish whether the ocean conditions during the MHW build up are the cause of the MHW or a response to the processes giving rise to the MHW.
Another possibility is that co-occurring events tend to occur in a different season to stand-alone THW, thereby resulting in different background ocean states. Interestingly, while stand-alone THWs and MHWs are spread through the year, co-occurring events primarily occur between September and December (Supplementary Figure 8). In Hobart, this corresponds to the period of shallowest climatological MLDs, while for Townsville and Ningaloo most co-occurring events occur during the period when climatological MLDs are shoaling (Supplementary Figure 8). Particularly in Hobart this suggests that the shallower MLD at the end of the year facilitates the buildup of MHWs leading to seasonally phase locked co-occurring events.
Our study looked at some of the processes that drive a THW (Figures 7, 9, 10). Stand-alone THWs in Townsville appear to be driven by a combination of local sensible heating of the air, driven by anomalously high SWR that warms the land surface both locally and across much of NE Australia (Figure 8D) combined with advection of warm inland air by the anomalous southwesterlies (Supplementary Figure 2I). No equivalent local sensible heating of the air occurs during the THWs in Ningaloo and Hobart (Figures 8E,F). Previous studies using lagrangian tracking of air parcels have also suggested that adiabatic warming of descending air in the hours and days prior to a THW may play an important role in these events (Quinting and Reeder, 2017; Quinting et al., 2018; Parker et al., 2019). Although the composite analysis of vertical velocity hints at the possibility of these THWs being influenced by the vertical motion of air, other techniques would be needed to determine the relative importance adiabatic warming.
The composite mean LHF anomalies during MHW build-up are significant at all three locations, with additional heat entering the ocean, although relatively weak in Hobart. The lack of large shortwave radiation fluxes and turbulent heat fluxes in Hobart (Figure 8C) suggests that ocean processes including reduced vertical mixing and advection of warm water must be important in this region.
Karnauskas (2020) suggested that the advection of relatively warm continental air over the ocean amplified the 2015/16 warming in the Great Barrier Reef. For co-occurring heatwaves, we find enhanced offshore wind anomalies that advect relatively warm air from the land to over the ocean. Furthermore, while small compared to LHF and SWR, SHF is significantly increased at all locations (Figures 8A–C), consistent with this mechanism.
In this study, we show for the first time that the likelihood of coastal THWs in Australia increases in the presence of adjacent MHWs. We also show that at least for the three regions examined, synoptic conditions that generate a THW are also conducive for ocean warming with enhanced LHF and to a lesser extent SW into the ocean.
With MHWs (Oliver et al., 2018) and THWs (Jyoteeshkumar reddy et al., 2021) projected to increase in frequency and duration in the future, this would mean a higher chance of overlap between the two events. Therefore, we speculate that these co-occurring heatwaves may not be as rare in the future as they are at present.
Conclusion
The main aim of this study was to understand if there is any causal link between co-occurring terrestrial and marine heatwaves. Using observation and reanalysis data, we identified co-occurring terrestrial and marine heatwaves for pairs of coastal and adjacent ocean grid cells along the Australian coastal belt.
In summary, we found a significant increase in the number of terrestrial heatwave days in the presence of a co-occurring marine heatwave along the coastal belt of Australia. In most regions this increase persisted at least 150 km inland. This suggests that processes operating beyond the narrow coastal belt are important in most regions, possibly large scale atmospheric synoptic systems that facilitate both land and ocean warming. Potential interaction between terrestrial and marine heatwaves may still be important and could be tested in atmosphere-land model experiments, by imposing MHW SST anomalies in coastal regions and seeing how this influences land temperatures.
Our results also show that synoptic conditions associated with terrestrial heatwaves in three locations around Australia, are conducive for warming the ocean, via reduced ocean latent heat losses, which would increase the likelihood of marine heatwaves. Common drivers were also demonstrated by Rodrigues et al. (2019) during a co-occurring event in the southwest Atlantic. They show that the 2013/14 co-occurring terrestrial heatwave in South America and MHW in the adjacent South Atlantic was caused by persistent anticyclonic conditions. Their study quantified local processes contributing to MHW generation by calculating the heat budget of the ocean mixed layer. Although our results suggest possible drivers of co-occurring heatwaves, a more formal heat budget analysis would be required to make a more quantitative attribution. As we are focussing on both terrestrial and marine heatwaves, we would also have to consider how best to quantify the processes that contribute to a THW. While we have considered factors like warm air advection and sensible heating of the air, processes like adiabatic warming of air parcels are known to be major contributors to terrestrial heatwaves in Australia (Quinting and Reeder, 2017; Quinting et al., 2018). The non-local descent of air means that methods like lagrangian backtracking are needed to quantify this process. THWs are also sensitive to land surface conditions, in particular surface moisture and the partitioning of incoming shortwave radiation into sensible and latent heat fluxes (Mueller and Seneviratne, 2012).
Our findings suggest that co-occurring terrestrial and marine heatwaves are linked, in places related to synoptic conditions that are conducive to both land and ocean warming. Interestingly we found that THWs and co-occurring events are often associated with similar synoptic conditions. Whether a MHW develops or not appears to be related to the prior ocean state. In particular, co-occurring MHWs only tend to form at times of year when the mixed layer is relatively shallow. Further analysis is required to determine what drives such events more broadly. While the focus of this study was Australia, it would be of interest to expand out to assess co-occurring heatwaves in different parts of the world. The combination of high heat and humidity in areas such as the Persian Gulf is expected to trigger record-breaking heat stress levels in the future (Schär, 2016). This could be exacerbated due to co-occurring heatwaves in the coastal areas and hence would be useful to extend this analysis in this region. Similarly, other compound events such as MHWs and extreme rainfall or heat stress over coastal regions are a possibility, and a similar analysis could be carried out to understand such events.
Data Availability Statement
Publicly available datasets were analyzed in this study. This data can be found here: https://psl.noaa.gov/data/gridded/data.noaa.oisst.v2.highres.html and https://www.ecmwf.int/en/forecasts/datasets/reanalysis-datasets/era5.
Author Contributions
CP, AG, SP-K, and MH conceived of the presented idea. CP analyzed the data and wrote the manuscript with support from AG, SP-K, and MH. All authors contributed to the article and approved the submitted version.
Funding
CP is supported by Australian Research Council grant number (FT170100106). SP-K is supported by Australian Research Council grant numbers (FT170100106 and CE170100023). MH is supported by the Australian Research Council grant number (CE170100023).
Conflict of Interest
The authors declare that the research was conducted in the absence of any commercial or financial relationships that could be construed as a potential conflict of interest.
Publisher's Note
All claims expressed in this article are solely those of the authors and do not necessarily represent those of their affiliated organizations, or those of the publisher, the editors and the reviewers. Any product that may be evaluated in this article, or claim that may be made by its manufacturer, is not guaranteed or endorsed by the publisher.
Supplementary Material
The Supplementary Material for this article can be found online at: https://www.frontiersin.org/articles/10.3389/fclim.2022.792730/full#supplementary-material
References
Barriopedro, D., Fischer, E. M., Luterbacher, J., Trigo, R. M., and García-Herrera, R. (2011). The hot summer of 2010: redrawing the temperature record map of Europe. Science 332, 220–224. doi: 10.1126/science.1201224
Black, E., Blackburn, M., Harrison, G., Hoskins, B., and Methven, J. (2004). Factors contributing to the summer 2003 European heatwave. Weather 59, 217–223. doi: 10.1256/wea.74.04
Brown, C. J., Mellin, C., Edgar, G. J., Campbell, M. D., and Stuart-Smith, R. D. (2021). Direct and indirect effects of heatwaves on a coral reef fishery. Glob. Change Biol. 27, 1214–1225. doi: 10.1111/gcb.15472
Cavole, L. M., Demko, A. M., Diner, R. E., Giddings, A., Koester, I., Pagniello, C. M. L. S., et al. (2016). Biological impacts of the 2013–2015 warm-water anomaly in the northeast Pacific: Winners, Losers, and the Future. Oceanography. 29, 273–285. doi: 10.5670/oceanog.2016.32
Coumou, D., and Rahmstorf, S. (2012). A decade of weather extremes. Nat. Clim. Change. 2, 491–496. doi: 10.1038/nclimate1452
Feng, M., McPhaden, M. J., Xie, S. P., and Hafner, J. (2013). La Niña forces unprecedented Leeuwin Current warming in 2011. Sci. Rep. 3, 1–9. doi: 10.1038/srep01277
Garrabou, J., Coma, R., Bensoussan, N., Bally, M., Chevaldonn,é, P., Cigliano, M., et al. (2009). Mass mortality in Northwestern Mediterranean rocky benthic communities: Effects of the 2003 heat wave. Glob. Change Biol. 15, 1090–1103. doi: 10.1111/j.1365-2486.2008.01823.x
Ghatak, D., Zaitchik, B., Hain, C., and Anderson, M. (2017). The role of local heating in the 2015 Indian Heat Wave. Sci. Rep. 1–8. doi: 10.1038/s41598-017-07956-5
Hersbach, H., Bell, B., Berrisford, P., Hirahara, S., Horányi, A., Muñoz-Sabater, J., et al. (2020). The ERA5 global reanalysis. Q J R Meteorol Soc. 146, 1999–2049. doi: 10.1002/qj.3803
Hobday, A., Sen Gupta, A., Burrows, M., Wernberg, T., Oliver, E., Thomsen, M., et al. (2018). Categorizing and naming marine heatwaves. Oceanography 31, 162–173. doi: 10.5670/oceanog.2018.205
Hobday, A. J., Alexander, L. V., Perkins, S. E., Smale, D. A., Straub, S. C., Oliver, E. C. J., et al. (2016). A hierarchical approach to defining marine heatwaves. Prog. Oceanogr. 141, 227–238. doi: 10.1016/j.pocean.2015.12.014
Holbrook, N. J., Sen Gupta, A., Oliver, E. C. J., Hobday, A. J., Benthuysen, J. A., Scannell, H. A., et al. (2020). Keeping pace with marine heatwaves. Nat. Rev. Earth Environ. 1, 482–493. doi: 10.1038/s43017-020-0068-4
Hughes, T. P., Kerry, J. T., Baird, A. H., Connolly, S. R., Dietzel, A., Eakin, C. M., et al. (2018). Global warming transforms coral reef assemblages. Nature. 556, 492–496. doi: 10.1038/s41586-018-0041-2
Jyoteeshkumar reddy, P., Perkins-Kirkpatrick, S. E., and Sharples, J. J. (2021). Intensifying Australian heatwave trends and their sensitivity to observational data. Earth's Fut. 9, 1–18. doi: 10.1029/2020EF001924
Karnauskas, K. B. (2020). Physical diagnosis of the 2016 great barrier reef bleaching event. Geophys. Res. Lett. 47. doi: 10.1029/2019GL086177
Kataoka, T., Tozuka, T., Behera, S., and Yamagata, T. (2014). On the Ningaloo Niño/Niña. Clim. Dyn.43(5–6), 1463–1482. doi: 10.1007/s00382-013-1961-z
Lima, F. P., and Wethey, D. S. (2012). Three decades of high-resolution coastal sea surface temperatures reveal more than warming. Nat. Commun. 3. doi: 10.1038/ncomms1713
Marshall, A. G., Hendon, H. H., Feng, M., and Schiller, A. (2015). Initiation and amplification of the Ningaloo Niño. Clim. Dyn. 45, 2367–2385. doi: 10.1007/s00382-015-2477-5
McEvoy, D., Ahmed, I., and Mullett, J. (2012). The impact of the 2009 heat wave on Melbourne's critical infrastructure. Local Environ. 17, 783–796. doi: 10.1080/13549839.2012.678320
Mekonnen, A., Renwick, J. A., and Sánchez-Lugo, A. (2015). Regional climates in Blunden, Jessica, and Derek S. Arndt. ‘State of the Climate in 2014'. Bull. Am. Meteorol. Soc. 96, ES1–32. doi: 10.1175/2015BAMSStateoftheClimate.1
Mills, K. E., Pershing, A. J., Brown, C. J., Chen, Y., Chiang, F. S., Holland, D. S., et al. (2013). Fisheries management in a changing climate: Lessons from the 2012 ocean heat wave in the Northwest Atlantic. Oceanography. 26. doi: 10.5670/oceanog.2013.27
Miralles, D. G., Teuling, A. J., Van Heerwaarden, C. C., and De Arellano, J. V. G. (2014). Mega-heatwave temperatures due to combined soil desiccation and atmospheric heat accumulation. Nat. Geosci. 7, 345–349. doi: 10.1038/ngeo2141
Mueller, B., and Seneviratne, S. I. (2012). Hot days induced by precipitation deficits at the global scale. Proc. Natl. Acad. Sci. U.S.A. 109, 12398–12403. doi: 10.1073/pnas.1204330109
Muñoz-Sabater, J., Dutra, E., Agustí-Panareda, A., Albergel, C., Arduini, G., Balsamo, G., et al. (2021). ERA5-Land: A state-of-the-art global reanalysis dataset for land applications. Earth Syst. Sci. 1–50. doi: 10.5194/essd-13-4349-2021
Olita, A., Sorgente, R., Natale, S., Gaberšek, S., Ribotti, A., Bonanno, A., et al. (2007). Effects of the 2003 European heatwave on the Central Mediterranean Sea: Surface fluxes and the dynamical response. Ocean Sci. 3, 273–289. doi: 10.5194/os-3-273-2007
Oliver, E. C. J. (2019). Mean warming not variability drives marine heatwave trends. Clim. Dyn. 53, 1653–1659. doi: 10.1007/s00382-019-04707-2
Oliver, E. C. J., Benthuysen, J. A., Bindoff, N. L., Hobday, A. J., Holbrook, N. J., Mundy, C. N., et al. (2017). The unprecedented 2015/16 Tasman Sea marine heatwave. Nat. Commun. 8, 1–12. doi: 10.1038/ncomms16101
Oliver, E. C. J., Benthuysen, J. A., Darmaraki, S., Donat, M. G., Hobday, A. J., Holbrook, N. J., et al. (2020). Marine Heatwaves. Ann. Rev. Mar. Sci. 13. doi: 10.1146/annurev-marine-032720-095144
Oliver, E. C. J., Donat, M. G., Burrows, M. T., Moore, P. J., Smale, D. A., Alexander, L. V., et al. (2018). Longer and more frequent marine heatwaves over the past century. Nat. Commun. 9, 1–12. doi: 10.1038/s41467-018-03732-9
Pal, J. S., and Eltahir, E. A. B. (2016). Future temperature in southwest Asia projected to exceed a threshold for human adaptability. Nat. Clim. Change. 6, 197–200. doi: 10.1038/nclimate2833
Parker, T., Quinting, J., and Reeder, M. (2019). The Synoptic-Dynamics of Summertime Heat Waves in the Sydney Area. Australia. p. 1–15. doi: 10.1071/ES19004
Parker, T. J., Berry, G. J., and Reeder, M. J. (2014). The structure and evolution of heat waves in Southeastern Australia. J Climate. 27, 5768–5785. doi: 10.1175/JCLI-D-13-00740.1
Pearce, A., Lenanton, R., Jackson, G., Moore, J., Feng, M., and Gaughan, D. (2011). The “marine heat wave” off Western Australia during the summer of 2010/11. In Fisheries Research (Issue 222).
Perkins, S. E. (2015). A review on the scientific understanding of heatwaves-Their measurement, driving mechanisms, and changes at the global scale. Atmos. Res. 164–165, 242–267. doi: 10.1016/j.atmosres.2015.05.014
Perkins, S. E., and Alexander, L. V. (2013). On the measurement of heat waves. J Climate. 26, 4500–4517. doi: 10.1175/JCLI-D-12-00383.1
Perkins-Kirkpatrick, S. E., King, A. D., Cougnon, E. A., Grose, M. R., Oliver, E. C. J., Holbrook, N. J., et al. (2018). The role of natural variability and anthropogenic climate change in the 2017/18 tasman sea marine heatwave. Bull. Amer. Meteor. Soc. 100, S105–S110. doi: 10.1175/BAMS-D-18-0116.1
Perkins-Kirkpatrick, S. E., and Lewis, S. C. (2020). Increasing trends in regional heatwaves. Nat. Commun. 1–8. doi: 10.1038/s41467-020-16970-7
Pfahl, S., and Wernli, H. (2012). Quantifying the relevance of atmospheric blocking for co-located temperature extremes in the Northern Hemisphere on (sub-)daily time scales. Geophys. Res. Lett. 39, L12807. doi: 10.1029/2012GL052261
Quinting, J., ulian, F., and Reeder, M. J. (2017). Southeastern Australian heat waves from a trajectory viewpoint. Monthly Weather Rev. 145, 4109–4125. doi: 10.1175/MWR-D-17-0165.1
Quinting, J. F., Parker, T. J., and Reeder, M. J. (2018). Two synoptic routes to subtropical heat waves as illustrated in the brisbane region of Australia. Geophys. Res. Lett. 45, 10,700-10,708. doi: 10.1029/2018GL079261
Raymond, C., Matthews, T., and Horton, R. M. (2020). The emergence of heat and humidity too severe for human tolerance. Sci. Adv. 6. doi: 10.1126/sciadv.aaw1838
Reynolds, R. W., Smith, T. M., Liu, C., Chelton, D. B., Casey, K. S., and Schlax, M. G. (2007). Daily high-resolution-blended analyses for sea surface temperature. J Climate. 20, 5473–5496. doi: 10.1175/2007JCLI1824.1
Rodrigues, R. R., Andrea, S., Taschetto, G., Sen, A., and Foltz, G. R. (2019). Common cause for severe droughts in South America and marine heatwaves in the South Atlantic. Nature Geoscience. 12, 620–626. doi: 10.1038/s41561-019-0393-8
Russo, S., Sillmann, J., and Fischer, E. M. (2015). Top ten European heatwaves since 1950 and their occur- rence in the future. Environ. Res. Lett. 10, 124003. doi: 10.1088/1748-9326/10/12/124003
Ruthrof, K. X., Breshears, D. D., Fontaine, J. B., Froend, R. H., Matusick, G., Kala, J., et al. (2018). Subcontinental heat wave triggers terrestrial and marine, multi-taxa responses. Sci. Rep. 8, 1–9. doi: 10.1038/s41598-018-31236-5
Salinger, M. J., Renwick, J., Behrens, E., Mullan, A. B., Diamond, H. J., Sirguey, P., et al. (2019). The unprecedented coupled ocean-atmosphere summer heatwave in the New Zealand region 2017/18: Drivers, mechanisms and impacts. Environ. Res. Lett. 14. doi: 10.1088/1748-9326/ab012a
Schär, C. (2016). Climate extremes: the worst heat waves to come. Nat. Clim. Change. 6, 128–129. doi: 10.1038/nclimate2864
Schlegel, R. W., Oliver, E. C. J., Wernberg, T., and Smit, A. J. (2017). Nearshore and offshore co-occurrence of marine heatwaves and cold-spells. Prog. Oceanography. 151, 189–205. doi: 10.1016/j.pocean.2017.01.004
Sen Gupta, A., Thomsen, M., Benthuysen, J. A., Hobday, A. J., Oliver, E., Alexander, L. V., et al. (2020). Drivers and impacts of the most extreme marine heatwaves events. Sci. Rep. 1–15. doi: 10.1038/s41598-020-75445-3
Sen, P. (1986). Estimated of the regression coefficient based on Kendall's Tau. J. Am. Stat. Assoc. 39, 1379–1389. doi: 10.1080/01621459.1968.10480934
Smale, D. A., Wernberg, T., Oliver, E. C. J., Thomsen, M., Harvey, B. P., Straub, S. C., et al. (2019). Marine heatwaves threaten global biodiversity and the provision of ecosystem services. Nat. Clim. Change. 9, 306–312. doi: 10.1038/s41558-019-0412-1
Keywords: marine heatwaves, terrestrial heatwaves, compound events, temperature extremes, Australia
Citation: Pathmeswaran C, Sen Gupta A, Perkins-Kirkpatrick SE and Hart MA (2022) Exploring Potential Links Between Co-occurring Coastal Terrestrial and Marine Heatwaves in Australia. Front. Clim. 4:792730. doi: 10.3389/fclim.2022.792730
Received: 11 October 2021; Accepted: 17 February 2022;
Published: 16 March 2022.
Edited by:
Brian Silliman, Duke University, United StatesReviewed by:
Kevin Grise, University of Virginia, United StatesTomomichi Ogata, Japan Agency for Marine-Earth Science and Technology (JAMSTEC), Japan
Copyright © 2022 Pathmeswaran, Sen Gupta, Perkins-Kirkpatrick and Hart. This is an open-access article distributed under the terms of the Creative Commons Attribution License (CC BY). The use, distribution or reproduction in other forums is permitted, provided the original author(s) and the copyright owner(s) are credited and that the original publication in this journal is cited, in accordance with accepted academic practice. No use, distribution or reproduction is permitted which does not comply with these terms.
*Correspondence: Charuni Pathmeswaran, Yy5wYXRobWVzd2FyYW5AdW5zdy5lZHUuYXU=