 Ting Lei
 Chenxi Jin
 Chen Qi
- Beijing Meteorological Service Center, Beijing, China
The growing demand for air transportation has led to increased air traffic and airline operations at airports worldwide, while hazardous weather conditions have a considerable impact on the efficiency and safety of air traffic. The long-term and high-resolution state-of-art fifth-generation reanalysis of the European Center for Medium-Range Weather Forecasts (ECMWF) (ERA5) and ERA5-land provide us a perspective on the climatological characteristics of hazardous weather conditions affecting Chinese airports. These hazardous weather conditions include low-level wind shear (LLWS), limited visibility (LIMV), thunderstorms (TSTMs), and snowfall (SNOW). The LLWS is frequent in winter but rare in summer. At the airports in the north of eastern China, managers should take more precautions about LLWS from February to March and October to November. LIMV is major hazardous weather in the south of eastern China that should be carefully monitored in winter, especially from December to January. In northwestern China, LIMV is rare, especially at Yinchuan and Lanzhou airports. TSTMs frequently occur in South China and Southwest China, especially in Yunnan, Guangxi, Guangdong, and eastern Tibet. The corresponding active period is summer. SNOW frequently occurs over the Tibet Plateau and parts of Xinjiang province. SNOW is generally active in early winter (December–January) at Urumchi airport but at Lhasa airport in late winter (February–March). There is no SNOW throughout the year in the south of eastern China. The observations also verify such characteristics of the annual cycles of the four hazardous weather conditions. The trend analysis does not express many warnings on hazardous weather conditions except the SNOW. The SNOW at Lhasa airport shows an increasing trend. Considering the frequent SNOW in Lhasa, more attention should be put to monitoring this weather here.
Introduction
With the rapid development of the civil aviation industry, flight density has increased rapidly in recent years. Thus, flight punctuality and safety issues have received increased attention. Generally, adverse weather conditions have substantial impacts on air traffic (Evans, 2001; Markovic et al., 2008; Gerz et al., 2012; Borsky and Unterberger, 2019). In the United States, approximately 65% of the delays operated by domestic airlines are attributed to adverse weather (Evans, 1997). Hazardous weather conditions can cause flight delays or cancelations, resulting in substantial direct or indirect economic losses (Chen et al., 2018; Federal Aviation Administration., 2018), which are responsible for about 70%−80% of passenger delays and hundreds of millions of dollars in lost revenue per year for airlines (Rosenberger et al., 2002; Lan et al., 2006). The direct costs of delays include additional fuel consumption, additional crew, and capital, ranging from US $61 to US $80 per delayed minute in the United States (Lee and Yan, 2019). The airlines' delay direct cost in China is more than ¥2 billion per year (Li et al., 2007). The indirect cost is probably produced by aircraft depreciation and additional labor expenses (Britto et al., 2012). The total indirect impact of flight delays on China was ¥350.71 billion in 2013 (Chen et al., 2018).
Unexpected extreme weather events could even cause aircraft failures and accidents (Caracena et al., 1986; International Civil Aviation Organization., 2005; Zhang, 2006, 2019). Hazardous weather elements in aviation can be divided into elements en route and at the terminal (Zhou et al., 2016). Weather elements en route refer to weather factors that have harmful effects on aircraft during cruise flight, while those at the terminal significantly impact the take-off and landing of aircraft. Compared to the elements en route, meteorological services could provide more timely and efficient support for strategic, tactical, and operational decision-making to manage and diminish flight risks caused by terminal elements. Therefore, analyzing the types and characteristics of hazardous weather conditions around the airports is critical for meteorological services.
Low-level wind shear (LLWS), limited visibility (LIMV), thunderstorm (TSTM), and snowfall (SNOW) are the four main contributing factors at the terminal (Zhou et al., 2016). Wind shear is a change in wind speed or direction over a short distance. It can occur either horizontally or vertically and is most often associated with strong temperature inversions or density gradients (Federal Aviation Administration., 2008). LLWS is defined as the vertical change in horizontal wind direction or speed at the lowest 600 m of the atmosphere according to the National Weather Service Instruction (NOAA/National Weather Service., 2004). This altitude is critical for aircraft take-off and landing (Shun, 2004; Ding et al., 2019). The change in velocity or direction can drastically alter lift, indicated airspeed, and thrust requirements. The aircraft may change flight height suddenly and even get out of control (Fujita and Caracena, 1977; Sharman, 2016). When an aircraft takes off from the runway, the reduction of headwind or the increase of tailwind will inhibit the aircraft's climb capabilities, thereby increasing the distance required for take-off. The aircraft may roll past the end of the runway if the available length is not enough. If an airplane encounters wind shear when approaching, higher ground speed is obtained to combat wind shear. Therefore, there must be enough extra distance to stop the aircraft on the runway (Frost, 1983; Golding, 2005). In 1982, Pan American World Airways Flight 759 crashed on take-off from New Orleans International Airport, killing 152 people and heightening public awareness of wind shear (Stratton, 1992). In terms of climatology, LLWS shows an obvious annual cycle with a peak frequency in different seasons over different regions. For example, in Europe, LLWS frequently occurs in winter (Taszarek et al., 2020), while LLWS is usually observed in spring and summer in China (Lin et al., 2021).
Airport operations are sensitive to visibility conditions and constrained by LIMV (Ki and Yum, 2010; Dagkli and Karacostas, 2017). Low visibility weather prevents the pilots from seeing the runway, and thus the aircraft cannot land on the runway. When the horizontal visibility is below a certain threshold at the airport, additional measures such as increasing the distance between approaching and taxiing aircraft are taken to ensure safe operations, which would also reduce the capacity of the airport. Consequently, planes might be delayed, diverted to alternative airports, or prevented from taking off (Reynolds et al., 2012; Kneringer et al., 2019). The two main weather phenomena that cause LIMV are fog and low clouds (Leem et al., 2005). Fog is a local phenomenon that can form as a result of advection, radiative cooling, or weather fronts moving over a specific area (Avotniece and Klavinš, 2013). Its occurrence and spatial distribution are closely related to the topography (Witiw and LaDochy, 2008; O'Brien et al., 2012). In addition, horizontal visibility is also restricted by precipitation and snowfall (Kneringer et al., 2019). Therefore, the large values of the LIMV frequency climatology can be observed over the wet regions in China, such as Sichuan, Shanghai, etc. (Tian et al., 2013; Liu F. et al., 2019). Because visibility can also be influenced by the accumulated dust and smoke particles in dry air (Boudala and Isaac, 2009), it is rational to find the frequent occurrence of LIMV over Northern China (Zhao et al., 2011; Kitthanet, 2018).
Among the weather factors affecting the safety and efficiency of air traffic, TSTM is the most unfavorable weather phenomenon (Zanin et al., 2020). During the lifecycle of a thunderstorm cell (cumulus, mature, and dissipating), the three stages are dominated by strong ascending motions, coexisting updrafts, and downdrafts, as well as downdrafts, respectively. The ascending and descending air currents in the cumulus and mature stages seriously affect the flight. Analysis of delay causality at Newark International Airport (Allan et al., 2001) shows that 41% of the cumulative arrival delay occurred on days characterized by thunderstorms. On the afternoon of Wednesday, 10 May 2006, a severe thunderstorm across Bristol led to large hail, frequent lightning, and associated damage. Bristol Airport was closed briefly due to severe weather (Young, 2007). When an airplane flies into the vertical airflow, its balance will be destroyed, and subsequent intense turbulence can cause difficulty in maneuvering and sudden changes in flying height, causing flight accidents (Young, 2007; Taszarek et al., 2020; Yavuz et al., 2020). Moreover, TSTM is often accompanied by strong winds, heavy rain with extremely poor visibility, and sometimes hail, icing, and discharges in clouds. Icing can reduce lift and increase drag, reduce the efficiency of the propeller, produce irregular vibrations, make the airplane unbalanced, and reduce airspeed until a loss of control occurs (Gent et al., 2000; Bragg et al., 2005; Wu, 2012). On 3 March 1973, an IL-18 aircraft in Bulgaria landed at Moscow's Sheremetyevo Airport due to ice accumulation on its tail and failure of detection, killing 25 people. Lightning strikes can directly damage the exterior parts of aircraft and sometimes even light the fuel tank, causing serious flight accidents (National Transportation Safety Board., 1976). Large hail can damage the cockpit glass, radome, and horizontal stabilizer, significantly affecting flight safety (Hayduk, 1973; Braun et al., 2005). Therefore, international regulations recommend that pilots avoid areas with deep convection and keep a safe distance from the storm. When a TSTM passes through the airport, ground operations may have to stop, and flights must be diverted to waiting mode (Sauer et al., 2016). TSTM can be observed from the tropics to the mid-latitude regions but is more active in the tropical regions (Mäkelä et al., 2013; Holton et al., 2015; Taszarek et al., 2018). In addition, TSTM activities are generally quiet in the cold season and frequently happen in the warm season in Northern Hemisphere (Agnihotri et al., 2013). The period with a maximum frequency of TSTM varies in different regions; for example, it is May in Bangalore (Agnihotri et al., 2013), June–September in Aurangabad airport (Chikalthana, India) (Biswas and Dukare, 2012), July–August in northern, eastern, and central Europe, and May–June in western and southeastern Europe (Taszarek et al., 2018). In China, TSTM frequently happens in southern China during the warm seasons (Zhang and Feng, 1998; Xue et al., 2021).
SNOW is another kind of hazardous weather that affects aviation safety. On the one hand, SNOW can affect visibility. The melting of snow can increase the humidity in the lower layer, which is conducive to fog formation and makes the visibility worse. On the other hand, snow and ice can accumulate on the runway and aircraft, affecting the take-off and landing of aircraft (Rasmussen et al., 1999; Seliga et al., 2009). Severe snow can cause the closure of airports and affect flight operations (Zhou et al., 2015; Yavuz et al., 2021). A snowfall event lasted 40 h in Dalian, with the snowfall amount being 12.3 mm from 3 to 5 December 2005. As a result, Dalian Airport was closed, 123 flights were grounded, and 38 flights were canceled (Wang and Dong, 2007). Since the occurrence of SNOW requires the satisfaction of temperature and precipitation conditions, SNOW generally occurs over regions with the continental climate and polar climates (according to the Köppen climate classification), such as Europe, Turkey, the United States, Nepal, and China (Wang et al., 2010; Vajda et al., 2011; Karki, 2012; Çakin et al., 2015; Klotzbach et al., 2016).
Therefore, weather factors have an important impact on aviation. Available weather information can effectively improve flight safety, enhance the efficiency of civil flight space utilization, and reduce airport delays. China has complex surface topography; thus the climatic backgrounds of different airports vary with their geographical locations. In previous studies on hazardous weather in China, some deficiencies still exist. The first is due to the relatively shorter research period (less than 10 years) in one station (Ma et al., 2013; Ding et al., 2019; Li et al., 2020; Lin et al., 2021), while the second is caused by the conclusions derived from the sparse station observations (Lin and Qu, 2008; Liu et al., 2012; Yang and Li, 2014). When we focus on the main features of the climatology of the hazardous weather affecting Chinese airports, the data with a long period and a high resolution are indispensable. Therefore, we use the state-of-art fifth-generation reanalysis of the European Center for Medium-Range Weather Forecasts (ECMWF) (ERA5) and ERA5-land reanalyses to achieve this goal and provide more detailed information on the hazardous weather affecting China airports. This article intends to explore the spatio-temporal changes in major weather disasters at 24 major airports in China, that is, LLWS, LIMV, TSTM, and SNOW (Figure 1).
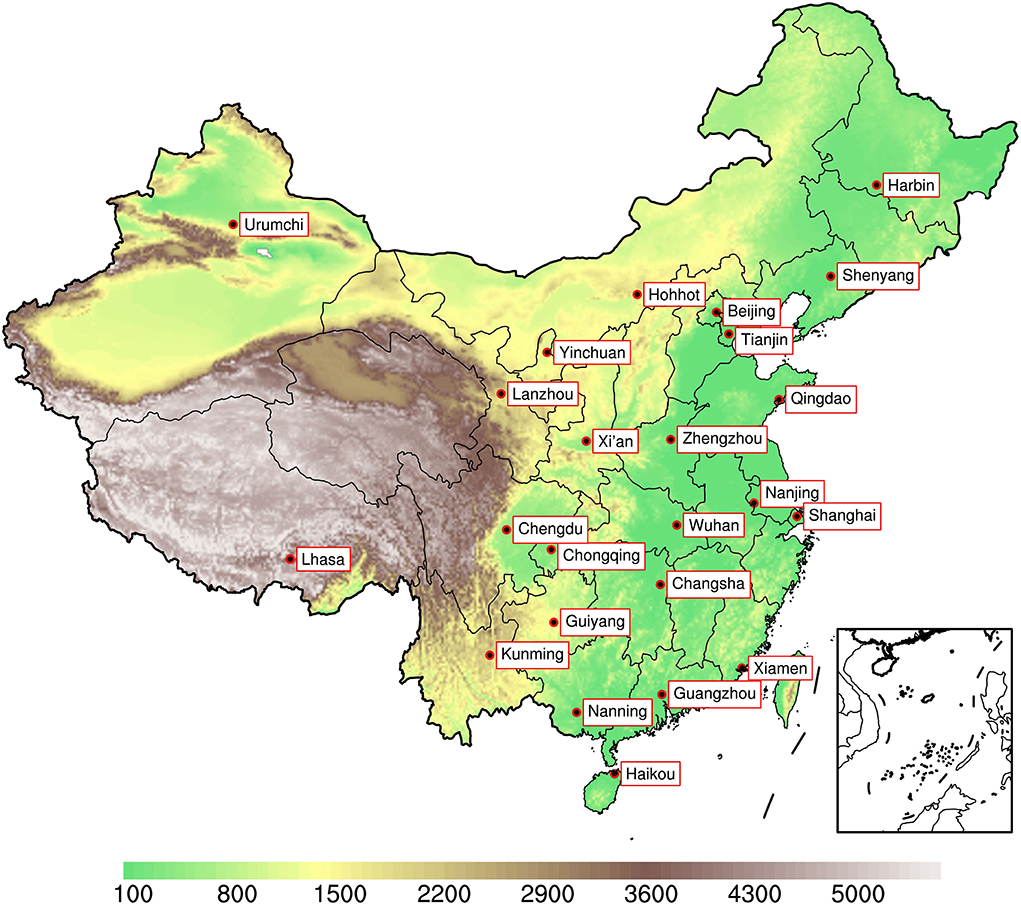
Figure 1. Locations of selected airports in this study. Shaded areas indicate the orography in meters above sea level.
The remainder of this paper is organized as follows. Section Data and methodology introduces the data and indexes used in this study. Section Results investigates the climatological characteristics of hazardous weather conditions, namely, spatial variability, annual cycles, inter-annual variability, and long-term trend at individual airports. Finally, the discussion and conclusion are provided in section Discussion and conclusion.
Data and methodology
Data
This study adopts the ERA5 reanalysis, which covers the years from 1979 to 2019. The ERA5 reanalysis is released as the substitution for migration from ERA-interim using 4D-Var data assimilation, which significantly improves the latter (Copernicus Climate Change Service, 2017; Tarek et al., 2020). The dataset has a horizontal resolution of 0.25° × 0.25°, with 137 model levels (top level at 0.01 hPa) and a 1-h time interval. Compared to other reanalysis datasets (e.g., the National Centers for Environmental Prediction Reanalysis-I, Japanese 55-year Reanalysis, Modern-Era Retrospective analysis for Research and Applications: Version 2), the ERA5 shows a better performance in reproducing the observed global temperature and extreme temperature (Yang et al., 2022), and is more reliable than other reanalyses for the exploration of convective environments over North America and Europe (Taszarek et al., 2021). The ERA5 has also been widely used to estimate snowfall variation (Liu Y. et al., 2019; Wang et al., 2019; Kwok et al., 2020; Taszarek et al., 2020; Lin and Chen, 2021). Moreover, in China, evaluations suggest the suitable application of ERA5 in analyzing the regional climate change, such as precipitation (Jiang et al., 2021; Song and Wei, 2021), cloud cover (Lei et al., 2020), and convective available potential energy (CAPE; Zhao et al., 2021). We use this dataset in this study with the above-mentioned advantages in the ERA5 reanalysis. The variables used in this study include ceiling height, mixed-layer CAPE, convective precipitation, cloud cover, and u- and v-components of wind vectors. To better measure the SNOW event over China, we use the snowfall data from the ERA5-land reanalysis. ERA5-land reanalysis has a higher resolution of 0.1° × 0.1° than the ERA5 and shows the added value in the description of the hydrological cycle (Muñoz-Sabater et al., 2021).
We also use the available observations to validate the conclusions derived from the ERA5/ERA5-land reanalyses. To better present the hazardous weather conditions at China's airports, we select the nearest station for analysis. The daily 10-m wind and visibility are obtained from the dataset of daily climate data from Chinese surface stations for global exchange (V3.0) (http://101.200.76.197/en/?r=data/detail&dataCode=SURF_CLI_CHN_MUL_DAY_CES_V3.0). The dataset available with us is from 2017 to 2021. The observed hail and snowfall are obtained from the data on important ground weather elements in China. These datasets are used to describe the conditions of surface wind, LIMV, TSTM, and SNOW. The upper air observations are from the data of specific synoptic hours from upper air stations in China (http://data.cma.cn/en/?r=data/detail&dataCode=B.0011.0001C). The dataset available for us is from 2020 to 2021. For the upper air observation of wind, the data include observations on 08Z and 20Z each day, and the 300-m wind is used. The difference between 300 m wind and 10 m wind is used to measure the LLWS.
The study area covers the whole of China. The climatological characteristics of annual cycles and long-term variability for hazardous weather are explored at selected airports in the biggest cities in China (Figure 1). Based on the ERA5/ERA5 land data, these characteristics at individual sites are represented by the results at the grid points closest to the airport locations. Besides, the characteristics of the four seasons of spring (March, April, and May), summer (June, July, and August), autumn (September, October, and November), and winter (December to the following February) are also investigated in this study.
Methodology
In this study, some environmental parameters are selected as non-conditional proxies to identify the occurrence of certain weather. The definitions for particular types of hazards are listed in Table 1. LLWS/SNOW is detected based on the corresponding wind shear/liquid precipitation among the four hazardous weather conditions. International Civil Aviation Organization. (2005) suggested that the LLWS exceeding 5 kt per 100 ft is likely to impact aircraft operations significantly. Considering that the reanalysis dataset tends to underestimate vertical wind shear (Gensini et al., 2014; Duruisseau et al., 2017; Taszarek et al., 2018), the threshold for defining LLWS is the same as Taszarek et al. (2020). Following Rasmussen et al. (1999, 2000), a threshold of 0.5 mm h−1 (liquid water content equivalent) is selected as snowfall intensity. However, for LIMV and TSTM, they are detected by the diagnostic proxies. The threshold of 60 m above ground level (AGL) for ceiling height and 100% low-level cloud cover is determined based on the procedures of instrument light rules and the decision height from the instrument landing system of Category I. However, as documented by ECMWF, fog is not considered when defining cloud base height, but it is a very important phenomenon causing limited visibility. Therefore, according to Zhou et al. (2016), we add an additional rule to determine LIMV, which is associated with a relative humidity >95% and a 10 m wind speed <1 m/s. The rule in detecting a TSTM is when the mixed layer (ML) convective available potential energy is larger than 500 J kg−1, and convective precipitation is more than 0.25 mm h−1 (Taszarek et al., 2017, 2019, 2020).
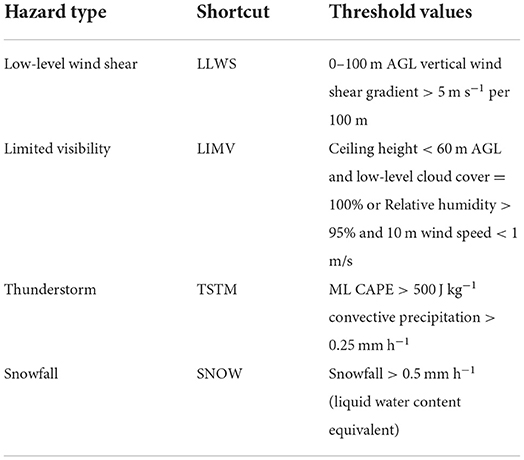
Table 1. Threshold values for proxies defining particular types of hazardous weather.
Results
Spatial variability
The spatial distribution of the seasonal mean number of hours with LLWS is shown in Figure 2. The LLWS is the strongest in winter and the weakest in summer. In winter, the LLWS mainly occurs over the Qinghai–Tibet Plateau and Inner Mongolia, where the average hours with LLWS are >400 h. In summer, the LLWS mainly occurs over the area north of 35°N, with the hours being <100 h, and there is almost no LLWS south of 35°N. Spring and autumn are the transition periods, but the LLWS in spring is more frequent than that in autumn. The frequency of LLWS in spring is second only to winter, and long hours of LLWS appear in eastern Inner Mongolia and Northeast China, with an average exceeding 300 h. Similarly, long hours of LLWS in autumn can be seen in the east part of Mongolia, with the average amount of time being 200–300 h.
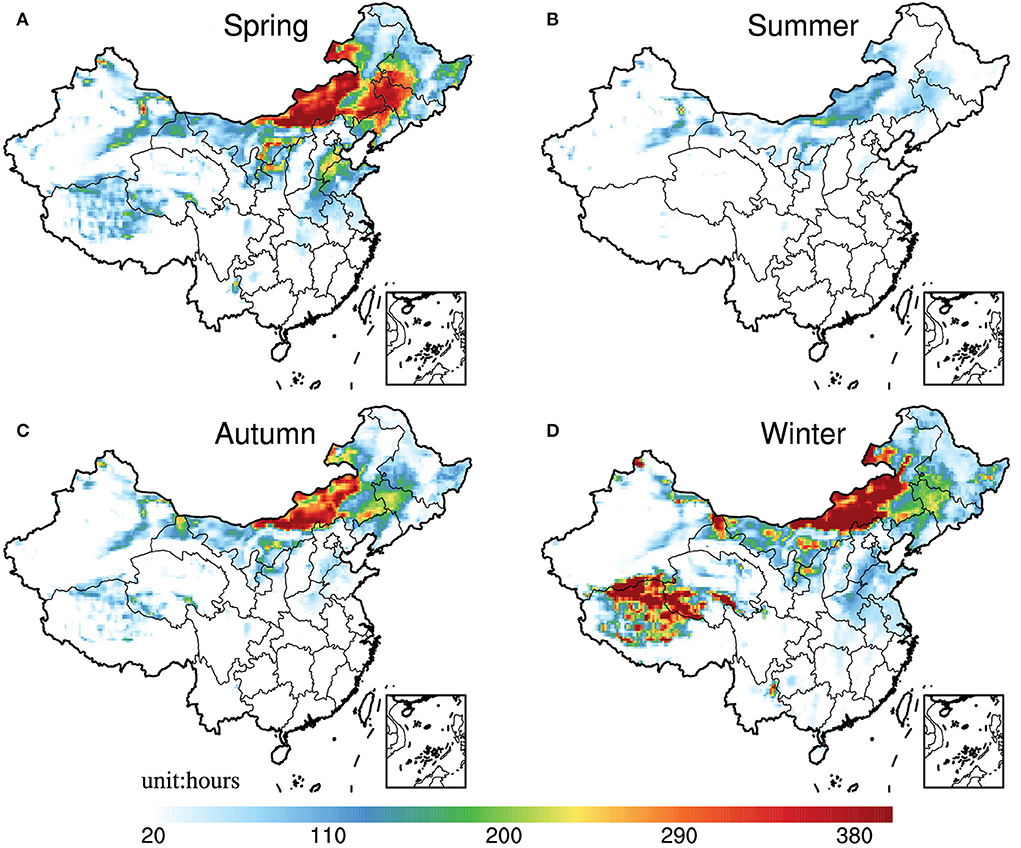
Figure 2. The spatial distribution of the (A) spring, (B) summer, (C) autumn, and (D) winter mean number of hours with LLWS by using the hourly data from the ERA5 during 1979–2019.
Figure 3 shows the spatial distribution of the seasonal mean number of hours with LIMV. The number of hours with LIMV does not vary significantly among seasons, but the locations of large-value areas are quite different. The LIMV mainly occurs in southeastern Tibet, the Yunnan–Guizhou Plateau area, and Sichuan in summer and autumn. Among them, large values appear to the east of Hengduan Mountain, and the number of hours with LIMV in regions such as Liangshan is more than 400 h. In spring and winter, the LIMV is prone to occur along 25°N−30°N, namely, eastern Yunnan, Guizhou, Hunan, Jiangxi, and Fujian, similar to a previous study (Niu et al., 2010). In these areas, the number of hours with LIMV is >250 h, and Guizhou faces the highest threat with hours over 300 h. It is worth noting that there is also a large-value area near Urumqi in winter (Figure 3D), which is consistent with Wang et al. (2017). Previous studies have revealed that water vapor and atmospheric stability could affect visibility, and intense temperature inversion is conducive to the formation of foggy weather (Niu et al., 2010). In Urumqi, winter is a period with frequent temperature inversions and heavy snow, resulting in sufficient water vapor conditions and high relative humidity (Zheng et al., 2007).
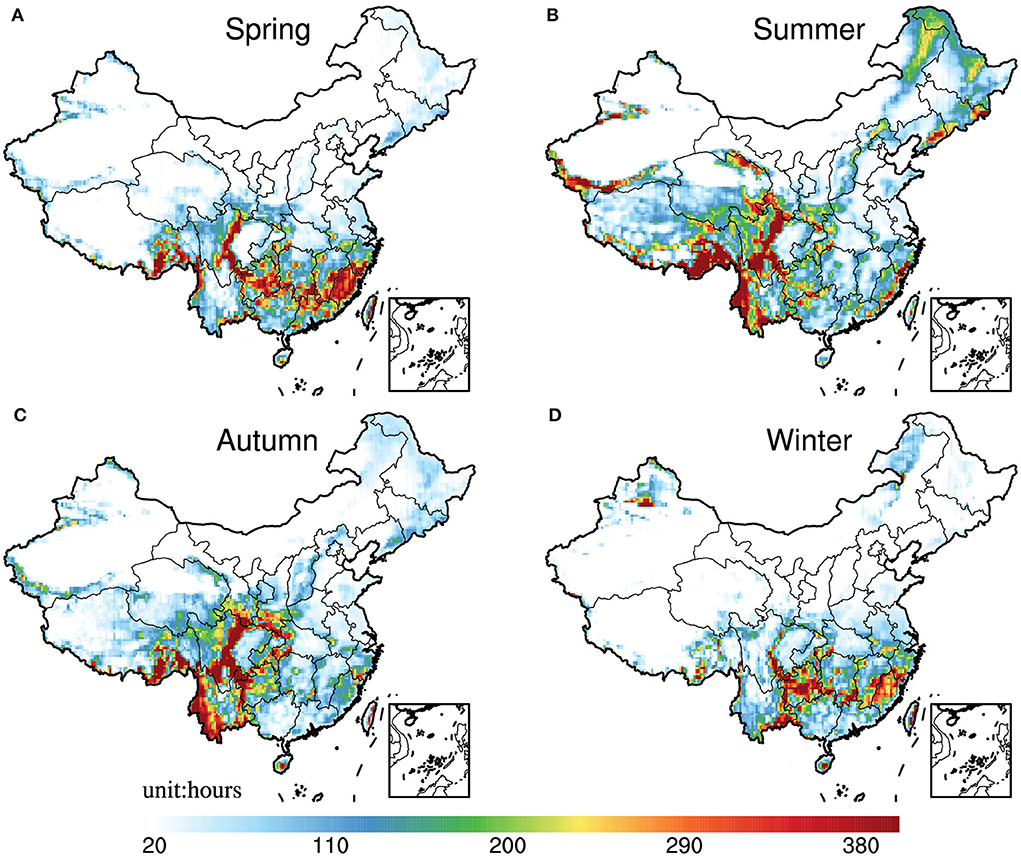
Figure 3. (A-D) Same as Figure 2, but for seasonal mean LIMV.
The number of hours with TSTM (Figure 4) indicates that TSTMs have a pronounced seasonality, with the most occurrence frequency in summer while there are no TSTMs in winter. In summer, intense heating and evaporation result in heavy precipitation and unstable energy. Except for Xinjiang, Gansu, Qinghai, and Western Inner Mongolia, other regions are prone to TSTM in summer, with South China and Southwest China being the center where the number of hours with TSTM exceeds 200 h, which accords with Xue et al. (2021). The frequent occurrence of TSTM in southwestern China (such as Tibet, Sichuan, and Yunnan) is closely related to the topography and geomorphology in these regions, while Southern China, such as Guangdong and Guangxi, has more than 400 h with TSTM. The frequent occurrence of TSTM in these areas may be due to the development of tropical convective systems such as typhoons and easterly waves (Lin and Qu, 2008) and also be related to the accumulation of pollutants aerosols (Yang and Li, 2014). In spring, areas susceptible to TSTMs include Guangxi and Guangdong, which have TSTMs for more than 200 h, while in autumn, there are few TSTMs except for eastern Tibet and southern Yunnan, with the hours being more than 150 h.
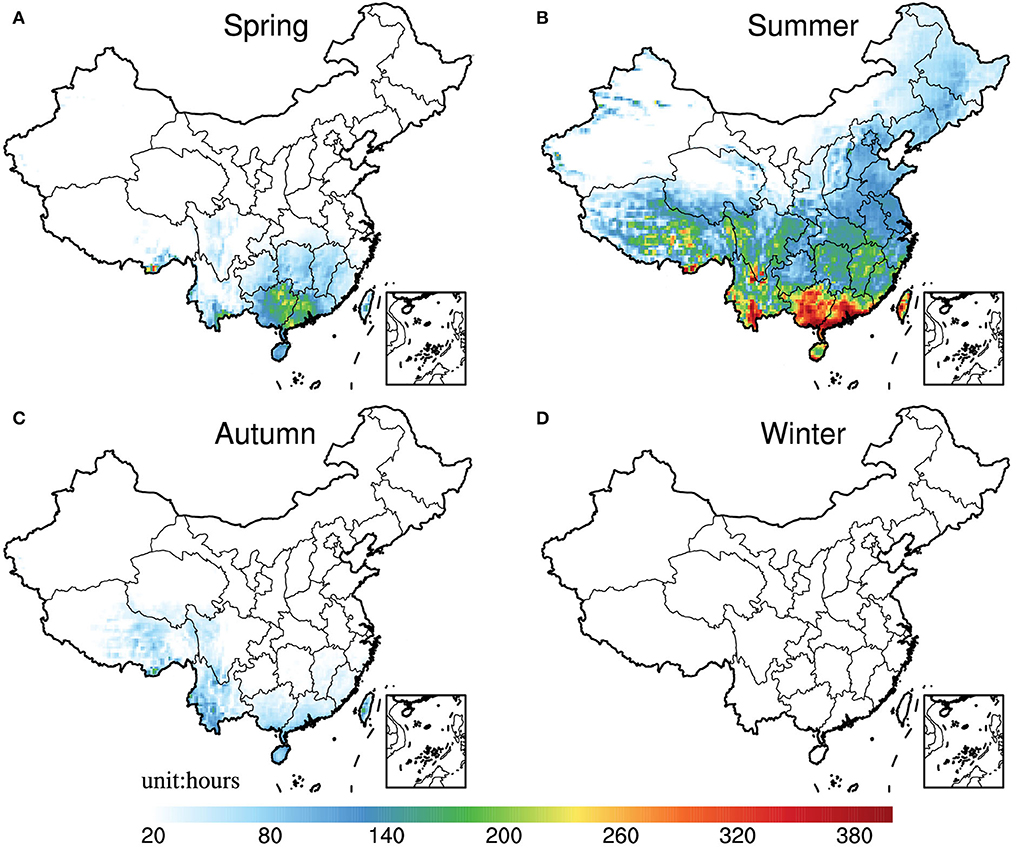
Figure 4. (A-D) Same as Figure 2, but for seasonal mean TSTM.
SNOW mostly appears in northeastern China, eastern Tibet, Qinghai, western Sichuan, and Yili Kazakh Autonomous Prefecture of Xinjiang (Figure 5), consistent with Figure 3 in Liu et al. (2012). Interestingly, the number of hours with SNOW over eastern Tibet and Qinghai is most in spring rather than winter. This may be due to the lack of water vapor in winter, according to Liu et al. (2012). Moreover, most SNOW occurs in the Linzhi area of Tibet, where the hours with SNOW all exceed 100 h in spring, autumn, and winter. This is mainly related to high altitude and the transportation of water vapor from the Indian Ocean.
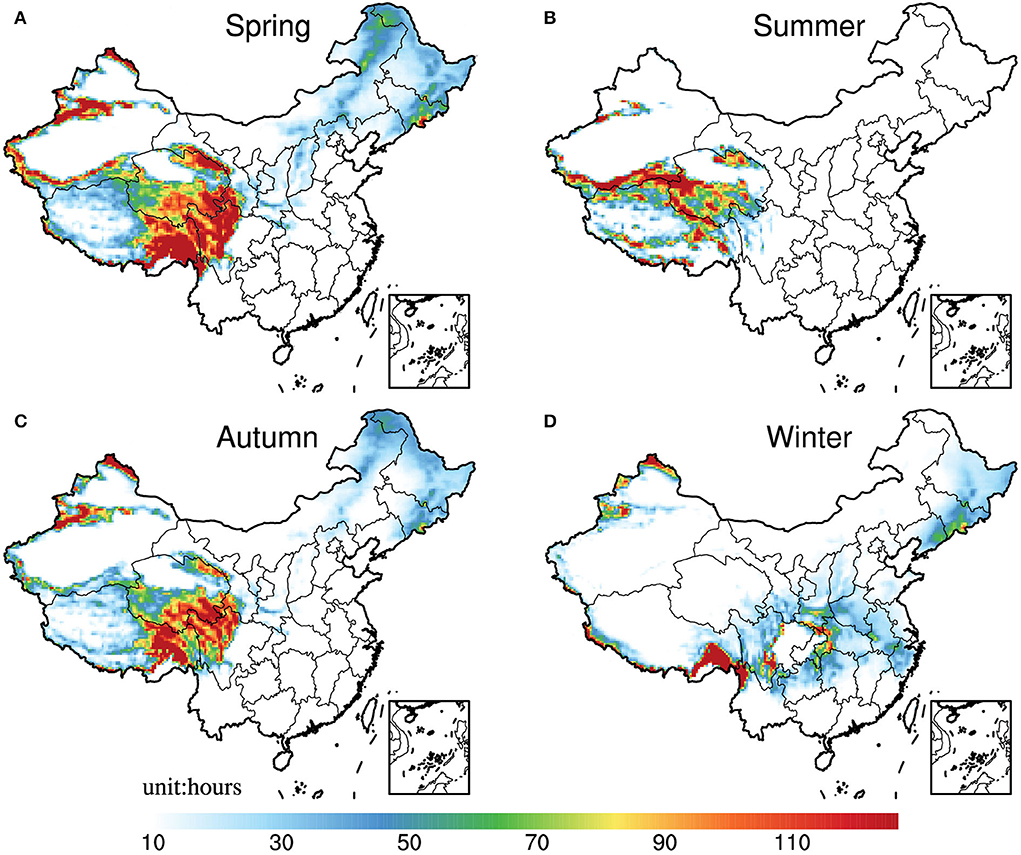
Figure 5. (A-D) Same as Figure 2, but for seasonal mean SNOW from the ERA5-land reanalysis.
Considering the characteristics of occurrence frequency of hazards mentioned above, the dominant hazardous weather types in different seasons are further explored (Figure 6). The dominant type of hazardous weather at each grid is the one with the largest frequency within one season. The results show that LLWS and LIMV are the two main types of hazardous weather in spring, autumn, and winter. The LIMV mainly occurs in the south (south of 35°N), while the LLWS primarily occurs in the north (north of 35°N), mainly due to the low humidity in the north, as most LLWS events occur under dry weather conditions (Li et al., 2020). In summer, the dominant hazardous weather is TSTM. Except for Xinjiang, Gansu, and Inner Mongolia, where the LLWS become a major disaster, TSTMs are more likely to occur in the rest regions. In addition, SNOW is another main hazardous weather in the Qinghai–Tibet Plateau, namely, Qinghai, Tibet, Sichuan, and parts of Xinjiang, which is most frequent in spring.
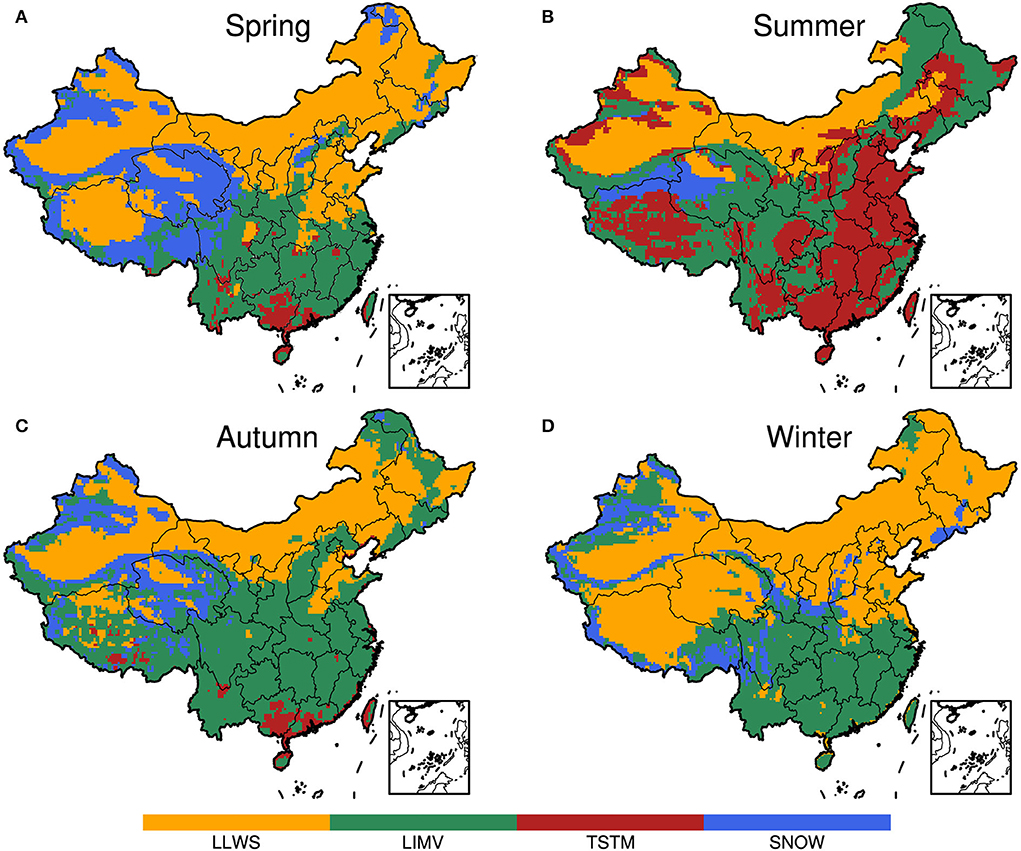
Figure 6. Spatial distributions of the dominant types of hazardous weather in (A) spring, (B) summer, (C) autumn, and (D) winter namely, LLWS (orange), LIMV (green), TSTM (red), and SNOW (blue).
Annual cycles at individual sites
In this section, the climatological characteristics of the annual cycle of hazardous weather are explored at selected airports in China. A 30-day moving average is applied for each type of hazardous weather, as shown in Figure 7. The LLWS seldom occurs in May–September while frequently occurring during the other months. The areas with frequent LLWS are mainly located in the northern part. The number of hours with LLWS ranges from 103 h to 176.5 h in Shanghai, Nanjing, Qingdao, Guiyang, and Yinchuan. The highest occurrence frequency of LLWS is located in Harbin and Shenyang, being more than 350 h per year. Besides, Tianjin and Zhengzhou are also seriously affected by the LLWS (over 350 h per year). Unlike LLWS, May to September is the primary period for the occurrence of TSTM at most airports except Urumqi and Lanzhou. The occurrence frequency within the range of 158.4 h to 289.9 h is observed in Chengdu, Kunming, Chongqing, Nanjing, Xiamen, Wuhan, and Changsha, while the occurrence frequency is over 450 h in Guangzhou, Haikou, and Nanning, with the largest being 613.7 h in Guangzhou. For the LIMV, it is less likely to occur in summer, and the probabilities of occurrences are not much different among the other three seasons. The airports with the annual mean hours of LIMV being more than 100 h are all located in the southern region, namely, Shanghai, Guangzhou, Chengdu, Kunming, Chongqing, Nanjing, Wuhan, Changsha, Guiyang, and Nanning, while SNOW is the least frequent hazardous weather in China, with the occurrence frequency being 0–30 h per year. There is no SNOW in Guangzhou, Xiamen, Haikou, and Nanning throughout the year.
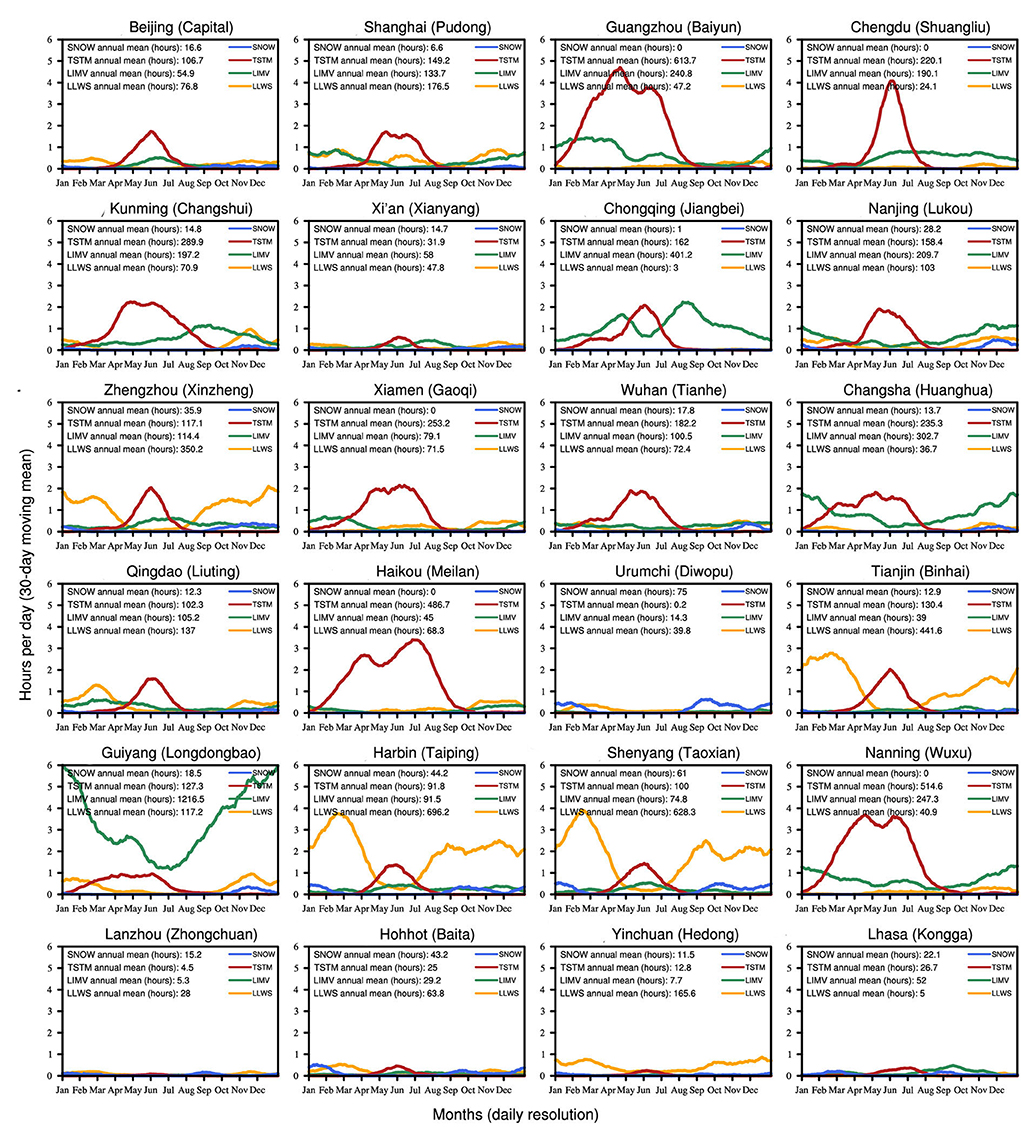
Figure 7. Annual cycles for the numbers of hours with LLWS (orange), LIMV (green), TSTM (red), and SNOW (blue) over selected airports (Figure 1).
Inter-annual variability and long-term trend
In this section, the inter-annual variabilities and long-term trends in the number of hours with LLWS, LIMV, TSTM, and SNOW are analyzed, respectively. A notable decreased trend in the occurrence frequency of LLWS is observed over North China, especially over Inner Mongolia (Figure 8A), consistent with previous studies (Zhang et al., 2017). The decreased trend is probably linked to global warming and urbanization; they could weaken the background winds and then be unfavorable for the LLWS occurrence (Hori and Ueda, 2006; Zhang et al., 2017; Li et al., 2018).
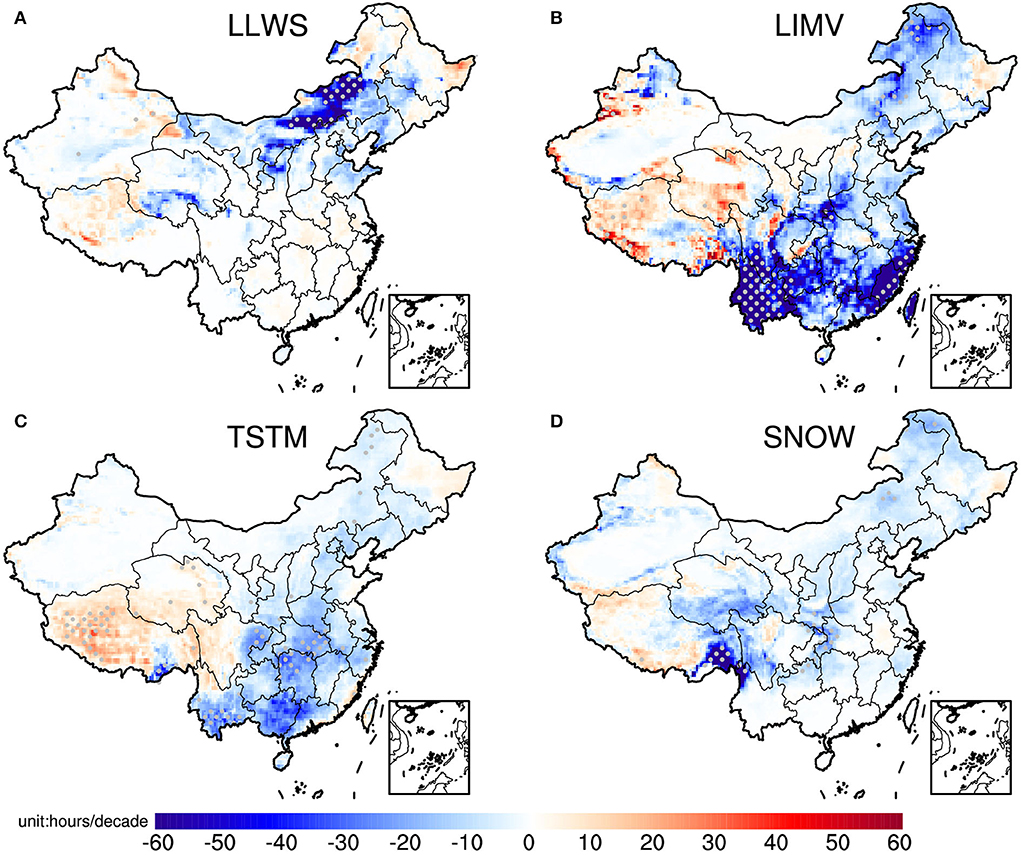
Figure 8. Spatial distributions for the long-term trends in the numbers of hours with (A) LLWS, (B) LIMV, (C) TSTM, and (D) SNOW during 1979–2019. Dotted areas are statistically significant at the 95% confidence level.
For individual airports (Figure 9), the annual hours with the LLWS at Tianjin and Harbin airports have significantly reduced (p < 0.05), with the trend values being −19.15 h per decade and −25.28 h per decade, respectively. South China and Xinjiang are mainly characterized by an increase in the LLWS, while Changsha and Urumqi airports have experienced a significant increase (p < 0.05). The trends in Kunming, Guiyang, Shanghai, Chengdu, Chongqing, Nanjing, and Lanzhou are not noticeable, where the magnitudes of trend values are <1 h per decade. There is almost no change in the occurrence frequency of LLWS over Tibet. The inter-annual variabilities of the occurrence frequencies of LLWS (Figure 9) are much higher in North and Northeast China (e.g., Harbin, Shenyang, and Tianjin) compared to the southern and southwestern parts of China (e.g., Chengdu, Chongqing, Nanning, and Changsha).
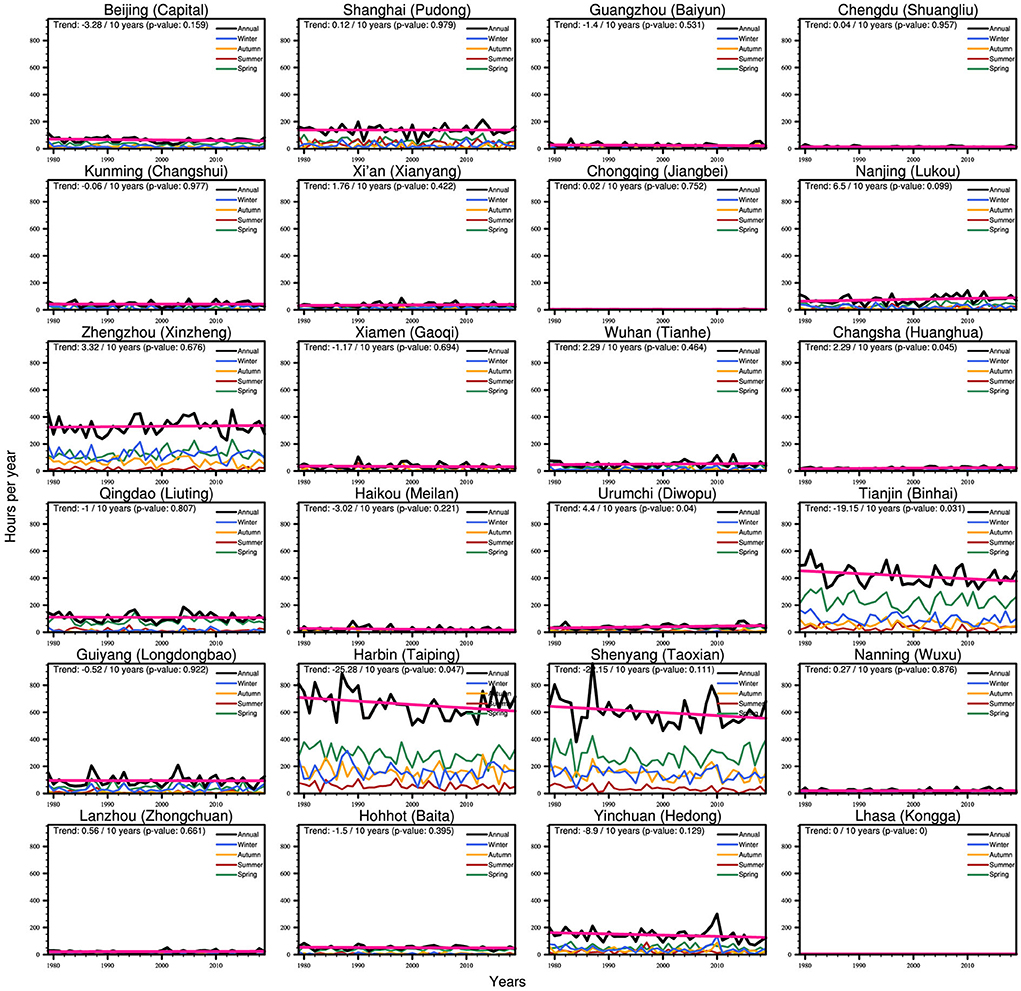
Figure 9. The inter-annual variability and long-term trend of hours with LLWS over selected airports based on the ERA5 hourly data during 1979–2019.
The LIMV shows an increasing trend over the Qinghai–Tibet Plateau and a decreased trend over Northeast China, Southwest China, and northern Xinjiang (Figure 8B). Previous studies reported significant decreases in fog days over northeast China, and southern China, indicating the probable decline in the regional LIMV frequency (Sun et al., 2013; Ding and Liu, 2014). Among 24 individual airports (Figure 10), Chongqing, Wuhan, Haikou, Urumchi, Harbin, Yinchuan, and Lanzhou have experienced an increasing trend. However, only the trends in Haikou and Urumchi are significant. The remaining airports all present a decreased trend in the number of hours with LIMV. The trend values of the annual sum are statistically significant (p < 0.05) in Kunming (−33.4 h per decade), Shanghai (−18.37 h per decade), Xiamen (−16.36 h per decade), and Zhengzhou (−14.91 h per decade). Distributions at selected locations indicate high inter-annual variabilities of LIMV in southern China (Guangzhou, Chengdu, Kunming, Chongqing, Nanjing, Changsha, Nanning, and Guiyang), especially in Guiyang. At most sites, the inter-annual variability in spring (green line) and winter (blue line) is higher than that in summer (red line) and autumn (orange line), while stations located in Northwestern Provinces (e.g., Xi'an, Urumchi, Lanzhou, and Yinchuan) are featured by lower frequencies and inter-annual variabilities.
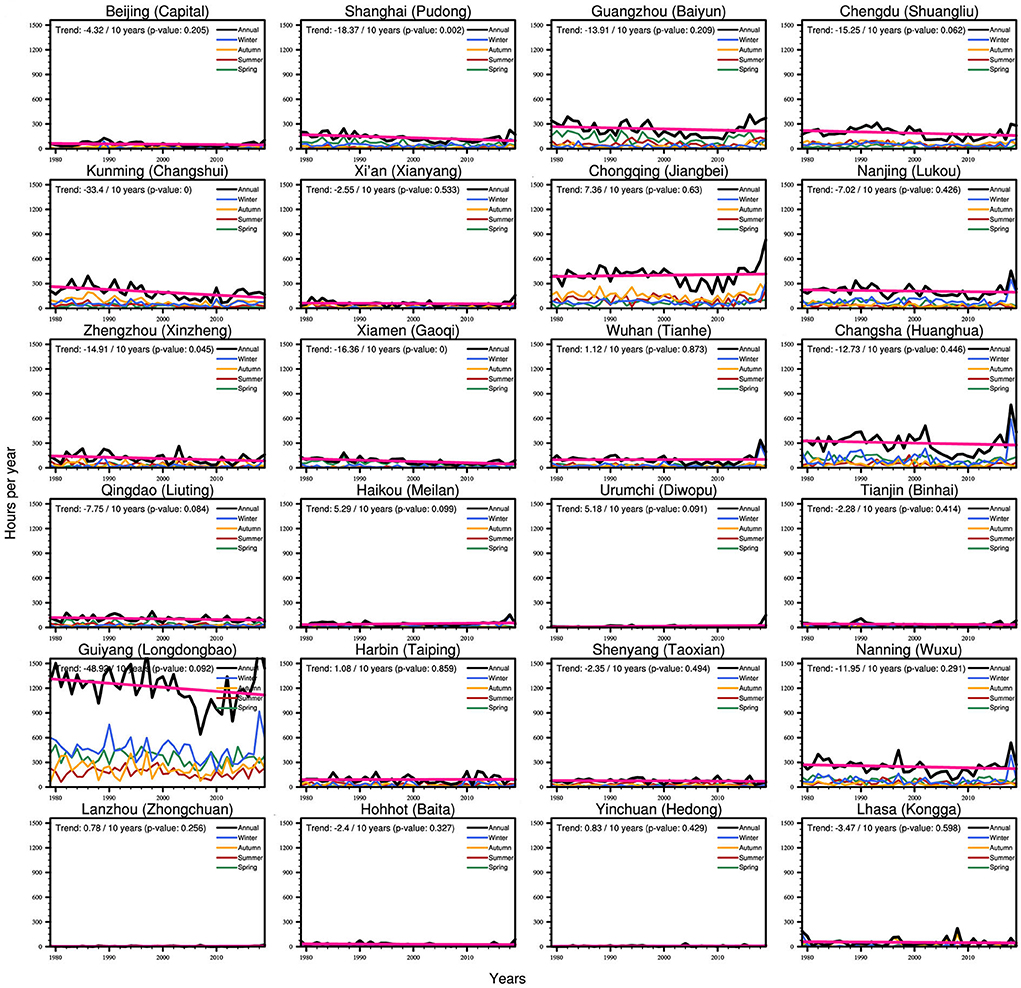
Figure 10. Same as Figure 9, but for LIMV.
A signal for decreased frequency of TSTMs is found over most parts of eastern China, while an increasing trend appears over the Qinghai–Tibet Plateau (Tibet, Qinghai, and Sichuan) (Figure 8C), which is consistent with previous studies (Chen et al., 2009; Zhang et al., 2017). South China has experienced a more significant decrease in the occurrence frequency of TSTM, which may result from the combined influence of atmospheric and environmental factors. According to Xue et al. (2021), the geopotential height difference between the south and the north decreased from 1979 to 2013, along with the weakened westerly jet and zonal wind speed in the upper air. These circulation changes may contribute to decreased TSTM (Archer and Caldeira, 2008). Moreover, both the CAPE and low-level relative humidity show a decreased trend after 1979, especially in southern China, which also plays an important role (Xue et al., 2021). For individual locations, the airports all witnessed a decreased trend, except in Chengdu, Xiamen, Haikou, Qingdao, Lanzhou, and Yinchuan, where TSTMs are becoming more frequent (Figure 11). A notable decreased trend (p < 0.01) in the annual occurrence frequency of TSTMs is found over Kunming (−19.93 h per decade), Xi'an (−6.25 h per decade), and Wuhan (−19.83 h per decade). A decreased trend that is secondary significant (p < 0.05) is observed in Changsha (−19.52 h per decade), Beijing (−9.86 h per decade), and Zhengzhou (−15 h per decade). The difference between the minimum and maximum annual frequency of TSTMs during the whole period for most airports is around 200 h. However, for locations in southern China, it can be more than 300 h. In addition, the inter-annual variation of summer TSTM frequency is consistent with the annual sum because summer is the season with the highest frequency of TSTM.
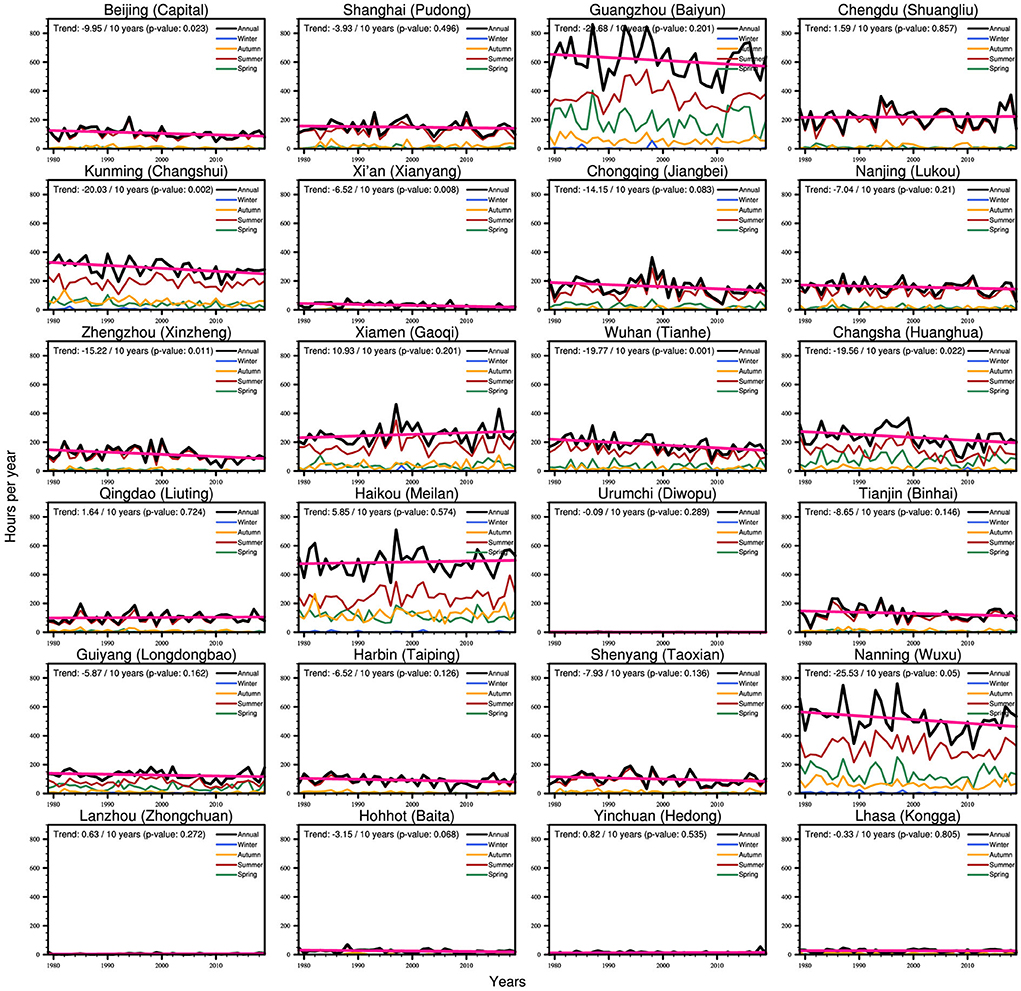
Figure 11. Same as Figure 9, but for TSTM.
Regarding the long-term trend, SNOW shows decreased trends over most parts of China, especially over the western Tibetan Plateau (Figure 8D). The decreased trend of SNOW over most parts of China has also been reported by Luo et al. (2020). For the individual airport, Figure 12 shows the inter-annual variabilities and long-term trends in the SNOW frequency. The year-to-year variations of SNOW hazards are more than 50 h over Nanjing, Zhengzhou, Harbin, Shenyang, and Lhasa. In contrast, SNOW hazards are rare in some southern locations, such as Xiamen, Guangzhou, Haikou, and Nanning. The first five airports with a large decreased trend are in Hohhot (−7.44 h per decade), Shenyang (−3.90 h per decade), Qingdao (−3.85 h per decade), Changsha (−3.35 h per decade), and Zhengzhou (−2.75 h per decade), respectively (Figure 12). In retrospect, previous studies pointed out that under global warming, the relatively warmer environment is against the formation of fog and snowfall and decreases the LIMV and SNOW frequencies (Kapnick and Delworth, 2013; O'Gorman, 2014; Akimoto and Kusaka, 2015; Avotniece et al., 2015).
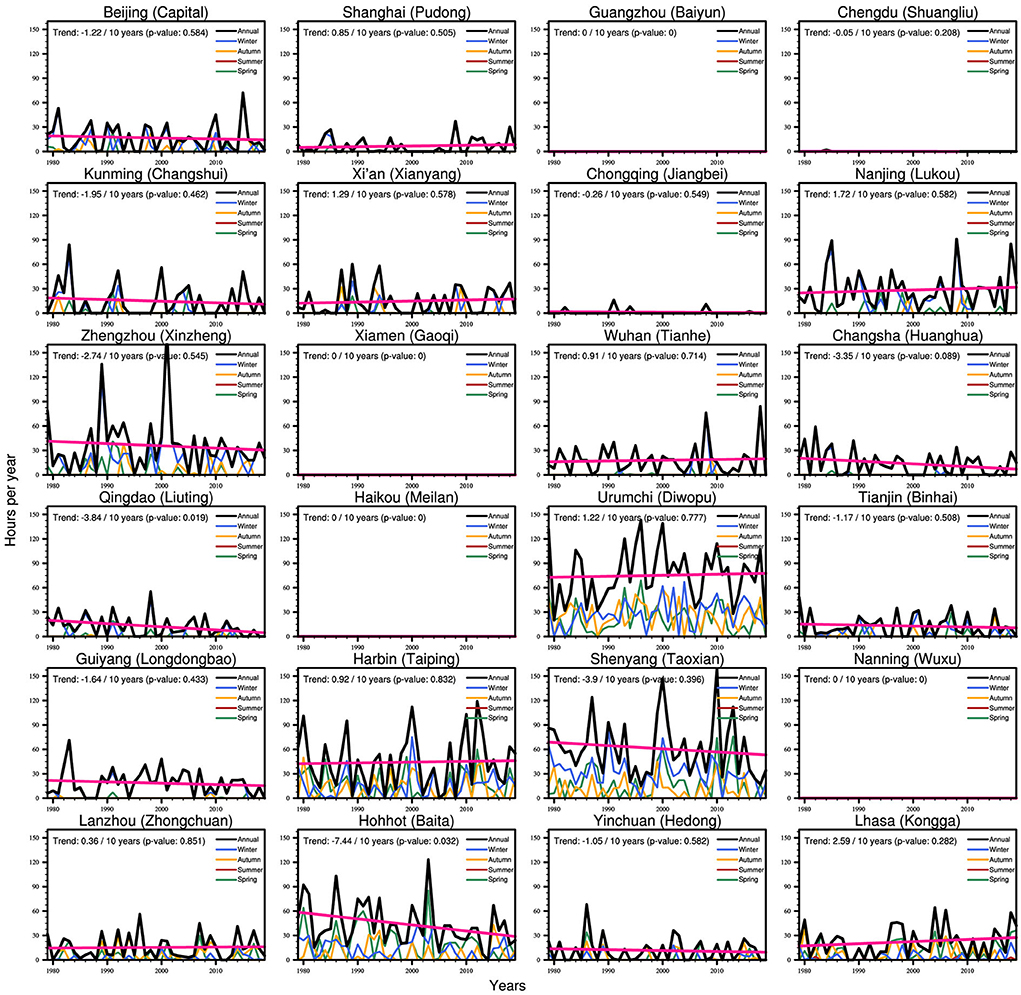
Figure 12. Same as Figure 9, but for SNOW from the ERA5-land reanalysis.
Besides the variations of the individual hazards, we also analyze the relationship between different hazards. LIMV and TSTMs frequently occur over the south of eastern China (east of 100°E and south of 35°N) but are rare over the north part (east of 100°E and north of 35°N). Therefore, the correlation coefficients between the time series of the LIMV and TSTM frequencies in spring, summer, and autumn are shown in Table 2. The correlation coefficient in winter is not calculated due to the rare TSTM occurrence over the south of eastern China. The close relationships between LIMV and TSTMs exist from spring to autumn. Such a phenomenon is probably attributed to TSTMs being always accompanied by heavy rainfall and a high density of the low-level cloud, which would decrease visibility. LLWS and SNOW frequently happen over the north of eastern China; however, their relationship is very weak.
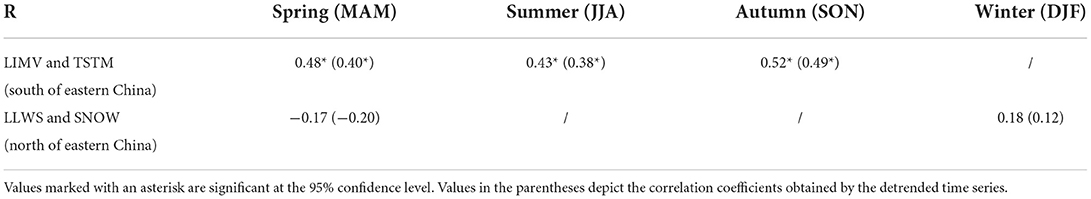
Table 2. Correlation coefficients of average frequency between different hazards at airports over southern or northern China.
Discussion and conclusion
Discussion
It is necessary to evaluate the reanalysis results by the observations. Considering the sparse temporal resolution of the station observations, definitions for LLWS, LIMV, TSTM, and SNOW are different from those in Section Methodology. An LLWS day is defined when the shear between the 300 m wind and the 10 m wind is >4 m s−1 per 100 m. It should be noted that since the radiosonde data lack data at the height of 100 m, here, we use the wind speed of 300 m to calculate the wind shear. Correspondingly, the gradient threshold is taken as 4 m s−1 per 100 m because the change rate of wind speed decreases significantly with the increase of height according to the wind profile. Days with minimum daily visibility of <1 km are recorded as LIMV days (Hyvärinen et al., 2007). Due to the lack of observations of thunderstorms, the frequency of thunderstorms is represented by the number of days with hail. SNOW day is recorded when snowfall was reported in 1 day. Accordingly, the multi-year average of the hazardous weather by station observations is calculated. Despite the differences (e.g., length of periods, definitions, and data resources) between the reanalysis results and observations, it is meaningful to investigate their general characteristics.
According to the results in Section Results, the LLWS climatology is centered in the north of eastern China, and both the climatologies of LIMV and TSTMs are centered in the south of eastern China. In addition, SNOW frequently occurs at the airport in Urumchi and Lhasa. Urumchi and Lhasa are also representative cities in northwestern China and Tibetan Plateau. Therefore, we compare the average of the hazardous weather in the above-mentioned regions between the ERA5/ERA5-land reanalyses and observations. This area-average method will decrease the uncertainty in analyses taken by single stations.
The annual cycle of the average LLWS at airports in the north of eastern China is shown in Figure 13A. Generally, the observed bimodal characteristic of the annual cycle for LLWS in the north of eastern China is well captured by the EAR5 reanalysis. In addition, the ERA5 reanalysis also reproduces the periods with the frequency peak in February–March and October–November. For the LIMV (Figure 13B), the observed annual cycle for LIMV at airports in the south of eastern China shows the maximum frequency in winter and the minimum in summer. The ERA5 reanalysis can reproduce the LIMV with a similar characteristic. The period with frequency peak is in December–January. The observed unimodal characteristic of the annual cycle for TSTMs at airports in the south of eastern China could be well captured by the EAR5 reanalysis (Figure 13C). The period with TSTM frequency peak in ERA5 reanalysis is in June, two months earlier than that in August in observations. As reported by a previous study by a long-term observation, the corresponding period with TSTM frequency peak is July–August in the south of eastern China (Lin and Qu, 2008). The reason for the advanced period with TSTM frequency peak in the ERA5 reanalysis needs future research. The annual cycles of the SNOW are similar to the ERA5-land reanalysis and observation at the airport in Lhasa (Figure 13D) and Urumchi (Figure 13E). The SNOW frequently occurs in October-April and shows the frequency peak in December–January (February–March) in Diwopu, Urumchi (Kongga, Lhasa). Based on the above analyses, the results derived by the ERA5/ERA5-land reanalyses are relatively reliable in the regions that are located within the climatological center of specific hazardous weather.
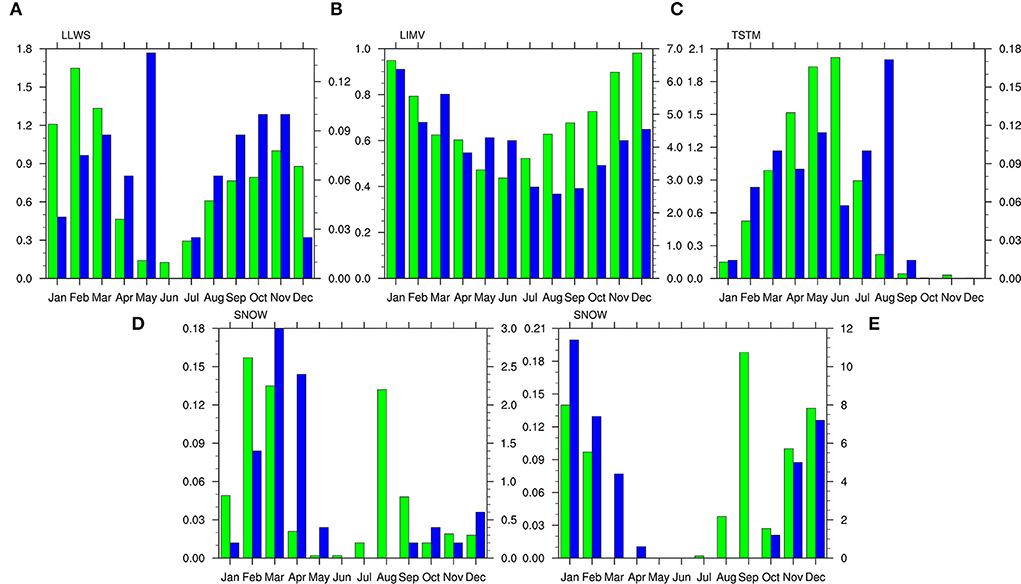
Figure 13. Annual cycles of hazardous weather conditions obtained by the ERA5/ERA5-land reanalysis (unit: hours; left Y-axis; green bars) and observations (unit: days; right Y-axis; blue bars). (A) is the area-average LLWS at the airports in the north of eastern China. (B,C) are the area-average LIMV and TSTMs at the airports in the south of eastern China, respectively. (D,E) are the SNOW at Kongga, Lhasa, and Diwopu, Urumchi, respectively.
Conclusion
The hazardous weather poses a threat to the efficiency and safety of air traffic. The statistics on the characteristics of hazardous weather, especially at the airport, can help improve the understanding of hazardous weather at airports, which is essential to aviation activities. This study investigates the spatio-temporal variabilities of dominant hazardous weather over China, namely, low-level wind shear (LLWS), limited visibility (LIMV), thunderstorms (TSTMs), and snowfall (SNOW). Given the limited resolution of ERA5/ERA5-land reanalyses, it cannot describe phenomena on the scale of a few 100 meters. For this reason, this study does not investigate the specific frequency of the discussed hazards but rather attempts to outline where and when the specific hazards are most likely to occur. Besides, we also use the limited available observations to validate the results obtained from the ERA5/ERA5-land reanalyses.
The seasonal mean number of hours with specific hazardous weather suggests that LLWS is the strongest in winter and the weakest in summer. In the north of eastern China, the airports should take more precautions about LLWS in February–March and October–November. In terms of the annual total results, the number of hours with LLWS in Zhengzhou, Tianjin, Harbin, and Shenyang exceeds 350 h per year, among which Harbin experiences the most (696.2 h per year), while Chongqing has the least (3 h per year). Like LLWS, LIMV is also frequent in cold seasons but less in the warm season. It is vital hazardous weather in the south of eastern China that should be carefully monitored in winter, especially in December–January. However, in northwestern China, LIMV is rare, especially at Yinchuan and Lanzhou airports.
TSTMs are prone to occur in southern China, especially in Yunnan, Guangxi, Guangdong, and eastern Tibet. In these regions, TSTMs are generally active and profoundly influence the air traffic from June to August. In northwestern China, TSTMs are rare, especially at the airport in Urumchi. SNOW frequently occurs over the Tibet Plateau and parts of Xinjiang province. SNOW is generally active in the early winter (December–January) at Urumchi airport but at Lhasa airport in late winter (February–March). There is no SNOW throughout the year in southern China, such as Guangzhou, Xiamen, Haikou, and Nanning, and few concerns may be put on this weather.
Besides, this study also analyzes inter-annual variability and long-term trend in these hazardous weather conditions. The results indicate that the inter-annual variability of the hours with LLWS is much higher in North and Northeast China than in South and Southwest China. LLWS over North China, Northeast China, and Inner Mongolia shows a decreased trend, while there is an increasing trend in Xinjiang, Tibet, and Southeast China. Moreover, the decreased trend over Tianjin and Harbin airports and the increased trend over Changsha and Urumqi airports are statistically significant (p < 0.05). LIMV has increased in the Qinghai–Tibet Plateau but decreased in other regions, especially in southern China. Many airports have experienced a decreased trend in the number of hours with LIMV (p < 0.05). Regarding inter-annual variability, the stations in Northwest China are characterized by a much lower frequency and year-to-year variation for LIMV. TSTMs are becoming less frequent in most parts of eastern China, but there is an increasing trend in Southwest China. A statistically significant decreased trend (p < 0.05) in TSTMs is found in Kunming, Xi'an, Wuhan, Changsha, Beijing, and Zhengzhou. In contrast, the year-to-year variation of TSTMs is more significant in southern China. For SNOW, the long-term trends are not apparent overall, but an increasing trend is found in Lhasa. Considering the frequent SNOW in Lhasa, more attention should be put to monitoring this weather here.
Data availability statement
The original contributions presented in the study are included in the article/supplementary material, further inquiries can be directed to the corresponding author.
Author contributions
TL and CJ: conceptualization, formal analysis, investigation, visualization, and supervision. CJ and CQ: methodology and software. TL: resources, writing-original draft preparation, and writing, reviewing, and editing. CQ: data curation. All authors read and approved the final manuscript.
Funding
This study was funded by the Beijing Natural Science Foundation (Grant No. 8204074).
Acknowledgments
We were thankful to the National Meteorological Information Center for providing the data on important ground weather elements in China.
Conflict of interest
The authors declare that the research was conducted in the absence of any commercial or financial relationships that could be construed as a potential conflict of interest.
Publisher's note
All claims expressed in this article are solely those of the authors and do not necessarily represent those of their affiliated organizations, or those of the publisher, the editors and the reviewers. Any product that may be evaluated in this article, or claim that may be made by its manufacturer, is not guaranteed or endorsed by the publisher.
References
Agnihotri, G., Venugopal, R., and Hatwar, H. R. (2013). Climatology of thunderstorms and squalls over bangalore. Mausam. 64, 735–740. doi: 10.54302/mausam.v64i4.759
Akimoto, Y., and Kusaka, H. (2015). A climatological study of fog in Japan based on event data. Atmos. Res. 151, 200–211. doi: 10.1016/j.atmosres.2014.04.003
Allan, S. S., Beesley, J. A., Evans, J. E., and Gaddy, S. G. (2001). “Analysis of delay causality at Newark International Airport,” in 4th USA/Europe Air Traffic Management RandD Seminar, Santa Fe, NM, USA. 1–11.
Archer, C. L., and Caldeira, K. (2008). Historical trends in the jet streams. Geophys. Res. Lett. 35, 307–315. doi: 10.1029/2008GL033614
Avotniece, Z., and Klavinš, M. (2013). Temporal and spatial variation of fog in Latvia. Environ. Clim. Technol. 3, 5–10. doi: 10.7250/iscect.2013.001
Avotniece, Z., Klavinš, M., and Lizuma, L. (2015). Fog climatology in latvia. Theor. Appl. Climatol. 122, 97–109. doi: 10.1007/s00704-014-1270-4
Biswas, B. K., and Dukare, P. B. (2012). A climatological study of thunderstorm activity over aurangabad (chikalthana) airport with special relevance to aviation in flight planning. Mausam 63, 319–325. doi: 10.54302/mausam.v63i2.1429
Borsky, S., and Unterberger, C. (2019). Bad weather and flight delays: the impact of sudden and slow onset weather events. Econ. Transp. 18, 10–26. doi: 10.1016/j.ecotra.2019.02.002
Boudala, F. S., and Isaac, G. A. (2009). Parameterization of visibility in snow: Application in numerical weather prediction models. J. Geophys. Res. Atmos. 114. doi: 10.1029/2008JD011130
Bragg, M. B., Broeren, A. P., and Blumenthal, L. A. (2005). Iced-airfoil aerodynamics. Prog. Aeronaut. Sci. 41, 323–362. doi: 10.1016/j.paerosci.2005.07.001
Braun, I. M., Sinitsyn, R. B., and Yanovsky, F. J. (2005). Assessment of reliability and comparison of two algorithms for hail hazard detection from aircraft. Proc. Natl. Aviat. Univ. 24, 108–109. doi: 10.18372/2306-1472.24.1155
Britto, R., Dresner, M., and Voltes, A. (2012). The impact of flight delays on passenger demand and societal welfare. Transp. Res. E. 48, 460–469. doi: 10.1016/j.tre.2011.10.009
Çakin, A., Ceyhan, I., Yavuz, V., Özdemir, E. T., Temiz, C., and Deniz, A. (2015). “Investigation of the effect of snowfall on the flights in Turkey,” in OSTIV Meteorological Panel Meeting, Zürich, Switzerland.
Caracena, F., Ortiz, R., and Augustine, J. A. (1986). The Crash of Delta Flight 191 at Dallas-Fort Worth International Airport on 2 August 1985: Multiscale Analysis of Weather Conditions. NOAA Tech Rep ERL 430-ESG 2. 1–38.
Chen, S. R., Zhu, W. J., and Zhou, B. (2009). Climate characteristic and variation tendency of thunderstorm in China (in Chinese). Trans. Atmos. Sci. 5, 703–710. doi: 10.13878/j.cnki.dqkxxb.2009.05.009
Chen, Y. X., Yu, J., Tsai, S.-B., and Zhu, J. F. (2018). An empirical study on the indirect impact of flight delay on China's economy. Sustainability. 10, 357. doi: 10.3390/su10020357
Copernicus Climate Change Service (2017). ERA5: Fifth Generation of ECMWF Atmospheric Reanalyses of the Global Climate. Copernicus Climate Change Service Climate Data Store (CDS). Available online at: https://cds.climate.copernicus.eu/cdsapp#!/home (accessed October 12, 2021)
Dagkli, V., and Karacostas, T. S. (2017). “Event-based climatology and synoptic conditions associated with fog at the “Macedonia” airport,” in Perspectives on Atmospheric Sciences. Springer Atmospheric Sciences, eds. Karacostas, T., Bais, A., and Nastos, P, . (Springer, Cham).
Ding, J. Y., Chen, X. T., Wang, J. P., Ge, S., and Ji, X. L. (2019). Characteristics of thunderstorm and wind shear weather in Changle airport of Fuzhou (in Chinese). J. Arid Meteorol. 37: 270–276. doi: 10.11755/j.issn.1006-7639(2019)-02-0270
Ding, Y. H., and Liu, Y. J. (2014). Analysis of long-term variations of fog and haze in China in recent 50 years and their relations with atmospheric humidity. Sci. China Earth Sci. 57, 36–46. doi: 10.1007/s11430-013-4792-1
Duruisseau, F., Huret, N., Andral, A., and Camy-Peyret, C. (2017). Assessment of the ERA Interim reanalysis winds using high-altitude stratospheric balloons. J. Atmos. Sci.74, 2065–2080. doi: 10.1175/JAS-D-16-0137.1
Evans, J. E. (1997). “Safely reducing delays due to adverse terminal weather,” in Modelling and Simulation in Air Traffic Management. Transportation Analysis, eds Bianco, L., Dell'Olmo, P., and Odoni, A.R, . (Berlin, Heidelberg: Springer). 185–202.
Evans, J. E. (2001). “Developments in US Aviation Weather RandD,” in New Concepts and Methods in Air Traffic Management. Transportation Analysis, eds Bianco, L., Dell'Olmo, P., and Odoni, A. R, . (Berlin, Heidelberg: Springer).
Federal Aviation Administration. (2008). Wind Shear. Available online at: http://FAASafety.gov (accessed July 23, 2021)
Federal Aviation Administration. (2018). What is the largest cause of delay in the National Airspace System? Available online at: https://www.faa.gov/nextgen/programs/weather/faq/#faq1 (accessed July 23, 2021)
Frost, W. (1983). Flight in Low-level Wind Shear. NASA CR-3678, George C. Marshall Space Flight Center, Washington, DC, USA.
Fujita, T. T., and Caracena, F. (1977). An analysis of three weather-related aircraft accidents. Bull. Am. Meteorol. Soc. 58, 1164–1181.
Gensini, V. A., Mote, T. L., and Brooks, H. E. (2014). Severe-thunderstorm reanalysis environments and collocated radiosonde observations. J. Appl. Meteorol. Climatol. 53, 742–751. doi: 10.1175/JAMC-D-13-0263.1
Gent, R. W., Dart, N. P., and Cansdale, J. T. (2000). Aircraft icing. Philos. Trans. R. Soc. A. 358, 2873–2911. doi: 10.1098/rsta.2000.0689
Gerz, T., Forster, C., and Tafferner, A. (2012). “Mitigating the Impact of Adverse Weather on Aviation,” in Atmospheric Physics. Research Topics in Aerospace, eds Schumann, U, . (Springer, Berlin, Heidelberg).
Golding, W. L. (2005). Low-Level Windshear and Its Impact on Airlines. JAAER. 14. doi: 10.15394/jaaer.2005.1530
Hayduk, R. J. (1973). Hail damage to typical aircraft surfaces. J. Aircr. 10, 52–52. doi: 10.2514/3.60196
Holton, J. R., Curry, J. A., and Pyle, J. A. (2015). Encyclopedia of Atmospheric Sciences. Academic Press.
Hori, M. E., and Ueda, H. (2006). Impact of global warming on the East Asian winter monsoon as revealed by nine coupled atmosphere-ocean GCMs. Geophys. Res. Lett. 33, L03713. doi: 10.1029/2005GL024961
Hyvärinen, O., Julkunen, J., and Nietosvaara, V. (2007). Climatological tools for low visibility forecasting. Pure Appl Geophys164, 1383–1396. doi: 10.1007/978-3-7643-8419-7_16
International Civil Aviation Organization. (2005). Manual on Low-Level Wind Shear. Document 9817, first ed. Montreal: International Civil Aviation Organization.AN/449.
Jiang, Q., Li, W., Fan, Z., He, X., Sun, W., Chen, S., et al. (2021). Evaluation of the ERA5 reanalysis precipitation dataset over Chinese Mainland. J. Hydrol. 595, 125660. doi: 10.1016/j.jhydrol.2020.125660
Kapnick, S. B., and Delworth, T. L. (2013). Controls of global snow under a changed climate. J. Climate. 26, 5537–5562. doi: 10.1175/JCLI-D-12-00528.1
Karki, R. (2012). Intercomparision of Snowfall Measured by Weighing and Tipping Bucket Precipitation Gauges at Jumla Airport, Nepal. WMO Conference Article. Availabel online at: https://www.researchgate.net/publication/270277429_Intercomparision_of_snowfall_measured_by_weighing_and_tipping_bucket_precipitation_gauges_at_Jumla_Airport_Nepal (accessed February 15, 2022)
Ki, C. K., and Yum, S. S. (2010). Local meteorological and synoptic characteristics of fogs formed over Incheon international airport in the west coast of Korea. Adv. Atmos. Sci. 27, 761–776. doi: 10.1007/s00376-009-9090-7
Kitthanet, J. (2018). Forecasting of airport visibility [dissertation/master's thesis]. Tsinghua University.
Klotzbach, P. J., Oliver, E. C., Leeper, R. D., and Schreck, C. J III.. (2016). The relationship between the Madden–Julian oscillation (MJO) and southeastern New England snowfall. Mon. Weather. Rev. 144, 1355–1362. doi: 10.1175/MWR-D-15-0434.1
Kneringer, P., Dietz, S. J., Mayr, G. J., and Zeileis, A. (2019). Probabilistic nowcasting of low-visibility procedure states at vienna international airport during cold season. Pure Appl. Geophys. 176, 2165–2177. doi: 10.1007/s00024-018-1863-4
Kwok, R., Kacimi, S., Webster, M. A., Kurtz, N. T., and Petty, A. A. (2020). Arctic snow depth and sea ice thicknessfrom ICESat-2 and CryoSat-2 freeboards: a first examination. J. Geophys. Res. Oceans. 125, e2019JC016008. doi: 10.1029/2019JC016008
Lan, S., Clarke, J.-P., and Barnhart, C. (2006). Planning for robust airline operations: optimizing aircraft routings and flight departure times to minimize passenger disruptions. Transp. Sci. 40, 15–28. doi: 10.1287/trsc.1050.0134
Lee, J., and Yan, J. (2019). The Impact of Snowfall on Airport Operations and Delays. Availabel online at: https://scholarworks.alaska.edu/handle/11122/10653 (accessed February 15, 2022)
Leem, H. H., Kim, D. H., and Song, K. W. (2005). The importance of fog prediction at the Incheon Int'l Airport through flight delay and cancel statistics. J. Korean Soc. Aviat. Aeronaut. 13, 1–10.
Lei, Y., Letu, H., Shang, H., and Shi, J. (2020). Cloud cover over the Tibetan Plateau and eastern China: a comparison of ERA5 and ERA-Interim with satellite observations. Clim. Dyn. 54, 2941–2957. doi: 10.1007/s00382-020-05149-x
Li, L. Q., Shao, A. M., Zhang, K. J., Ding, N., and Chan, P. W. (2020). Low-level wind shear characteristics and lidar-based alerting at Lanzhou Zhongchuan international airport, China. J. Meteorol. Res. 34, 633–645. doi: 10.1007/s13351-020-9134-6
Li, X., Liu, G. C., Yan, M. C., and Zhang, W. (2007). The economic loss of airlines and passengers caused by flight delays (in Chinese). Syst. Eng. 25, 20–23.
Li, Z., Song, L., Ma, H., Xiao, J., Wang, K., and Chen, L. (2018). Observed surface wind speed declining induced by urbanization in East China. Clim. Dyn. 50, 735–749. doi: 10.1007/s00382-017-3637-6
Lin, C., Zhang, K., Chen, X., Liang, S., Wu, J., and Zhang, W. (2021). Overview of Low-Level Wind Shear Characteristics over Chinese Mainland. Atmosphere. 12, 628. doi: 10.3390/atmos12050628
Lin, J., and Qu, X. B. (2008). Spatial and temporal characteristics of thunderstorm in China (in Chinese). Meteorol Mon. 34, 22–30.
Lin, W. Q., and Chen, H. P. (2021). Changes in the spatial-temporal characteristics of daily snowfall events over the Eurasian continent from 1980 to 2019. Int. J. Climatol. 42, 1841–1853. doi: 10.1002/joc.7339
Liu, F., Tan, Q., Jiang, X., Yang, F., and Jiang, W. (2019). Effects of relative humidity and PM2.5 chemical compositions on visibility impairment in Chengdu, China. J. Environ. Sci. 86, 15–23. doi: 10.1016/j.jes.2019.05.004
Liu, Y., Li, F., Hao, W., Barriot, J. P., and Wang, Y. (2019). Evaluation of synoptic snowfall on the Antarctic Ice Sheet based on CloudSat, in-situ observations and atmospheric reanalysis datasets. Remote Sen. 11, 1686. doi: 10.3390/rs11141686
Liu, Y. L., Ren, G. Y., and Yu, H. M. (2012). Climatology of Snow in China (in Chinese). Sci. Geograph. Sin. 32, 1176–1185. doi: 10.13249/j.cnki.sgs.2012.10.014
Luo, J., Chen, H., and Zhou, B. (2020). Comparison of snowfall variations over China identified from different snowfall/rainfall discrimination methods. J. Meteorol. Res. 34, 1114–1128. doi: 10.1007/s13351-020-0004-z
Ma, M. J., Lin, C., Zhao, S. R., Zhang, K. B., Shen, H. X., and Wang, S. G. (2013). Characteristics and a numerical study of low-level wind shear over Beijing Capital International Airport (in Chinese). J. Lanzhou Univ. 49, 354–360. doi: 10.13885/j.issn.0455-2059.2013.03.005
Mäkelä, A., Saltikoff, E., Julkunen, J., Juga, I., Gregow, E., and Niemel,ä, S. (2013). Cold-season thunderstorms in Finland and their effect on aviation safety. Bull. Am. Meteorol. Soc. 94, 847–858. doi: 10.1175/BAMS-D-12-00039.1
Markovic, D., Hauf, T., Röhner, P., and Spehr, U. (2008). A statistical study of the weather impact on punctuality at Frankfurt Airport. Meteorol. Appl. 15, 293–303. doi: 10.1002/met.74
Muñoz-Sabater, J., Dutra, E., Agustí-Panareda, A., Albergel, C., Arduini, G., Balsamo, G., et al. (2021). ERA5-Land: A state-of-the-art global reanalysis dataset for land applications. Earth Syst. Sci. Data. 13, 4349–4383. doi: 10.5194/essd-13-4349-2021
National Transportation Safety Board. (1976). Special Investigation Report: Wing Failure of Boeing 747-131, near Madrid, Spain, May 9, 1976. Bureau of Technology, 38.
Niu, S. J., Lu, C. S., Yu, H. Y., Zhao, L. J., and L.ü, J. J. (2010). Fog research in China: an overview. Adv. Atmos. Sci. 27, 639–662. doi: 10.1007/s00376-009-8174-8
O'Brien, T. A., Sloan, L. C., Chuang, P. Y., Faloona, I. C., and Johnstone, J. A. (2012). Multidecadal simulation of coastal fog with regional climate model. Clim. Dyn. 40, 2801–2812. doi: 10.1007/s00382-012-1486-x
O'Gorman, P. A. (2014). Contrasting responses of mean and extreme snowfall to climate change. Nature. 512, 416–418. doi: 10.1038/nature13625
Rasmussen, R. M., Cole, J., Moore, K. R. K., and Kuperman, M. (2000). Common snowfall conditions associated with aircraft takeoff accidents. J. Aircr. 37, 110–116. doi: 10.2514/2.2568
Rasmussen, R. M., Vivekanandan, J., Cole, J., Myers, B., and Masters, C. (1999). The estimation of snowfall rate using visibility. J. Appl. Meteorol. Climatol. 38, 1542–1563.
Reynolds, D. W., Clark, D. A., Wilson, F. W., and Cook, L. (2012). Forecast-based decision support for San Francisco International Airport: a nextgen prototype system that improves operations during summer stratus season. Bull. Am. Meteorol. Soc. 93, 1503–1518. doi: 10.1175/BAMS-D-11-00038.1
Rosenberger, J. M., Schaefer, A. J., Goldsman, D., Johnson, E. L., Kleywegt, A. J., and Nemhauser, G. L. (2002). A stochastic model of airline operations. Transp. Sci. 36, 357–377. doi: 10.1287/trsc.36.4.357.551
Sauer, M., Hauf, T., Sakiew, L., Chan, P. W. T. S. E. S.-M, and Hupe, P. (2016). On the identification of weather avoidance routes in the terminal maneuvering area of Hong Kong international airport. J. Zhejiang Univ. Sci. A. 17, 171–185. doi: 10.1631/jzus.A1500186
Seliga, T. A., Hazen, D. A., and Salcedo, L. (2009). “Possible enhancements of airport operations based on runway visual range visibility measurements,” in 2009 IEEE/AIAA 28th Digital Avionics Systems Conference, Orlando, FL, USA.
Sharman, R. (2016). “Nature of aviation turbulence” in Aviation Turbulence, eds Sharman, R, and Lane, T, . (Springer, Cham).
Shun, C. M. (2004). Wind shear and turbulence alerting at Hong Kong International Airport. WMO Bull. 53, 316–320.
Song, Y., and Wei, J. (2021). Diurnal cycle of summer precipitation over the North China Plain and associated land–atmosphere interactions: Evaluation of ERA5 and MERRA-2. Int. J. Climatol. 41, 6031–6046. doi: 10.1002/joc.7166
Stratton, D. A. (1992). Aircraft guidance for wind shear avoidance: Decision-making under uncertainty. [dissertation/master's thesis]. Princeton University.
Sun, Y., Ma, Z. F., Niu, T., Fu, R. Y., and Hu, J. F. (2013). Characteristics of climate change with respect to fog days and haze days in China in the past 40 years. Clim. Environ. Res. 18, 397–406. doi: 10.3878/j.issn.1006-9585
Tarek, M., Brissette, F. P., and Arsenault, R. (2020). Evaluation of the ERA5 reanalysis as a potential reference dataset for hydrological modelling over North America. Hydrol. Earth Syst. Sci. 24, 2527–2544. doi: 10.5194/hess-24-2527-2020
Taszarek, M., Allen, J., Púcik, T., Groenemeijer, P., Czernecki, B., Kolendowicz, L., et al. (2019). A climatology of thunderstorms across Europe from a synthesis of multiple data sources. J. Clim. 32, 1813–1837. doi: 10.1175/JCLI-D-18-0372.1
Taszarek, M., Brooks, H. E., and Czernecki, B. (2017). Sounding-derived parameters associated with convective hazards in Europe. Mon. Weather. Rev. 145, 1511–1528. doi: 10.1175/MWR-D-16-0384.1
Taszarek, M., Brooks, H. E., Czernecki, B., Szuster, P., and Fortuniak, K. (2018). Climatological aspects of convective parameters over Europe: a comparison of ERA-Interim and sounding data. J. Clim. 31, 4281–4308. doi: 10.1175/JCLI-D-17-0596.1
Taszarek, M., Kendzierski, S., and Pilguj, N. (2020). Hazardous weather affecting European airports: climatological estimates of situations with limited visibility, thunderstorm, low-level wind shear and snowfall from ERA5. Weather. Clim. Extremes. 28, 100243. doi: 10.1016/j.wace.2020.100243
Taszarek, M., Pilguj, N., Allen, J. T., Gensini, V., and Szuster, P. (2021). Comparison of convective parameters derived from ERA5 and MERRA2 with rawinsonde data over Europe and north America. J. Clim. 34, 3211–3237. doi: 10.1175/JCLI-D-20-0484.1
Tian, M., Chen, J., and Zhang, J. Q. (2013). Causes analysis on an advective fog affecting visibility break process at Qionglai Airport in western Sichuan Basin (in Chinese). Plateau Mountain Meteorol. Res. 33, 77–82. doi: 10.3969/j.issn.1674-2184.2013.03.012
Vajda, A., Tuomenvirta, H., Jokinen, P., Luomaranta, A., and Athanasatos, S. (2011). Probabilities of Adverse Weather Affecting Transport in Europe: Climatology and Scenarios up to the 2050s. Helsinki: Finnish Meteorological Institute Press.
Wang, C. X., Graham, R. M., Wang, K. G., Gerland, S., and Granskog, M. A. (2019). Comparison of ERA5 and ERA-Interim near-surface air temperature, snowfall and precipitation over Arctic sea ice: effects on sea ice thermodynamics and evolution. Cryosphere. 13, 1661–1679. doi: 10.5194/tc-13-1661-2019
Wang, N., Zhu, L., Yang, H. R., and Han, L. (2017). Classification of Synoptic Circulation Patterns for Fog in the Urumqi Airport. Atmos. Clim. Sci. 7, 352–366. doi: 10.4236/acs.2017.73026
Wang, S., and Dong, Q. W. (2007). The characteristics of winter weather in Dalian Airport and its influence on flight (in Chinese). J. Civil Aviation Flight Univ. China. 18, 25–28.
Wang, Z., Hu, Z., Wang, B., Lv, C., Zhang, M., and Yu, M. (2010). “Snow disasters risk assessment in China based on environment and disaster monitoring and predicting small satellite in 2009,” in 2010 18th International Conference on Geoinformatics, Beijing, China. IEEE. 1–5.
Witiw, M. R., and LaDochy, S. (2008). Trends in Fog Frequencies in the Los Angeles Basin. Atmos. Res. 87, 293–300. doi: 10.1016/j.atmosres.2007.11.010
Wu, Y. M. (2012). The influence of airfoils ice accretion on flight safety (in Chinese). [dissertation/master's thesis]. Nanjing University of aeronautics and astronautics
Xue, X., Ren, G., Xu, X., Sun, X., Yang, G., Zhang, P., et al. (2021). The trends of warm-season thunderstorm and lightning days in China and the influence of environmental factors. J. Geophys. Res. Atmos. 126, e2021JD034950. doi: 10.1029/2021JD034950
Yang, X., and Li, Z. Q. (2014). Increases in thunderstorm activity and relationships with air pollution in southeast China. J. Geophys. Res. Atmos. 119, 1835–1844. doi: 10.1002/2013JD021224
Yang, Y., Li, Q., Song, Z., Sun, W., and Dong, W. (2022). A comparison of global surface temperature variability, extremes and warming trend using reanalysis data sets and CMST-Interim. Int. J. Climatol. 1–20. doi: 10.1002/joc.7551
Yavuz, V., Deniz, A., and Özdemir, E. T. (2021). Analysis of a vortex causing sea-effect snowfall in the western part of the black sea: a case study of events that occurred on 30–31 January 2012. Nat. Hazards. 108, 819–846. doi: 10.1007/s11069-021-04707-8
Yavuz, V., Özdemir, E. T., and Deniz, A. (2020). Nowcasting of a thunderstorm: The case study of 2 February, 2015 at Istanbul Ataturk International Airport. Mausam. 71, 21–32. doi: 10.54302/mausam.v71i1.3
Young, M. V. (2007). Severe thunderstorms over southern England on 10th May, 2006. Weather. 62, 116–120. doi: 10.1002/wea.107
Zanin, M., Zhu, Y. B., Yan, R., Dong, P. J., Sun, X. Q., and Wandelt, S. (2020). Characterization and Prediction of Air Transport Delays in China. Appl. Sci. 10, 6165. doi: 10.3390/app10186165
Zhang, H. J. (2006). A Glance of Safety Situation of World Civil Aviation Since Last August (III) (in Chinese). China Civil Aviation. 1, 65–66.
Zhang, M. F., and Feng, Z. (1998). A study on climatic features and anomalies of the thunderstorm in China (in Chinese). J. Trop. Meteorol. 14, 157–162.
Zhang, Q. H., Ni, X., and Zhang, F. Q. (2017). Decreasing trend in severe weather occurrence over china during the past 50 years. Sci. Rep. 7, 42310. doi: 10.1038/srep42310
Zhang, X. (2019). Analysis of the Climatic Characteristics at Kunming Changshui Airport (in Chinese). Adv. Meteorol. Sci. Technol. 9, 41–45. doi: 10.3969/j.issn.2095-1973.2019.01.007
Zhao, P., Xiao, H., Liu, C., Zhou, Y., Xu, X., and Hao, K. (2021). Evaluating a simple proxy for climatic cloud-to-ground lightning in Sichuan Province with complex terrain, Southwest China. Int. J. Climatol. 1–19. doi: 10.1002/joc.7451
Zhao, P., Zhang, X., Xu, X., and Zhao, X. (2011). Long-term visibility trends and characteristics in the region of Beijing, Tianjin, and Hebei, China. Atmos. Res. 101, 711–718. doi: 10.1016/j.atmosres.2011.04.019
Zheng, Y. P., Li, J. L., Liu, Z. Q., Chen, J., and Yan, Z. J. (2007). The Relation Between Heavy Fog and Low Temperature Inversion in Winter in Urumqi (in Chinese). Desert Oasis Meteorol. 1, 21–25.
Zhou, B. B., Jiang, L., and Du, J. (2016). Aviation Weather and Model-Based Operational Forecasts of Low Visibility and Fog (in Chinese). Adv. Meteorol. Sci. Technol. 6, 29–41. doi: 10.3969/j.issn.2095-1973.2016.02.003
Keywords: Chinese airports, low-level wind shear, limited visibility, thunderstorm, snowfall
Citation: Lei T, Jin C and Qi C (2022) Spatio-temporal characteristics of hazardous weather affecting Chinese airports based on the ERA5/ERA5-land reanalysis dataset. Front. Clim. 4:835362. doi: 10.3389/fclim.2022.835362
Received: 14 December 2021; Accepted: 04 July 2022;
Published: 28 July 2022.
Edited by:
Michael C. Kruk, National Centers for Environmental Information (NOAA), United StatesReviewed by:
Danang Eko Nuryanto, Indonesian Agency for Meteorology, Climatology and Geophysics, IndonesiaBo Liu, China University of Geosciences, China
Hainan Gong, Institute of Atmospheric Physics (CAS), China
Copyright © 2022 Lei, Jin and Qi. This is an open-access article distributed under the terms of the Creative Commons Attribution License (CC BY). The use, distribution or reproduction in other forums is permitted, provided the original author(s) and the copyright owner(s) are credited and that the original publication in this journal is cited, in accordance with accepted academic practice. No use, distribution or reproduction is permitted which does not comply with these terms.
*Correspondence: Chenxi Jin, amluY2hlbnhpQGJqLmNtYS5nb3YuY24=