 Ioannis Dafnomilis1*
 Hsing-Hsuan Chen1
 Michel den Elzen1,2
 Panagiotis Fragkos3Unnada Chewpreecha4Heleen van Soest1,5Kostas Fragkiadakis3Panagiotis Karkatsoulis3Leonidas Paroussos3Harmen-Sytze de Boer1
 Vassilis Daioglou5Oreane Edelenbosch1
 Bence Kiss-Dobronyi4†Detlef P. van Vuuren1,5
- 1PBL Netherlands Environmental Assessment Agency, The Hague, Netherlands
- 2Institute for Environmental Studies (IVM), Vrije Universiteit Amsterdam, Amsterdam, Netherlands
- 3E3Modelling S.A., Athens, Greece
- 4Cambridge Econometrics, Covent Garden, Cambridge, United Kingdom
- 5Copernicus Institute of Sustainable Development, Utrecht University, Utrecht, Netherlands
Despite the significant volume of fiscal recovery measures announced by countries to deal with the COVID-19 crisis, most recovery plans allocate a low percentage to green recovery. We present scenarios exploring the medium- and long-term impact of the COVID-19 crisis and develop a Green Recovery scenario using three well-established global models to analyze the impact of a low-carbon focused stimulus. The results show that a Green Recovery scenario, with 1% of global GDP in fiscal support directed to mitigation measures for 3 years, could reduce global CO2 emissions by 10.5–15.5% below pre-COVID-19 projections by 2030, closing 8–11.5% of the emissions gap with cost-optimal 2°C pathways. The share of renewables in global electricity generation is projected to reach 45% in 2030, the uptake of electric vehicles would be accelerated, and energy efficiency in the buildings and industry sector would improve. However, such a temporary investment should be reinforced with sustained climate policies after 2023 to put the world on a 2°C pathway by mid-century.
Introduction
The COVID-19 pandemic not only caused a global health and economic crisis but also had a substantial impact on carbon dioxide (CO2) emissions. The response measures reduced global CO2 emission levels in 2020 by about 6–7% compared to 2019 (Liu et al., 2020; International Energy Agency, 2021c; Le Quéré et al., 2021) and with a slightly smaller impact on total greenhouse gases (Forster et al., 2020) (GHGs). To recover from the economic crisis, many countries have pledged large sums of money to stimulate the economy and support employment (International Monetary Fund, 2020a). This means that both the pandemic and the recovery measures could affect emissions for years to come. However, the exact impact is highly uncertain given the unpredictable future course of the pandemic and the uncertainty in the implementation of recovery measures. It is expected that emissions are likely to rebound if the COVID-19 crisis eases (International Energy Agency, 2020a, 2021c, 2022; Jackson et al., 2022) and climate policies are not intensified. Nonetheless, the recovery spending could provide a unique opportunity to change this: If recovery packages would focus on accelerating the transition toward low-carbon energy and improving energy efficiency, it could be a significant boost toward reaching the Paris Agreement targets and national climate policy goals (Hans et al., 2022). In contrast, investment in fossil fuel infrastructure would lead to a possible further lock-in. Studies that can guide policy and investment decisions on this issue are thus critically needed. Certain studies on this topic are already available: IEA's Sustainable Recovery report (International Energy Agency, 2020b) provided a green recovery scenario on a global level but focused simultaneously on three overarching objectives: job creation, boosting economic growth and improving resilience and sustainability. Kikstra et al. (2021) examined different post-pandemic recovery scenarios mostly from an energy demand perspective, driven primarily by personal choices, new norms in working and commuting and downsizing of under-used energy sinks. Rochedo et al. (2021) assessed the gap between pledged recovery packages and the actual investment needs to reach the Paris Agreement goals on a global level. Hepburn et al. (2020) provided a detailed qualitative analysis of rescue packages and potential policies with emission mitigation potential. Emmerling et al. (2020); Shan et al. (2021), and Pollitt et al. (2021), analyzed fiscal stimuli and recovery scenarios but used preliminary data on COVID-19 impacts and recovery packages and their studies are based only on a single model. Allan et al. (2020), Lahcen et al. (2020), and Keane et al. (2021) performed similar work on single regions only. Bertram et al. (2021) looked into recovery projections for the power sector specifically, and other authors like Marimuthu et al. (2021), Chiappinelli et al. (2021), and Fried et al. (2021) focused on green recovery exclusively in specific sectors (mining, materials, or transport) as well. Authors like Kapeller and Wildauer (2021) and Liu et al. (2021) evaluated financial instruments like a wealth tax or replacing production taxes with taxes on GHG emissions to support a green recovery. Gusheva (2021) and Le Billon et al. (2021) approached a green recovery from a socioeconomic inequality point of view.
Most of the modeling studies (IEA, Kikstra et al., Rochedo et al.) have used earlier data and relied on a single model for their analysis. Additionally, the focus was usually a single indicator (global emissions), region or sector, or a financial mechanism's impact on recovery. We aim to go beyond these earlier works by providing a comprehensive analysis of the energy use, economic, and emission impacts of both the COVID-19 pandemic and potential green recovery packages using multiple well-established global Integrated Assessment and energy-economy models. The diversity in model structure and assumptions is a key feature of the study, since it allows us to explore the associated range of uncertainties compared to single model or single focus studies. Our analysis extends to key emitting countries and sectors, which are important for the energy transition, including electricity supply, transport, buildings and industries. Our study also provides a first comprehensive analysis of the socio-economic impacts of green recovery packages using diverse models representing different economic schools of thought (post-Keynesian vs. neo-classical).
For this purpose, we developed a Green Recovery scenario inspired by IEA's Sustainable Recovery approach but focusing on investments in measures that directly support emissions reduction in energy combustion and industrial processes. We examine the effects of such a scenario on closing the global emissions gap toward a well-below 2°C pathway compatible with the Paris goals. The scenario includes available data regarding the impacts of COVID-19 at the time of this study, and currently adopted and implemented climate-relevant policies and their impacts on energy use and emissions (Roelfsema et al., 2020). We enhance the detail and policy relevance of previous analyses by examining major emitting regions and countries as well as sectoral emissions. Additionally, our multi-model scenario comparison study enables us to examine selected energy system, macro-economic and employment indicators simultaneously that result from the implementation of our Green Recovery scenario, that has not been done yet in post-COVID-19 recovery studies. The use of three well-established global models with high regional and technology granularity enables the identification of robust insights and policy-relevant recommendations, which is not possible in single model studies, which crucially depend on the assumptions included in a single model.
Different Prospects for Green Recovery Measures
In the analysis, we compare three scenarios in order to assess the possible impact of a Green Recovery: (1) current policies in a pre-COVID-19 situation (Reference), (2) current policies including the impact of COVID-19 (COVID), and (3) the Green Recovery scenario. We implemented the scenarios in two leading macro-economic models (E3ME and GEM-E3) and one Integrated Assessment Model (IMAGE). The Reference scenario does not include the impacts of COVID-19. In contrast, in the COVID scenario, the short term (2020–2021) GDP growth rates were made consistent with official data and projections by adjusting economic activity levels and introducing sectoral shocks to reflect the observed COVID-19 socio-economic and industrial impacts (Table 1). Both the Reference and COVID scenarios assume that current climate policies are implemented. The Green Recovery scenario, in addition, assumes the implementation of a post-pandemic green recovery strategy on a global and regional level. The selection of sectors, technologies, and individual policies of our recovery strategy was decided based on the potential long-term benefits (improving energy system resilience and sustainability) and their current technology maturity and cost-effectiveness for emissions reductions. This means that the selection of policies aims to maximize emissions reduction from energy production and use, and industrial processes and are suitable for implementations for the models used here. Furthermore, the two macro-economic models allow us to capture the macro-economic and employment impacts arising from the Green Recovery scenario implementation. Land-use sector emissions are not considered in this work. We are focusing exclusively on CO2 emissions from energy combustion and industrial processes that represent ~75% of total greenhouse gas (GHG) emissions excluding land-use CO2 emissions in 2019 (United Nations Environment Programme, 2020). While the pandemic has had an impact on agricultural product supply chains and prices, its impact on agricultural and forestry emissions was much lower (Elleby et al., 2020; Forster et al., 2020; Organization for Economic Co-operation Development, 2020a; 2021). A full description of the models, scenarios and underlying assumptions can be found in the following section and Supplementary Data 1–3.
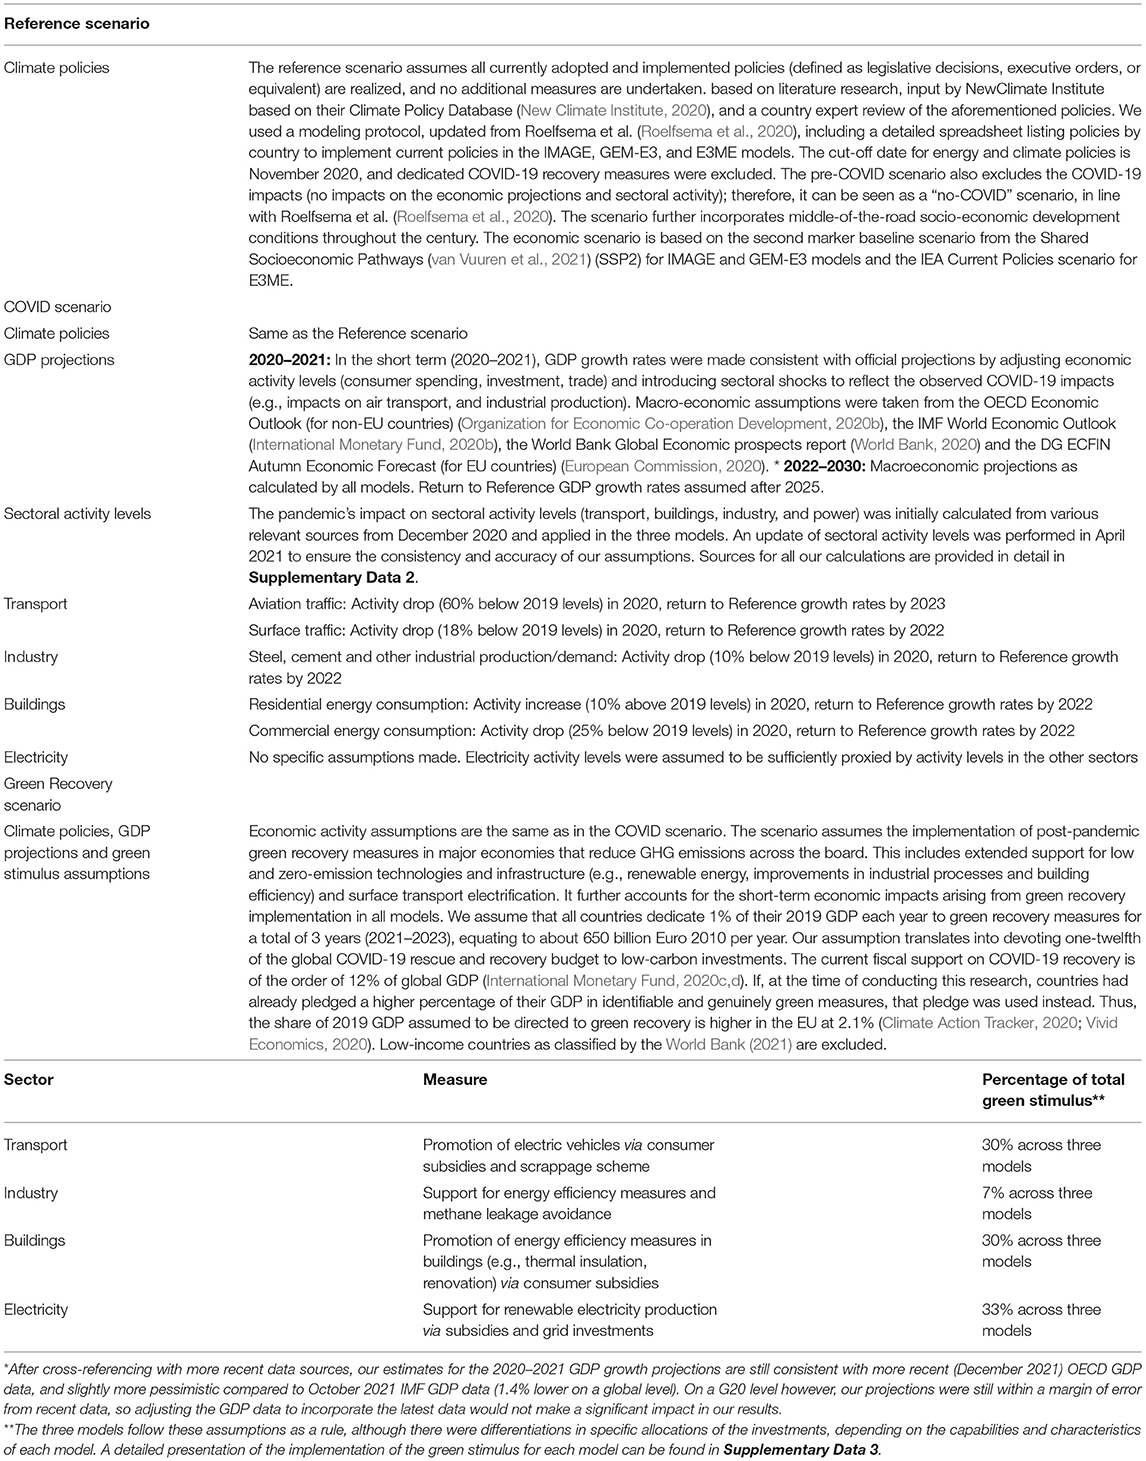
Table 1. Main assumptions and measures implemented per sector for the Reference, COVID and Green Recovery scenarios.
Methods
Models
All global model teams followed the same scenario protocol in this research for comparability. The global models were used to analyse the economic, sectoral, emission, and technological implications of the COVID and Green Recovery scenarios. The models are the integrated assessment model IMAGE (Stehfest et al., 2014; Van Vuuren et al., 2018) and two macro-economic models which are based on different schools of economic thought (neo-classical vs. post-Keynesian), i.e., E3ME (Cambridge Econometrics, 2019) and GEM-E3 (Capros et al., 2016; Fragkos et al., 2017). IMAGE was mainly used to look at the changes in the energy demand and supply and energy-related CO2 emissions due to the sectoral activity changes and the GDP impacts from COVID and green recovery packages. The macro-economic models E3ME and GEM-E3 were used to quantify the macro-economic and employment consequences of green recovery packages, including the development of clean energy technologies. Macro-economic models are valuable tools to evaluate the impacts of alternative policy options in response to the COVID-19 pandemic by identifying the economic channels through which the outbreak's direct and indirect effects manifest themselves (Lahcen et al., 2020). The three models are described in detail in Supplementary Data 1.
Scenario Description
Table 1 presents the different scenarios. The scenarios build on each other to accurately assess the progressive emissions and economic impact of the COVID-19 pandemic on the current policies trajectory and the impacts of targeted green recovery. The time horizon for the scenarios is 2030, as we wanted to examine the near future effect of such a short-term and relatively small (in absolute amounts) global fiscal stimulus. Our analysis does not assume globally coordinated action toward green recovery, as there is no optimal allocation of global recovery funds across regions. To adequately represent the current policy landscape, each country uses its own resources to support low-carbon investments (as part of green recovery packages) and their actions are fragmented, not coordinated.
The Reference or current policies scenario assumes that the main climate and energy policies in place as of November 2020 (cut-off date) are fully implemented by all countries (den Elzen et al., 2019; Kuramochi et al., 2019). We did not quantify the impacts of publicly announced plans or strategies (e.g., Nationally Determined Contributions or net-zero strategies) unless specific policy instruments support their actual implementation.
The GEM-E3 and E3ME assumptions for the COVID scenario were developed to include short-term economic impacts of COVID-19, with GDP projections from official sources as described in Table 1. The GDP projections were used to calculate other E3ME and GEM-E3 model variables (industry output, consumer spending, investment, employment, CO2 emissions). The same GDP assumptions were used in the IMAGE model, thus ensuring consistency of the analysis among models. In addition, IMAGE included the bottom-up estimations/assumptions of activity changes in key sectors, including aviation, road transport and heavy industry, as described in Supplementary Data 2. The specific implementation of the COVID scenario in the three global models is described below:
• GEM-E3's COVID scenario includes the short-term economic impacts of the COVID-19 crisis, based on official projections, and was modeled with a reduction in aggregate demand to capture the impacts of COVID-19 on specific sectors combined with a disruption in international trade and a decrease in investment and available labor and capital in 2020 to reflect reduced working time due to lockdowns, following Lahcen et al. (2020). In this process, endogenous model responses and algorithms are used to allocate growth rates to different sectors while retaining consistency at aggregated levels. After 2022, the GEM-E3 socio-economic projections revert to the same growth rates pre-COVID-19, implying a reduction of GDP, energy consumption, and CO2 emissions from pre-COVID-19 levels.
• E3ME's COVID scenario was updated to include the short-term impacts of COVID-19. These projections were based on official projections (see Table 1) and Cambridge Econometrics earlier analysis of COVID-19 (Pollitt et al., 2021). Sectors most affected by the pandemic and subsequent policies introducing lockdown measures are air transport, hotel and catering, and recreation sectors. Additionally, the pandemic causes severe disruption to trade and reduces global demand and planned investment. This leads to a reduction in manufacturing demand. The power sector also experiences a reduction in demand from transport restrictions but somewhat offset by the increase in the residential sector's energy demand. After 2021, the E3ME COVID-19 projections revert to pre-COVID-19 growth rates based on the assumption that there are no longer-term behavior changes due to the crisis.
• IMAGE's COVID scenario was modeled via (i) the calculated impact of the changes in GDP and other macro-economic indicators and (ii) a reduction in demand to capture the COVID-19 impacts on specific sectors. More explicitly, aviation and surface traffic changes were introduced, and the reductions in manufacturing demand, especially for the cement and steel sectors, were included. The residential buildings sector witnessed an increase in energy demand as more people spent more time in their homes, contrary to the service and commercial sectors which saw a decrease in energy demand. Impacts on the electricity sector were assumed to be accurately represented via the demand changes in the other sectors. In 2022, the IMAGE demand projections revert to the pre-COVID-19 growth rates, except for aviation traffic which is assumed to return to typical growth rates in 2023 (International Air Transport Association, 2020a,b). The modeling of the COVID-19 impact is described in detail in Supplementary Data 2.
The Green Recovery scenario is originally inspired by the IEA Sustainable Recovery report (International Energy Agency, 2020b). We are approaching the issue focusing specifically on maximizing emissions reduction and develop a protocol to model green recovery packages, trying to keep the Paris climate goals in reach. Societal benefits such as job creation, economic growth, industrial strengthening, etc. are not the main focus of our scenario; nevertheless, our work fully captures the potential economic and employment co-benefits of such a green recovery using two well-established macro-economic models (E3ME and GEM-E3) as a consequence of increased investments in low-carbon and energy-efficient technologies and infrastructure, rather than a driver. The IMAGE model does not endogenously project GDP and other macro-economic variables. A detailed presentation of the implementation of the green stimulus for each model can be found in Table 1 and Supplementary Data 3.
Results
GDP Trends Post-COVID
We forced the two macro-economic models to reproduce the data on the 2020 impacts on economic activity: an 8% lower global GDP than pre-COVID-19 forecasts (4.5% below 2019 levels) with differentiated impacts by country based on official data from OECD, IMF and World Bank (Figure 1A). The GDP projections assume an L-shaped recovery in level terms after 2021 (based on a strong and effective vaccination programme and no further major outbreaks). Consistent with the analysis of other institutes (OECD, World Bank, IMF, DG ECFIN), both GEM-E3 and E3ME models suggest a permanent reduction of global GDP of around 5.5% by 2030 compared to the pre-COVID-19 projection.
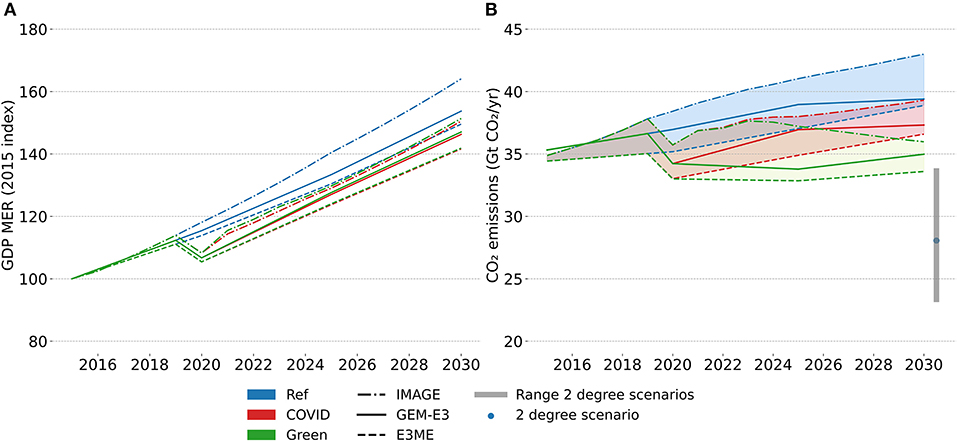
Figure 1. Global GDP and CO2 emission projections. (A) Global GDP (expressed in MER US$) between 2015 and 2030 (normalized to 2015 levels), for all scenarios, as projected by the three global models. (B) Global CO2 emission projections from energy and industrial processes between 2015 and 2030, for all scenarios. The 2°C scenario range shows the global CO2 emissions from energy and industrial processes consistent with a least cost-pathway toward limiting global average temperature increase below 2°C by 2100 with about 66% probability (van Soest et al., 2021). All results in the paper have not been adjusted with a harmonization process–we show the original data. We find that harmonization toward 2019 global CO2 emissions and GDP would reduce the range of results, as presented in Supplementary Figure 1.
Global and Regional Emission Projections
The COVID scenarios of the three models show a significant impact of the pandemic on projected global CO2 emissions from energy and industrial processes (Figure 1B): a reduction of 5.5–7% below 2019 levels in 2020, which is consistent with most recent estimates (Forster et al., 2020; Friedlingstein et al., 2020; Liu et al., 2020; International Energy Agency, 2021a,b,c). The projected global CO2 emissions for the COVID scenarios of all models reach 2019 levels around 2024–2026. The emissions trend of the COVID scenario roughly follows the Reference trends, with global CO2 emissions reaching between 5 to 8.5% below Reference levels by 2030, which is consistent with earlier studies, as summarized in the IPCC AR6 WGIII report published in April 2022 (Lecocq et al., 2022), ranging between 1.5 and 8.5%. In other words, the COVID-19 pandemic in this scenario has led to a delay in emission growth relative to pre-COVID Reference, but no change in the underlying mid-term dynamics.
Under the Green Recovery scenario, global CO2 emissions are projected to be reduced by 2.6 to 3.3 GtCO2 below the COVID scenario levels by 2030. Compared to the Reference scenario, the reduction in global emissions amounts to 4.7 to 7 GtCO2 by 2030 (about 10.5% to 16% among models). The results show that the temporarily green stimulus with a small share of overall recovery spending can have long-lasting environmental benefits in terms of reduced CO2 emissions. In all models, the emission savings go beyond 2030 as the short-term green stimulus changes the trajectory of low-carbon technologies (solar and wind, EVs, energy-efficient equipment) by encouraging increased adoption of these technologies and making them more cheaply available through learning effects. However, comparing with Paris-compatible scenarios that stay well below 2°C (Alexandri et al., 2018; Pollitt et al., 2021), it is clear that an investment increase to low-carbon technologies of only 3 years is not sufficient to change the global emissions trajectory toward such a pathway on its own. A sustained and ambitious low-carbon investment programme combined with strong climate policies to limit the consumption and production of fossil fuels would be needed for that. The 2030 emissions gap between our Green Recovery scenario and the mean of the cost-optimal well-below 2°C mitigation scenarios ranges between 17 and 25%.
It is interesting to note the different dynamics overtime between the models. IMAGE, with its focus mostly on long-term dynamics and impacts of global changes, has a higher assumed inertia in the energy system. Low-carbon investments made in 2021–2023 only materialize in 2023–2025, as proven by the COVID and Green Recovery emission trajectories being identical until 2023 and then starting to diverge. On the contrary the macro-economic model E3ME and the general equilibrium model GEM-E3 have an immediate response to the assumed investments, with benefits materializing in 2022 already (Figure 1B).
The Green Recovery scenario achieves an additional reduction of emissions from 2015 levels in all regions by 2030, compared to the COVID scenario (Figure 2). It is highly effective in the non-OECD countries that show an increase in emissions compared to 2015 levels. Emissions in the non-OECD countries Brazil, China, and India, are projected to increase in the Green Recovery scenario compared to 2015 levels, but much less than in the COVID scenario, leading to emissions levels of, on average across the models, 0.5, 12, and 35% above 2015 levels by 2030, respectively (compared to 10, 24, and 50% under the COVID scenario). Specifically for China, while the Green Recovery scenario does have a significant effect, yearly emission projections in our work show emission levels returning to 2019 levels already in 2021 in the COVID scenario, which is consistent with the latest data (Carbon Monitor, 2021; Myllivirta, 2021a,b). OECD countries, including the USA and Japan, are projected to see a further decrease of emissions, 20 and 28% below 2015 levels by 2030, respectively. Our scenario shows that the EU especially, benefits from the increased stimulus package (that amounts to more than 2% of its 2019 GDP), as Fragkiadakis and Fragkos (2020) already highlighted that the EU can benefit from low-carbon technology deployment and innovation. For the EU, the Green Recovery package further reduces emissions relative to 2015 by an additional 5% to 8% compared to the COVID scenario, reaching a mean of 35% below 2015 levels by 2030 (about 50% below 1990 levels, which brings the EU closer to its new NDC target of at least 55% emission reductions over 1990–2030 in line with the Fit-for-55 package).
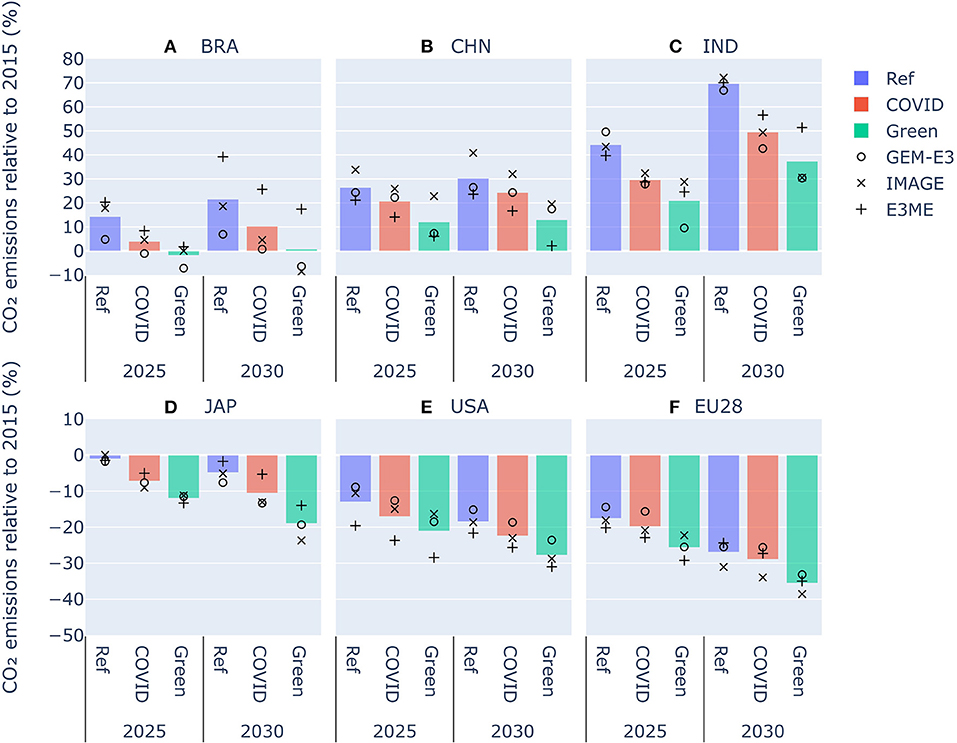
Figure 2. CO2 emission projections for major emitting regions - (A) Brazil, (B) China, (C) India, (D) Japan, (E) USA, and (F) EU28. CO2 emissions from energy and industrial processes, relative to 2015 (%), per major emitting region (panel), for 2025 and 2030 (x-axis), for all scenarios (color). Symbols indicate individual model results. The bars indicate model mean and were added for reporting reasons.
It should be noted that the models have a different starting point (the Reference scenario, i.e., their respective pre-COVID-19 current policies scenario) due to differences in the impact of current policies in the models. Their response to the COVID-19 impact as well as the green stimulus is, however, quite similar between the three models, with all showing consistent reduction in countries' emissions due to COVID-19 and the Green Recovery investments by 2030. The only noticeable exception is for India, where the Green Recovery scenario has a larger impact for IMAGE and GEM-E3 than E3ME.
In terms of sectors, the largest direct impact of the COVID-19 crisis in 2020 occurred in the transport sector (with an emissions reduction of 8–14.5% compared to Reference scenario levels across the three models), as general lockdowns and restrictions led to extensive declines in aviation activity and surface traffic, mostly related to passenger mobility. Also, in terms of absolute emissions, under the COVID scenario, the transport sector was the primary source of emissions reductions in 2020, with a reduction of 0.6–1.2 Gt CO2 compared to the Reference scenario across the three models, followed by electricity (0.05–1 Gt CO2) and industry (0.2–0.6 Gt CO2). The buildings sector was responsible for only a 0.02–0.2 Gt CO2 reduction. Its contribution to total emissions was lower than the other sectors, as a decrease in service buildings emissions was compensated by higher residential emissions due to increased teleworking and forced lockdowns. Our sectoral emission projections in 2020 are consistent with emission levels found in recent sources (see Table 1 and Supplementary Data 2).
The Green Recovery scenario reduces emissions in all sectors by 2030. The largest relative change between investments and emissions reduction occurs in the industry sector. A four times smaller amount of fiscal stimulus directed to industry (45 billion Euro per year) in comparison to the other sectors (200 billion euro), is projected to result in an additional 1% to 18% emissions reduction by 2030 compared to the COVID scenario. Investments in energy-intensive sub-sectors within the industry, such as cement and steel production, can cause significant improvements in energy efficiency resulting in large declines in CO2 emissions.
Low-carbon investments in the electricity, transport and buildings sectors in the Green Recovery scenario can achieve additional benefits to the COVID scenario, with emission reductions projected to range from 4.7% for transport to 6.6% for electricity generation in 2030 (see Supplementary Figure 2). In this scenario, additional capacity for electricity production from renewables is materialized, and better integration of renewable energy systems (solar PV and wind) in the grid is enabled. The number of electric vehicles (EVs) and efficient internal combustion engine vehicles (ICEs) are projected to increase (see following section). Energy efficiency in buildings is similarly projected to be improved due to increased thermal insulation.
Changes in the Energy System
Figure 3 shows the impact of the Green Recovery scenario on selected energy system indicators. The share of renewables in total electricity generation is projected to increase globally, accounting for 28% to 45% of global power generation in 2030 (Figure 3C), surpassing coal as the most prominent electricity-producing source. In the transport sector, electrification is promoted as the uptake of EVs accelerates, with their share in global stock increasing to 23% in 2030 from only 2% in 2020 (Figure 3D).
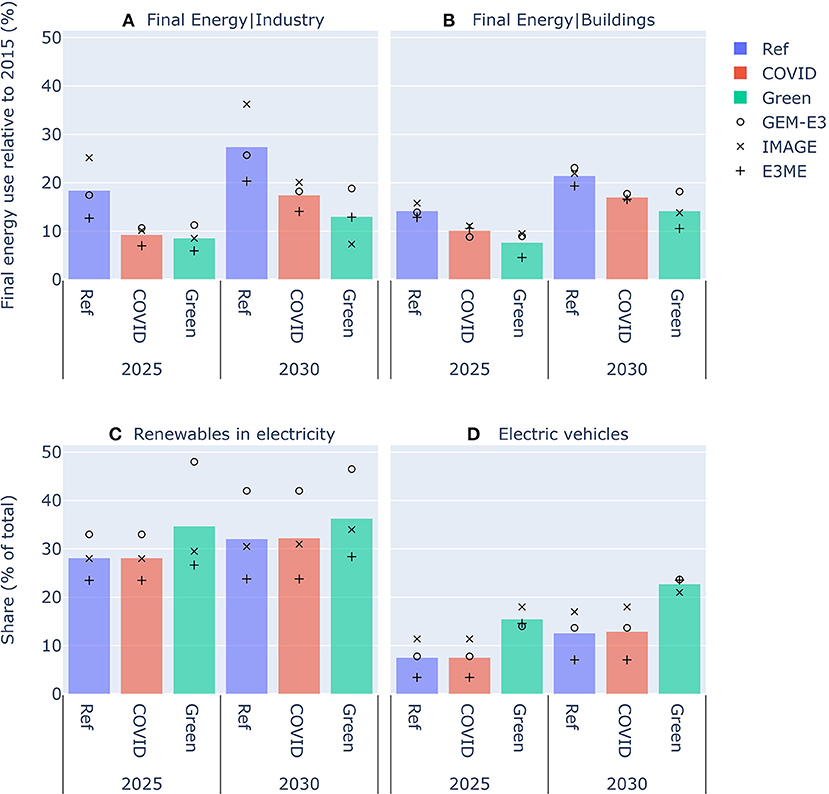
Figure 3. Selected global energy system indicators. Projected changes in selected global energy indicators, for 2025 and 2030 (x-axis), for all scenarios (color). (A,B) Final energy use in the industry and buildings sector respectively, relative to 2015 (%). (C) Share of renewables in electricity production (% of total). (D) Share of electric vehicles (% of total). Symbols indicate individual model results. The bars indicate model mean and were added for reporting reasons.
Final energy use in industry is projected to decrease by 4% (average) in 2030 compared to the COVID scenario, although remaining higher than 2015 levels (Figure 3A). The energy intensity of steel and cement production is highlighted because a relatively modest green stimulus amount is projected to reduce final energy use significantly in these two energy intensive subsectors. In the buildings sector, final energy use relative to 2015 levels is also projected to be reduced by 3% (average) by 2030 (Figure 3B) through improved thermal insulation of buildings and accelerated uptake of efficient appliances and heat pumps.
Moreover, the assumed investment of 3 billion euros a year for the 3 years of the Green Recovery scenario in preventing methane leakages from oil and gas production could have substantial results. Methane leakages are projected to be reduced by 21% in 2030 compared to 2015, with an additional 1.3 Gt CO2-eq avoided.
Macro-Economic and Employment Impacts
Our assessment shows that green recovery measures can boost activity growth in all countries triggered by increased investment in low-carbon technological options (including solar PV, onshore and offshore wind, electric vehicles, heat pumps, renovation) that offer a stimulus in global economic output. Global GDP is projected to increase by 1% to 1.5% for the duration of the green stimulus until 2023 (triggered mainly through increased investments) and later by 0.2–0.5 % in 2025 and by the same percentage in 2030, relative to the COVID scenario (Supplementary Table 2). The green recovery measures are projected to bring lasting benefits to the global economy. Investment in new infrastructure, like electricity grids and energy-efficient buildings, would improve productivity while reducing fossil fuel expenditure and driving down low-carbon technology costs through learning-by-doing effects. The costs of PV systems are decreased by 5–10% across models by 2030 compared to the COVID scenario, while wind turbine and EV costs decrease by 3–4% and 4–5.5%, respectively. As a result of green recovery and the resulting activity growth, global employment is also projected to increase relative to the COVID scenario by 0.03–0.3% over 2025–2030 (Figure 4).
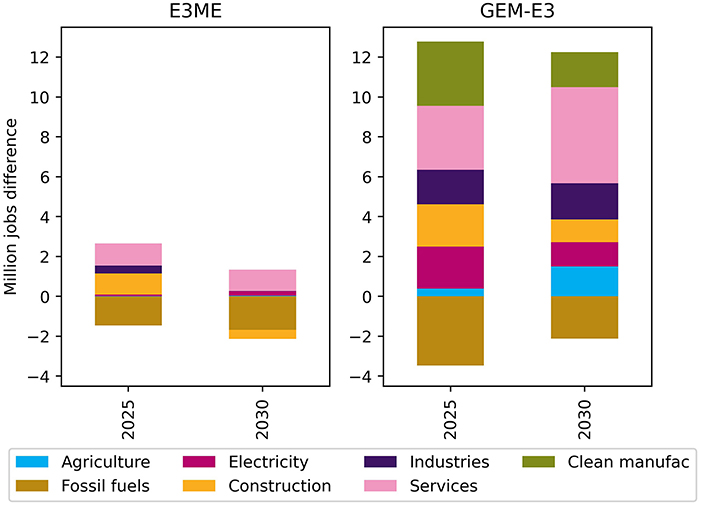
Figure 4. Changes in global employment by sector (in millions) induced by the Green Recovery scenario relative to the COVID scenario (based on E3ME results: left and GEM-E3 results: right).
The impacts on GDP are most apparent during the stimulus period when government spends to stimulate investment demand in green technologies. After the stimulus ends in 2023, GDP impacts are smaller but remain positive because of continuing benefits of the green stimulus through improved productivity and reduced clean technology costs. At regional level, there are both winners and losers from the green recovery. Countries that are net importers of fossil fuels and large low-carbon technology producers (e.g., EU, China) see increased GDP relative to COVID scenario, as the reduced fossil fuel imports are replaced by domestic activities related to energy efficiency and renewable energy supply leading to the creation of domestic green jobs. In contrast, the socio-economic impacts are limited for the US and other energy-exporting countries, as the green recovery generates less demand for fossil fuels and reduced hydrocarbon export revenues. Similarly, on employment, our results show that the green recovery will adversely affect groups of labor who are currently employed in the fossil fuel industries; therefore, the net impacts on employment from the stimulus in the long term are limited and crucially depend on labor market dynamics and the economic structure of major emitting regions.
There are many ways that government can stimulate demand in response to a crisis. What makes our green stimulus different from typical fiscal policy response to a crisis such as reduction in VAT is its long-lasting impacts on the environment by inducing reductions in global CO2 emissions. This occurs by speeding up low-carbon technology uptake and making renewable and efficient energy technology cheaper (learning effects) through subsidies and dedicated investment. Impacts on GDP and jobs beyond 2023, after the stimulus comes to an end, are mostly related to this technology transition and learning effects.
While the green recovery measures have clear but limited socio-economic benefits for major emitting economies, they trigger large changes across sectors, pointing toward an economic restructuring away from carbon-intensive industries and fossil fuel supply. Our analysis shows that most of the new jobs relative to the COVID scenario are created in the construction sector (which was severely hit by the COVID-19 crisis) triggered by the increased installation of renewable energy technologies and retrofitting of buildings. New jobs are also created in the manufacturing of clean energy technologies, particularly electric vehicles, solar PV, wind turbines and batteries. At the same time, other economic sectors (e.g., services, industry, and agriculture) also indirectly benefit from cascade effects through sectoral interdependencies. In contrast, jobs are projected to decline in fossil fuel supply sectors, as the global consumption (and production) of fossil fuels is negatively impacted by green recovery measures (Figure 4).
Employment effects projected by macro-economic models depend on the extent to which wages adjust to labor demand modifications and the availability of skill formation. Previous analysis shows that the low-carbon transition may require relatively higher labor skills. However, this is not as large as many green occupations require only a minor ‘topping up' of existing skills (Alexandri et al., 2018; Fragkos, 2018). As the labor market transformation induced by Green Recovery is not significant in magnitude (with maximum changes of 0.4–0.5% of total jobs in major economies), the stresses caused to the labor market through skill shortages would be limited but should be effectively managed to ensure a just transition.
Comparison Between Different Modeling Approaches
In this section, we are looking into earlier studies that modeled the impacts of COVID-19 and green recovery packages on global emission projections. Depending on the studies' assumptions and methodological or modeling approach used, results vary between their work and ours. Our projections show that our Green Recovery scenario reduces emissions by 6–8.5% (2.6–3.3 GtCO2) compared to the COVID scenario by 2030.
IEA's Sustainable Recovery Report (International Energy Agency, 2020b), which was also the initial inspiration for this work, has similar total investment amounts, although allocated in different low-carbon infrastructure sectors and technologies, and is the closest to our results. IEA's Recovery Plan achieves a reduction of 3.5 GtCO2 by 2025, which is similar to the reductions achieved in our work by GEM-E3 and E3ME in the same year. The exception is the IMAGE model, which, due to the assumed energy system inertia as mentioned in Section Global and Regional Emission Projections, achieves 0.8 GtCO2 of reductions by 2025.
Shan et al. (Shan et al., 2021) assume that all fiscal stimuli announced at the time of their work, ranging from 0.7 to 21% of countries' GDP, are allocated directly to high-tech industries with low-carbon technologies. They project a substantial reduction of 4.7% (6.6 GtCO2) by 2024 already but they do not give projections up to 2030.
Similarly, Pollitt et al. (2021) project a 12% emission reduction from implementing their green recovery scenario by 2030, compared to the COVID baseline projections. They assume a 5% VAT reduction until 2024, phased out by 2028, as well as investments in five measures designed to reduce CO2 emissions–renewable subsidies, grid improvements, car scrappage scheme, energy efficiency measures in buildings and reforestation initiative.
Kikstra et al. (2021) formulated their “green push” scenario based on demand-side changes that persist at least until 2025 instead of considering investments dedicated to recovery measures. Their projections indicate a downwards shift in emission trends that leads to an approximate 5 GtCO2 reduction in 2030, but with an emission trajectory parallel to their baseline assumptions of steady increase in emissions.
Finally, Rochedo et al. (2021) assume implementation of announced green recovery packages at the time amounting to USD 1 trillion over the 2020–2025 period, as investment subsidies to low-carbon technologies–solar PV, wind, electric vehicles, biofuels, heat pumps and other efficiency measures. The green recovery scenario shows a short-term decrease in emissions to 2025, which lowers to a reduction of 1 GtCO2 by 2030 compared to their COVID scenario.
Evidently, modeling approaches of green recovery packages vary significantly, based on different methodologies and numerous assumptions and factors–assumed length of the recovery period, size of the green stimuli, choice of sectors and technologies affected by incentives and others. Our study projects results that are in line with several other modeling approaches–emission reductions by 2025 and 2030 (IEA, Rochedo) and emission pathways parallel to a pre-COVID reference (Kikstra). However, it is challenging to assign a degree of efficacy to the results of different studies since the assumptions made are quite different and strongly depends on each team's modeling framework. In our work, we attempt to construct a realistic green recovery scenario and examine its potential effect via implementing the exact same assumptions in the three models of our study (to the degree that this is possible between models), in order to avoid considerable variability of results and provide more robust projected emissions under a fully implemented green recovery proposal.
Discussion and Conclusions
The impact of the COVID-19 pandemic has already mobilized governments to announce substantial investments in economic recovery plans. The planned investments could potentially be used as an opportunity to foster a low-carbon transition if efficiently implemented in crucial energy, transport, and industry sectors. Our analysis suggests that under the Green Recovery scenario, emissions are projected to reduce by 6% to 8.5% from the COVID scenario by 2030. Subsidies and technology learning stimulate the implementation of low-carbon technologies (solar PV, wind power, EVs, energy-efficient equipment). This suggests that even a temporary stimulus package (that is only a small part of the total fiscal recovery packages announced globally to this point) can potentially achieve long-lasting reduction of CO2 emissions from energy combustion and industrial processes. The share of renewables in total electricity generation is projected to increase in the Green Recovery scenario in all major economies. The uptake of electric vehicles accelerates significantly relative to the COVID scenario, and final energy savings in industry and building sectors lead to additional emission reduction. An important finding is that increasing the share of industry decarbonisation in stimulus packages would result in significant emission benefits due to the current high energy intensity of industrial processes–in our scenarios, a four times lower stimulus package directed to industry resulted in almost comparable savings in emissions to the other sectors. Finally, small investments in preventing methane leakages from oil and gas production also result in significant emissions reductions in a sector that was mostly unaffected by the pandemic (International Energy Agency, 2020b).
The increase in low-carbon investment provides a strong economic stimulus, thereby promoting GDP growth. Investment in new infrastructure, like electricity grids and efficient buildings, is projected to improve overall productivity. Employment is also positively affected, with 2 to 10 million jobs saved or created by 2030 relative to the COVID scenario, representing an increase of 0.03–0.3% across models. The recovery packages imply an opportunity to create new jobs (especially in sectors severely hit by the recent crisis, such as construction), boost sustainable economic growth and reduce emissions, if public spending is directed to productive investment and efficient technologies. Increased GDP growth on its own, however, may lead to a “rebound” effect in global emissions triggered by increased activity and energy consumption if not combined with ambitious climate policies.
Our findings showcase the multiple benefits a green recovery stimulus can have, in terms of minimizing CO2 emissions from energy combustion and industrial processes and upscaling low-carbon technologies. As described in detail in Section Global and Regional Emission Projections, green recovery projections from previous research vary considerably depending on modeling approach, assumptions used etc. The projected emission reduction estimates in our work are in line with certain results of earlier studies as (see Section Global and Regional Emission Projections). The common denominator in all previous modeling of green recovery as well as in work performed on a more qualitative level on the subject (Corkal and Gass, 2020; Hepburn et al., 2020; Le Billon et al., 2021; Liu et al., 2021; Geels and Pereira, 2022; Tian et al., 2022; Werikhe, 2022), however is: green stimuli on their own are not enough to change the emissions trajectory on a global level toward meeting the Paris Agreement climate goals. The green recovery packages need to be embedded in each country's (development) context and tied to pre-existing criteria to maximize synergies, sustainability, and socio-economic benefits. Green strings should be attached to recovery policies directed to traditionally fossil intensive industries. This means that also national analysis on recovery packages will be needed to support further policymaking, with tailor-made recommendations for specific countries. While post-COVID-19 land-use change emissions are excluded from this study, a comprehensive national recovery package should take the land-use sector into account as well. The emissions gap remaining for a trajectory leading to a well-below 2°C pathway is still considerable by 2030, to the range of 17% to 25%. Reinforcing Green Recovery scenarios with more ambitious climate policies is required to lead to economic restructuring toward such a pathway in the medium and longer term.
Finally, despite inherent differences in the models (that allow us to explore the associated range of uncertainties), evident in the response time to our green stimulus packages and the variations in the current policy initial scenarios, all models show a relatively similar reaction trend to our green recovery measures. This solidifies the robustness of our approach, as appropriate choices of investments and selection of sectors/policies results in similar projected benefits across the whole economy and energy system.
Further research on green recovery could include examination of broadening the variety of measures where the recovery packages are allocated, i.e., value-added tax (VAT) reductions (Pollitt et al., 2021) or support for low-carbon public transport options. An expansion of the time horizon to 2050 will also provide additional insight in the longer-term impacts of such recovery packages or potentially explore the impact of timing in green recovery actions, with some countries acting as front runners and other following later (or not). However, such analysis requires the collection of information on each country recovery programmes and their implementation to make informed decisions on the “front runners” vs. “laggards”, which is very challenging and requires targeted resources. Finally, an update of our analysis on implemented measures (once enough countries have verified their commitments) can produce a clearer picture on what a realistic recovery from COVID-19 will look like on a global, regional, and sectoral level.
Data Availability Statement
The raw data supporting the conclusions of this article will be made available by the authors, without undue reservation.
Author Contributions
ID led the study design with the help of H-HC, PF, UC, ME, and DV, coordinated the analysis and drafted the paper. ID and H-HC performed the data analysis of the model results. ID, ME, H-HC, HS, PF, UC, and DV contributed to the analysis, provided feedback, and refined the draft paper. H-HC created and refined the figures supported by ID. ID, H-HC, H-SB, VD, OE, and DV developed and implemented the scenarios for the IMAGE model. PF, KF, PK, and LP developed and implemented the scenarios for the GEM-E3 model. UC and BK-D developed and implemented the scenarios for the E3ME model. All authors contributed to the article and approved the submitted version.
Funding
This work is supported by the European Union's Horizon 2020 research and innovation programme (Grant Agreement No. 821471: ENGAGE and Grant Agreement No. 821124: NAVIGATE).
Conflict of Interest
PF, KF, PK, and LP are employed by E3Modelling S.A.
The remaining authors declare that the research was conducted in the absence of any commercial or financial relationships that could be construed as a potential conflict of interest.
Publisher's Note
All claims expressed in this article are solely those of the authors and do not necessarily represent those of their affiliated organizations, or those of the publisher, the editors and the reviewers. Any product that may be evaluated in this article, or claim that may be made by its manufacturer, is not guaranteed or endorsed by the publisher.
Supplementary Material
The Supplementary Material for this article can be found online at: https://www.frontiersin.org/articles/10.3389/fclim.2022.840933/full#supplementary-material
References
Alexandri, E., Fragkiadakis, K., Fragkos, P., and Paroussos, L. (2018). A Technical Analysis on Decarbonisation Scenarios - Constraints, Economic Implications and Policies. Available online at: https://ec.europa.eu/energy/sites/ener/files/documents/technical_analysis_decarbonisation_scenarios.pdf.
Allan, J., Donovan, C., Ekins, P., Gambhir, A., Hepburn, C., and Reay, D. (2020). A net-zero emissions economic recovery from COVID-19. Available online at: https://www.gla.ac.uk/media/Media_758105_smxx.pdf
Bertram, C., Luderer, G., Creutzig, F., Bauer, N., Ueckerdt, F., and Malik, A. (2021). COVID-19-induced low power demand and market forces starkly reduce CO2 emissions. Nat. Clim. Chang. 11, 193–196. doi: 10.1038/s41558-021-00987-x
Cambridge Econometrics (2019). Model Manual (V6, 1. temporary update) E3ME Technical Manual v6.1. www.camecon.com
Capros, P., de Vita, A., Tasios, N., Siskos, P., Kannavou, M., Petropoulos, A., et al. (2016). Energy, transport and GHG emissions Trends to 2050 - EU Reference Scenario 2016.
Carbon Monitor (2021). Available online at: https://carbonmonitor.org/ (accessed December 15, 2021).
Chiappinelli, O., Gerres, T., Neuhoff, K., Lettow, F., Coninck, H. d. e., and Felsmann, B. (2021). A green COVID-19 recovery of the EU basic materials sector: identifying potentials, barriers and policy solutions. Clim. Policy. 21, 1328–46. doi: 10.1080/14693062.2021.1922340
Climate Action Tracker (2020). Pandemic recovery: Positive intentions vs policy rollbacks, with just a hint of green - Warming Projections Global Update Pledges.
Corkal, V., and Gass, P. (2020). Green Strings: Principles and Conditions for a Green Recovery From COVID-19 in Canada. Winnipeg, MB: International Institute for Sustainable Development. Available online at: https://www.iisd.org/system/files/2020-07/green-strings-covid-19-canada-en.pdf
den Elzen, M., Kuramochi, T., Höhne, N., Cantzler, J., Esmeijer, K., Fekete, H., et al. (2019). Are the G20 economies making enough progress to meet their NDC targets? Energy Policy. 126, 238–250. doi: 10.1016/j.enpol.2018.11.027
Elleby, C., Domínguez, I. P., and Adenauer, M. (2020). Impacts of the COVID-19 pandemic on the global agricultural markets. Environ. Resour. Econ. 76, 1067–1079. doi: 10.1007/s10640-020-00473-6
Emmerling, J., Fragkiadakis, K., Fragkos, P., Gulde, R., Kriegler, E., and Mercure, J. F. (2020). Policy Brief: Impacts of COVID-19 and Recovery Packages on Climate Change Mitigation Action – First Results From the NAVIGATE Project. Available online at: https://www.navigate-h2020.eu/policy-brief-on-first-research-results-of-the-navigate-project-on-impacts-of-covid-19/ (accessed April 26, 2021).
European Commission (2020). Summer Economic Forecast 2020. Available online at: https://ec.europa.eu/info/sites/default/files/economy-finance/summer_2020_economic_forecast_-_statistical_annex.pdf (accessed April 26, 2021).
Forster, P. M., Forster, H. I., Evans, M. J., Gidden, M. J., Jones, C. D., and Keller, C. A. (2020). Current and future global climate impacts resulting from COVID-19. Nat. Clim. Chang. 10, 913–919. doi: 10.1038/s41558-020-0883-0
Fragkiadakis, K., and Fragkos, P. (2020). Low-Carbon RandD Can Boost EU Growth and Competitiveness. Energies. 13, 5236. doi: 10.3390/en13195236
Fragkos, P. (2018). Employment creation in EU related to renewables expansion. Appl. Energy. 230, 935–945. doi: 10.1016/j.apenergy.2018.09.032
Fragkos, P., Tasios, N., Paroussos, L., and Capros, P. (2017). Energy system impacts and policy implications of the European Intended Nationally Determined Contribution and low-carbon pathway to 2050. Energy Policy. 100, 216–226. doi: 10.1016/j.enpol.2016.10.023
Fried, T., Welle, B., and Avelleda, S. (2021). Steering a Green, Healthy, and Inclusive Recovery through Transport Working Paper. Washington, DC: World Resources Institute. doi: 10.46830/wriwp.20.00134
Friedlingstein, P., O'Sullivan, M., Jones, M., Andrew, R., Hauck, J., and Olsen, A. (2020). Global Carbon Budget 2021. Earth Syst. Sci. Data Discuss. 1–3. doi: 10.5194/essd-2021-386
Geels, F. W., and Pereira, G. I. (2022). Moving beyond opportunity narratives in COVID-19 green recoveries: a comparative analysis of public investment plans in France, Germany, and the United Kingdom. Energy Res. Soc. Sci. 84, 102368. doi: 10.1016/j.erss.2021.102368
Gusheva, E. (2021). Can we have our cake and eat it? A review of the debate on green recovery from the COVID-19 Crisis. Sustainability. 13, 874. doi: 10.3390/su13020874
Hans, F., Woollands, S., Nascimento, L., and Höhne, N. (2022). Unpacking the COVID-19 rescue and recovery spending: an assessment of implications on greenhouse gas emissions towards 2030 for key emitters. Clim. Action. 1, 1–15. doi: 10.1007/s44168-022-00002-9
Hepburn, C., O'Callaghan, B., Stern, N., and Stiglitz, J. (2020). Will COVID-19 fiscal recovery packages accelerate or retard progress on climate change? Oxford Rev. Econ. Policy. 36, 46. doi: 10.1093/oxrep/graa015
International Air Transport Association (2020a). IATA - Recovery Delayed as International Travel Remains Locked Down. Available online at: https://www.iata.org/en/pressroom/pr/2020-07-28-02/ (accessed April 23, 2021).
International Air Transport Association (2020b). IATA - Don't Make A Slow Recovery More Difficult with Quarantine Measures. https://www.iata.org/en/pressroom/pr/2020-05-13-03/ (accessed April 23, 2021).
International Energy Agency (2020a). World Energy Outlook 2020-Analysis -IEA. Paris: International Energy Agency. Available online at: https://www.iea.org/reports/world-energy-outlook-2020
International Energy Agency (2020b). A Sustainable Recovery Plan for the Energy Sector. Paris: International Energy Agency. Available online at: https://www.iea.org/reports/sustainable-recovery/asustainable-recovery-plan-for-the-energy-sector
International Energy Agency (2021a). World Energy Outlook 2021 -Revised Version. Paris: International Energy Agency.
International Energy Agency (2021b). Global Energy Review 2021. Paris: International Energy Agency. Available online at: https://iea.blob.core.windows.net/assets/d0031107-401d-4a2f-a48b-9eed19457335/GlobalEnergyReview2021.pdf
International Energy Agency (2021c). Global Energy and CO2 Emissions in 2020- Global Energy Review 2020. Paris: International Energy Agency. Available online at: https://www.iea.org/reports/global-energy-review-2020/global-energy-and-co2-emissions-in-2020
International Energy Agency (2022). Global Energy Review: CO2 Emissions in 2021 – Analysis. Available online at: https://www.iea.org/reports/global-energy-review-co2-emissions-in-2021-2.
International Monetary Fund (2020a). Fiscal Monitor Database of Country Fiscal Measures in Response to the COVID-19 Pandemic. Washington, DC: International Monetary Fund. Available online at: https://www.imf.org/en/Topics/imf-and-covid19/Fiscal-Policies-Database-in-Response-to-COVID-19 (accessed June 15, 2020).
International Monetary Fund (2020b). World Economic Outlook Update, June 2020: A Crisis Like No Other, An Uncertain Recovery. Washington, DC: International Monetary Fund. Available online at: https://www.imf.org/en/Publications/WEO/Issues/2020/06/24/WEOUpdateJune2020
International Monetary Fund (2020c). Fiscal Policies Database. Washington, DC: International Monetary Fund. Available online at: https://www.imf.org/en/Topics/imf-and-covid19/Fiscal-Policies-Database-in-Response-to-COVID-19 (accessed July 23, 2020).
International Monetary Fund (2020d). Fiscal Monitor, October 2020 - Policies for the Recovery. Washington, DC: International Monetary Fund. Available online at: https://www.imf.org/en/Publications/FM/Issues/2020/09/30/october-2020-fiscal-monitor
Jackson, R. B., Friedlingstein, P., Le Quéré, C., Abernethy, S., Andrew, R. M., and Canadell, J. G. (2022). Global fossil carbon emissions rebound near pre-COVID-19 levels. Environ. Res. Lett. 17, 031001. doi: 10.1088/1748-9326/ac55b6
Kapeller, J., and Wildauer, R. (2021). A European Wealth Tax for a Fair and Green Recovery. Linz: Institute for Comprehensive Analysis of the Economy.
Keane, J., Cao, Y., Tanjangco, B., Ahmad, M., and Johnson, D. (2021). Driving a Green Recovery in Developing Countries What Role is China Playing? Available online at: https://cdn.odi.org/media/documents/Green_Recovery_Report_Final.pdf
Kikstra, J. S., Vinca, A., Lovat, F., Boza-Kiss, B., van Ruijven, B., and Wilson, C. (2021). Climate mitigation scenarios with persistent COVID-19-related energy demand changes. Nat. Energy. 1–10. doi: 10.1038/s41560-021-00904-8
Kuramochi, T., Nascimento, L., de Vilafranca Casas, M. J., Fekete, H., de Vivero, G., Lui, S., et al. (2019). Greenhouse Gas Mitigation Scenarios for Major Emitting Countries - Analysis of Current Climate Policies and Mitigation Commitments: 2019 Update. Available online at: http://newclimate.org/publications/
Lahcen, B., Brusselaers, J., Vrancken, K., Dams, Y., Silva Paes, D., Eyckmans, C., et al. (2020). Green recovery policies for the COVID-19 crisis: modelling the impact on the economy and greenhouse gas emissions. Environ. Resour. Econ. 76, 731–750. doi: 10.1007/s10640-020-00454-9
Le Billon, P., Lujala, P., Singh, D., and Culbert, V. (2021). Fossil fuels, climate change, and the COVID-19 crisis: pathways for a just and green post-pandemic recovery. Clim. Policy. doi: 10.1080/14693062.2021.1965524
Le Quéré, C., Peters, G. P., Friedlingstein, P., Andrew, R. M., Canadell, J. G., and Davis, S. J. (2021). Fossil CO2 emissions in the post-COVID-19 era. Nat. Clim. Chang. 11, 197–199. doi: 10.1038/s41558-021-01001-0
Lecocq, F., Winkler, H., Daka, J. P., Fu, S., Gerber, J. S., and Kartha, S. (2022). “Mitigation and development pathways in the near- to mid-term”, in IPCC, 2022: Climate Change 2022: Mitigation of Climate Change. Contribution of Working Group III to the Sixth Assessment Report of the Intergovernmental Panel on Climate Change.
Liu, L-. J., Yao, Y-. F., Liang, Q-. M., Qian, X-. Y., Xu, C-. L., and Wei, S-. Y. (2021). Combining economic recovery with climate change mitigation: a global evaluation of financial instruments. Econ. Anal. Policy. 009. doi: 10.1016/j.eap.2021.09.009
Liu, Z., Ciais, P., Deng, Z., Lei, R., Davis, S. J., and Feng, S. (2020). Near-real-time monitoring of global CO2 emissions reveals the effects of the COVID-19 pandemic. Nat. Commun. 11, 1–12. doi: 10.1038/s41467-020-20254-5
Marimuthu, R., Sankaranarayanan, B., Ali, S. M., and Karuppiah, K. (2021). Green recovery strategies for the mining industry of India: lessons learned from the COVID-19 pandemic. J. Asia Bus. Stud. doi: 10.1108/JABS-05-2021-0179. [Epub ahead of print].
Myllivirta, L. (2021a). Analysis: China's Carbon Emissions Grow at Fastest Rate for More Than a Decade - Carbon Brief . Available online at: https://www.carbonbrief.org/analysis-chinas-carbon-emissions-grow-at-fastest-rate-for-more-than-a-decade (accessed September 1, 2021).
Myllivirta, L. (2021b). Analysis: China's CO2 Emissions Surged 4% in Second Half of 2020 - Carbon Brief. Available online at: https://www.carbonbrief.org/analysis-chinas-co2-emissions-surged-4-in-second-half-of-2020 (accessed September 1, 2021).
New Climate Institute (2020). Climate Policy Database. Available online at: https://climatepolicydatabase.org/
Organization for Economic Co-operation Development (2020a). The Impact of COVID-19 on Agricultural Markets and GHG Emissions. Paris: Organization for Economic Co-operation and Development. Available online at: https://read.oecd-ilibrary.org/view/?ref=1059_1059106-6g8ilorfb1&title=The-impact-of-COVID-19-on-agricultural-markets-and-GHG-emissions
Organization for Economic Co-operation and Development (2020b). OECD Economic Outlook, Interim Report Coronavirus (COVID-19): Living With Uncertainty. Paris: Organization for Economic Co-operation and Development.
Organization for Economic Co-operation Development (2021). The Long-Term Environmental Implications of COVID-19. Paris: Organization for Economic Co-operation and Development. Available online at: https://read.oecd-ilibrary.org/view/?ref=1095_1095163-jpelnkdei2&title=The-long-term-environmental-implications-of-COVID-19
Pollitt, H., Lewny, R., and Kiss-Dobronyi, B. (2021). Modelling the economic effects of COVID-19 and possible green recovery plans: a post-Keynesian approach. Clim. Policy. 21, 1257–1271. doi: 10.1080/14693062.2021.1965525
Rochedo, P. R. R., Fragkos, P., Garaffa, R., Couto, L. C., Baptista, L. B., and Cunha, B. S. L. (2021). Is green recovery enough? Analysing the impacts of post-COVID-19 economic packages. Energies. 14, 5567. doi: 10.3390/en14175567
Roelfsema, M., van Soest, H. L., Harmsen, M., van Vuuren, D. P., Bertram, C., Elzen, M., et al. (2020). Taking stock of national climate policies to evaluate implementation of the Paris agreement. Nat. Commun. 11, 1–12. doi: 10.1038/s41467-020-15414-6
Shan, Y., Ou, J., Wang, D., Zeng, Z., Zhang, S., and Guan, D. (2021). Impacts of COVID-19 and fiscal stimuli on global emissions and the Paris Agreement. Nat. Clim. Chang. 11, 200–206. doi: 10.1038/s41558-020-00977-5
Stehfest, E., van Vuuren, D. P., and Kram, T. (2014). Integrated Assessment of Global Environmental Change with IMAGE 3, 0. The Hague: PBL Netherlands Environmental Assessment Agency.
Tian, J., Yu, L., Xue, R., and Zhuang, S. (2022). Global low-carbon energy transition in the post-COVID-19 era. Appl. Energy. 307, 118205. doi: 10.1016/j.apenergy.2021.118205
United Nations Environment Programme (2020). Emissions Gap Report 2020 |UNEP - UN Environment Programme. Nairobi: United Nations Environment Programme. Available online at: https://www.unep.org/emissions-gap-report-2020
van Soest, H. L., Aleluia, Reis L., Bernardo, Baptista L., Bertram, C., Després, J., and den Elzen, M. A global roll-out of nationally relevant policies bridges the emissions gap. (2021) Nat. Commun. doi: 10.21203/rs.3.rs-126777/v1.
van Vuuren, D. P., Stehfest, E., Gernaat, D., Boer, H.-S., Daioglou, V., and Doelman, J. (2021). The 2021 SSP Scenarios of the IMAGE 3, 2. Model. The Hague: PBL Netherlands Environmental Assessment Agency.
Van Vuuren, D. P., Stehfest, E., Gernaat, D. E. H. J., Van Den Berg, M., Bijl, D. L., De Boer, H. S., et al. (2018). Alternative pathways to the 1.5 °c target reduce the need for negative emission technologies. Nat. Clim. Chang. 8, 391–397. doi: 10.1038/s41558-018-0119-8
Werikhe, A. (2022). Towards a green and sustainable recovery from COVID-19. Curr. Res. Environ. Sustain. 4, 100124. doi: 10.1016/j.crsust.2022.100124
World Bank (2020). Global Economic Prospects, June 2020. Global Economic Prospects, June 2020. Washington, DC: World Bank. Available online at: https://openknowledge.worldbank.org/handle/10986/33748
World Bank (2021). Low Income | Data. Available online at: https://data.worldbank.org/country/XM
Keywords: COVID-19, green recovery, green stimulus, energy transition, CO2 emissions, Paris Agreement
Citation: Dafnomilis I, Chen H-H, den Elzen M, Fragkos P, Chewpreecha U, van Soest H, Fragkiadakis K, Karkatsoulis P, Paroussos L, de Boer H-S, Daioglou V, Edelenbosch O, Kiss-Dobronyi B and van Vuuren DP (2022) Targeted Green Recovery Measures in a Post-COVID-19 World Enable the Energy Transition. Front. Clim. 4:840933. doi: 10.3389/fclim.2022.840933
Received: 21 December 2021; Accepted: 10 May 2022;
Published: 07 June 2022.
Edited by:
Renata Goncalves Tedeschi, Vale Technological Institute (ITV), BrazilReviewed by:
Dilip Khatiwada, Royal Institute of Technology, SwedenMaria Cristina Celuppi, Mackenzie Presbyterian University, Brazil
Copyright © 2022 Dafnomilis, Chen, den Elzen, Fragkos, Chewpreecha, van Soest, Fragkiadakis, Karkatsoulis, Paroussos, de Boer, Daioglou, Edelenbosch, Kiss-Dobronyi and van Vuuren. This is an open-access article distributed under the terms of the Creative Commons Attribution License (CC BY). The use, distribution or reproduction in other forums is permitted, provided the original author(s) and the copyright owner(s) are credited and that the original publication in this journal is cited, in accordance with accepted academic practice. No use, distribution or reproduction is permitted which does not comply with these terms.
*Correspondence: Ioannis Dafnomilis, SW9hbm5pcy5EYWZub21pbGlzQHBibC5ubA==
†Present address: Bence Kiss-Dobronyi, Corvinus University of Budapest, Budapest, Hungary