- 1School of Earth Sciences, The University of Melbourne, Melbourne, VIC, Australia
- 2Australian Research Council Centre of Excellence for Climate Extremes, The University of Melbourne, Melbourne, VIC, Australia
- 3Institute for Marine and Antarctic Studies, University of Tasmania, Hobart, TAS, Australia
- 4Australian Research Council Centre of Excellence for Climate Extremes, University of Tasmania, Hobart, TAS, Australia
- 5Department of Oceanography, Dalhousie University, Halifax, NS, Canada
A systematic analysis of historical and modeled marine heatwaves (MHWs) off eastern Tasmania has been performed based on satellite observations and a high–resolution regional ocean model simulation, over the period from 1994–2016. Our analysis suggests that the distribution of large and intense mesoscale warm core eddies off northeast Tasmania contribute to the development of MHWs further south associated with changes in the circulation and transports. Importantly, we find that eddy distributions in the Tasman Sea can act as predictors of MHWs off eastern Tasmania. We used self-organizing maps to distinguish sea surface height anomalies (SSHA) and MHWs into different, but connected, patterns. We found the statistical model performs best (precision ~ 0.75) in the southern domain off eastern Tasmania. Oceanic mean states and heat budget analysis for true positive and false negative marine heatwave events revealed that the model generally captures ocean advection dominated MHWs. Using SSHA as predictor variable, we find that our statistical model can forecast MHWs off southeast Tasmania up to 7 days in advance above random chance. This study provides improved understanding of the role of circulation anomalies associated with oceanic mesoscale eddies on MHWs off eastern Tasmania and highlights that individual MHWs in this region are potentially predictable up to 7 days in advance using mesoscale eddy-tracking methods.
Introduction
Historically, ocean temperature extremes have received less attention compared to other extreme events, such as sea-level extremes. However, with the increased frequency, intensity and ecological impacts from marine heatwaves (MHWs), these discrete and prolonged warm ocean temperature extremes are now gaining considerable attention (Pearce and Feng, 2013; Wernberg et al., 2013; Di Lorenzo and Mantua, 2016; Holbrook et al., 2019, 2020; Smale et al., 2019). MHWs can have substantial and even devastating impacts on ecosystems (Smale et al., 2019), including the redistribution of marine species, mass mortality and increased disease occurrences (Perry et al., 2005; Garrabou et al., 2009; Mills et al., 2013; Wernberg et al., 2013; Oliver et al., 2017). At the front line of climate change, marine waters off eastern Tasmania have been warming much more rapidly than the global average rate (Hobday and Pecl, 2014), largely due to increased transports in the East Australian Current (EAC) Extension (Ridgway, 2007). Further, marine ecosystems have been impacted, including through changes in their range, by increases in sea surface temperature (SST) under the influence of climate change (Johnson et al., 2011; Last et al., 2011; Oliver, 2019). Research has shown that the dominant drivers of surface MHWs are either anomalous warm-water advection or increased net downward heat flux – in particular, associated with atmospheric high-pressure systems, clear sky conditions, reduced wind speed and associated low evaporation –, or a combination (Pearce and Feng, 2013; Benthuysen et al., 2014; Oliver et al., 2017; Holbrook et al., 2019; Sen Gupta et al., 2020). However, it is important to also note that mixing and diffusion may also play a role. The importance of the individual processes to MHWs can be usefully analyzed using temperature or heat budget analyses (Benthuysen et al., 2014; Oliver et al., 2017; Holbrook et al., 2019).
The EAC – the western boundary current of the South Pacific Gyre (e.g., Ganachaud et al., 2014) – and its Extension provide the key warming source (through ocean advection) for Tasman Sea waters off eastern Tasmania. When the southward flowing EAC and its Extension intensifies, in the mean (Ridgway, 2007; Ridgway and Hill, 2009; Oliver and Holbrook, 2014) and eddy transports (Matear et al., 2013; Oliver et al., 2015), the waters off eastern Tasmania can become anomalously warm. For example, an intensification of the EAC Extension induced an unprecedented MHW in the Tasman Sea during the summer of 2015/16, which lasted more than 8 months and had a peak intensity ~3°C above climatology (Oliver et al., 2017). This MHW resulted in blacklip abalone mortality off southeast Tasmania, reports of Pacific Oyster Mortality Syndrome, and poor performance in salmon aquaculture (Oliver et al., 2017), with significant economic losses in the region. These impacts have motivated us to improve physical understanding of the mechanisms that underpin MHWs in this region, their predictability, and to develop a statistical model that can potentially predict them.
Although a large proportion of the EAC separates from the coast just north of Sydney (Godfrey et al., 1980), some of the flow is also transported southward as the EAC Extension, along the east side of Bass Strait, reaching the east coast of Tasmania (e.g., Ridgway and Dunn, 2003). Further, it becomes the dominant oceanic input off northeast Tasmania during the summer season (Cresswell and Legeckis, 1986). The EAC sheds large anticyclonic and cyclonic eddies at the separation points, forming a typical counter–rotating eddy dipole structure (Malan et al., 2020). The EAC–induced eddy distributions are characterized by strong eddy kinetic energy (Li et al., 2021), making the EAC Extension an unsteady flow, dominated by mesoscale eddies due to its separation from the coast (Nilsson and Cresswell, 1980; Everett et al., 2012; Van Sebille et al., 2012), and positions the Tasman Sea as an eddy-rich region globally (Chelton et al., 2011). The EAC transport has increased significantly in recent decades, characterized by strong positive ocean heat content trends in the southern extension zone, which is linked to the formation of anticyclonic eddies (Li et al., 2022). These eddies modify the water properties by transporting warm or cold water anomalies southward, and thus influence the biological and chemical characteristics of the water masses off eastern Tasmania. In the context of the focus of this study, it is valuable to explore how the eddy activity contributes to the occurrences of MHWs in this region and how predictable they might be. The importance of the eddy pathway that heads poleward along Australia's southeast coast, where sea surface height anomalies are larger due to the more intense eddy circulation, has been explicitly recognized by Everett et al. (2012) who identified an 'Eddy Avenue' with a high abundance of eddies between 32°S and 39°S. Respectively, the present study further acknowledges the importance of eddy distributions further south in the Extension within the Tasman Sea as a potential source of predictability for MHWs off eastern Tasmania.
In the present study, we examine the connection between MHWs and dynamic sea surface height anomaly patterns in the Tasman Sea as a source of MHW potential predictability. Specifically, we developed a statistical model to predict MHW likelihoods off eastern Tasmania based on self-organizing maps. We demonstrate that the model is skilful, with lead times of up to 7 days. The paper is structured as follows: Section Materials and methods describes materials and methods used in this study, including oceanic data, algorithms for the detection and tracking or eddies, self–organizing maps, the detection of MHWs, and descriptions of heat budget analysis. In Section Results, results derived from this study are presented. A discussion is presented in Section Discussion and conclusions, followed by major conclusions in Section Discussion and conclusions.
Materials and methods
Oceanic data
The daily ocean temperature records used to detect MHWs are extracted from a simulation of the high-resolution Eastern Tasmania (ETAS) coastal ocean model covering the period 1994–2016 (Oliver et al., 2016). ETAS is a three-dimensional regional dynamic ocean model (average grid cells ~2 km; Figure 1A) for the eastern Tasmanian region and is based on the Sparse Hydrodynamic Ocean Code (SHOC) developed at the CSIRO Marine Laboratories in Hobart, Tasmania (Herzfeld, 2006). The model is based on a curvilinear 200 × 120 grid, with 43 layers in the vertical. ETAS has been previously used to analyse the mean circulation (Oliver et al., 2016) and MHWs off eastern Tasmania, including trends and patterns of variability (Oliver et al., 2018; OL18 hereafter). The ETAS domain is climatologically dominated by two important transport sources, the southward flowing EAC Extension from the north, and the northward Zeehan Current impinging from the south (Oliver and Holbrook, 2018). Atmospheric forcings, including surface winds and air temperature, are extracted from the National Center for Environmental Prediction (NCEP) Climate Forecast System (CFS) Reanalysis (CFSR, 1994–2010; Saha et al., 2010) and CFS Version 2 analysis (CFSV2, 2011–2015; Saha et al., 2014). CFSR and CFSV2 are global reanalysis systems that provide temporally high-resolution (6-h) forecasts from a coupled atmosphere-ocean climate model, and includes sea ice and river run-off (Wang et al., 2011).
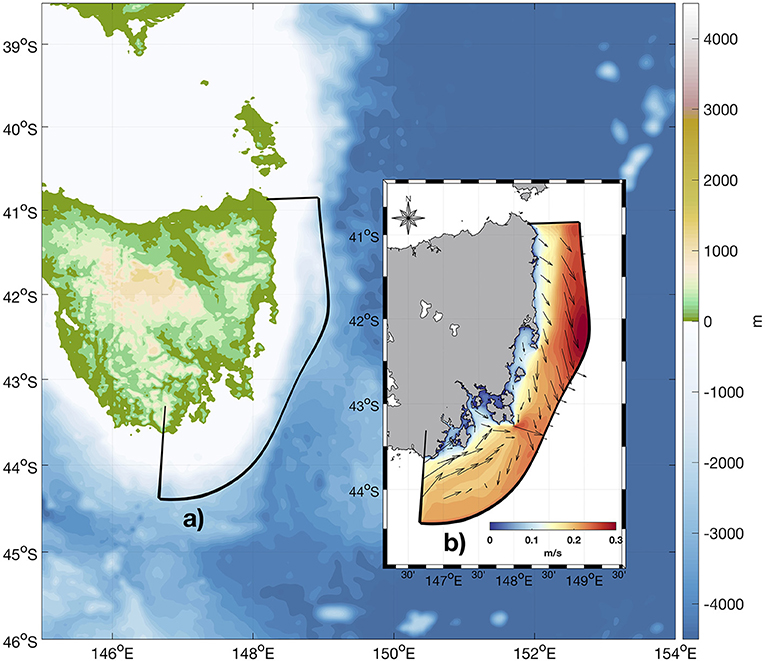
Figure 1. (A) Topography of the domain in this study, where ETAS region is surrounded by black solid line. (B) Mean ocean currents in ETAS region during austral summer (Dec–Feb).
The daily sea surface heights and oceanic currents in the southern Tasman Sea are extracted from the Bluelink ReANalysis version 3 (BRAN3; Oke et al., 2013), which is an eddy-resolving ocean reanalysis including ocean currents. BRAN3 is used in addition to ETAS to provide the larger–scale and offshore information, including daily sea surface height (SSH) maps at 0.1° × 0.1° horizontal spatial resolution. The advantage of using the BRAN3 data is that they provide an optimal eddy simulation for the circulation around Australia and surrounding regions (Oke et al., 2013) – representing a strong indicator of the dynamic state, including mesoscale eddies. In this study, we define the domain of the southern Tasman Sea as the region bounded by 145°E−156°E, 38.5°S−46°S.
Detecting and tracking mesoscale eddies
Several eddy detection and tracking algorithms have been previously proposed. Early methods tended to use image processing combined with other statistical techniques, such as neural networks, to isolate the eddy fields based on SST or ocean color imagery (Holyer and Peckinpaugh, 1989; Castellani, 2006; Fernandes and Nascimento, 2006; D'Alimonte, 2009; Dong et al., 2011). However, these methods can be influenced by factors other than the eddies being targeted for detection, and so alternative methods based on satellite observations of SSH have also been identified (Fang and Morrow, 2003; Isern-Fontanet et al., 2003; Chaigneau et al., 2008; Faghmous et al., 2012a). A largely accepted method, the eddy tracking algorithm proposed by Chelton et al. (2011); hereafter, CH11, identifies eddies using a multi–step algorithm. CH11 is executed by firstly finding regions where the SSH anomalies are larger than a particular threshold and where there is a local minimum/maximum of SSH for the cyclonic/anticyclonic eddy. Once the eddy is detected, the eddy tracking is subsequently executed by identifying eddies whose centroids are located within a defined region centered on the eddy at the following time step. This method is widely used due to its efficient detection and tracking, as well as its applicability to a range of datasets (Faghmous et al., 2012a). However, CH11 is a method characterized by various parameters and it uses filters to retain signals in a particular spatiotemporal scale, which may filter out realistic features that occur on specific scales.
A recently developed algorithm, EddyScan (Faghmous et al., 2012b), assigns binary data based on whether or not the SSH in a particular location exceeds a corresponding threshold, and then finds connected features at each iterative step. For the connected features, five criteria were applied to identify whether the detected component is an eddy: (1) limitation for minimum and (2) maximum size of eddy; (3) existence of local minimum or maximum; (4) threshold of minimum amplitude (1 cm for default); and (5) a predefined convex hull ratio as a function of latitude of the center of the eddy. Distinct from CH11, this method requires a convexity criterion (the convex hull ratio) to avoid the potential mistake of grouping multiple eddies together. This alternative method to CH11 has been previously evaluated (Faghmous et al., 2012b, 2013; Faghmous and Kumar, 2014) and found to be advantageous because: (i) no filter is required in this method and it can reveal characteristics in raw data, as opposed to modified data; and (ii) the compactness of eddies is ensured by the convexity criterion, thus there is no multiple detection problem. Given these qualities of the technique, we use EddyScan to detect and track eddies based on sea surface height anomalies (SSHA) in the domain of the BRAN3 data from 1994 to 2016.
Self–organizing maps
Developed in the 1990s, the self-organizing map (SOM) is a competitive-learning artificial neural network used for cluster analysis to create a spatial representation, and reduction, of data (Kohonen, 1990, 1995). The key objective of SOM analysis is to reduce high-dimensional data into relatively low-dimensional (typically two-dimensional) maps following typological ordering (Vesanto et al., 2000). The algorithm self-organizes similar data into close grids in low-dimensional maps, and places dissimilar data into relatively distant grids. The popularity of SOM analysis in oceanography has increased significantly and it has been used, for example, to detect the flavors of El Niño–Southern Oscillation (ENSO) (Johnson, 2013), analyse coastal model outputs (Williams et al., 2014; OL18), investigate extreme climate events (Cavazos, 2000), and obtain patterns of ocean current variability (Liu and Weisberg, 2005).
Here we use SOMs to identify the important precursor link between SSHA in southward transporting eddies and downstream MHWs. As an advanced clustering algorithm, the SOM approach can generate distinct nodes of particular climate properties, which enables us to develop it as a statistical method for teleconnecting particular MHW events to anomalous ocean circulation patterns, in real time or forecast leading time scale. Details of the SOM technique and the individual nodes are provided in the Appendix.
Marine heatwaves
A MHW has been defined as a “discrete prolonged anomalously warm water event at a particular location” (Hobday et al., 2016). “Discrete” implies that a MHW exists for a finite time-period, with a start and end date. “Prolonged” is quantified in the Hobday et al. (2016) definition as a duration of at least five days. “Anomalously warm” is here relative to a percentage threshold value (the 90th percentile) above the background mean climatology. The climatology and percentile are calculated based on an 11-day moving average window centered on each Julian day, where the data on Feb 29th in each non-leap year is filled by the mean of that on Feb 28th and Mar 1st. For a particular day in a MHW event, intensity is defined as the difference between the daily temperature value and the seasonally varying climatology. Two successive events with a gap of no more than 2 days are considered a single continuous event.
Once events are detected, a set of MHW metrics can be calculated to quantify the characteristics of each MHW: mean and maximum intensity (°C), duration (days), variance of intensity, onset rate and decline rate (°C/day). We detected MHWs using SST in ETAS from 1994 to 2016, relative to a climatological baseline from 1994 to 2009. Subsequently, we could determine a binary variable ζ(x, y, t) to indicate if a particular time t is in a MHW event at position (x, y), which could be expressed as ζ(x, y, t) = 1 when t is in a MHW and 0 otherwise.
Heat budget
Here we use an upper ocean temperature budget to determine the contribution from ocean current transport and surface heat flux (Benthuysen et al., 2014; Oliver et al., 2017) to the surface mixed layer temperature tendency, following the expression:
where h is the depth of the surface mixed layer, T is temperature, uH is the horizontal current velocity, w is the vertical current velocity, Q is the net surface heat flux, and . Here we choose h equal to 100 m as an average estimate for the mixed layer depth through which the temperature budget operates in the upper ocean. We also use ρ as the reference density (1,035 kg/m3). Cp is the specific heat capacity of sea water (3,990 Jkg−1K−1).
The terms in the equation reveal the role of different mechanisms to warm the upper ocean (Benthuysen et al., 2014). is the time rate of change of the depth-averaged temperature in the upper ocean, AdvV = −{uH∇HT} is the time rate of change of the depth-averaged temperature due to ocean current advection, is the time rate of change of depth-averaged temperature due to the net surface heat flux, and the Residual is the time-rate of change of other factors (lateral diffusion, vertical temperature advection, and entrainment), unaccounted for by the leading terms of the surface heat flux and advection.
In the present study, the temperature budget analysis is used to identify the dominant terms that contribute to temperature change during MHW events, based on oceanic data from the BRAN3 data and heat flux data from NCEP [CFSR (1994–2010); Saha et al., 2010] and CFS Version 2 analysis (CFSV2, 2011–2016; Saha et al., 2014), bounded within the ETAS domain. The residual term is calculated as RateV minimized by the sum of AdvV and QV.
Results
Connections between eddies and MHWs
Mesoscale eddies from 1 January 1994–31 August 2016 were detected and tracked in the southern Tasman Sea (145°E−154°E, 38.5°S−46°S) in the BRAN3 data. The percentage of eddy-occupied days, which is the percentage of total time an eddy exists in a grid cell, and the percentage of anticyclonic eddies in all detected eddies were subsequently calculated (Figure 2). Eddies with lifetimes of at least 4 weeks are typical in the interior (offshore) southern Tasman Sea, but tend to be absent across the shelf off Tasmania where depths <200 m (Figure 2A) where the detection algorithm is not satisfied (Chaigneau et al., 2011; Chelton et al., 2011). Other factors influencing the absence of eddies on the shelf may be the shelf acting to smear out the eddy structure as eddies flow onshore, or the inability of BRAN3 to resolve eddies on the shelf. With increasing minimum eddy lifetimes, the eddy fields tend to be inhomogeneous in their distribution and types. Long-lived eddies, with lifetimes >16 weeks, are most prevalent in a corridor that tracks southward alongside Tasmania's continental slope, and are dominated by anticyclonic eddies (Figures 2B,D). This anticyclonic eddy pathway is a robust average feature of the circulation, shown by the large percentage of eddy–occupied days along this corridor (Figure 2C). It is also notable that cyclonic eddies occupy a narrower corridor against the Tasmanian shelf. Further, the dominance of anticyclonic eddies along this path is not only limited to long-lived eddies, but also those that are shorter-lived (Figure 2D).
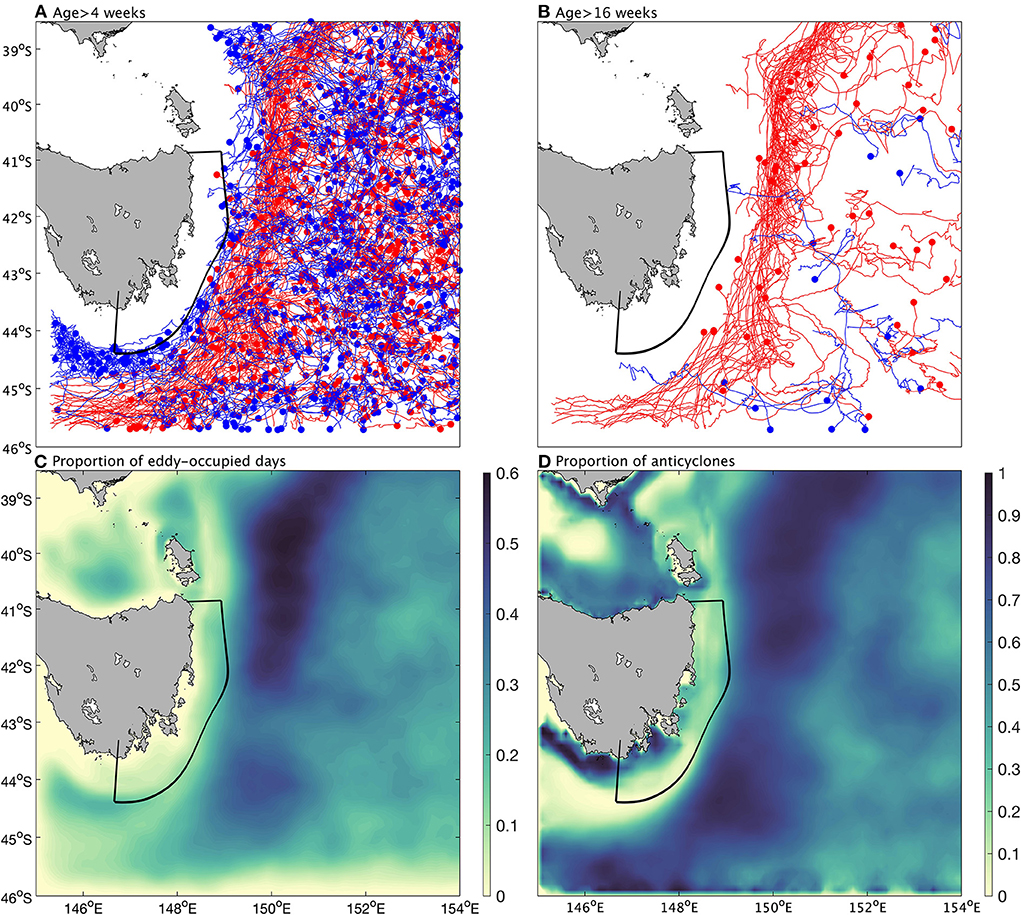
Figure 2. Eddy field in the southern Tasman Sea based on BRAN3 data from 1994 to 2016. Detected eddy tracks are shown with lifetimes (A) > 4 weeks, and (B) >16 weeks. In (A,B) the red (blue) dot stands for the end point of an anticyclonic (cyclonic) eddy and the line indicates the track of this eddy. (C) Proportion of eddy-occupied days during 1994 to 2016 in the southern Tasman Sea. (D) Proportion of anticyclonic eddies in all tracked eddies.
To analyse the influence of different eddy distributions on MHWs off eastern Tasmania in further detail, we performed a SOM analysis to divide tracked eddies into different typologies. After removing the seasonally varying climatology, we calculated temporal averages of the ocean temperatures and currents within the ETAS domain for eddy lifetimes >8 weeks (i.e., corresponding to 415 detected eddies, including 257 anticyclonic eddies and 158 cyclonic eddies). These time–mean states were then used as variables in the SOM, with map size (3, 3) justified below. Instead of using eddy metrics (e.g., duration, central location, vorticity) as covariates to force the SOM, we obtained the oceanic patterns of SSHA and circulation off eastern Tasmania under the existence of different types of eddies. Before the SOM was executed, each variable was scaled by removing its mean and dividing by its standard deviation. The resultant composites for each SOM node were then rescaled based on the output nodes to obtain explainable patterns.
To choose a suitable size for the SOM, we first calculated the within sum of squares with respect to the total sum of squares (WSS/TSS) for different map sizes (Figure 3). We detected that the curve indicating the change of WSS/TSS tended to be gentle (Figure 3A) and the difference between WSS/TSS in different map sizes (Figure 3B) tended to be constant when the number of clusters reached (3, 3), corresponding to 9 cluster groups. A simple t-test was performed for all couples of cluster groups to assess their similarity, with all significant at p < 0.05, which confirms that using the SOM with a (3, 3) map size provided representative (eddy) circulation types off eastern Tasmania.
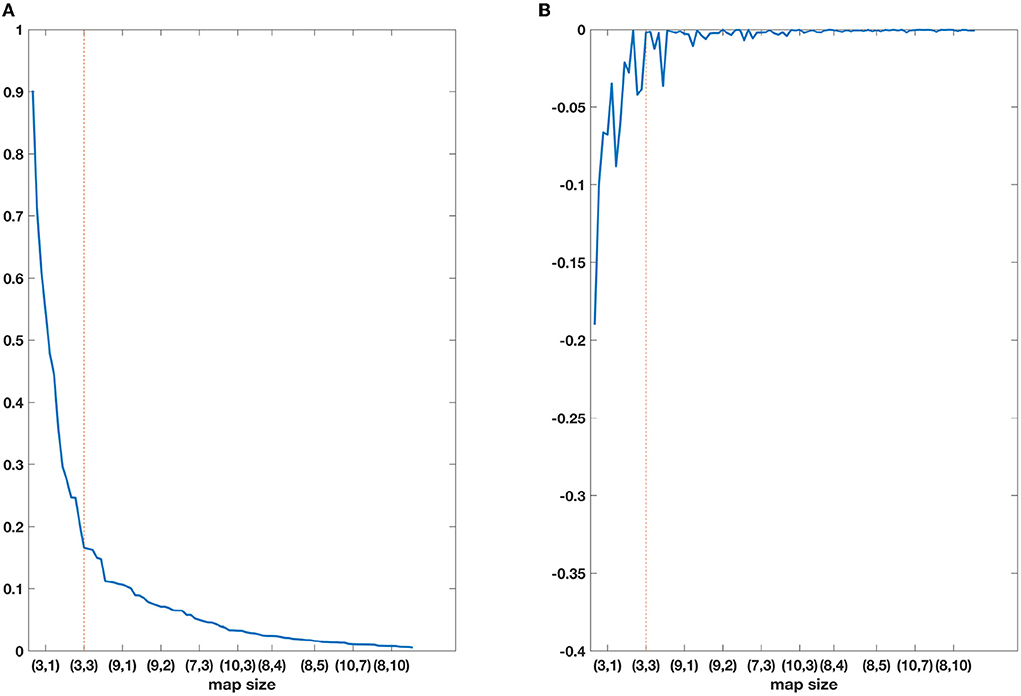
Figure 3. (A) WSS/TSS varying with map size and (B) corresponding first difference. The determined map size is indicated by dashed line.
Figure 4 shows the mean SSTs and surface circulation anomalies across all eddies for each node. Generally, the oceanic states off eastern Tasmania, when eddies exist in the southern Tasman Sea, show a large range of variability in both SST anomalies (SSTA) and the dominant ocean currents. The typology of the SOM nodes was organized based on the dominant oceanic mean state present. For a particular node (i, j), along the i direction, it was found that the dominant ocean current off eastern Tasmania tends to change from the northward Zeehan Current to the southward EAC Extension, and the temperature anomalies tend to increase; along the j direction, the ocean circulation reveals a tendency for stronger (weaker) northward (southward) currents and the temperature anomalies tend to increase too. Nodes located in the four corners represent the most extreme oceanic patterns.
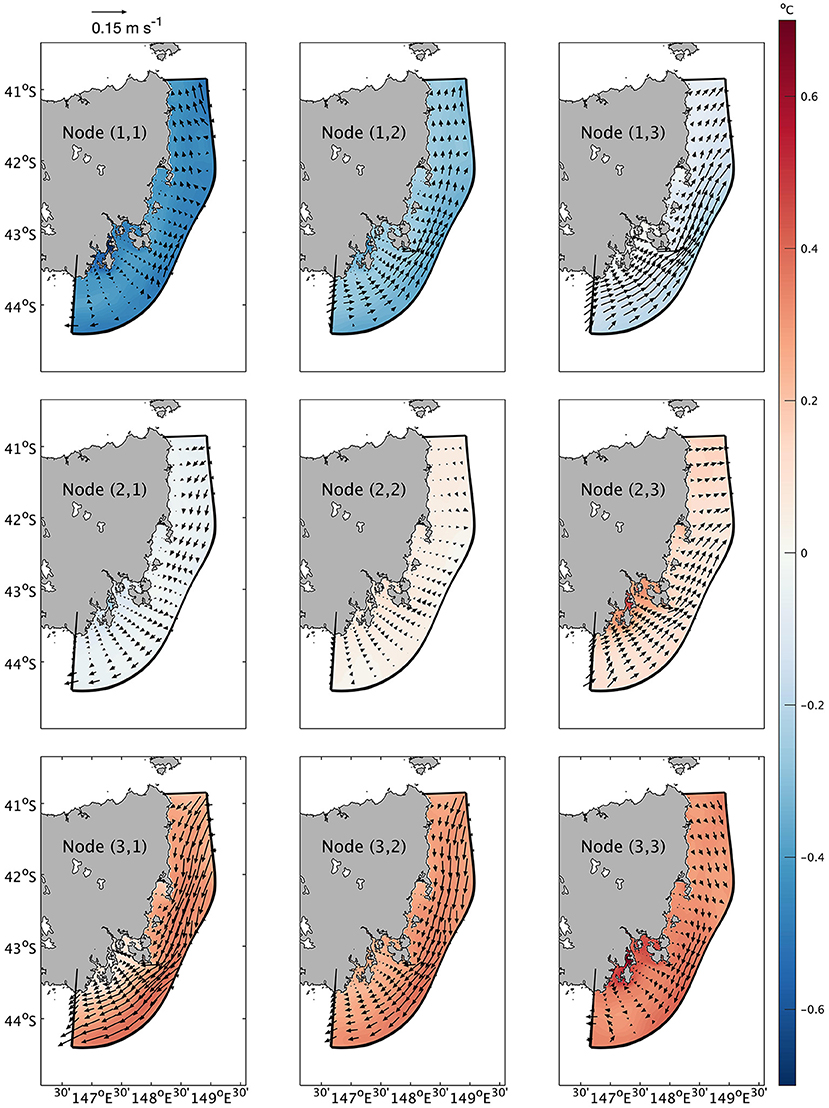
Figure 4. The mean oceanic states in each node. Colors (arrows) indicate the temporally averaged temperature (current) anomalies across all eddies in this node.
The SOM typology of the proportion of MHW days off eastern Tasmania is well organized with some clear features (Figure 5). As i increases, the percentage of MHW days in Node (i, j) tends to increase strongly; as j increases, the percentage of MHW days also tends to increase, though much weaker and some exceptions are observed [e.g., Node (3, 1) to Node (3, 2)]. It should be noted that only three percentage patterns [Nodes (3, j), where j ranges from 1 to 3] are generally larger than the climatological proportion of MHW days, which is approximately 10 percent due to the statistical definition, while the proportional distributions in other nodes were either generally lower than the climatological proportion [Nodes (1, j) where j ranges from 1 to 3] or only show large proportions in coastal regions off southeast Tasmania [Node (2, 3)]. These node patterns, exhibiting a relatively low proportion of MHW days, were accompanied by the dominance of the northward Zeehan Current, the exception being Node (2, 1) (Figure 4). Some nodes [e.g., Node (3, 1) and Node (3, 2)] have a relatively low proportion of MHW days nearer to the coast across the southern portion of Tasmania's eastern shelf and a relatively high proportion of MHW days in the remaining parts of the domain, while other nodes [e.g., Node (2, 3) and Node (3, 3)] demonstrate opposite patterns. It is notable that the southeast coastal region off Tasmania shows generally opposite proportion patterns to the rest of the domain [obvious in Node (2, 3), nodes (i = 3, j = 1, 2, 3)], demonstrating distinct regional responses to eddy activity in the southern Tasman Sea compared with rest of the domain.
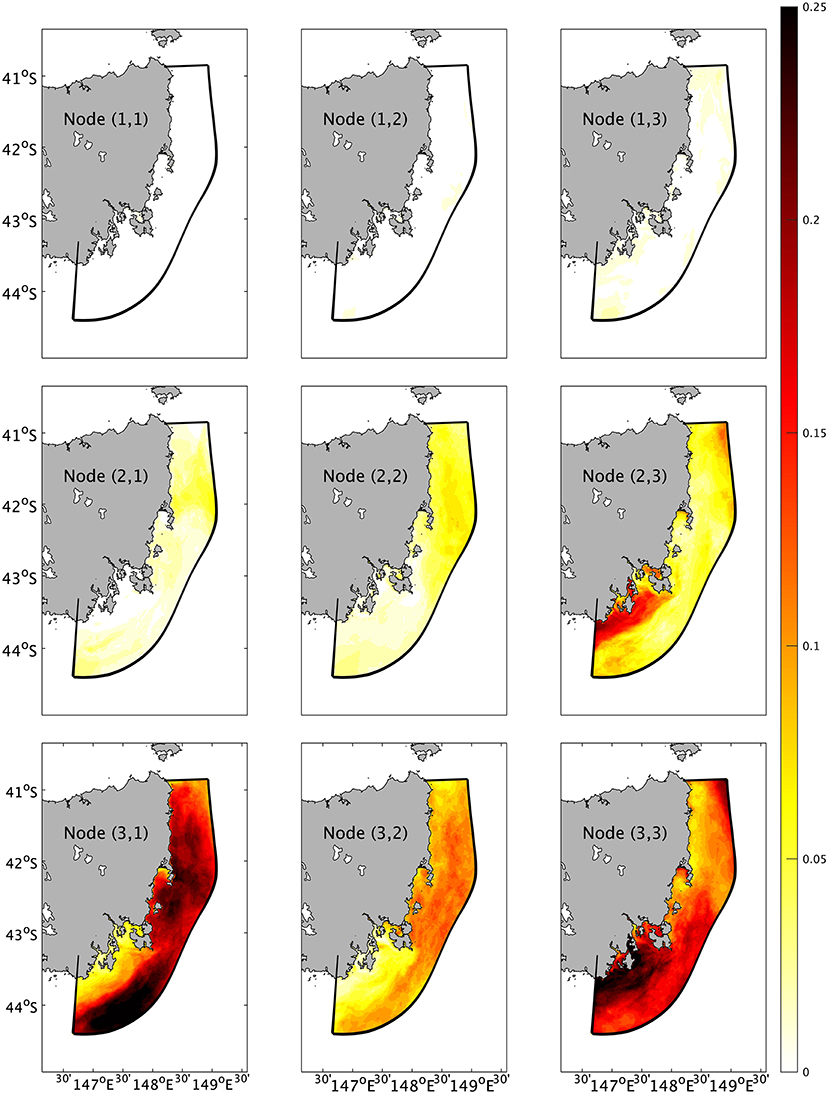
Figure 5. The proportion of MHW days in each node. Colours indicate the proportion of MHW days across all eddies in this node.
Figure 6 shows the distribution of tracked eddies for each node. Here, eddies in each node are expressed as dots with dot size indicating the mean size of each eddy during its lifetime, color intensity indicating their mean amplitude (cm) during the lifetime of each eddy, and the basic color indicating the type of eddy (red for anticyclonic eddy and blue for cyclonic eddy). The eddies are identifiable based on their mean locations during their lifetimes. In this typology, the structure of the nodes is generally organized following the change of i. In nodes (i = 1, j = 1, 2, 3), a large number of small eddies with relatively low amplitude, consisting of both anticyclonic and cyclonic eddies with similar numbers and spatial distributions, cover large proportions of the southern Tasman Sea. In nodes (i = 2, j = 1, 2, 3), the sea surface of the southern Tasman Sea is characterized by rare eddies with inhomogeneous metrics, elucidated by eddies with relatively large amplitude and large size located off northeast Tasmania and relatively weak eddies observed in other locations. In nodes (i = 3, j = 1, 2, 3), the southern Tasman Sea is covered by a modest number of eddies, consisting of both anticyclonic and cyclonic eddies, with strong anticyclonic eddies occurring off northeast Tasmania. It should be noted that nearly all (6 in 7) extreme anticyclonic eddies, whose amplitudes and sizes are larger than the 95 th percentile of all tracked anticyclonic eddies, are located in nodes (i = 3, j = 1, 2, 3) off northeast Tasmania. The details of each node in the SOM are summarized in Appendix. It is notable that the strong anticyclonic eddies off northeast Tasmania and relatively high proportion of MHW days in the southern domain reveal that the geographical locations of strong anticyclonic eddies and high MHW exposures do not crucially match each other in Node (3, 3). This may be because local drivers of MHWs include not only advection, which are related with eddies here, but also atmospheric forcings (Holbrook et al., 2019). Eddy-induced advection, as one potential source of advective heat transfers, can only generate parts of MHWs off eastern Tasmania (e.g., Behrens et al., 2019), which could be an explanation for the mismatch. In spite of this, the 3 × 3 SOM typology provides a visualization of the links between MHWs off eastern Tasmania and eddies in the Tasman Sea, and demonstrates that the distribution of strong anticyclonic eddies off northeast Tasmania can influence MHW generation in the ETAS domain.
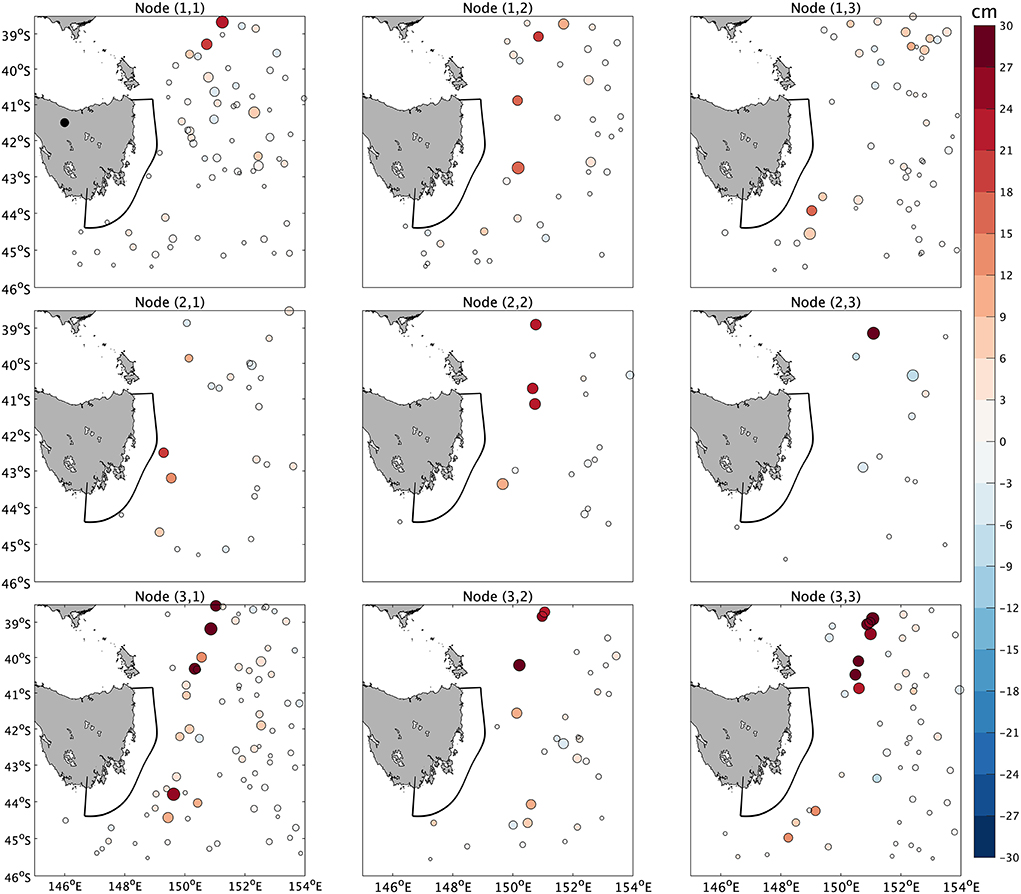
Figure 6. Eddy distribution in each node. Each eddy is indicated as a dot with colour intensity revealing its mean amplitude (cm) during its lifetime, the size of each dot is proportional to the mean eddy size during the lifetime, and the basic color of each number indicates the intensity of this eddy, where red (blue) stands for anticyclonic (cyclonic) eddies.
We applied a heat budget analysis to quantify the contribution to temperature increases associated with eddies in Node (3, 1) and Node (3, 3), since an anomalously high proportion of MHW days was found in the corresponding nodes [Nodes (3, 1) and (3, 3) in Figure 5]. We calculated RateV, AdvV and QV at each time step, and then averaged them across all tracked eddies in these two nodes, after removing the seasonal climate variability. Following this, the total temperature tendency (RateV) and substantive contributing terms (AdvV and QV) were quantified; these are shown in Figure 7. When strong and large eddies exist in the southern Tasman Sea [conditions in Nodes (3, 1) and (3, 3)], the horizontal advection generally represents a dominant proportion of the contribution to depth-averaged temperature change of the upper ocean. In the two nodes, the positive part of the upper ocean temperature tendency is mostly attributed to the horizontal advection, especially in the southern part of the ETAS domain. Considering significant southward current anomalies and the anomalously high proportion of MHW days in the two nodes, it reveals that strong eddies with large size and intensity tend to contribute to the horizontal advection, contributing to the heat transfer during the development of MHW events. This could also be revealed by the strong negative effects of QV over the ETAS domain in Node (3, 3) that is compensated by highly positive AdvV there.
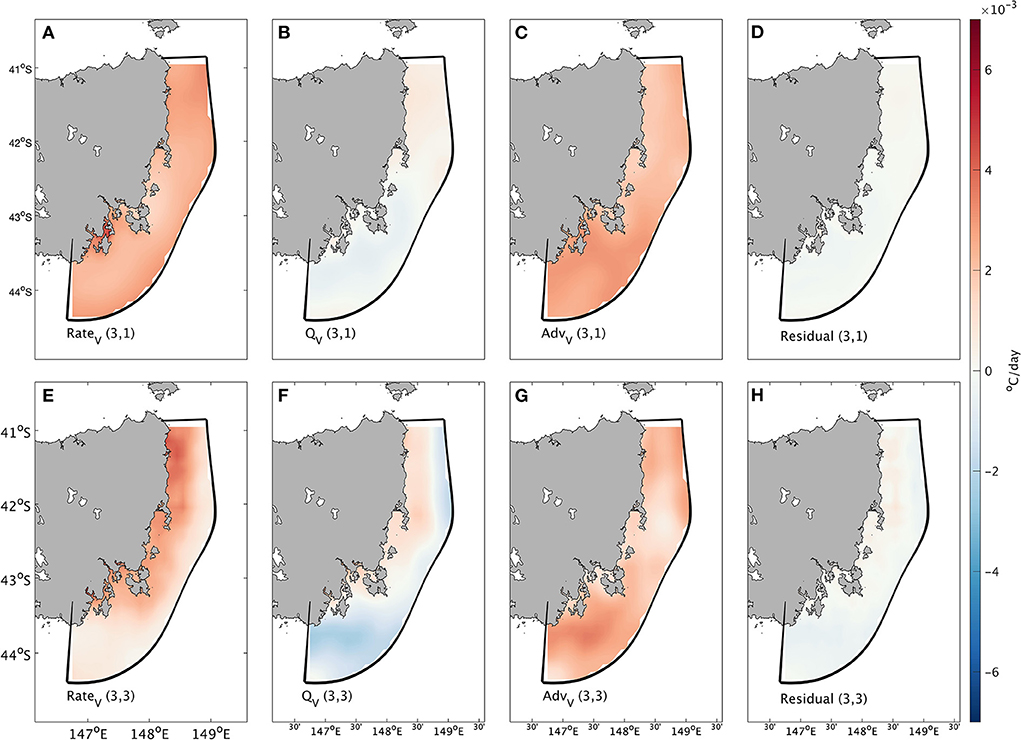
Figure 7. Outputs from the heat budget analysis. Averaged total change rate anomaly (°C/day) in (A) Node (3, 1) and (E) Node (3, 3). Averaged change rate anomaly (°C/day) due to surface heat flux in (B) Node (3, 1) and (F) Node (3, 3). Averaged change rate anomaly (°C/day) due to advection in (C) Node (3, 1) and (G) Node (3, 3). Averaged change rate anomaly (°C/day) due to residuals in (D) Node (3, 1) and (H) Node (3, 3).
The oceanic states (Figure 4), MHW states (Figure 5) and eddy distributions (Figure 6) in each node are tightly connected. In nodes (i = 3, j = 1, 2, 3), the region off eastern Tasmania is characterized by positive temperature anomalies and southward current anomalies, corresponding to the influence of the EAC Extension. In these nodes, the strong anticyclonic eddies off northeast Tasmania are seen as intensified southward transports into the ETAS region by the EAC Extension. We next endeavor to model this eddy-MHW relationship as a mechanistic source of potential predictability for MHWs off Tasmania.
Predictive model
In the previous section, we have shown that the surface circulation patterns, especially the eddy distribution in the Tasman Sea, could be a significant contributor to the occurrences of MHWs off southeast Tasmania. Here, we identify the lead-lag relationship between SSHA in the southern Tasman Sea (associated with the mesoscale eddy field) and MHWs off eastern Tasmania with a view to develop a statistical forecast model of MHWs for this region. Specifically, we propose a statistical model to predict MHWs off eastern Tasmania based on the SOMs and classification methods. The architecture of the model is shown in Figure 8. The model uses SSHA to train the SOMs, which subsequently cluster each time point into multiple nodes. With a lag time of k days, proportions of MHW exposures in a particular season are determined in each node, as a proxy for MHW probabilities. A classifier is trained using the clustered SSHA, to label new input data into a particular SOM node, and subsequently determines its corresponding MHW probability; the existence of a MHW in a particular spatiotemporal grid is determined if the MHW probability is larger than a specific threshold, which is determined by the F-test. The details of this model are presented in the Appendix.
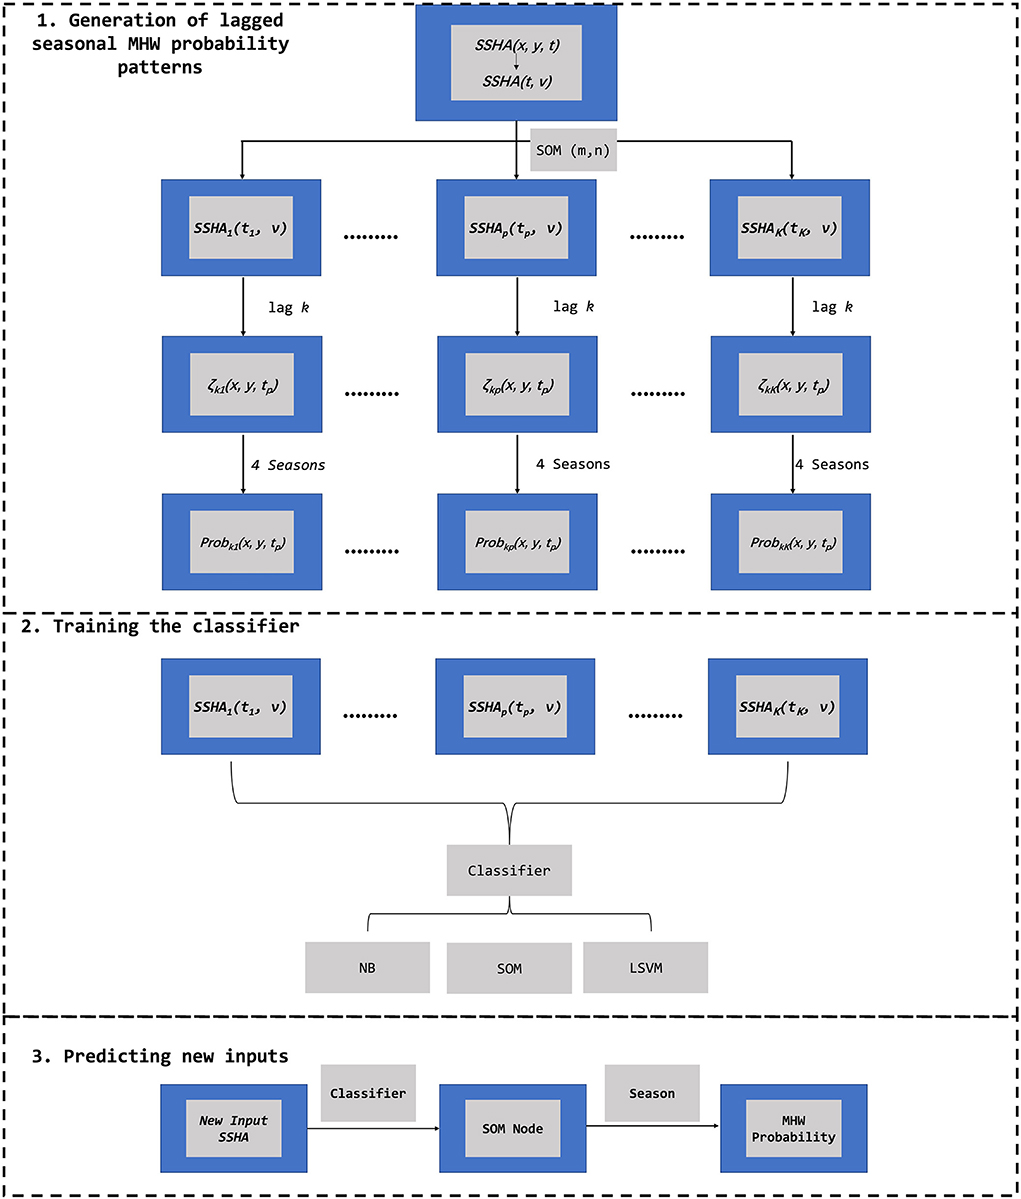
Figure 8. The architecture of the model. (1) SSHA are used to train the SOM, clustering each time point into a particular node. With a lag k days, the probability of MHW existence in a particular spatiotemporal grid is determined using the proportion of MHW exposures in each season for a particular SOM node. (2) A classifier (SOM/Naïve Bayes/Linear Support Vector Machine) is trained taking SSHA as inputs to (3) label new input SSHA into a particular SOM node, and the existence of MHW is determined if its corresponding probability is above the threshold determined by F – measure.
Model implementation
Our model implementation uses the following protocol:
We present two case studies to evaluate the model. For each case, the spatial training data Dtr and spatial validation (test) data Dte were determined. In Case 1, we use SSHA and ζ(x, y, t) from 1994–2011 as training data and use the same properties from 2012–2014 as testing data. In Case 2, we randomly chose data with a length of three leap years (3 × 366 = 1098 days) as testing data and use the remaining data as training data. It should be noted that data during 2015–2016 are not included in either training or testing to avoid the potential overfitting caused by the unprecedented long–lasting MHW during this period (Oliver et al., 2017). Case 1 is presented to show the feasibility of this model under the condition that training and testing data are temporally consecutive and includes an upward trend. Case 2 demonstrates the general prediction of this model under the assumption that training and testing data follow similar distributions. This is confirmed by the annual mean MHW days in each case presented in Figure 9. In Case 1, the annual mean MHW days in the south of the domain increase significantly in the testing data compared to the training data, while the difference between training and testing data is relatively insignificant in Case 2. This result is consistent with previous results evaluating the MHW simulation in the ETAS model (Oliver et al., 2018), which shows the total MHW days in the southern domain increasing to ~120 days/year after 2011, while the mean remains below 40 days/year (Figure 2 in Oliver et al., 2018). It should be noted we use MHWs detected from raw SST data rather than detrended SST to show the overall predictability of MHWs including for nonstationary data. Hence, comparing results from Case 1 and Case 2 show that the predictive model is suitable for both conditions.
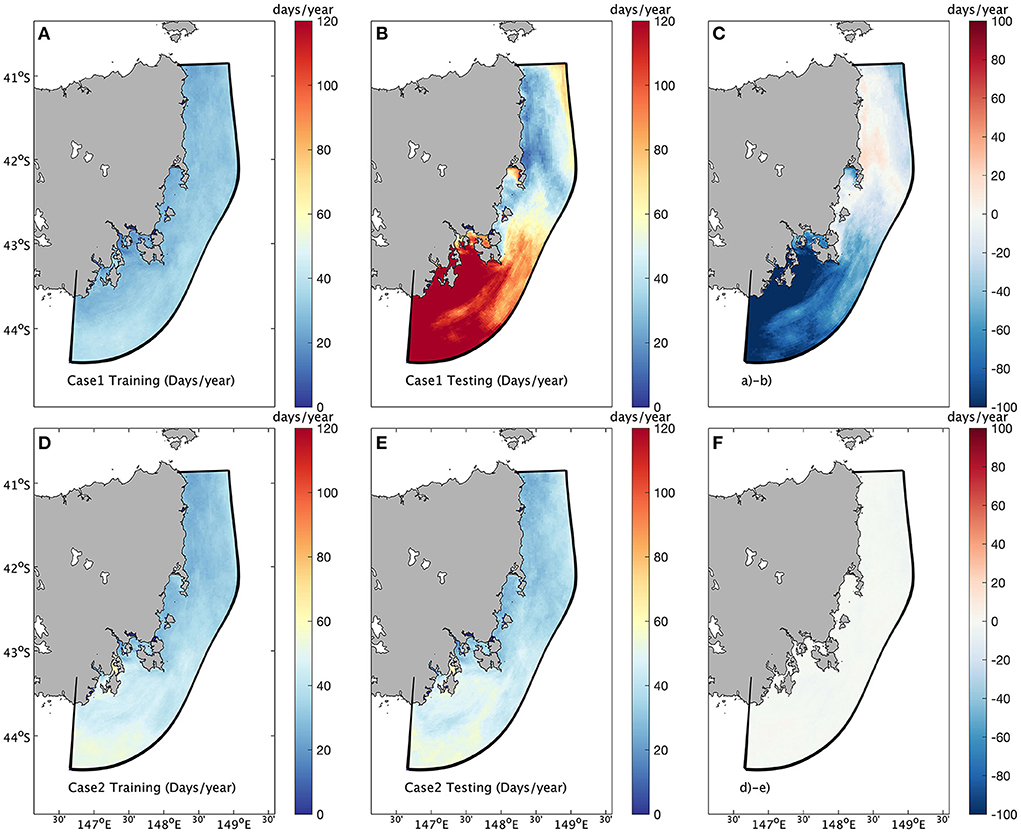
Figure 9. The MHW days/year in training and testing data in each case. (A–C) separately indicate the MHW days/year in training data (1994–2011), MHW days/year in testing data (2012–2014), and the difference between training and testing data (A,B) in Case1. (D–F) separately indicate the MHW days/year in training data, MHW days/year in testing data (randomly selected time points equal to 3 leap years, 1098 days), and the difference between training and testing data (D,E) in Case 2.
For each case, a Leave-One-Out Cross-Validation (LOOCV) approach (Wong, 2015) is applied to the training data Dtr to determine the skill of this model. To achieve this, we randomly split Dtr into 10 subsets, while every subset has approximately the same size. We use 9 subsets as training data and predict the 10th. We select each of the subsets in turn as the predictand and train with the other 9. For each case we get 10 model outputs, while each corresponds to a particular subset of testing data. Then, for each case, these 10 model outputs are collected to form a full output with the same length as the training data. This process is repeated with a different lag, k, ranging from 1 to 240 days, and the predicted outputs are evaluated against observations through the cross-validation.
To estimate the skilful prediction range of this model, we compute the maximum lag k for which the model meets a suitable forecast skill score evaluation. In this case, the maximum acceptable lag k is determined as the lag corresponding to the condition that the generated model outputs have a 50 percent chance of correctly predicting a MHW day, indicating that lags longer than k do not provide superior prediction skill than a true – or - false guess (Chen et al., 2021; Silini et al., 2021). The true positive rate (TPR), also known as recall or sensitivity, is utilized to determine the prediction range in this instance. The TPR is expressed as: , where TP and FN indicate the number of True Positive and False Negative predictions respectively. The TPR has been applied previously to examine the subseasonal forecast skill of MHWs in a climate model (Benthuysen et al., 2021).
The prediction range is determined by finding the maximum lead k that satisfies the TPR corresponding to the condition that our model has 50% probability of providing a correct positive forecast. Figure 10 depicts the estimated range for model prediction. As expected, the TPR for the two cases tends to decrease with increasing lead k, indicating that the model prediction skill of MHWs declines as the lead time increases. The TPR reaches 50% between 7 and 14 days after initiation. Therefore, we conclude that the MHW prediction range of this model is potentially useful at lead times of up to 7 days (1 week). The local peak indicates that the model recovers a portion of its forecasting skill on a monthly time scale, which corresponds to the general eddy lifetime (10–100 days; Faghmous et al., 2015). It is notable that the 50% TPR is still much better than a random guess (TPR ~ 10%) for MHWs, which occur on average 10% of the time.
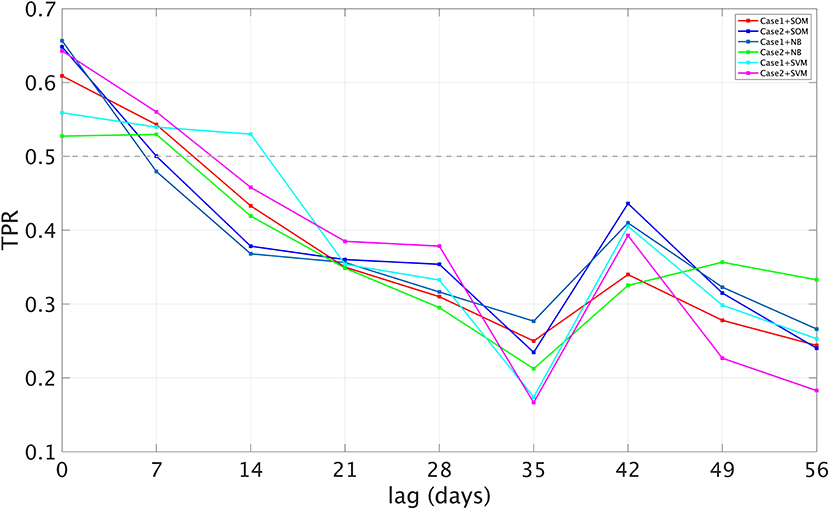
Figure 10. Spatially averaged TPR with different combinations of cases and cluster algorithms. The 50% threshold is indicated by the dashed grey line at 0.5.
Model hindcasts
Figure 11 shows the predicted annual number of MHW days for each experiment. The model predictions generally capture the proportion of MHWs, with biases varying across the different experiments. In experiments implemented in Case 1, the model forecast shows a general underestimation in regions to the south of the Tasman Peninsula, ranging from 0–80 days/year, and an overestimation in regions to the north of the Tasman Peninsula, ranging from 0–80 days/year. In experiments implemented in Case 2, the model prediction shows general underestimations in all domains off eastern Tasmania, ranging from 0–20 days/year. Model predictions show similar results in experiments with different cluster algorithms, implying that this model adapts well to various cluster methods.
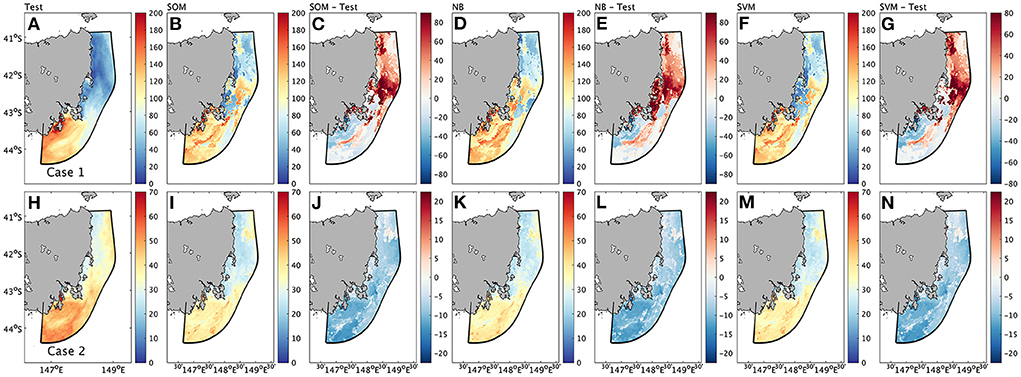
Figure 11. (A–N) Model predicted annual MHW days and their difference between test data in each experiment. Test data are labelled as “Test”, predicted annual MHW days are labelled by corresponding cluster method (“SOM”, “NB”, “SVM”), and the differences between test data and prediction are labelled as “Test-cluster method” (“Test-SOM”, “Test-NB”, “Test-SVM”).
In Figure 10, we demonstrated that the model had a 50% chance of accurately predicting MHW events in 7 leading days. However, it is also important to determine how many positive predictions correspond to actual MHW events in the given forecast scale. The precision (fraction of true positive cases among all positive predictions) of each experimental forecast of the number of MHW days is shown in Figure 12. We find that the model has high precision for forecasts of the number of MHW days that occur south of the Tasman Peninsula and low precision for forecasts of MHW days north of the Tasman Peninsula, when they are combined with different cluster methods. In experiments associated with Case1, the spatial mean precision over the whole domain is ~ 0.5, with greatest precision located off southeast Tasmania, and in particular closer to the coast. To the south of the Tasman Peninsula, the spatial mean precision is ~ 0.75, while in the north part of the domain, it is only ~ 0.35. In experiments associated with Case 2, the spatial mean precision over the whole domain is ~ 0.6, with greatest precision near to the coast off southeast Tasmania. In the southern region of the domain, the spatial mean precision is ~ 0.75, while in the north it is ~ 0.5. Compared to experiments associated with Case 1, the Case 2 experiments show smaller spatial standard deviation (indicated by ‘std' labeled in the title of each panel in Figure 12). It is somewhat surprising that the model performs better in the southern domain, whereas large and intense eddies are distributed further north in the Tasman Sea. Eventually, the MHW predictability associated with the distribution of eddies is established through eddy–induced advection. As a result, the high/low precision off southeast/northeast Tasmania reflects eddy-induced advection shifts, which may or may not match the nearby eddy placements. Climatologically, the waters off eastern Tasmania are dominated by the influence of two boundary circulation systems – the EAC Extension from the north and the Zeehan Current from the south. In summer, the EAC Extension pushes further south, whereas in winter, the Zeehan Current plays a stronger role (Oliver et al., 2016). More MHWs can be observed when the ETAS domain is dominated by the influence of an anomalously strong southward flow, indicating an enhancement of the EAC Extension and its associated eddy field.
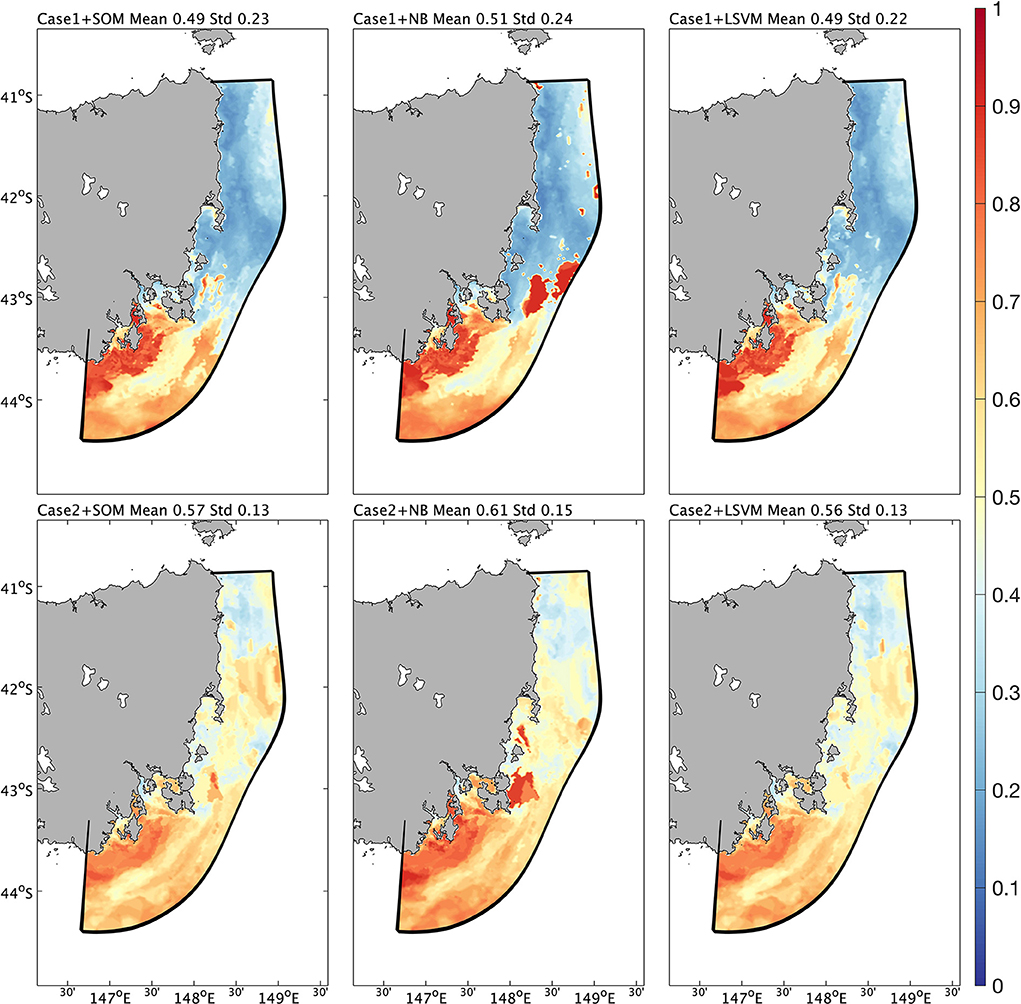
Figure 12. Spatial precision in each experiment. Each panel is labelled as “CaseN+cluster method”, in which N corresponds to 1 or 2, and cluster method corresponds to SOM, NB, or SVM. The spatial mean and standard deviation are also labelled in the title of each panel.
Potential mechanisms
After verifying that the model has acceptable prediction skill with lead times of up to 7 days, forecast results from the six experiments were collected and the oceanic properties (SSTA, horizontal current anomaly, SSHA) were averaged across all true positive and false negative observations (Figure 13). Generally, when the model correctly predicts a MHW day, the SST off eastern Tasmania is anomalously high and the oceanic circulation in this region is dominated by a southward current anomaly, corresponding to an intensified EAC Extension. At the same time, the eddy feature in the southern Tasman Sea is relatively significant, especially off northeast Tasmania, which is generally characterized by anticyclonic eddies (Figure 13B). When this model incorrectly predicts a MHW day, the ocean surface off eastern Tasmania is dominated by relatively weak warming, accompanied by noisy, less organized oceanic circulation (Figure 13C). In this condition, there is no clear characteristic spatial pattern in the Tasman Sea that explains sufficient variance of MHWs. It should be noted that the SSTA and SSHA associated with the MHWs shown here are typically lower than those shown in OL18, which could be due to the different time periods examined (1994–2016 for OL18 and 1994–2014 here). In particular, the present study excludes the extreme and unprecedented Tasman Sea MHW of 2015/16 (Oliver et al., 2017).
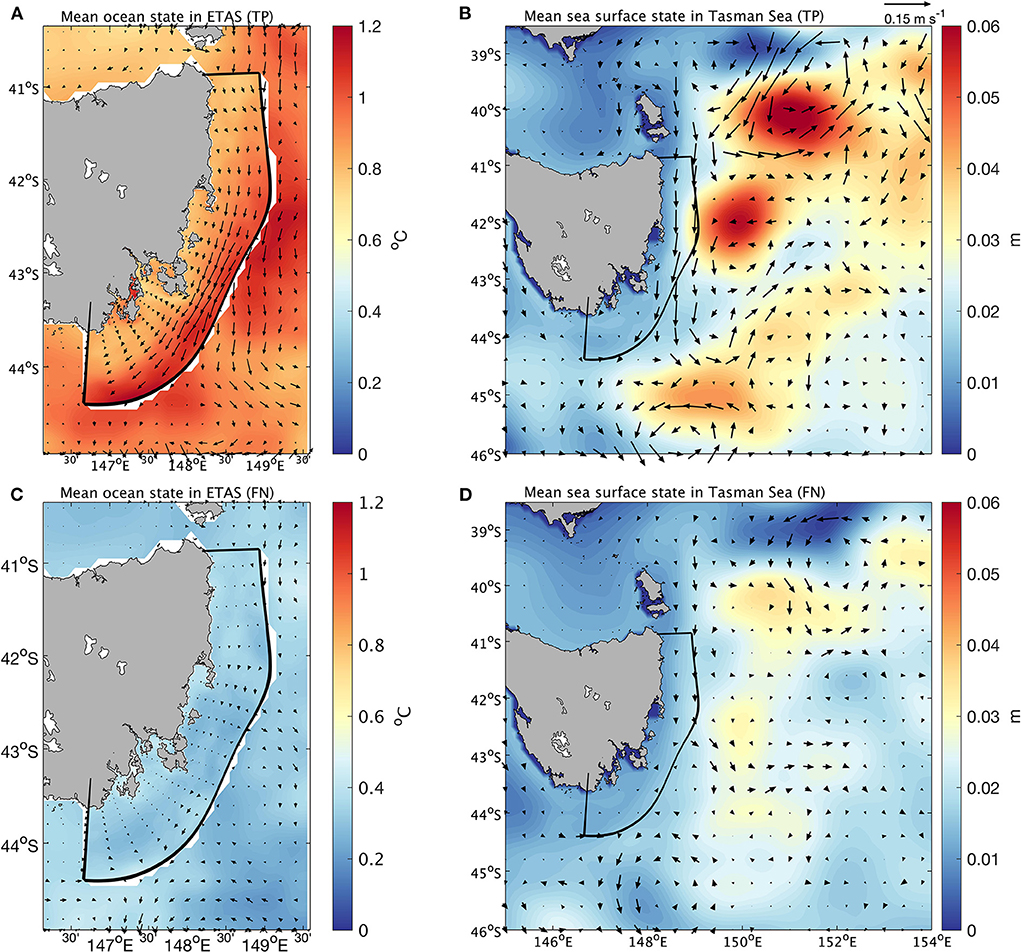
Figure 13. Mean states off eastern Tasmania and in the southern Tasman Sea across true positive and false negative predictions collected from all six experiments. (A) The SSTA (°C) and horizontal current anomaly (m/s) off eastern Tasmania averaged across all true positive forecasts. (B) The SSHA (m) and horizontal current anomaly (m/s) in the southern Tasman Sea averaged across all true positive forecasts. (C) The SSTA (°C) and horizontal current anomaly (m/s) off eastern Tasmania averaged across all false negative forecasts. (D) The SSHA (m) and horizontal current anomaly (m/s) in the southern Tasman Sea averaged across all false negative forecasts.
To determine the mechanism causing the MHW temperature tendency in true positive and false negative forecasts, a heat budget analysis was performed on the BRAN3 data from 1 January 1994–31 August 2016, with RateV, AdvV and QV estimated in days during this period. After removing the seasonally varying climatology, these three spatial change rate anomalies were separately averaged across all true positive and false negative forecasts collected from all six experiments (Figure 14). Generally, when this model tends to correctly predict a MHW day with a lead time of 7 days, the positive part of the change rate of the upper ocean temperature in the southern domain, where this model has relatively good performance (Figure 14), is mostly contributed by advection, while the northern domain shows the opposite pattern. On the other hand, when the model tends to fail to predict a MHW day with lead time of 7 days, the positive part of the change rate in the northern domain is dominated by the surface heat flux, but the role of advection in the southern domain is not as obvious as that shown in Figure 8C. Generally, when the model tends to correctly predict a MHW day, the southward current anomaly in the ETAS domain is clear and significant, accompanied by anticyclonic eddies located in the regions off northeast Tasmania. These MHWs are generally dominated by oceanic current advection revealed by the heat budget analysis. Overall, the model tends to show good skill in correctly predicting MHWs caused by intense southward advection. It should be noted that the heat budget does not converge well in the True Positive (TP) experiments, shown by negative anomaly residuals over the ETAS domain (Figure 14D). However, considering the residual patterns are clearly lower than others (RateV, AdvV and QV), this bias should not affect the main conclusion addressed in this study.
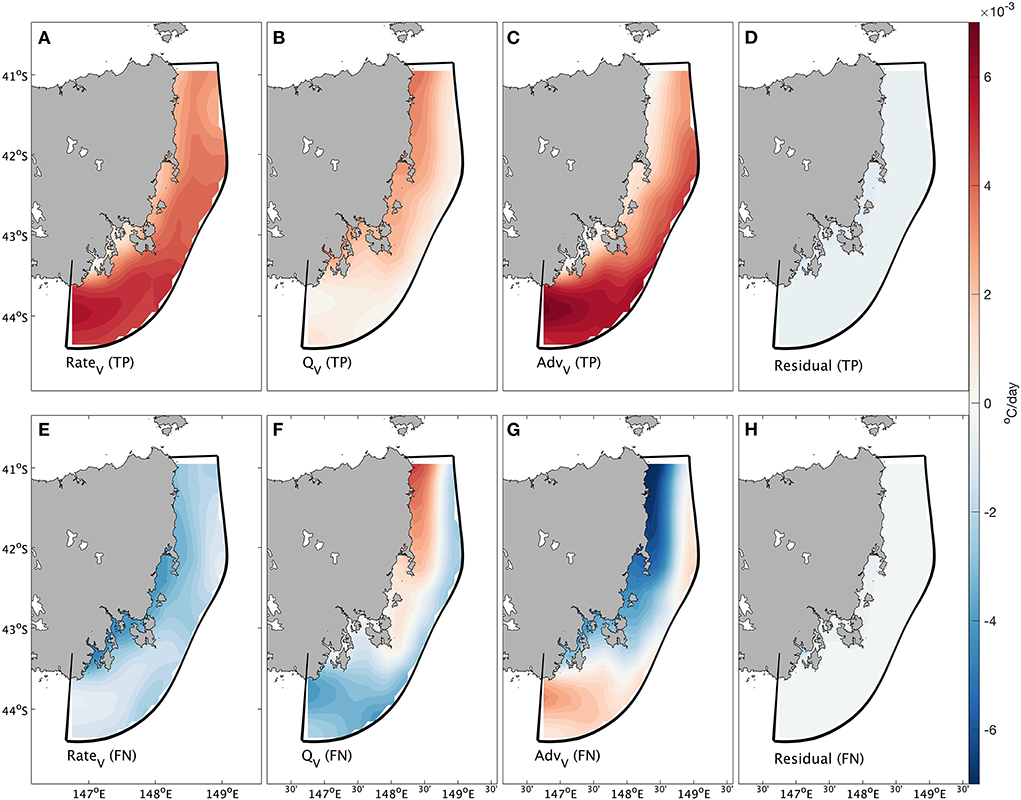
Figure 14. Results from the heat budget analysis. (A) Total change rate anomaly (°C/day) averaged across all true positive forecasts. (B) Change rate anomaly (°C/day) due to surface heat flux averaged all true positive forecasts. (C) Change rate anomaly (°C/day) due to advection averaged across all true positive forecasts. (D) Change rate anomaly (°C/day) due to residuals across all true positive forecasts. (E) Total change rate anomaly (°C/day) averaged across all false negative forecasts. (F) Change rate (°C/day) due to surface heat flux averaged all false negative forecasts. (G) Change rate anomaly (°C/day) due to advection averaged across all false negative forecasts. (H) Change rate anomaly (°C/day) due to residuals across all false negative forecasts.
Discussion and conclusions
Eddy contributions to MHWs off eastern Tasmania
This study has demonstrated that the southern Tasman Sea eddy distribution can be a useful predictor of ocean advective-type MHW occurrence off eastern Tasmania up to 7 days in advance. Our findings indicate that the distribution of eddies with greater amplitude and larger size off northeast Tasmania can influence the generation of substantive MHWs off eastern and southeast Tasmania associated with anomalous southward current anomalies. Specifically, we contend that the physical connection between MHWs in the southern region and eddies coming from the north is due to the imprint of the warm water transport by the mesoscale eddy distribution, including around and between the eddies, as they track into and influence the zone. These advective-type MHWs account for about 50% of all MHWs recorded in this region (Li et al., 2020). As a region of significant eddy activity associated with the western boundary current extension (EAC Extension), the western Tasman Sea region off eastern Tasmania is characterized by a high proportion of anticyclonic eddies (Figure 2) that transport positive temperature anomalies southward (e.g., Oliver et al., 2015) proximal to the Eastern Tasmania (ETAS) model domain. A self-organizing map (SOM) of size (3, 3) was applied to the oceanic states (anomalies of SST and ocean currents) during each tracked eddy, and the resulting oceanic mean states (Figure 4), percent of MHW days (Figure 5), and eddy distribution (Figure 6) were generated in each SOM node. Our findings indicate that relatively high positive temperature anomalies combined with southward current anomalies off eastern Tasmania tend to be accompanied by SOM nodes corresponding to a higher proportion of MHW days compared to climatology, and by extremely strong (intense and wide) eddies off northeast Tasmania. A heat budget analysis revealed that increased southward ocean advection, which corresponds to a more intense EAC Extension, significantly contributes to the average temperature increase in these nodes, and that this is the primary contributor to these advective-type MHWs captured in these nodes – which is consistent with previous research using other techniques. However, the present study additionally demonstrates that the co-occurrence of a high proportion of MHW days and the distribution of intense and substantive mesoscale eddies off northeast Tasmania that are associated with an overall enhancement of the southward flow can act as a source for the development of MHWs along Tasmania's eastern shelf within the subsequent 7 days.
MHWs contributed by anomalously strong southward transports in the EAC Extension have been recognized in previous studies (Oliver et al., 2017, 2018; Li et al., 2020), and our results suggest that intense and wide eddies could be potential contributors. Given that recent dynamically downscaled climate change projections indicate that eddy activity may increase in the Tasman Sea (Matear et al., 2013), it is reasonable to deduce that MHWs induced by eddies are likely to be more frequent in the future. The development of eddy–resolving ocean models provides greater potential to better model and predict eddy activity in both climatology and variability, and as such resulting in better representation of MHWs at the regional scales (Pilo et al., 2019), which is likely to benefit MHW prediction in this eastern Tasmania region.
Statistical model to predict MHWs off eastern Tasmania
Motivated by the eddies' influence on the generation of MHWs, we have developed a statistical model using a combination of self-organizing maps (SOMs) and other classification methods. The model uses cluster and classification methods to find the non-linear connection between SSH in the southern Tasman Sea and MHWs off eastern Tasmania. We found that not all domains of ETAS have a tight connection with sea surface heights in the southern Tasman Sea; only advective-type MHWs in the southern domain are likely to be skilfully forecasted using these statistical approaches based on sea surface heights in the southern Tasman Sea. When the model skilfully predicts a MHW occurrence (on a particular day), the ETAS domain tends to be dominated by a southward current anomaly, accompanied by a configuration of eddies distributed off northeast Tasmania. The rate of change of the mixed layer temperature (temperature tendency) during these predicted MHW days in the southern ETAS domain, where the MHW events can be accurately predicted, is positively contributed by advection, corresponding to the southward current anomalies in the EAC Extension. This indicates that the model has practical skill in capturing MHWs due to increased southward transports from a more intense EAC Extension and that these MHWs are effectively predictable from SSHA in the Tasman Sea.
How the gradients of sea surface heights in the southern Tasman Sea dynamically induce MHWs off eastern Tasmania is currently being explored. We have determined that eddies in the southern Tasman Sea influence the patterns of MHWs in the ETAS domain and strong anticyclonic eddies can potentially develop MHWs in this region. Further, strong eddies off northeast Tasmania can transport warm water southward into the ETAS domain, with the potential to develop MHWs there. This complements previous research on the importance of upper ocean heat content and westward propagating oceanic Rossby waves on Tasman Sea MHWs (Behrens et al., 2019; Li et al., 2020, 2022). Collectively, these studies show that MHWs off eastern Tasmania are potentially predictable, from oceanic processes, on multiple time scales ranging from multi–year (shown in previous studies) to several days (as shown here).
The varying performance of the model in the southern (good) and northern (weak) domains reveal spatial variability of MHW responses to sea surface height distributions in the Tasman Sea. The boundary current confluence is influenced most strongly by the EAC Extension pushing south in summer and the Zeehan Current pushing north in winter (Figure 1B; Oliver et al., 2016). When MHWs occur due to advection, the intensified EAC Extension dominates (Oliver and Holbrook, 2018; Li et al., 2020), inducing the shift of the dominant circulation (from northward Zeehan Current to southward EAC). This feature makes the southern ETAS domain more responsive to the enhanced southward current anomaly in the EAC Extension, and better prediction skill.
Limitations of this model are as follows. First, this model is only useful to predict MHWs caused by anomalous oceanic advection and is not designed to predict MHWs associated with anomalous surface heat fluxes. Second, the model is configured for Tasmania's eastern shelf, where anomalous oceanic advection explains about 50% of all MHW events in the region (under the influence of poleward western boundary current transport variations; Li et al., 2020) – the model design may well be much less successfully applied elsewhere if other factors are more important. Finally, the spatial resolution of the data used may be important since it can affect the number of covariates in the model and subsequently influence the prediction results.
Two modifications may contribute to model improvement in the future:
• Adding atmospheric “forcing” considerations – including air-sea heat fluxes within the domain and/or possibly tracking atmospheric temperature anomalies from elsewhere into the domain; and/or
• Individually choosing covariates besides sea surface height for each grid cell across the domain which could be done by testing the statistical significance of the coherence between MHW time series at each grid point (or cell) and the particular covariates.
Data availability statement
The original contributions presented in the study are included in the article/supplementary material; further inquiries can be directed to the corresponding author/s.
Author contributions
ZZ conducted the analysis and generated the figures. All authors developed the conceptual framework, contributed to interpreting the results, writing, and editing the manuscript, and approved the submitted version.
Funding
ZZ acknowledges original Honors scholarship support provided by the Australian Research Council Centre of Excellence for Climate System Science. NH acknowledges funding support from the ARC Centre of Excellence for Climate Extremes (CE170100023) and the Australian Government National Environmental Science Program Climate Systems Hub. EO acknowledges support from the National Sciences and Engineering Research Council of Canada Discovery Grant RGPIN-2018-05255 and from the Marine Environmental Observation, Prediction and Response Network (MEOAR) project Drivers, predictability and fisheries impacts of ocean temperature extremes.
Acknowledgments
We would like to thank Zeya Li, Yueyang Lu, and Yue Man for thoughtful discussions. We would also like to thank the two reviewers for their constructive and valuable comments that have acted to significantly improve our manuscript.
Conflict of interest
The authors declare that the research was conducted in the absence of any commercial or financial relationships that could be construed as a potential conflict of interest.
The handling editor AG declared a past co-authorship with the author(s) NH and EO.
Publisher's note
All claims expressed in this article are solely those of the authors and do not necessarily represent those of their affiliated organizations, or those of the publisher, the editors and the reviewers. Any product that may be evaluated in this article, or claim that may be made by its manufacturer, is not guaranteed or endorsed by the publisher.
References
Behrens, E., Fernandez, D., and Sutton, P. (2019). Meridional oceanic heat transport influences marine heatwaves in the Tasman Sea on interannual to decadal timescales. Front. Mar. Sci. 6, 228. doi: 10.3389/fmars.2019.00228
Benthuysen, J., Feng, M., and Zhong, L. (2014). Spatial patterns of warming off Western Australia during the 2011 Ningaloo Niño: quantifying impacts of remote and local forcing. Cont. Shelf Res. 91, 232–246. doi: 10.1016/j.csr.2014.09.014
Benthuysen, J. A., Smith, G. A., Spillman, C. M., and Steinberg, C. R. (2021). Subseasonal prediction of the 2020 Great Barrier Reef and Coral Sea marine heatwave. Environ. Res. Lett. 16, 124050. doi: 10.1088/1748-9326/ac3aa1
Castellani, M. (2006). Identification of eddies from sea surface temperature maps with neural networks. Int. J. Remote Sens. 27, 1601–1618. doi: 10.1080/01431160500462170
Cavazos, T. (2000). Using self-organizing maps to investigate extreme climate events: An application to wintertime precipitation in the Balkans. J. Clim. 13, 1718–1732. doi: 10.1175/1520-0442(2000)013<1718:USOMTI>2.0.CO;2
Chaigneau, A., Gizolme, A., and Grados, C. (2008). Mesoscale eddies off Peru in altimeter records: identification algorithms and eddy spatio-temporal patterns. Prog. Oceanogr. 79, 106–119. doi: 10.1016/j.pocean.2008.10.013
Chaigneau, A., Le Texier, M., Eldin, G., Grados, C., and Pizarro, O. (2011). Vertical structure of mesoscale eddies in the eastern South Pacific Ocean: a composite analysis from altimetry and Argo profiling floats. J. Geophys. Res. Oceans 116. doi: 10.1029/2011JC007134
Chelton, D. B., Schlax, M. G., and Samelson, R. M. (2011). Global observations of nonlinear mesoscale eddies. Prog. Oceanogr. 91, 167–216. doi: 10.1016/j.pocean.2011.01.002
Chen, N., Gilani, F., and Harlim, J. (2021). A Bayesian machine learning algorithm for predicting ENSO using short observational time series. Geophys. Res. Lett. 48, e2021GL093704. doi: 10.1029/2021GL093704
Cresswell, G. R., and Legeckis, R. (1986). Eddies off southeastern Australia. Deep Sea Res. Part A Oceanographic Res. Papers 33, 1527–1562. doi: 10.1016/0198-0149(86)90066-X
D'Alimonte, D. (2009). Detection of mesoscale eddy-related structures through iso-SST patterns. IEEE Geosci. Remote Sens. Lett. 6, 189–193. doi: 10.1109/LGRS.2008.2009550
Di Lorenzo, E., and Mantua, N. (2016). Multi-year persistence of the 2014/15 North Pacific marine heatwave. Nat. Clim. Chang. 6, 1042–1047. doi: 10.1038/nclimate3082
Dong, C., Nencioli, F., Liu, Y., and McWilliams, J. C. (2011). An automated approach to detect oceanic eddies from satellite remotely sensed sea surface temperature data. IEEE Geosci. Remote Sens. Lett. 8, 1055–1059. doi: 10.1109/LGRS.2011.2155029
Everett, J. D., Baird, M. E., Oke, P. R., and Suthers, I. M. (2012). An avenue of eddies: quantifying the biophysical properties of mesoscale eddies in the Tasman Sea. Geophys. Res. Lett. 39. doi: 10.1029/2012GL053091
Faghmous, J. H., Chamber, Y., Boriah, S., Vikebø, F., Liess, S., dos Santos Mesquita, M., et al. (2012a). “A novel and scalable spatio-temporal technique for ocean eddy monitoring,” in Twenty-Sixth AAAI Conference on Artificial Intelligence.
Faghmous, J. H., Frenger, I., Yao, Y., Warmka, R., Lindell, A., and Kumar, V. (2015). A daily global mesoscale ocean eddy dataset from satellite altimetry. Sci. Data 2, 1–16. doi: 10.1038/sdata.2015.28
Faghmous, J. H., and Kumar, V. (2014). “Spatio-temporal data mining for climate data: advances, challenges, and opportunities,” in Data Mining and Knowledge Discovery for Big Data (Berlin, Heidelberg: Springer), 83–116. doi: 10.1007/978-3-642-40837-3_3
Faghmous, J. H., Le, M., Uluyol, M., Kumar, V., and Chatterjee, S. (2013). “A parameter-free spatio-temporal pattern mining model to catalog global ocean dynamics,” in Data Mining (ICDM), 2013 IEEE 13th International Conference on (IEEE), 151–160. doi: 10.1109/ICDM.2013.162
Faghmous, J. H., Styles, L., Mithal, V., Boriah, S., Liess, S., Kumar, V., et al. (2012b). “Eddyscan: a physically consistent ocean eddy monitoring application,” in Intelligent Data Understanding (CIDU), 2012 Conference on (IEEE), 96–103. doi: 10.1109/CIDU.2012.6382189
Fang, F., and Morrow, R. (2003). Evolution, movement and decay of warm-core Leeuwin Current eddies. Deep Sea Res. Part II Topical Stud. Oceanography 50, 2245–2261. doi: 10.1016/S0967-0645(03)00055-9
Fawcett, T. (2006). An introduction to ROC analysis. Pattern Recognit. Lett. 27, 861–874. doi: 10.1016/j.patrec.2005.10.010
Fernandes, A., and Nascimento, S. (2006). “Automatic water eddy detection in SST maps using random ellipse fitting and vectorial fields for image segmentation,” in International Conference on Discovery Science (Berlin, Heidelberg: Springer), 77–88. doi: 10.1007/11893318_11
Ganachaud, A., Cravatte, S., Melet, A., Schiller, A., Holbrook, N. J., Sloyan, B. M., et al. (2014). The Southwest Pacific Ocean circulation and climate experiment (SPICE). Special Section Western Pacific Ocean Circulat. Climate J. Geophys. Res. Oceans 119, 7660–7686. doi: 10.1002/2013JC009678
Garrabou, J., Coma, R., Bensoussan, N., Bally, M., Chevaldonné, P., Cigliano, M., et al. (2009). Mass mortality in Northwestern Mediterranean rocky benthic communities: effects of the 2003 heat wave. Glob. Chang. Biol. 15, 1090–1103. doi: 10.1111/j.1365-2486.2008.01823.x
Gibson, P. B., Perkins-Kirkpatrick, S. E., and Renwick, J. A. (2016). Projected changes in synoptic weather patterns over New Zealand examined through self-organizing maps. Int. J. Climatol. 36, 3934–3948. doi: 10.1002/joc.4604
Godfrey, J. S., Cresswell, G. R., Golding, T. J., Pearce, A. F., and Boyd, R. (1980). The separation of the east Australian current. J. Phys. Oceanogr. 10, 430–440.
Hartigan, J. A., and Wong, M. A. (1979). Algorithm AS 136: a k-means clustering algorithm. J. Royal Statistical Society Series C (Applied Statistics) 28, 100–108. doi: 10.2307/2346830
Herzfeld, M. (2006). An alternative coordinate system for solving finite difference ocean models. Ocean Modelling 14, 174–196. doi: 10.1016/j.ocemod.2006.04.002
Hobday, A. J., Alexander, L. V., Perkins, S. E., Smale, D. A., Straub, S. C., Oliver, E. C., et al. (2016). A hierarchical approach to defining marine heatwaves. Prog. Oceanogr. 141, 227–238. doi: 10.1016/j.pocean.2015.12.014
Hobday, A. J., and Pecl, G. T. (2014). Identification of global marine hotspots: sentinels for change and vanguards for adaptation action. Rev. Fish Biol. Fish 24, 415–425. doi: 10.1007/s11160-013-9326-6
Holbrook, N. J., Scannell, H. A., Sen Gupta, A., Benthuysen, J. A., Feng, M., Oliver, E. C. J., et al. (2019). A global assessment of marine heatwaves and their drivers. Nat. Commun. 10, 2624. doi: 10.1038/s41467-019-10206-z
Holbrook, N. J., Sen Gupta, A., Oliver, E. C. J., Hobday, A. J., Benthuysen, J. A., Scannell, H. A., et al. (2020). Keeping pace with marine heatwaves. Nature Rev. Earth Environ. 1, 482–493. doi: 10.1038/s43017-020-0068-4
Holyer, R. J., and Peckinpaugh, S. H. (1989). Edge detection applied to satellite imagery of the oceans. IEEE Trans. Geosci. Remote Sens. 27, 46–56. doi: 10.1109/36.20274
Isern-Fontanet, J., García-Ladona, E., and Font, J. (2003). Identification of marine eddies from altimetric maps. J. Atmospheric Oceanic Technol. 20, 772–778. doi: 10.1175/1520-0426(2003)20<772:IOMEFA>2.0.CO;2
Johnson, C. R., Banks, S. C., Barrett, N. S., Cazassus, F., Dunstan, P. K., Edgar, G. J., et al. (2011). Climate change cascades: Shifts in oceanography, species' ranges and subtidal marine community dynamics in eastern Tasmania. J. Exp. Mar. Biol. Ecol. 400, 17–32. doi: 10.1016/j.jembe.2011.02.032
Johnson, N. C. (2013). How many ENSO flavors can we distinguish? J. Clim. 26, 4816–4827. doi: 10.1175/JCLI-D-12-00649.1
Kohonen, T. (1995). “Learning vector quantization,” in Self-organizing maps (Berlin, Heidelberg: Springer), 175–189. doi: 10.1007/978-3-642-97610-0_6
Last, P. R., White, W. T., Gledhill, D. C., Hobday, A. J., Brown, R., Edgar, G. J., et al. (2011). Long-term shifts in abundance and distribution of a temperate fish fauna: a response to climate change and fishing practices. Global Ecol. Biogeography 20, 58–72. doi: 10.1111/j.1466-8238.2010.00575.x
Li, J., Roughan, M., and Kerry, C. (2021). Dynamics of interannual eddy kinetic energy modulations in a Western Boundary Current. Geophys. Res. Lett. 48, e2021GL094115. doi: 10.1029/2021GL094115
Li, J., Roughan, M., and Kerry, C. (2022). Variability and drivers of ocean temperature extremes in a warming Western Boundary Current. J. Clim. 35, 1097–1111. doi: 10.1175/JCLI-D-21-0622.1
Li, Z., Holbrook, N. J., Zhang, X., Oliver, E. C. J., and Cougnon, E. A. (2020). Remote forcing of Tasman Sea marine heatwaves. J. Clim. 33, 5337–5354. doi: 10.1175/JCLI-D-19-0641.1
Liu, Y., and Weisberg, R. H. (2005). Patterns of ocean current variability on the West Florida Shelf using the self-organizing map. J. Geophys. Res. Oceans 110. doi: 10.1029/2004JC002786
Liu, Y., Weisberg, R. H., and Mooers, C. N. (2006). Performance evaluation of the self-organizing map for feature extraction. J. Geophys. Res. Oceans 111. doi: 10.1029/2005JC003117
Malan, N., Archer, M., Roughan, M., Cetina-Heredia, P., Hemming, M., Rocha, C., et al. (2020). Eddy-driven cross-shelf transport in the East Australian Current separation zone. J. Geophys. Res. Oceans 125, e2019JC015613. doi: 10.1029/2019JC015613
Matear, R., Chamberlain, M., Sun, C., and Feng, M. (2013). Climate change projection of the Tasman Sea from an eddy-resolving ocean model. J. Geophys. Res. Oceans. 118, 2961–2976. doi: 10.1002/jgrc.20202
Mills, K. E., Pershing, A. J., Brown, C. J., Chen, Y., Chiang, F. S., Holland, D. S., et al. (2013). Fisheries management in a changing climate: lessons from the 2012 ocean heat wave in the Northwest Atlantic. Oceanography 26, 191–195. doi: 10.5670/oceanog.2013.27
Nilsson, C. S., and Cresswell, G. R. (1980). The formation and evolution of East Australian Current warm-core eddies. Prog. Oceanogr. 9, 133–183. doi: 10.1016/0079-6611(80)90008-7
Oke, P. R., Sakov, P., Cahill, M. L., Dunn, J. R., Fiedler, R., Griffin, D. A., et al. (2013). Towards a dynamically balanced eddy-resolving ocean reanalysis: BRAN3. Ocean Model. 67, 52–70. doi: 10.1016/j.ocemod.2013.03.008
Oliver, E. C. (2019). Mean warming not variability drives marine heatwave trends. Climate Dyn. 53, 1653–1659. doi: 10.1007/s00382-019-04707-2
Oliver, E. C., Benthuysen, J. A., Bindoff, N. L., Hobday, A. J., Holbrook, N. J., Mundy, C. N., et al. (2017). The unprecedented 2015/16 Tasman Sea marine heatwave. Nat. Commun. 8, 16101. doi: 10.1038/ncomms16101
Oliver, E. C., Herzfeld, M., and Holbrook, N. J. (2016). Modelling the shelf circulation off eastern Tasmania. Cont. Shelf Res. 130, 14–33. doi: 10.1016/j.csr.2016.10.005
Oliver, E. C., and Holbrook, N. J. (2018). Variability and long-term trends in the shelf circulation off Eastern Tasmania. J. Geophys. Res. Oceans 123, 7366–7381. doi: 10.1029/2018JC013994
Oliver, E. C., Lago, V., Hobday, A. J., Holbrook, N. J., Ling, S. D., and Mundy, C. N. (2018). Marine heatwaves off eastern Tasmania: trends, interannual variability, and predictability. Prog. Oceanogr. 161, 116–130. doi: 10.1016/j.pocean.2018.02.007
Oliver, E. C., O'Kane, T. J., and Holbrook, N. J. (2015). Projected changes to Tasman Sea eddies in a future climate. J. Geophys. Res. Oceans 120, 7150–7165. doi: 10.1002/2015JC010993
Oliver, E. C. J., and Holbrook, N. J. (2014). Extending our understanding of South Pacific gyre “spin-up”: modeling the East Australian Current in a future climate. J. Geophys. Res. Oceans 119, 2788–2805. doi: 10.1002/2013JC009591
Pearce, A. F., and Feng, M. (2013). The rise and fall of the “marine heat wave” off Western Australia during the summer of 2010/2011. J. Marine Syst. 111, 139–156. doi: 10.1016/j.jmarsys.2012.10.009
Perkins, N. J., and Schisterman, E. F. (2006). The inconsistency of “optimal” cutpoints obtained using two criteria based on the receiver operating characteristic curve. Am. J. Epidemiol. 163, 670–675. doi: 10.1093/aje/kwj063
Perry, A. L., Low, P. J., Ellis, J. R., and Reynolds, J. D. (2005). Climate change and distribution shifts in marine fishes. Science 308, 1912–1915. doi: 10.1126/science.1111322
Pilo, G. S., Holbrook, N. J., Kiss, A. E., and Hogg, A. M. (2019). Sensitivity of marine heatwave metrics to ocean model resolution. Geophys. Res. Lett. 46, 14604–14612. doi: 10.1029/2019GL084928
Ridgway, K., and Hill, K. (2009). The East Australian current. A marine climate change impacts adaptation report card for Australia. NCCARF Publication. 5.
Ridgway, K. R. (2007). Seasonal circulation around Tasmania: an interface between eastern and western boundary dynamics. J. Geophys. Res. Oceans 112. doi: 10.1029/2006JC003898
Ridgway, K. R., and Dunn, J. R. (2003). Mesoscale structure of the mean East Australian Current System and its relationship with topography. Prog. Oceanogr. 56, 189–222. doi: 10.1016/S0079-6611(03)00004-1
Robin, X., Turck, N., Hainard, A., Tiberti, N., Lisacek, F., Sanchez, J. C., et al. (2011). pROC: an open-source package for R and S+ to analyze and compare ROC curves. BMC Bioinform. 12, 77. doi: 10.1186/1471-2105-12-77
Saha, S., Moorthi, S., Pan, H. L., Wu, X., Wang, J., Nadiga, S., et al. (2010). The NCEP climate forecast system reanalysis. Bull. Am. Meteorol. Soc. 91, 1015–1058. doi: 10.1175/2010BAMS3001.1
Saha, S., Moorthi, S., Wu, X., Wang, J., Nadiga, S., Tripp, P., et al. (2014). The NCEP climate forecast system version 2. J. Clim. 27, 2185–2208. doi: 10.1175/JCLI-D-12-00823.1
Schlegel, R. W., Oliver, E. C., Perkins-Kirkpatrick, S., Kruger, A., and Smit, A. J. (2017). Predominant atmospheric and oceanic patterns during coastal marine heatwaves. Front. Mar. Sci. 4, 323. doi: 10.3389/fmars.2017.00323
Sen Gupta, A., Thomsen, M., Benthuysen, J. A., Hobday, A. J., Oliver, E., Alexander, L. V., et al. (2020). Drivers and impacts of the most extreme marine heatwave events. Sci. Rep. 10. doi: 10.1038/s41598-020-75445-3
Silini, R., Barreiro, M., and Masoller, C. (2021). Machine learning prediction of the Madden-Julian oscillation. NPJ Climate Atmosph. Sci. 4, 1–7. doi: 10.1038/s41612-021-00214-6
Smale, D. A., Wernberg, T., Oliver, E. C., Thomsen, M., Harvey, B. P., Straub, S. C., et al. (2019). Marine heatwaves threaten global biodiversity and the provision of ecosystem services. Nat. Clim. Chang. 9, 306–312. doi: 10.1038/s41558-019-0412-1
Suthaharan, S. (2016). “Support vector machine”, in Machine Learning Models and Algorithms for Big Data Classification. Springer.
Tetko, I. V., Livingstone, D. J., and Luik, A. I. (1995). Neural network studies. 1. Comparison of overfitting and overtraining. J. Chem. Inform. Comput. Sci. 35, 826–833. doi: 10.1021/ci00027a006
Van Sebille, E., England, M. H., and Froyland, G. (2012). Origin, dynamics and evolution of ocean garbage patches from observed surface drifters. Environ. Res. Lett. 7, 044040. doi: 10.1088/1748-9326/7/4/044040
Vesanto, J., Himberg, J., Alhoniemi, E., and Parhankangas, J. (2000). SOM toolbox for Matlab 5. Finland: Helsinki University of Technology. 109.
Wang, W., Xie, P., Yoo, S. H., Xue, Y., Kumar, A., and Wu, X. (2011). An assessment of the surface climate in the NCEP climate forecast system reanalysis. Climate Dyn. 37, 1601–1620. doi: 10.1007/s00382-010-0935-7
Webb, G. I., Keogh, E., and Miikkulainen, R. (2010). Naïve Bayes. Encyclopedia Machine Learn. 15, 713–714.
Wernberg, T., Smale, D. A., Tuya, F., Thomsen, M. S., Langlois, T. J., De Bettignies, T., et al. (2013). An extreme climatic event alters marine ecosystem structure in a global biodiversity hotspot. Nat. Clim. Chang. 3, 78. doi: 10.1038/nclimate1627
Williams, R. N., de Souza, P. A. Jr, and Jones, E. M. (2014). Analysing coastal ocean model outputs using competitive-learning pattern recognition techniques. Environ. Model. Softw. 57, 165–176. doi: 10.1016/j.envsoft.2014.03.001
Wong, T. T. (2015). Performance evaluation of classification algorithms by k-fold and leave-one-out cross validation. Pattern Recognit. 48, 2839–2846. doi: 10.1016/j.patcog.2015.03.009
Zhang, G. P. (2003). Time series forecasting using a hybrid ARIMA and neural network model. Neurocomputing 50, 159–175. doi: 10.1016/S0925-2312(01)00702-0
Appendix
The self-organizing map (SOM) approach can be described as a two-layer neural network, which is a combination of an n dimensional input layer (corresponding to data with n variables) and an m dimensional output layer. The size m of the output layer is typically set by researchers, and the means to choose a suitable m is then described in the following contents. In the SOM algorithm, every output node i is connected to each input node by a particular weighting vector ωi. When the training of the SOM starts, every output node is randomly assigned an initial weighting vector. Some statistical procedure could contribute to choose a suitable initial guess, such as principal component analysis (Williams et al., 2014; Oliver et al., 2018). A brief introduction to the SOM algorithm is provided in Appendix Section The SOM training algorithm.
The primary step in executing the SOM is to determine the size of the SOM (Gibson et al., 2016). Importantly, it is not only necessary to reduce the dimension of the data, but also to retain the spatiotemporal variability of the raw data as completely as possible. Several potential methods have been used in previous research, such as determining the significantly distinct groups (Williams et al., 2014; Oliver et al., 2018) and obtaining large amounts of clusters based on the length of the dataset (Vesanto et al., 2000). Here, we use the proportion of the within sum of squares (WSS) with respect to the total sum of squares (TSS), i.e., WSS/TSS, which is the sum of WSS and the between sum of squares (BSS), to determine the size of the SOM. WSS, BSS and TSS are determined as follows:
where NC is the number of clusters, Ci is the ith cluster, ∥Ci∥ is the number of objects in the ith cluster, x is the object, is the sample mean and is the sample mean located in the ith cluster. Generally, WSS is a measure of compactness, while BSS is a measure of separation. Therefore, a good cluster algorithm should have a relatively small WSS/TSS. However, as the number of cluster groups (map size) increases, WSS/TSS should tend to decrease (Hartigan and Wong, 1979). Therefore, a selection of the number of cluster groups which induce WSS/TSS to start to decrease slowly is required (Martin and Maes, 1979). But this approach may not ensure dissimilarity between different groups. An acceptable way to account for this is to use an analysis of similarity, such as a simple t-test, to ensure that different groups are significantly distinct (Schlegel et al., 2017). Consequently, determining the number of cluster groups is achieved by firstly obtaining the number of clusters based on the change of the WSS/TSS ratio, and then executing an analysis of similarity to ensure distinction between the different groups.
The SOM training algorithm
The most computationally efficient algorithm to train the SOM is the batch algorithm (Vesanto et al., 2000). To execute the algorithm, each observation xk (k ranges from 1 to n) in some input data x is compared with every weighting vector ωi (i ranges from 1 to m) and the output node with least Euclidean distance is chosen as the Best Matching Unit (BMU; Liu et al., 2006). The choice of the BMU for observation k in the input data x could be expressed as:
where ck is the BMU for observation k in input data x. After that, every observation in the input data is connected to a corresponding output node, so input data x is summarized into m groups, corresponding to m output nodes. Then, the weighting vector ωi is updated following the rule:
where is the mean of the nj observations located in output node j, and hij(t) is the value of the neighborhood function for output node j when the function is centered in the output node i. The generally used neighborhood function is a Gaussian function which can be described as:
where dij is the Euclidean distance between the output node i and output node j, and σt is the neighborhood radius which should decrease linearly with the increase of time t.
During every step of the iterative process, the weighting vector ωi is updated following the algorithm described above until ωi(t+1) = ωi(t). The final weighting vector for each output node is defined as a codebook vector, which could be used to summarize the general pattern and variability of the input data. The cluster result for observation xk in the input data x is determined by:
where Ck ranges from 1 to M.
The algorithm described above is the batch algorithm, which is recognized as the most efficient algorithm to train the SOM (Vesanto et al., 2000). Other algorithms are available, such as the sequential version of the SOM algorithm. However, this algorithm is relatively inefficient due to the fact that weighting vectors are updated separately during every iterative process. Typically, the batch algorithm is the most acceptable algorithm to train the SOM.
Model details
Obtaining the seasonal probability patterns
A particular dataset of historical SSHA(x, y, t), where x, y and t separately indicate horizontal locations and time, is transferred to a data frame SSHA(t, v), where v indicates the location in the domain (that is, x and y have been flattened into a single spatial variable). Then, a SOM with map size (m, n), where m × n = K, is applied to this data frame, dividing the data frame into multiple groups along the t direction based on the variable v. The map size (m, n) is determined by finding the corresponding map size where the first difference of WSS/TSS becomes smaller than 0.01. For a particular node p, the SSHA located in that node is determined as SSHAp (tp, v), where tp indicates the time points located in node p. After that, for a particular grid (x, y) in the domain of ETAS, the binary time series ζ (x, y, t) is firstly transformed to ζk (x, y, t) by a suitable lag k, and then separated into K ζkp (x, y, tp) corresponding to SSHAp (tp, v) in each node. Subsequently, the seasonal probability patterns, i.e. the proportion of ζkp(x, y, tp) = 1 at each grid point (x, y), is calculated for each node. Seasons here are determined as austral Spring = SON, Summer = DJF, Autumn = MAM, Winter = JJA (following the definition given by the Australian Bureau of Meteorology http://www.bom.gov.au/climate/glossary/seasons.shtml). Finally, we obtained 4 (number of seasons) × K (number of nodes) lagged probability patterns of MHWs in the ETAS domain. Here, we consider the seasonal variability of MHWs, hence the probability pattern is calculated seasonally for each node, since monthly (corresponding to 12 × K probability patterns) or daily (corresponding to 366 × K probability patterns) variability may cause overfitting due to the relatively short length of our records (about 20 years; Tetko et al., 1995; Zhang, 2003).
Training the classifier
Through the processing described in the previous section, every time point of the SSHA in the southern Tasman Sea is labeled into a particular node. These labeled data are collected and used to train a classifier following a particular algorithm (see below) to label new input data. It should be noted that the SOM could be treated as a classification algorithm, due to the fact that it can label new input data into different nodes directly based on its Euclidean distance to each codebook vector. Here, we use a fitted SOM as one of our classification methods. Additionally, we also try two other classification which are Naive Bayes (NB; Webb et al., 2010) and linear Support Vector Machine (SVM; Suthaharan, 2016) to test the adaptation of this model to various classification methods.
Predicting input data
After training the classifier, we used it to label new input data into a particular SOM node. Then, based on the determined node and its located season, we could determine the corresponding lagged probability pattern of these input data.
Transferring probability patterns to binary patterns
Considering a general predictive problem in the binary classification algorithm, the following statements could be determined. For input vector (mi, ni) [mi is a vector and niis the class (0 or 1)], a binary (true or false) classification algorithm would return a probability ϕ revealing the certainty that the input is determined as a true class. Based on a threshold μ, ϕμ could be used to determine the class of the input data mi following the rule ϕμ(mi) = 1 if ϕ(mi) > μ and ϕμ(mi) = 0 otherwise. Based on this process, there are four possible conditions for any input data (mi, ni): true positive (TP), indicating the condition that ni = 1 and ϕμ(mi) = 1; false positive (FP), indicating the condition that ni = 0 and ϕμ(mi) = 1; true negative (TN), indicating the condition that ni = 0 and ϕμ(mi) = 0; and false negative (FN), indicating the condition that ni = 1 and ϕμ(mi) = 0. Based on these four conditions, a set of statistics could be calculated: True Positive Rate, , which is also known as Recall or Sensitivity; False Positive Rate, ; Precision, ; and Specificity, .
The probability patterns determined in the previous section cannot be used directly in binary predicting problems unless they are transferred into binary patterns based on a particular threshold μ, as shown above. In transferring each probability pattern to a binary pattern, the primary step is to set the threshold for a probability time series in each grid of the probability pattern. There are various criteria to set the threshold, such as the F-measure . The traditional F-measure (F1 score) is the harmonic mean of Precision and Recall, which could be expressed as:
F1 ranges from 0 to 1 and a larger F1 indicates a better performance of the algorithm under the chosen threshold. F1 is used here to determine the threshold since it could provide the optimal prediction in the current study compared to other methods, including Youden's J statistics (Youden, 1950) and its developed versions (Fawcett, 2006; Perkins and Schisterman, 2006; Robin et al., 2011).
The details of the (3,3) SOM nodes
The details of each node in the SOM (Section Connections between eddies and MHWs) are summarized here.
Node (1, 1): Taking a relatively large proportion (17.83 %) of all tracked long-lived eddies, Node (1, 1) identifies 42 anticyclonic eddies and 32 cyclonic eddies. In this node, the ocean off eastern Tasmania is generally dominated by negative SSTA and relatively weak northward current anomalies. There are less MHW days in the domain of ETAS, which is dramatically lower than climatology (~10%). Eddies in this node are homogeneously distributed in the southern Tasman Sea, surrounding the east coast of Tasmania. Despite several strong (high amplitude and large size) anticyclonic eddies off northeast Tasmania, this node is generally characterized by eddies with relatively low amplitude and small size.
Node (2, 1): takes a relatively low proportion (6.02%) of all tracked long-lived eddies, consisting of 16 anticyclonic eddies and 9 cyclonic eddies. The oceanic states are generally dominated by weakly negative temperature anomalies, accompanied by southward current anomalies. The proportion of MHW days is significantly larger than shown in Node (1, 1), but still lower than climatology. The distribution of eddies in this node is relatively sparse, characterized by eddies with small size and weak amplitude.
Node (3, 1): contains the largest proportion (18.80%) of all tracked long-lived eddies, consisting of 45 anticyclonic eddies and 33 cyclonic eddies. The oceanic state off eastern Tasmania is generally characterized by positive temperature anomalies, accompanied by the dominance of southward current anomalies. The proportion of MHW days is generally larger than climatology, but there is spatial variability shown by the opposite patterns separately existing along the southeast coast of Tasmania. Eddies surround the east coast of Tasmania, including several significant strong anticyclonic eddies off northeast Tasmania and a strong anticyclonic eddy off southeast Tasmania.
Node (1, 2): takes a relatively low percentage (11.08%) of all tracked long-lived eddies, consisting of 28 anticyclonic eddies and 18 cyclonic eddies. In this node, the dominance of strong southward current anomalies exists in the ETAS domain, accompanied by negative SSTA off eastern Tasmania. There are also less MHW days in the ETAS domain with respect to climatology. In this node, eddies surround the east coast of Tasmania, and most anticyclonic eddies are located off northeast Tasmania. This node is generally characterized by eddies with relatively low amplitude and small size, with several exceptions off northeast Tasmania.
Node (2, 2): takes the least proportion (4.82%) of all tracked long-lived eddies, including 11 anticyclonic eddies and 9 cyclonic eddies. The oceanic states are generally dominated by weakly positive temperature anomalies and northward current anomalies. The proportion of MHW days is ~0.05, with higher proportions off northeast Tasmania and relatively lower proportions in the region around the southeast of the ETAS domain. Several strong anticyclonic eddies exist off northeast Tasmania, characterized by large size and strong amplitude.
Node (3, 2): takes a small proportion (7.47%) of all tracked long-lived eddies, including 22 anticyclonic eddies and 9 cyclonic eddies. The oceanic states are generally dominated by positive temperature anomalies and southward current anomalies. The proportion of MHW days is generally larger than climatology, except regions on the southeast coast of Tasmania show opposite patterns. Extremely strong anticyclonic eddies are located off northeast Tasmania, accompanied by other eddies evenly distributed across the southern Tasman Sea.
Node (1, 3): takes a relatively large proportion (15.42%) of all tracked long-lived eddies, containing 42 anticyclonic eddies and 22 cyclonic eddies. The oceanic state is dominated by negative temperature anomalies and southward current anomalies. The proportion of MHW days is generally lower than climatology. Eddies are mostly located in the open sea or off southeast Tasmania, consisting of relatively weak eddies.
Node (2, 3): takes a small proportion (5.30%) of all tracked long-lived eddies and consists of 12 anticyclonic eddies and 10 cyclonic eddies. Oceanic states are generally dominated by positive temperature anomalies, accompanied with northward current anomalies. The proportion of MHW days in this region is generally lower than climatology, except on the southeast coast of Tasmania. A strong anticyclonic eddy is located off northeast Tasmania in this node.
Node (3, 3): takes a relatively large proportion (13.25%) of tracked eddies and contains 39 anticyclonic eddies and 16 cyclonic eddies. The oceanic states are generally dominated by strong positive temperature anomalies, accompanied by general southward current anomalies. The proportion of MHW days is significantly larger than climatology, especially off the southeast coast of Tasmania. The distribution of eddies is characterized by several extremely strong anticyclonic eddies off northeast Tasmania, accompanied by many small eddies surrounding the east coast of Tasmania
Keywords: marine heatwaves, self-organizing maps (SOMs), mesoscale eddies, Tasmania, statistical modeling, forecasting
Citation: Zhao Z, Holbrook NJ and Oliver ECJ (2022) An eddy pathway to marine heatwave predictability off eastern Tasmania. Front. Clim. 4:907828. doi: 10.3389/fclim.2022.907828
Received: 30 March 2022; Accepted: 18 July 2022;
Published: 12 August 2022.
Edited by:
Alex Sen Gupta, University of New South Wales, AustraliaReviewed by:
Junde Li, University of New South Wales, AustraliaAndrea Taschetto, University of New South Wales, Australia
Copyright © 2022 Zhao, Holbrook and Oliver. This is an open-access article distributed under the terms of the Creative Commons Attribution License (CC BY). The use, distribution or reproduction in other forums is permitted, provided the original author(s) and the copyright owner(s) are credited and that the original publication in this journal is cited, in accordance with accepted academic practice. No use, distribution or reproduction is permitted which does not comply with these terms.
*Correspondence: Zijie Zhao, emlqaXpoYW9Ac3R1ZGVudC51bmltZWxiLmVkdS5hdQ==
 Zijie Zhao
 Neil J. Holbrook
 Eric C. J. Oliver