 Nathaniel C. Johnson
 Andrew T. Wittenberg1
 Anthony J. Rosati
 Thomas L. Delworth
- 1Geophysical Fluid Dynamics Laboratory, National Oceanic and Atmospheric Administration, Princeton, NJ, United States
- 2University Corporation for Atmospheric Research, Boulder, CO, United States
The impacts of the El Niño-Southern Oscillation (ENSO) are expected to change under increasing greenhouse gas concentrations, but the large internal variability of ENSO and its teleconnections makes it challenging to detect such changes in a single realization of nature. In this study, we explore both the internal variability and radiatively forced changes of boreal wintertime ENSO teleconnection patterns through the analysis of 30-member initial condition ensembles of the Seamless System for Prediction and EArth System Research (SPEAR), a coupled global climate model developed by the NOAA Geophysical Fluid Dynamics Laboratory. We focus on the projected changes of the large-scale circulation, temperature, and precipitation patterns associated with ENSO for 1951–2100 under moderate and high emissions scenarios (SSP2-4.5 and SSP5-8.5). We determine the time of emergence of these changes from the noise of internal climate variability, by determining the time when the amplitude of the ensemble mean change in the running 30-year ENSO composites first exceeds the 1951-1980 composite anomaly amplitude by at least one ensemble standard deviation. Overall, the high internal variability of ENSO teleconnection patterns primarily limits their expected emergence to tropical and subtropical regions before 2100, where some regions experience robust changes in ENSO-related temperature, precipitation, and 500 hPa geopotential height patterns by the middle of the twenty-first century. The earliest expected emergence generally occurs over tropical South America and Southeast Asia, indicating that an enhanced risk of ENSO-related extreme weather in that region could be detected within the next few decades. For signals that are expected to emerge after 2050, both internal climate variability and scenario uncertainty contribute similarly to a time of emergence uncertainty on the order of a few decades. We further explore the diversity of ENSO teleconnections within the SPEAR large ensemble during the historical period, and demonstrate that historical relationships between tropical sea surface temperatures and ENSO teleconnections are skillful predictors of projected changes in the Northern Hemisphere El Niño 500 hPa geopotential height pattern.
Introduction
The El Niño-Southern Oscillation (ENSO) is the dominant mode of global climate variability and predictability on seasonal to interannual timescales. Although the dynamics of ENSO are primarily rooted in the interactions between the atmosphere and ocean in the tropical Pacific Ocean, the global reach of ENSO owes to the convective excitation of atmospheric teleconnection patterns that modify the large-scale atmospheric circulation (e.g., Ropelewski and Halpert, 1987; Trenberth et al., 1998; L'Heureux et al., 2015). These teleconnection patterns modify the temperature and precipitation patterns and contribute to high-impact extreme weather far removed from the ENSO action centers in the equatorial Pacific.
There is growing evidence that the teleconnection patterns excited by ENSO will undergo changes in response to increasing greenhouse gas concentrations (Yeh et al., 2018; Taschetto et al., 2020). Despite uncertainties in how the properties of ENSO itself will change (e.g., Stevenson et al., 2021), the latest generation of coupled global climate models (GCMs) project robust changes in certain facets of these teleconnection patterns in response to global warming, particularly during the boreal cold season when both ENSO and its teleconnections peak in amplitude. Most GCMs project that the anomalously strong Aleutian low associated with El Niño, a feature that projects onto the positive phase of the Pacific-North American (PNA) pattern (Johnson and Feldstein, 2010), will strengthen and shift slightly northeastward under increasing greenhouse gas forcing (Meehl and Teng, 2007; Müller and Roeckner, 2008; Kug et al., 2010; Maloney et al., 2014; Zhou et al., 2014; Michel et al., 2020), although this strengthening is less consistent at the surface (Meehl and Teng, 2007; Stevenson, 2012) than at middle and upper tropospheric levels. These changes in North Pacific circulation have notable downstream effects, particularly over North America, including an increase in El Niño-induced precipitation over California (Kug et al., 2010; Maloney et al., 2014; Zhou et al., 2014). The projected strengthening and eastward displacement of the Aleutian low is consistent with a robust projected increase in equatorial eastern Pacific convective precipitation in future El Niño events (Kug et al., 2010; Power et al., 2013; Cai et al., 2014; Zhou et al., 2014; Stevenson et al., 2021).
Although such radiatively forced changes may be robust, this conclusion only holds in an ensemble mean sense, whereby many realizations of internal climate variability are averaged out. Both ENSO itself (Wittenberg, 2009; Stevenson et al., 2012; Fedorov et al., 2020) and the atmospheric circulation accompanying ENSO-related SST anomalies (Hoerling and Kumar, 1997; Kumar and Hoerling, 1997; Sardeshmukh et al., 2000; Sterl et al., 2007; Brands, 2017; Deser et al., 2017, 2018) exhibit substantial internal variability, greatly reducing the likelihood that a single realization of nature will experience the expected changes owing to increasing greenhouse gas concentrations. Therefore, we ask the following questions: (1) Which of the projected changes in ENSO teleconnections are most likely to be experienced by humanity? (2) When can we expect such changes to emerge from the noise of internal climate variability? (3) How can the internal variability of ENSO teleconnection patterns in the historical climate inform what to expect from the response to increasing greenhouse gases?
Here, we address each of these questions for changes in boreal winter ENSO teleconnection patterns, as simulated in a coupled global climate model developed by the NOAA Geophysical Fluid Dynamics Laboratory (GFDL), the Seamless System for Prediction and EArth System Research (SPEAR). As described more thoroughly below, SPEAR is a next-generation GFDL coupled GCM that has moderately high horizontal resolution in the atmosphere (~0.5°) and that is optimized for prediction and projection from seasonal to centennial timescales. SPEAR accurately simulates the historical variability of ENSO (Delworth et al., 2020), including the amplitude, seasonal timing, and rate of onset, and, as shown below, its boreal winter teleconnection patterns. SPEAR also provides real-time seasonal predictions each month to the NOAA National Centers for Environmental Prediction through the North American Multi-Model Ensemble (NMME) project (Kirtman et al., 2014), and through this effort is a key contributor to NOAA's operational seasonal ENSO forecasts. To overcome the sampling limitations that a single realization of nature poses for this problem, we analyze a 30-member initial condition large ensemble that allows us to evaluate the role of internal climate variability in the uncertainty of ENSO teleconnection changes. Although we analyze only a single model, we focus on general insights that are most likely to hold for multi-model ensembles.
Through an analysis of El Niño and La Niña composites spanning 1951–2100 under historical and Shared Socio-economic Pathway (SSP) 2–4.5 and 5–8.5 anthropogenic emissions, we evaluate the robustness of global, boreal winter changes in near-surface air temperature, precipitation, and mid-tropospheric circulation. We further examine the leading patterns of ENSO teleconnection uncertainty in the mid-tropospheric height field, and seek commonalities between the drivers of internal teleconnection variability and the projected changes of boreal winter ENSO teleconnections.
Data and methods
SPEAR simulations
Our study focuses on the analysis of 30-member initial condition large ensemble simulations from the GFDL SPEAR coupled GCM (Delworth et al., 2020). SPEAR shares the same component models as GFDL's Global Climate Model version 4 (CM4, Held et al., 2019), which is a contributor to the Coupled Model Intercomparison Project, phase 6 (CMIP6), including the recently developed atmospheric (AM4), oceanic (MOM6), sea-ice (SIS2) and land (LM4) component models. The configuration and physical parameterization choices, however, are optimized for climate prediction and projection from seasonal to centennial timescales. The version of SPEAR we analyze here [SPEAR_MED in the notation of Delworth et al. (2020) but referred here as SPEAR for simplicity] has 33 vertical levels with a model top at 1 hPa in the atmosphere, a horizontal grid spacing of 0.5° in the atmosphere and land components, and approximate 1° horizontal spacing (telescoping to 0.33° meridional spacing near the equator) in the ocean and sea ice components. SPEAR has been successfully used for studies of climate variability, prediction, and projection spanning subseasonal (Xiang et al., 2022), seasonal (Bushuk et al., 2021, 2022; Tseng et al., 2021; Zhang et al., 2021; Jia et al., 2022), decadal (Joh et al., 2022), and multidecadal (Murakami et al., 2020; Pascale et al., 2020; Zhang and Cooke, 2021; Tseng et al., 2022) timescales.
We analyze simulations covering the period from 1951 to 2100, with historical radiative forcing for 1951–2014 and forcing under two emissions scenarios for 2015–2100, a “middle of the road” SSP2-4.5 scenario and the SSP5-8.5 high emissions scenario. We focus on the results of the SSP5-8.5 scenario but discuss comparisons with the SSP2-4.5 results. The initial conditions for the 30 ensemble members were chosen from a 600-yr period of a long pre-industrial control simulation, with each initial condition separated by 20 years, starting with year 101, in the control simulation. Each ensemble member is subjected to identical radiative forcing, and therefore all within-ensemble differences are attributed to the chaotic climate variability arising from differences in these initial conditions. Additional description of the GFDL SPEAR Large Ensembles, including instructions for accessing data, is available at https://www.gfdl.noaa.gov/spear_large_ensembles/.
Observational data sources
To evaluate SPEAR's performance in simulating boreal winter ENSO teleconnection patterns, we use several observational and reanalysis datasets covering 1951–2020. The observational SST data are from the Extended Reconstructed SST version 5 (ERSSTv5) (Huang et al., 2017). We analyze global land near-surface temperature from the Berkeley Earth Surface Temperature project (Rohde et al., 2013), and precipitation data from NOAA's Precipitation Reconstruction over Land (PREC/L; Chen et al., 2002), both of which are monthly datasets over land on a 1° latitude–longitude grid. Finally, we use gridded 500 hPa geopotential height data from the NCEP/National Center for Atmospheric Research (NCAR) Reanalysis (Kalnay et al., 1996).
ENSO composites
Our analysis focuses on the changes of global ENSO composites of 500 hPa geopotential height (z500), 2-m air temperature (T2m), and precipitation during boreal winter (December–February, DJF). Given that ENSO teleconnections are often strongest in late winter (e.g., Brönnimann, 2007), we also examined composites for January-March (JFM). The JFM composite changes are very similar to those of DJF (not shown), and so we only show the DJF results. We calculate anomalies of each variable by subtracting the calendar month means over the 1991–2020 base period (ensemble mean for the SPEAR simulation data) and then removing the long-term trend. We determine the trend by applying a locally weighted smoothing (LOESS) with a 21-year window to the anomalies of each calendar month separately (the removal of the trend eliminates any sensitivity to the choice of base period). By calculating the trends for each calendar month, we distinguish anomalies from any changes in the annual cycle.
To calculate ENSO composites, we follow conventions used by the NOAA Climate Prediction Center (CPC) to define El Niño and La Niña events. An El Niño occurs when the Niño 3.4 index, i.e., the SST anomaly averaged in the eastern-central equatorial Pacific (5°S – 5°N, 120°W – 170°W), exceeds 0.5°C for at least five consecutive overlapping 3-month seasons. Similarly, a La Niña occurs when the Niño 3.4 index falls below −0.5°C for at least 5 consecutive overlapping seasons. The only distinction between our criteria with those of NOAA CPC is the method by which the long-term trend is removed. We then calculate composite anomalies for all DJF seasons that are classified as El Niño or La Niña.
For the comparison between observed and simulated teleconnections, we composite over the full 1951–2020 period. For the analysis of teleconnection changes, we calculate 30-yr composites starting from 1951–1980 and at increments of 10 years, finishing at 2071–2100. We then evaluate the composite changes for each 30-yr period relative to the 1951–1980 base period.
Statistical significance of the composite anomalies and their changes are evaluated through the identification of local t-tests or F-tests that control the false discovery rate (FDR) at the 10% level. The FDR is the expected percentage of local null hypothesis test rejections (i.e., the composite anomalies or composite changes are different from zero) for which the respective null hypothesis is actually true (Benjamini and Hochberg, 1995; Wilks, 2016). This evaluation, which is determined by evaluating the full distribution of gridded p values and determining the critical p value that controls the specified FDR, provides a straightforward approach that guards against overinterpretation of local significance for multiple hypothesis tests, which is a common pitfall in conventional significance testing for gridded climate fields (Wilks, 2016). For the local t-tests, we assume that the data are temporally independent. We tested the sensitivity of this assumption by performing t-tests with the degrees of freedom adjusted for the lag-1 autocorrelation, and the differences were negligible (not shown).
Time of emergence
To evaluate the robustness of the ENSO teleconnection changes, as revealed in the composites, we first consider conventional statistical significance tests, where we determine the ensemble mean composite changes relative to 1951–1980 that control the false discovery rate at the 10% level based on a two-sided t-test. Conventional statistical tests, however, are strongly sensitive to ensemble size, and so they do not clearly convey the likelihood that a single realization of nature will experience the radiatively forced changes as shown in the ensemble mean. Therefore, we further examine metrics conveying the time of emergence (ToE), which convey the time at which the signal of anthropogenically forced changes emerges from the noise of internal climate variability (Giorgi and Bi, 2009; Diffenbaugh and Scherer, 2011). There is no single definition of ToE, and in this study, we adopt a definition similar to though more lenient than that of Diffenbaugh and Scherer (2011): ENSO teleconnection changes emerge when the forced ensemble mean composite change relative to the 1951–1980 composite first exceeds the ensemble standard deviation, and remains outside that standard deviation until the end of the simulation (2100). The ensemble standard deviation is calculated separately for each 30-yr period. If these criteria are met, the year of emergence is assigned to the last year in the 30-yr composite period. We choose the last year because it represents the earliest time that the full 30-yr composite can be calculated and evaluated against preceding composites.
We also evaluate the uncertainty of our ToE estimates through a bootstrap analysis. For this analysis, we calculate the ToE as described above but with the ensemble mean and standard deviation for each 30-yr composite calculated from a bootstrap resampling (with replacement) from the 30 individual ensemble members. We repeat this series of calculations to obtain 1000 bootstrap ToE calculations for each grid cell, and then we calculate the 5th and 95th percentiles of the ToE distributions to quantify the degree to which internal variability contributes to ToE uncertainty.
The signal-to-noise ratio threshold used to define the ToE is arbitrary, and the year of emergence will exhibit sensitivity to this choice. However, the patterns of emergence and general conclusions about the most robust teleconnection changes are not sensitive to this choice. In addition, we provide complementary calculations of the fraction of ensemble members that agree in sign with the ensemble mean composite changes, a metric that does not exhibit this sensitivity to signal-to-noise threshold.
Empirical orthogonal function analysis
We also use empirical orthogonal function (EOF) analysis to investigate ENSO teleconnection variability and change. For this purpose, we separately use EOF analysis to partition z500 variance across either the time or ensemble dimension. First, we analyze the leading EOFs (across the time dimension) of DJF Northern Hemisphere (0–90°N) ensemble mean z500 composites; in this case the leading EOFs and corresponding principal component (PC) time series describe the spatial patterns and temporal evolution of the radiatively forced ENSO teleconnection changes. Later, we apply EOF analysis across the ensemble dimension of the DJF Northern Hemisphere 1951–2000 El Niño z500 composites. In this case, the leading EOFs describe the El Niño teleconnection diversity in the late twentieth century, and the corresponding PCs correspond with EOF amplitudes for each ensemble member. In both cases, we weight the z500 data by the square root of cosine of latitude to account for the differences in grid point density between higher and lower latitudes.
We also develop linear regression models for the historical El Niño teleconnection PCs based on a partial least squares regression (PLSR) method (Wold, 1966; Smoliak et al., 2010; Johnson et al., 2018). The goal of PLSR is to predict one or more dependent variables Y with a set of independent variables X. The predictors in the linear regression, Z, which are called latent vectors or PLS components, are linear combinations of X that maximize the variance explained in Y and the correlation between X and Y (Smoliak et al., 2010). For multivariate Y, PLSR is similar to other well-known methods including canonical correlation analysis (CCA), maximal covariance analysis (MCA, also known as singular value decomposition, SVD, analysis), and redundancy analysis. Like redundancy analysis, PLSR clearly delineates between predictor (X) and predictand (Y) variables, and both methods identify patterns with corresponding time series that maximize the fractional variance of Y explained by X. PLSR is applied to the full X and Y matrices regardless of whether the number of predictor elements in X exceeds the number of samples, whereas redundancy analysis may require truncation of both the X and Y matrices (Smoliak et al., 2010).
In the present context, Y corresponds with the PC values for the EOF analysis carried out across the ensemble dimension. We apply PLSR separately to each PC so that Y is a univariate predictand with 30 elements corresponding to each ensemble member. X corresponds with the gridded tropical (30°S−30°N) SST anomaly composites across all longitudes corresponding with each ensemble member. Therefore, the goal of this analysis is to predict the diversity of El Niño teleconnection patterns, as represented by the EOF analysis of z500 composites, with the composite tropical SST fields. Both the predictors and predictand are standardized prior to determining the PLS components. The PLSR procedure is described in the following steps: (1) calculate the correlation map between the predictand (PC values) and gridded predictors (tropical SST anomalies) to determine the PLS predictor pattern; (2) project the gridded predictors onto the PLS predictor pattern to determine the PLS component Z; and (3) incorporate the PLS predictor time series into a linear regression, as shown in Eq. (1):
where PCi is the 30-element column vector of predicted PCs for the ith EOF, βi is the regression coefficient, x is a matrix of gridded tropical SST anomalies (weighted by the cosine of latitude), ri is a column vector of SST/PC correlations for the ith EOF, and ε is a residual term. The matrix product xTri corresponds with the PLS component Zi. Generally, the PLSR algorithm incorporates additional iterations whereby the influence of the first predictor is removed from all predictor fields and the predictand time series, and steps 1–3 are repeated until an appropriate stopping criterion to determine additional predictors. In the present case, however, we only consider one predictor per PC for the sake of parsimony and ease of interpretation.
Results
Historical ENSO teleconnections
We first examine the ENSO composites during the historical (1951–2020) period in both SPEAR and observational data. Figures 1, 2 illustrate the composites of z500, precipitation, T2m, and tropical SST for El Niño and La Niña, respectively. Overall, SPEAR accurately simulates the composite ENSO SST patterns (Figures 1g,h, 2g,h) in both structure and amplitude, but small biases common to most coupled GCMs are evident. The equatorial Pacific SST anomalies extend too far westward, a bias that accompanies a pervasive negative equatorial Pacific cold tongue bias (Guilyardi et al., 2009), and the meridional extent of these SST anomalies is less than in observations. SPEAR has slightly more ENSO-related SST variance than observations, with a DJF Niño 3.4 SST standard deviation of 1.13°C compared with 1.00°C for observations, although the range within the 30 SPEAR ensemble members (0.89 to 1.36°C) encompasses the observed value. The number of historical DJF seasons identified as El Niño and La Niña is comparable between observations and SPEAR, with 22 El Niño seasons in observations compared with an average of 22.7 in SPEAR (range of 12 to 28) and 20 La Niña seasons in observations compared with an average of 22.5 in SPEAR (range of 18 to 27).
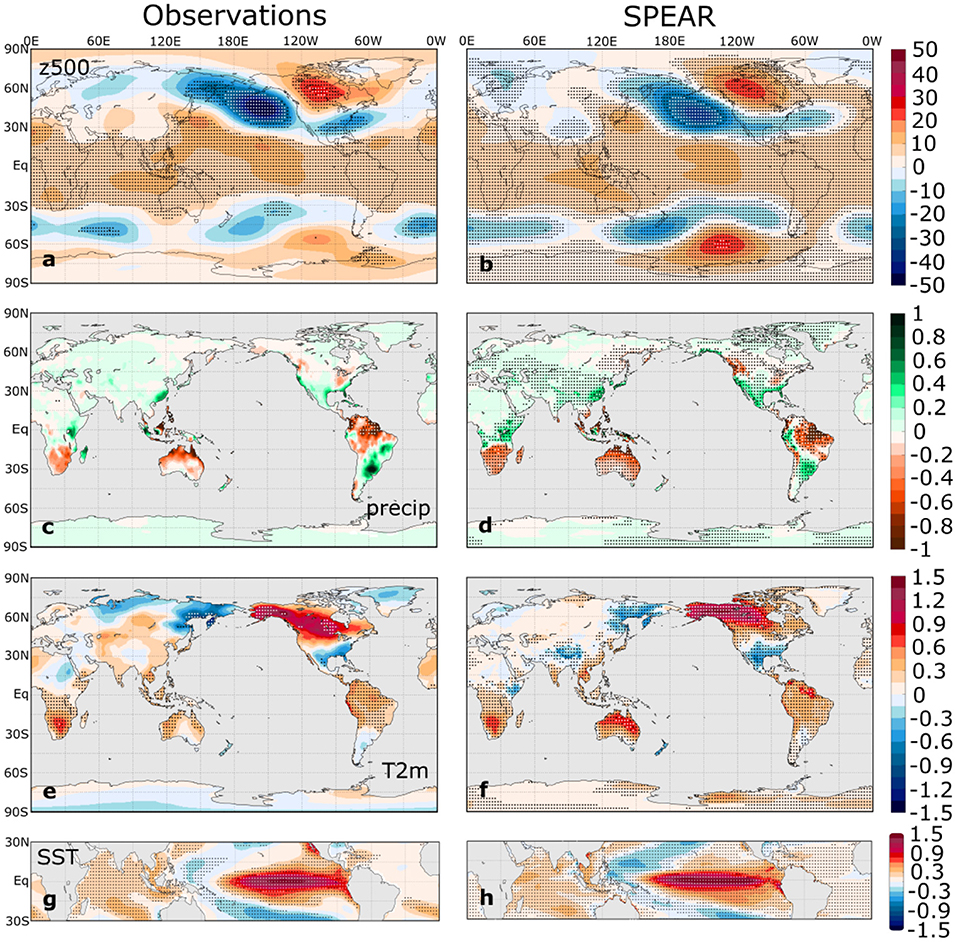
Figure 1. (Left) observational and (right) ensemble mean SPEAR DJF El Niño composites of (a,b) 500 hPa geopotential height (m), (c,d) precipitation (mm d−1), (e,f) T2m (°C), and (g,h) SST (°C) anomalies for the 1951–2020 period. Stippling indicates statistically significant composites that control the false discovery rate at the 10% level based on a two-sided t test.
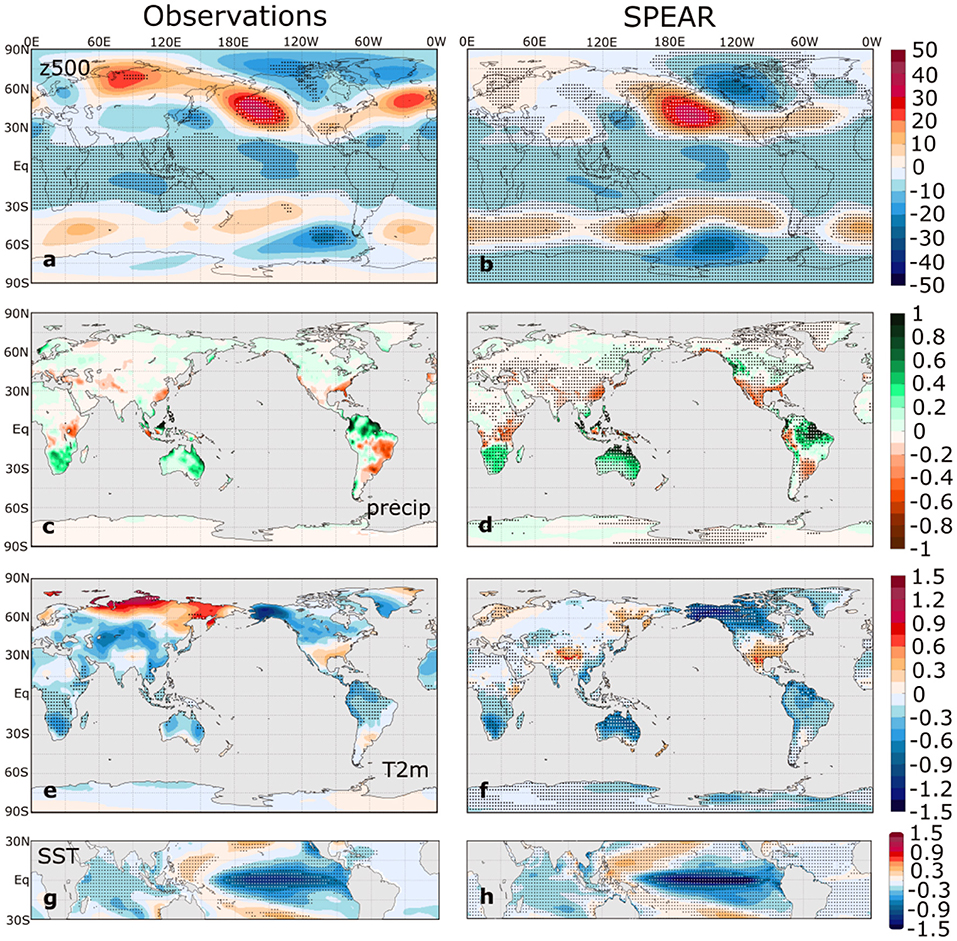
Figure 2. As in Figure 1 but for La Niña composites.
The global composites of z500, precipitation, and T2m are quite similar between observations and SPEAR for both ENSO phases, indicating that SPEAR accurately simulates the global, boreal winter ENSO teleconnections. The z500 composites (Figures 1a,b, 2a,b) show the familiar PNA-like wave train in the Northern Hemisphere and the corresponding Pacific-South American (PSA) pattern in the Southern Hemisphere. SPEAR simulates the major ENSO-related precipitation anomaly centers, including those of western and southern North America, South America, northern Australia, the Maritime Continent, southern and eastern Africa, and eastern China (Figures 1c,d, 2c,d). SPEAR even accurately captures some of the smaller-scale variations, such as the precipitation dipole in Malaysia and Indonesia, suggesting the benefits of a relatively high-resolution atmospheric model. In the T2m composites (Figures 1e,f, 2e,f), the most noticeable discrepancy is the absence of the temperature anomaly dipole over Eurasia in the SPEAR simulations, which is evident in both the observational El Niño and La Niña composites, although only a small fraction of the observed composite anomalies is statistically significant in this region.
To leading order, the La Niña composites are mirror opposites of the El Niño composites. However, there are subtle nonlinearities in both the SST composites and in the remote ENSO impacts. For example, the North Pacific z500 anomaly has a slight eastward shift in El Niño relative to La Niña (Hoerling et al., 1997), a feature that also is captured in the SPEAR composites. Therefore, SPEAR can simulate some of the asymmetries between El Niño and La Niña, although some features appear more symmetric than in observations (e.g., the precipitation composites over western North America).
The area-weighted global pattern correlations between the observed and SPEAR El Niño composites are 0.89, 0.69, and 0.84 for z500, precipitation, and T2m, respectively, whereas the corresponding pattern correlations for the La Niña composites are slightly lower at 0.78, 0.63, and 0.72, respectively. The differences between the SPEAR and observational composites are illustrated in Supplementary Figure 1. These T2m and precipitation correlations appear to be substantially higher than those of CMIP5 models, as reported in Perry et al. (2017), although a direct comparison with the results of Perry et al. (2017) is not possible due to differences in data sources and methods of identifying teleconnection patterns. Nevertheless, Figures 1, 2 provide confidence that SPEAR exhibits strong performance in simulating the boreal winter ENSO teleconnection patterns.
Although Figures 1, 2 provide an assessment of the mean response to ENSO in both observations and SPEAR, the inter-event climate variability for winters classified as El Niño or La Niña also plays an important role in determining the time of signal emergence. Therefore, we show in Supplementary Figures 2, 3 the standard deviations of DJF z500, precipitation, and T2m for El Niño and La Niña, respectively, in observations and SPEAR. Overall, SPEAR reproduces the patterns of within-El Niño and within-La Niña variability, but SPEAR generally exhibits more tropical and subtropical temperature and precipitation variability than observations, especially in South America, northern Australia, Indonesia, and southern Africa. This excessive variability suggests that SPEAR may overestimate the noise of the ENSO composites in these regions, and so the corresponding ToE estimates may be conservative, and the error bars on these estimates may be excessively wide.
Ensemble mean ENSO teleconnection changes
We next examine the projected ensemble mean ENSO composite changes under the SSP5-8.5 emissions pathway. Figures 3, 4 illustrate the ensemble mean El Niño and La Niña composite anomalies in the 1951–1980 base period and the composite anomaly changes in 2011–2040 and 2071–2100. Unsurprisingly, the base period composites in the left column of each figure closely resemble the composites for the 1951–2020 period illustrated in Figures 1, 2. The total number of seasons in each composite increases slightly with time, as the sample size for the El Niño composites is 289 for 1951–1980, 298 for 2011–2040, and 308 for 2071–2100. The La Niña sample sizes increase even more from 275 to 315 to 321 over these three periods. This increase in El Niño and La Niña occurrences reflects the increase in ENSO-related SST variability discussed below.
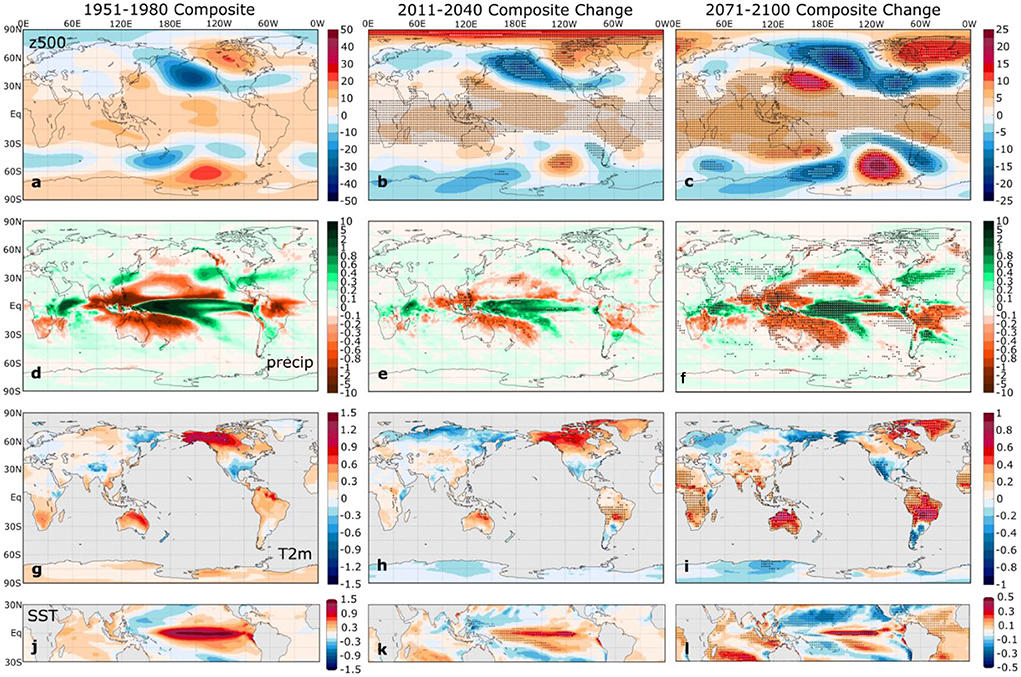
Figure 3. (Left) ensemble mean SPEAR DJF El Niño composites of (a) 500 hPa geopotential height (m), (d) precipitation (mm d−1), (g) T2m (°C), and (j) SST (°C) anomalies for the 1951–1980 period. The middle and right columns show the corresponding ensemble mean composite (b,c) z500, (e,f) precipitation, (h,i) T2m, and (k,l) SST changes in (middle) 2011-2040 and (right) 2071-2100 relative to the 1951–1980 base period. Stippling in the middle and right columns indicates ensemble mean statistically significant composite changes that control the false discovery rate at the 10% level based on a two-sided t-test. The colorbars in the left column apply to the 1951–1980 composites, and the colorbars on the right side apply to the middle and right columns.
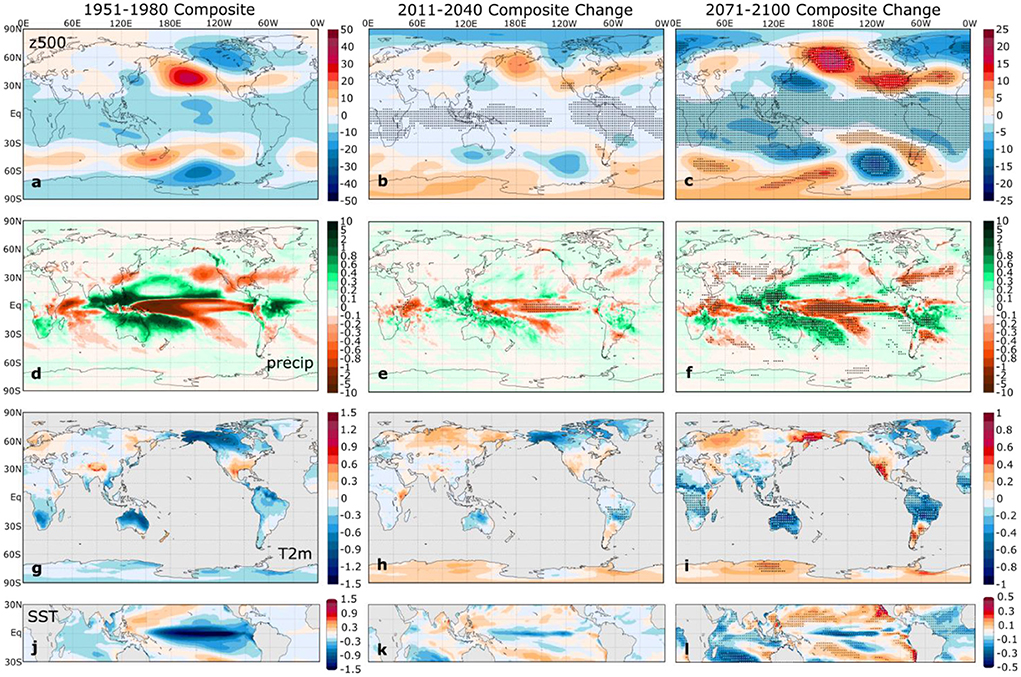
Figure 4. As in Figure 3 but for La Niña.
For both El Niño and La Niña, the ensemble mean composites show an intensification of the tropical Pacific SST anomaly pattern and the global ENSO teleconnections through the twenty-first century, with statistically significant ensemble mean changes over much of the globe by late in the twenty-first century. The enhancement of the composite tropical SST anomalies (bottom panels of Figures 3, 4) indicates a projected increase in ENSO-related SST variability by SPEAR, a projection that agrees with the majority of the latest coupled global climate models, particularly those that simulate realistic ENSO variability (Cai et al., 2021; Cai et al., 2022; Lopez et al., 2022). In the SPEAR simulations, the ensemble mean Niño 3.4 SST standard deviation increases from 1.09°C in 1951–1980 to 1.29°C in 2071–2100. Cai et al. (2022) recently showed that the Niño 3.4 SST standard deviation increases under the SSP5-8.5 scenario in 38 of 43 CMIP6 models in the twenty-first century relative to the twentieth century, with a multi-model ensemble mean increase of 16.1%. Therefore, the SPEAR ensemble mean increase in Niño 3.4 SST variability is consistent with the CMIP6 consensus. We note, however, that there is considerable overlap in the ensemble distributions of the Niño 3.4 SST standard deviations between the two periods (ranges of 0.79–1.36°C in 1951–1980 and 0.92–1.58°C in 2071–2100 among the 30 ensemble members), which underscores the large internal ENSO variability in SPEAR, as in other coupled climate models (Wittenberg, 2009; Stevenson et al., 2012).
The projected changes in the z500 composites (Figures 3b,c, 4b,c) show the strengthening and northeastward shift of the Aleutian low anomaly reported in several previous studies, as discussed in the introduction. The PSA-like Southern Hemisphere counterpart exhibits a similar strengthening and eastward shift. Over the North Atlantic region, a z500 dipole pattern that projects onto the North Atlantic Oscillation (NAO) becomes more prominent, indicating an increasing connection between El Niño and the negative phase of the NAO and between La Niña and the positive phase of the NAO with increasing greenhouse gas concentrations. This projected strengthening of the NAO/ENSO relationship has been noted in several previous studies (Müller and Roeckner, 2008; Herceg Bulic et al., 2012; Drouard and Cassou, 2019). Overall, the projected ensemble mean changes in the ENSO-induced mid-tropospheric circulation in the SPEAR Large Ensemble qualitatively agree with the projected changes reported in other coupled GCMs.
The temporal evolution of the forced z500 ENSO teleconnection changes is illustrated more clearly through consideration of the leading two EOFs of ensemble mean Northern Hemisphere El Niño composite z500 anomalies (Figure 5). The leading EOF (Figure 5a), which explains 74.3% of the variance, closely resembles the composite z500 change patterns in Figures 3b,c. The second EOF (Figure 5b), which explains 16.6% of the variance, is in approximate spatial quadrature with EOF1 over the PNA region and is roughly in phase with the historical El Niño-induced PNA pattern (Figures 1b, 3a). The corresponding principal component (PC) for EOF1 undergoes a consistent upward trend, particularly after the year 2000 (Figure 5c). The second PC increases until a peak ~2035 and then decreases until the end of the twenty-first century. The combined influence of EOFs 1 and 2 clearly captures a gradual northeastward shift of the PNA teleconnection pattern, and EOF1 captures the strengthening influence of El Niño on the North Atlantic and European region. The corresponding EOFs for La Niña are very similar, although PC2 exhibits more of a plateau between 2000 and 2040 rather than a pronounced peak (Supplementary Figure 4).
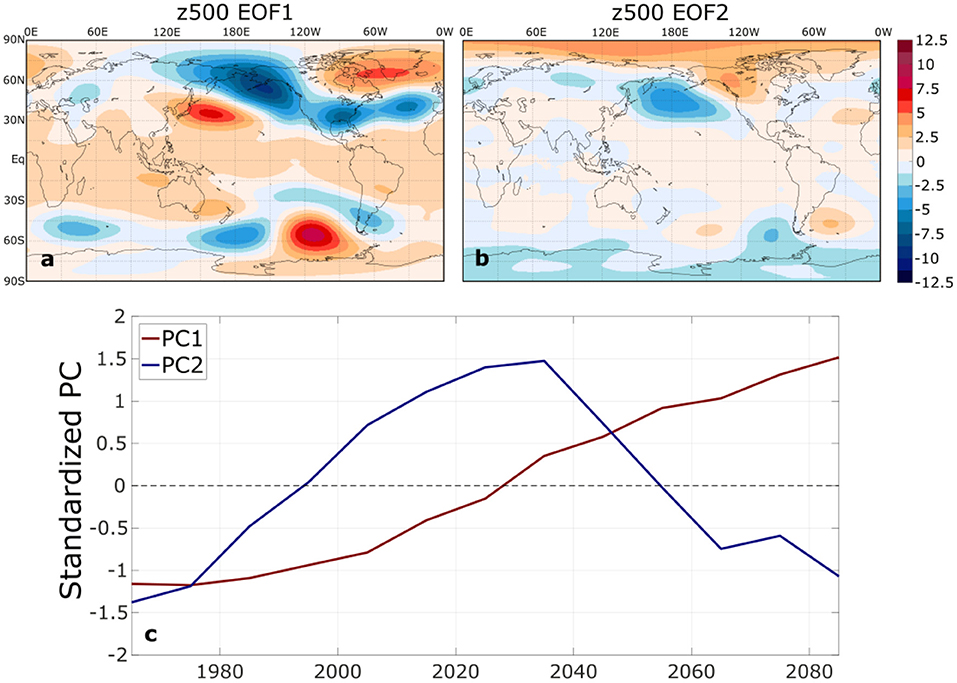
Figure 5. The (a) first and (b) second empirical orthogonal functions (EOFs) of Northern Hemisphere DJF ensemble mean El Niño z500 composite anomalies, expressed as linear regressions on the standardized principal components (m). The leading EOFs explain 74.3% and 16.6% of the temporal variance of 30-year ensemble-mean El Niño composites of Northern Hemisphere z500. (c) The time series of the corresponding principal components (PCs). In (c), the year is assigned to the middle of the 30-yr composite period (e.g., 1965 for the 1951–1980 composite period).
The changes in the ENSO-related T2m and precipitation composites shown in Figures 3, 4 generally indicate a strengthening of the ENSO teleconnection, although the regions of largest change do not necessarily coincide with the regions of highest anomaly amplitude in the base period. The robust increase in ENSO-driven precipitation variability in SPEAR agrees with many previous studies (e.g., Seager et al., 2012; Bonfils et al., 2015; Fasullo et al., 2018; Power and Delage, 2018; Brown et al., 2020; Hu et al., 2021). Given that the ENSO impact on the seasonal mean climate is generally much larger than the impact on the spread of the probability density function in the present climate (Chen and Kumar, 2015), the ENSO-induced seasonal mean precipitation changes are strongly linked to extremes. To the extent that this holds in future climates, these changes imply an increased intensity of El Niño-driven droughts in Brazil, Indonesia, and northern Australia and La Niña-driven droughts in southeastern North America, southern Brazil, Uruguay, and the Horn of Africa. On the other hand, ENSO-driven flood risk may increase in these same regions but for the opposite ENSO phase. Future work will provide a more thorough investigation of ENSO-related changes in the tails of the temperature and precipitation distributions and the resulting impacts on extremes.
Similarly, ENSO-driven temperature variability increases in many regions, especially in subtropical regions, including the Southwest U.S., Mexico, southern Brazil and Bolivia, and northern Australia. This implies an increased risk of heat extremes in regions where the ENSO-driven positive temperature anomalies are superimposed upon the long-term warming trend. This increase in ENSO-related temperature variability also agrees with previous findings from other coupled GCMs (Fasullo et al., 2018; Power and Delage, 2018; Brown et al., 2020; Perry et al., 2020). These changes are not linear in all regions, however. For example, northwest North America appears to show an amplification of the temperature teleconnection until at least 2040 (Figures 3h, 4h) but then a reversal of these changes, particularly over Alaska (Figures 3i, 4i). These changes appear to mirror the time series of ensemble mean ENSO composite z500 EOF2 (Figures 5b; Supplementary Figure 4b), which reflects a strengthening or weakening of the historical PNA-like ENSO teleconnection pattern. The PC2 time series (Figure 5c; Supplementary Figure 4c) indicate a sudden weakening after around 2035, which is an indication that the PNA-region teleconnection pattern has shifted far enough northeast that there is a reversal of the wind and temperature advection over northwestern North America. Beverley et al. (2021) found a robust weakening of the northwest North America ENSO temperature teleconnection in CMIP6 abrupt 4xCO2 experiments. The findings shown here suggest that this conclusion may be sensitive to the time period and radiative forcing scenario considered.
The corresponding composites for the SSP2-4.5 scenario (Supplementary Figures 5, 6) are similar to those of the SSP5-8.5 scenario but, unsurprisingly, the composite changes are lower in amplitude. Most conspicuously, for SSP2-4.5, almost none of the La Niña composite changes is statistically significant in 2011–2040 (Supplementary Figure 6), while coverage of statistically significant changes is much higher for the El Niño composites than for those of La Niña, especially in the z500 field (Supplementary Figure 5b).
Time of emergence
Although the previous section identified several robust ensemble mean changes in the ENSO composites, this robustness benefits from the suppression of internal climate variability through the averaging across 30 independent realizations. This analysis, therefore, does not clearly reveal the likelihood that a single realization of nature will experience the radiatively forced changes captured by the ensemble mean changes. To address this question, we show in Figure 6 the percentage of ensemble members with changes in El Niño composites from the 1951–1980 base period that agree with the sign of the ensemble mean changes illustrated in Figure 3; the corresponding plot for the La Niña composites is shown in Supplementary Figure 7.
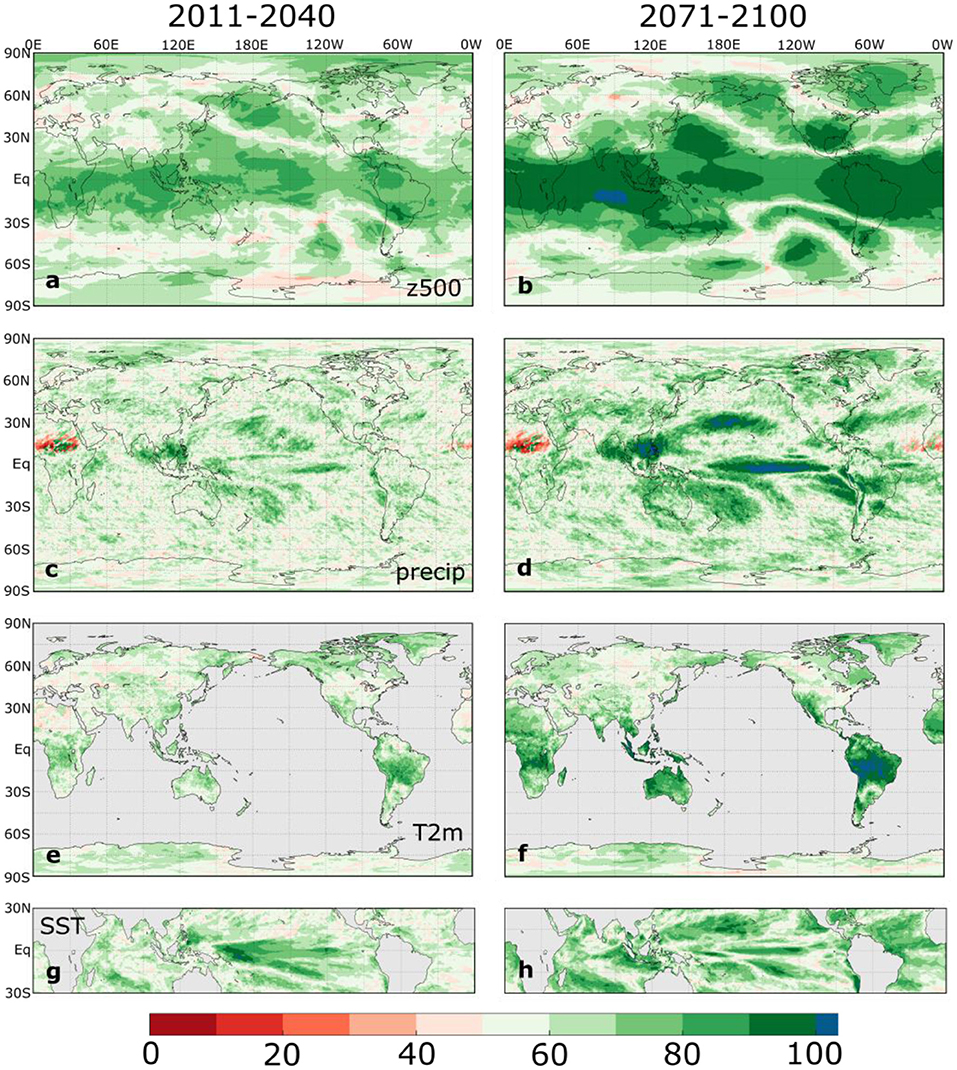
Figure 6. Percentage of ensemble members that agree on the sign of the ensemble mean SSP5-8.5 SPEAR DJF El Niño composite change relative to 1951–1980 in (left) 2011–2040 and (right) 2071-2100. The rows correspond with (a,b) z500, (c,d) precipitation, (e,f) T2m, and (g,h) SST composite changes. Note that blue shading indicates that all members agree on the sign of the change.
Overall, Figure 6 indicates that for the z500 composites, ensemble agreement exceeds 80% throughout the tropics and in the PNA, PSA, and NAO action centers by 2100 (Figure 6b). In contrast, outside the tropics there is less ensemble agreement on the sign of El Niño composite change, even by the end of the twenty-first century. For precipitation, the area of strong ensemble agreement is more limited and mainly confined to the equatorial eastern Pacific, western North Pacific, and North Pacific storm track regions. Ensemble agreement on the temperature composite changes is strongest over tropical and subtropical regions, especially over South America between the equator and 30°S, where ensemble agreement frequently reaches 100% by 2100 (Figure 6f). Consistent with previous studies focusing on multi-model ensembles (Power et al., 2013; Cai et al., 2014; Stevenson et al., 2021), the ensemble agreement for equatorial eastern Pacific precipitation increases exceeds the agreement for eastern Pacific SST changes (Figure 6h). Interestingly, the ensemble agreement on SST changes is strongest in the central equatorial Pacific in 2011–2040 (Figure 6g), but the largest agreement shifts to the eastern Pacific in 2071–2100 (Figure 6h), which suggests a possible evolution in preference for ENSO types. This topic is left for future study, as we focus on a single definition for ENSO events in this study. The corresponding maps for La Niña composite changes (Supplementary Figure 7) are similar to those of El Niño.
The maps of El Niño composite change time of emergence (Figure 7), as defined in Section 2.4, correspond closely with the ensemble agreement maps in Figure 6. The z500 composite change signal emerges from the noise of internal variability by 2050 over most of the tropics, but in the extratropics only a few regions generally associated with PNA and PSA action centers emerge between 2050 and 2100 (Figure 7a). Interestingly, the regions with a signal that emerges by 2100 in SPEAR correspond closely with the regions that have the most robust z500 ENSO teleconnections in the present climate (Brands, 2017).
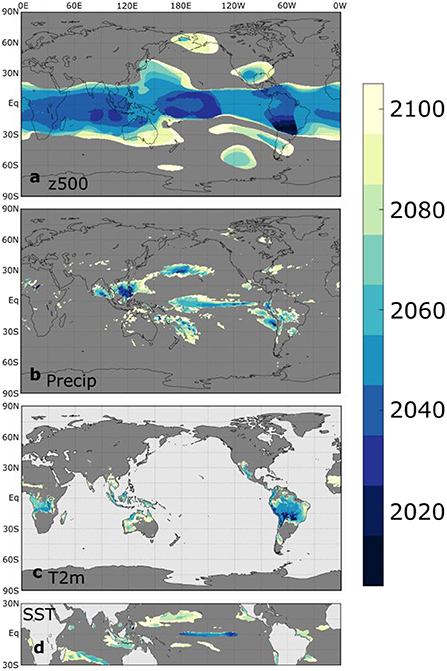
Figure 7. DJF El Niño teleconnection change time of emergence (ToE), defined as the time when the SSP5-8.5 SPEAR ensemble mean 30-yr composite changes relative to 1951–1980 first exceed one ensemble standard deviation and remain outside the ensemble standard deviation through 2100. Dark gray regions indicate that the signal does not emerge before 2100. The ToE is shown for (a) z500, (b) precipitation, (c) T2m, and (d) SST.
For precipitation (Figure 7b), the earliest emergence occurs in the vicinity of the Philippines, suggesting that increasing intensity of El Niño-driven droughts in this region should be among the first detectable changes in ENSO teleconnections. The other major land region with emergence by 2100 is central and southern South America, with increasing El Niño-driven droughts in Bolivia and southern Brazil and increasing El Niño-related flood risk in Uruguay by 2050–2100. Some of these same regions in South America are projected to experience the earliest emergence of El Niño-related temperature changes (Figure 7c), indicating that El Niño-driven anomalous heat, like the extreme heat in Bolivia during the 2015/16 El Niño (Gaulter, 2016), may become noticeably more severe from 2020 to 2050. El Niño-related temperature changes also emerge from 2050 to 2100 in other tropical and subtropical regions, including northern and western Australia, Indonesia, central and southern Africa, and southwest North America. However, the noise of internal climate variability dominates the changes to both temperature and precipitation impacts over most extratropical regions.
In the SPEAR simulations, the El Niño-related equatorial tropical Pacific SST changes overcome the noise of internal variability by 2100 only in a meridionally narrow region from 120°W to the date line, reflecting the increase in ENSO-related SST variability discussed earlier. Outside of equatorial Pacific, limited regions of composite SST changes, particularly in the subtropical North Pacific and southwest Indian Ocean, emerge later in the twenty-first century.
The corresponding ToE maps for La Niña (Supplementary Figure 8) are quite similar to those of El Niño, but some subtle differences are evident. The tropical z500 anomaly changes emerge a couple of decades later than for El Niño, though the equatorial Pacific rainfall changes emerge a couple of decades earlier. This difference in equatorial Pacific precipitation ToE may relate to lower La Niña-related precipitation variability in this region owing to the absence of deep convection regardless of the details of the SST anomaly pattern, given that SSTs remain below the convective threshold for all La Niña events. Additionally, the precipitation change signal near the Philippines is not as strong for La Niña, but the emergence of a precipitation signal is stronger in the Horn of Africa. Despite these subtle differences, the general conclusions regarding El Niño teleconnection changes also hold for La Niña.
We also show in Supplementary Figures 9, 10 the uncertainty of the ToE estimates, as determined by the 5th and 95th percentiles of the bootstrap ToE calculations described in Section 2.4. Generally, the 5th percentile ToE has much greater spatial coverage than in Figure 7, with a larger fraction of extratropical area, especially Southern Hemisphere land regions, experiencing emergence late in the twenty-first century. The 95th percentile, in contrast, only shows small areas with the strongest signals, generally in the tropics, that emerge before 2100. Overall, Supplementary Figures 9, 10 indicate that large internal variability within the ENSO composites contributes to ToE uncertainties on the order of several decades.
The ToE patterns under the SSP2-4.5 scenario (Supplementary Figures 11, 12) broadly match those of the SSP5-8.5 scenario but with lower spatial coverage and later emergence due to the reduction in radiative forcing. For example, the El Niño tropical z500 composites emerge about 30 years later under SSP2-4.5, and almost none of the extratropical z500 composites emerges by 2100 (Supplementary Figure 11). Additionally, coverage of precipitation emergence over land is very limited, generally confined to spotty regions in Southeast Asia, South America, and central Africa. As expected, the effect of scenario uncertainty is small for signals that emerge earliest in the twenty-first century, given that radiative forcing scenarios exhibit little divergence by that time. For signals that may emerge later in the twenty-first century, Supplementary Figures 9–12 suggest that scenario uncertainty and internal climate variability contribute similarly to ToE uncertainty.
ENSO teleconnection diversity
The limited robustness of the projected ENSO teleconnection changes, as illustrated in the ToE maps of Figure 7, is a reflection of substantial ENSO teleconnection diversity in the present climate, resulting in substantial ensemble spread of the simulated ENSO composites in both the historical and future projection scenarios. This teleconnection variability may arise from ENSO diversity (Capotondi et al., 2015), whereby diverse ENSO-related SST patterns force distinct extratropical teleconnections, or by atmospheric internal variability (Deser et al., 2017, 2018), whereby chaotic atmospheric variability independent of ENSO leaves a substantial imprint on the seasonal mean climate anomalies during ENSO events. In this section, we explore ENSO teleconnection diversity in the historical SPEAR simulations, the link between teleconnection diversity and tropical SST diversity, and possible ways that this link may inform expected changes to ENSO teleconnection patterns.
For this analysis, we focus on the leading EOFs of the Northern Hemisphere DJF El Niño 1951–2000 z500 composite anomalies, whereby the EOFs are calculated across the ensemble dimension, in contrast with the analysis shown in Figure 5. We focus on the 50-yr composites instead of the 30-yr composites to cover a broader period in the 20th and later in the twenty-first centuries, but the analysis is not sensitive to this choice. We show the two leading EOFs in Figure 8 and EOFs 3-10 in Supplementary Figure 13. We choose to illustrate 10 EOFs, which account for 85.9% of the ensemble variance, because they provide insight into the projected composite z500 changes in the analysis that follows. In addition to showing the regressions of the z500 fields on the standardized PCs, we also show the regressions of the tropical Pacific SSTs and precipitation.
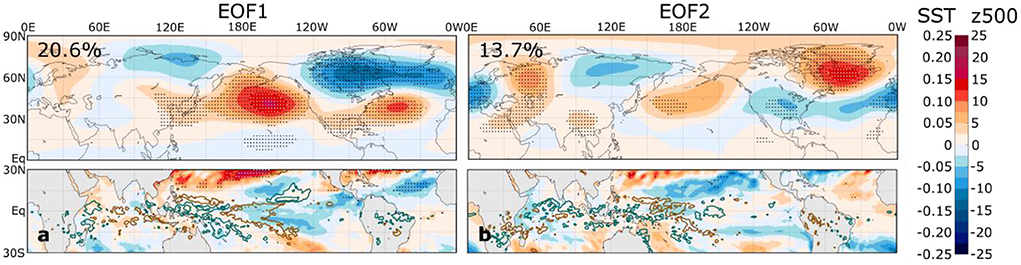
Figure 8. Linear regressions of simulated z500 (top panels, color shading, units of m), SST (bottom panels, color shading, units of °C), and precipitation anomalies (bottom panels, green contours at values of 0.2 and 0.5 mm day−1 and brown contours at values of −0.2 and −0.5 mm day−1) on the standardized principal components of the (a) first and (b) second EOFs of DJF El Niño 1951–2000 z500 composite anomalies. Stippling in the top (bottom) panels indicates statistically significant z500 (SST) regression coefficients that control the false discovery rate at the 10% level based on an F-test. The percentages at the top left of each upper panel indicate the amount of variance explained by the EOF.
The EOFs in Figure 8 illustrate the diversity of El Niño teleconnection patterns within the historical climate that may arise from internal variability alone. For example, EOF1 (20.6% of the variance) captures both the strength of the Aleutian low and an NAO-like pattern over the North Atlantic, whereas EOF2 (13.7% of the variance) is even more focused over the North Atlantic and Europe. Many of these EOFs, such as EOFs 5 and 10 (Supplementary Figure 13), have prominent tropical SST regression coefficients, suggesting that variations in the El Niño SST amplitude and pattern contribute to the variations in composite z500 patterns that we may experience in a single realization of the current climate.
To what extent can the ENSO teleconnection diversity within the current climate and its relationship with tropical SSTs inform the expected changes under increasing greenhouse gases? The SST composites in Figure 3 indicate substantial changes in the projected El Niño SST pattern, with intensified warming in the equatorial Pacific but also off-equatorial cooling; both features are evident in some of the regressions shown in Figure 8 and Supplementary Figure 13. To provide a quantitative estimate that addresses this question, we apply a PLSR model described in Section 2.5 to calculate the predicted change in the 2051–2100 El Niño Northern Hemisphere z500 composite. We focus only on the winter hemisphere in this analysis, but this methodology could be extended to the Southern Hemisphere in future studies. Specifically, we calculate
The left-hand side of (2) represents the change in El Niño z500 composite at longitude λ and latitude ϕ. On the right-hand side, represents the predicted PC for the ith EOF (Ei) shown in Figure 8. Here, xδSST represents the change in El Niño composite SST anomaly from 30°S – 30°N across all longitudes (Figure 9c), whereas ri is the correlation pattern between the ith PC and the tropical SST from the 30 ensemble members during the historical (1951–2000) period, and βi is the corresponding regression coefficient. We emphasize that the only information about future changes included in the right-hand side of (2) is the change in tropical SST anomaly (xδSST); all other quantities are derived from relationships during the 1951–2000 period. Therefore, Equation (2) represents the predicted change in the El Niño z500 composite resulting solely from changes in the El Niño tropical SST composite. We limit the summation to 10 EOFs because the pattern correlation between actual and predicted changes does not improve when we include additional EOFs.
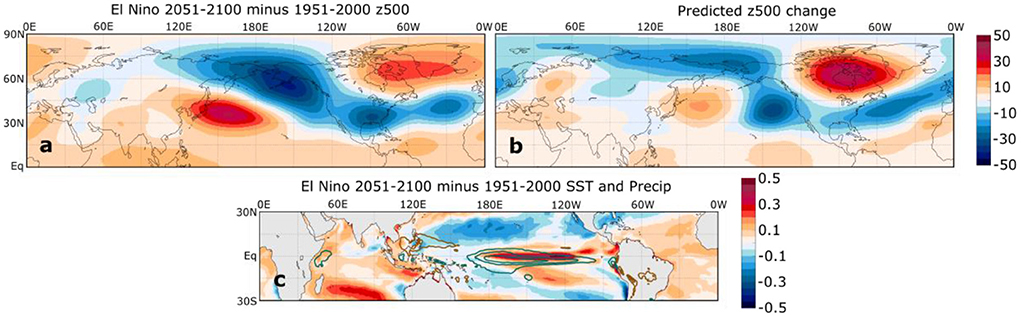
Figure 9. (a) SPEAR ensemble mean change in DJF El Niño z500 composites (m) from 1951–2000 to 2051–2100. (b) The predicted z500 change corresponding to (a) based on the application of Equation (2) to the ensemble mean change in tropical SST anomaly composite (c, color shading and units of °C). Panel (c) also shows the change in ensemble mean precipitation composites (green contours for positive change and brown contours for negative change at an interval of 1 mm day−1).
We show in Figure 9 the comparison between the actual simulated El Niño z500 composite changes (Figure 9a) and the changes predicted by Eq. (2) (Figure 9b). Overall, the predicted changes bear some notable similarities with the actual simulated changes, including the eastward shift of the Aleutian low, the strengthening negative NAO-like pattern over the North Atlantic and Europe, and the reduced heights over southern North America. The pattern correlation between actual and predicted changes is 0.68. The similarity between the actual and predicted z500 composite changes suggests the following: (1) the projected changes in the El Niño tropical SST anomaly play a crucial role in the projected changes of boreal winter El Niño teleconnection patterns, and (2) these projected changes are consistent with relationships between El Niño-related tropical SSTs and the z500 field in the twentieth century climate.
We also acknowledge that there are notable differences between the actual and predicted z500 changes, including the strength of the high east of Japan and the low near the Aleutians. These differences may relate to errors in the linear regression or to other factors that influence the teleconnection change, including changes in the tropical and extratropical mean state (Meehl and Teng, 2007; Zhou et al., 2014; Drouard and Cassou, 2019; Hu et al., 2021). For example, Zhou et al. (2014) demonstrate that the projected pattern of tropical mean sea surface warming, with enhanced warming in the tropical eastern Pacific, is sufficient to induce a strengthened and eastward-shifted ENSO-related PNA teleconnection pattern even without a change in ENSO-related SST anomalies. Drouard and Cassou (2019) similarly demonstrate that projected mean state changes may result in the strengthened relationship between ENSO and North Atlantic region climate variability. The results presented here, however, indicate that the projected changes in ENSO-related SST anomalies may be at least as important for the teleconnection changes as the projected mean state changes. We also note that the projected changes in tropical mean state disagree with the recent tropical Pacific climate trends, which have featured an enhancement of the zonal SST gradient and a strengthening of the Walker circulation over the past several decades (Seager et al., 2019; Lee et al., 2022).
Discussion and conclusions
In this study, we examine the changes in boreal wintertime ENSO teleconnection patterns in a large ensemble of a global climate model of moderately high resolution, SPEAR. We specifically focus on the time when projected teleconnection changes will emerge from the noise of internal climate variability, finding that robust changes emerge earlier over some tropical and subtropical regions, suggesting that noticeable changes in ENSO-induced droughts, floods, seasonal heat, and cold may be observed in these regions over the next several decades. In contrast, over the extratropics the internal variability generally dominates the radiatively forced changes, at least until 2100.
The growing development and analysis of large initial-condition ensembles of coupled global climate models have enhanced our ability to determine the simulated radiatively forced changes in the face of large internal climate variability, but the increased robustness of ensemble-mean radiatively forced changes does not equate to increased likelihood that a single realization of nature will experience these changes in the near future. Therefore, we may increasingly identify statistically significant ensemble mean changes in ENSO teleconnections despite a relatively low probability that nature will experience the change. However, the increasing application of large ensembles improves our ability to quantify the uncertainty associated with internal variability and to identify the earliest signals that are expected to be detectable.
Our study is limited to a single GCM, but the projected changes in ENSO and its boreal winter teleconnection patterns in SPEAR are generally consistent with changes reported from other state-of-the-art GCMs. Therefore, we expect some of our findings to extend beyond the specifics of the SPEAR simulations. Specifically, the limited emergence of ENSO teleconnection changes outside the tropics and subtropics likely will hold more generally, given the large internal variability of ENSO teleconnections reported in previous studies (Deser et al., 2017, 2018; Michel et al., 2020). Additionally, we have presented a new method for connecting historical ENSO variability to projected changes that combines empirical orthogonal function and partial least squares regression analysis. This method may be applied to other models and to other problems that attempt to link historical climate variability to projected climate changes.
Although we believe that our general conclusions are robust, many details are likely sensitive to the choice of model and emissions scenario. Therefore, an obvious next step would be to extend this analysis to multi-model ensembles and to multiple emissions scenarios, as well as to additional seasons beyond boreal winter. Lopez et al. (2022) recently reported robust projections of faster onset and increased persistence of El Niño, which lead to significant changes in boreal autumn and spring teleconnection patterns. Additionally, we considered only a single definition of El Niño and La Niña, and so all discussion of ENSO diversity is in the context of variations within the constraints of these definitions. It would be worthwhile to perform more thorough analyses of the variations and changes of distinct ENSO flavors, notably the central Pacific and eastern Pacific types.
Another potential limitation of this study is the relatively low stratospheric resolution of the model analyzed, as SPEAR has only 33 vertical levels, 10 of which are above 100 hPa, and a model top at 1 hPa. ENSO can alter the winter stratospheric circulation through the anomalous vertical propagation of planetary waves, and subsequent stratosphere-troposphere interaction may impact the ENSO teleconnection patterns, particularly over the North Atlantic-European region (Brönnimann, 2007), although the robustness of the ENSO/stratosphere connection is not yet fully resolved (Domeisen et al., 2019). Consistently, Butler et al. (2016) provide evidence that seasonal forecast models with a well-resolved stratosphere (“high-top” models) produce higher wintertime forecast skill in the Atlantic-European region than models with a more poorly resolved stratosphere (“low-top” models). Jia et al. (2017) similarly demonstrated a prominent role of stratospheric initial conditions for skillful boreal spring seasonal predictions over this region. These findings suggest that changes in stratosphere-troposphere interaction induced by ENSO potentially may have a substantial impact on changes in ENSO teleconnection patterns, but progress in our understanding will require models with a well-resolved stratosphere and that correctly simulate the relevant stratosphere-troposphere coupling processes.
We also note that our definition of “time of emergence” only applies to signals that are expected to amplify in time. For signals that undergo a clear nonlinear evolution, such as the surface air temperature signal in northwest North America, emergence would not be determined even if there are robust changes evolving in time. This limitation may apply to the composite tropical SST anomaly patterns as well, as there is some evidence of a preference for amplification in the central Pacific earlier in the twenty-first century (see Figures 3k, 6g) and eastern Pacific later in the twenty-first century (see Figures 3l, 6h). This evolution will be examined further in future work.
Although ENSO teleconnection diversity owing to internal variability in the historical climate limits the robustness of projected changes, this diversity also provides an opportunity to understand relationships that may inform our understanding of projected ENSO teleconnection changes. We show that there are significant relationships between the diversity of twentieth century El Niño composite 500 hPa geopotential height patterns and the corresponding tropical SST patterns, and that these relationships lead to a reasonably accurate prediction of the forced El Niño composite 500 hPa geopotential height when only considering the projected change in El Niño ensemble mean tropical SST pattern. This predictive relationship between historical variability and radiatively forced changes is in the same spirit as that of emergent constraints. Recently, Stevenson et al. (2021) demonstrated the possible existence of emergent constraints for projected changes in extreme El Niño, whereby the simulation of twentieth century climate, namely the tropical zonal SST gradient and the precipitation sensitivity to SST, provides some skill in predicting extreme El Niño change across a multi-model ensemble. The results presented here suggest that emergent constraints may also exist for ENSO teleconnection changes, whereby the simulated relationships between tropical SSTs and the mid-tropospheric height field in the present climate may provide predictive power for the projected teleconnection changes in a future climate.
These connections with historical climate variability also may facilitate a “storylines” approach (Shepherd, 2019; Shepherd and Sobel, 2020) to describe potential changes in ENSO teleconnection patterns, given the large uncertainties in how both the tropical mean climate and ENSO properties will change. Storylines follow from conditional statements, such as “If the equatorial eastern Pacific warms more than the tropical average, and if El Niño strengthens, then we would expect El Niño teleconnection patterns to change in a particular way.” Large ensemble studies enhance our confidence in such conditional statements through our ability to quantify the model's forced (ensemble-mean) signals, their ToE, the distribution of projected changes, and intra-ensemble relationships among the changes.
To advance the potential identification of emergent constraints and to fully develop a storylines approach to ENSO teleconnection changes, the ideas presented here would need to be extended to a multi-model ensemble. Additionally, it may be worthwhile to consider additional predictors that incorporate background climate variations and other predictands, such as surface air temperature and precipitation, that may be more sensitive to changes in background horizontal gradients.
Data availability statement
Publicly available datasets were analyzed in this study. This data can be found here: https://psl.noaa.gov/data/gridded/; http://berkeleyearth.org/data/; https://www.gfdl.noaa.gov/spear_large_ensembles.
Author contributions
NJ conceived the study, carried out the analyses, and wrote the initial draft of the manuscript. All authors contributed to the SPEAR model development and simulation design, provided constructive input, and contributed to manuscript edits.
Funding
Financial support for this work was provided through base funding from the National Oceanic and Atmospheric Administration to the Geophysical Fluid Dynamics Laboratory.
Acknowledgments
We thank Drs. Youngji Joh and Liwei Jia for constructive comments on an earlier version of the manuscript. We also thank two anonymous reviewers for providing feedback that substantially improved the manuscript.
Conflict of interest
The authors declare that the research was conducted in the absence of any commercial or financial relationships that could be construed as a potential conflict of interest.
Publisher's note
All claims expressed in this article are solely those of the authors and do not necessarily represent those of their affiliated organizations, or those of the publisher, the editors and the reviewers. Any product that may be evaluated in this article, or claim that may be made by its manufacturer, is not guaranteed or endorsed by the publisher.
Supplementary material
The Supplementary Material for this article can be found online at: https://www.frontiersin.org/articles/10.3389/fclim.2022.941055/full#supplementary-material
References
Benjamini, Y., and Hochberg, Y. (1995). Controlling the false discovery rate: a practical and powerful approach to multiple testing. J. Royal Statistic. Soc. Series B 57B, 289–300. doi: 10.1111/j.2517-6161.1995.tb02031.x
Beverley, J. D., Collins, M., Lambert, F. H., and Chadwick, R. (2021). Future changes to El Niño teleconnections over the North Pacific and North America. J. Clim. 34, 6191–6205. doi: 10.1175/JCLI-D-20-0877.1
Bonfils, C. J. W., Santer, B. D., Phillips, T. J., Marvel, K., Leung, L. R., Doutriaux, C., et al. (2015). Relative contributions of mean-state shifts and ENSO-driven variability to precipitation changes in a warming climate. J. Clim. 28, 9997–10013. doi: 10.1175/JCLI-D-15-0341.1
Brands, S. (2017). Which ENSO teleconnections are robust to internal atmospheric variability? Geophysic. Res. Lett. 44, 1483–1493. doi: 10.1002/2016GL071529
Brönnimann, S. (2007). Impact of El Niño–Southern oscillation on European climate. Rev. Geophysic. 45, RG3003. doi: 10.1029/2006RG000199
Brown, J. R., Brierley, C. M., An, S. I., Guarino, M. V., Stevenson, S., Williams, C. J. R., et al. (2020). Comparison of past and future simulations of ENSO in CMIP5/PMIP3 and CMIP6/PMIP4 models. Clim. Past 16, 1777–1805. doi: 10.5194/cp-16-1777-2020
Bushuk, M., Winton, M., Haumann, F. A., Delworth, T., Lu, F., Zhang, Y., et al. (2021). Seasonal prediction and predictability of regional Antarctic sea ice. J. Clim. 34, 6207–6233. doi: 10.1175/JCLI-D-20-0965.1
Bushuk, M., Zhang, Y., Winton, M., Hurlin, B., Delworth, T., Lu, F., et al. (2022). Mechanisms of regional Arctic sea ice predictability in two dynamical seasonal forecast systems. J. Clim. 22, 1. doi: 10.1175/JCLI-D-21-0544.1
Butler, A. H., Arribas, A., Athanassiadou, M., Baehr, J., Calvo, N., Charlton-Perez, A., et al. (2016). The Climate-system Historical Forecast Project: do stratosphere-resolving models make better seasonal climate predictions in boreal winter?. Q. J. Royal Meteorologic. Soc. 142, 14131427. doi: 10.1002/qj.2743
Cai, W., Borlace, S., Lengaigne, M., et al. (2014). Increasing frequency of extreme El Niño events due to greenhouse warming. Nat. Clim. Change 4, 111–116. doi: 10.1038/nclimate2100
Cai, W., Ng, B., Wang, G., Santoso, A., Wu, L., and Yang, K. (2022). Increased ENSO sea surface temperature variability under four IPCC emission scenarios. Nat. Clim. Change 12, 228–231. doi: 10.1038/s41558-022-01282-z
Cai, W., Santoso, A., Collins, M., Dewitte, B., Karamperidou, C., Kug, J. S., et al. (2021). Changing El Niño?Southern Oscillation in a warming climate. Nat Rev Earth Environ. 2, 628–644. doi: 10.1038/s43017-021-00199-z
Capotondi, A., Wittenberg, A. T., Newman, M., Di Lorenzo, E., Yu, J., Braconnot, P., et al. (2015). Understanding ENSO diversity. Bull. Am. Meteorologic. Soc. 96, 921–938. doi: 10.1175/BAMS-D-13-00117.1
Chen, M., and Kumar, A. (2015). Influence of ENSO SSTs on the spread of the probability density function for precipitation and land surface temperature. Clim. Dynam. 45, 965–974. doi: 10.1007/s00382-014-2336-9
Chen, M., Xie, P., Janowiak, J. E., and Arkin, P. A. (2002). Global land precipitation: a 50-yr monthly analysis based on gauge observations. J. Hydrometeorol. 3, 249–266.
Delworth, T. L., Cooke, W. F., Adcroft, A., Bushuk, M., Chen, J.-H., Dunne, K. A., et al. (2020). SPEAR: The next generation GFDL modeling system for seasonal to multidecadal prediction and projection. J. Adv. Model. Earth Syst. 12, e2019MS001895. doi: 10.1029/2019MS001895
Deser, C., Simpson, I. R., McKinnon, K. A., and Phillips, A. S. (2017). The Northern Hemisphere extra-tropical atmospheric circulation response to ENSO: how well do we know it and how do we evaluate models accordingly? J. Clim. 30, 5059–5082. doi: 10.1175/JCLI-D-16-0844.1
Deser, C., Simpson, I. R., Phillips, A. S., and McKinnon, K. A. (2018). How well do we know ENSO's climate impacts over North America, and how do we evaluate models accordingly? J. Clim. 30, 4991–5014. doi: 10.1175/JCLI-D-17-0783.1
Diffenbaugh, N. S., and Scherer, M. (2011). Observational and model evidence of global emergence of permanent, unprecedented heat in the 20th and 21st centuries. Clim. Change 107, 615–624. doi: 10.1007/s10584-011-0112-y
Domeisen, D. I., Garfinkel, C. I., and Butler, A. H. (2019). The teleconnection of El Niño Southern Oscillation to the stratosphere. Rev. Geophys. 57, 5–47. doi: 10.1029/2018RG000596
Drouard, M., and Cassou, C. (2019). A modeling- and process-oriented study to investigate the projected change of ENSO-forced wintertime teleconnectivity in a warmer world. J. Clim. 32, 8047–8068. doi: 10.1175/JCLI-D-18-0803.1
Fasullo, J. T., Otto-Bliesner, B. L., and Stevenson, S. (2018). ENSO's changing influence on temperature, precipitation, and wildfire in a warming climate. Geophysic. Res. Lett. 45, 9216–9225. doi: 10.1029/2018GL079022
Fedorov, A. S, Hu, A. T., Wittenberg, A., and Levine, C. (2020). “ENSO low-frequency modulations and mean state interactions,” in Chapter 8 of: El Niño Southern Oscillation in a Changing Climate (Washington, DC: American Geophysical Union), pp. 173–198.
Gaulter, S. (2016). Temperatures soar in Bolivia as El Nino smashes records. Available online at: https://www.aljazeera.com/news/2016/1/27/temperatures-soar-in-bolivia-as-el-nino-smashes-records (accessed April 1, 2022).
Giorgi, F., and Bi, X. (2009). Time of emergence (TOE) of GHG-forced precipitation change hot-spots. Geophysic. Res. Lett. 36, L06709. doi: 10.1029/2009GL037593
Guilyardi, E., Wittenberg, A, Fedorov, A., Collins, M., Wang, C., Capotondi, A., et al. (2009). Understanding El Niño in ocean–atmosphere general circulation models: progress and challenges. Bull. Am. Meteorologic. Soc. 90, 325–340. doi: 10.1175/2008BAMS2387.1
Held, I. M., Guo, H., Adcroft, A., Dunne, J. P., Horowitz, L. W., Krasting, J., et al. (2019). Structure and performance of GFDL's CM4.0 climate model. J. Adv. Model. Earth Syst. 11, 3691–3727. doi: 10.1029/2019MS001829
Herceg Bulic, I. H., Brankovic, C., and Kucharski, F. (2012). Winter ENSO teleconnections in a warmer climate. Clim. Dynam. 38, 1593–1613. doi: 10.1007/s00382-010-0987-8
Hoerling, M. P., and Kumar, A. (1997). Why do North American climate anomalies differ from one El Niño event to another? Geophysic. Res. Lett. 24, 1059–1062. doi: 10.1029/97GL00918
Hoerling, M. P., Kumar, A., and Zhong, M. (1997). El Niño, La Niña, and the nonlinearity of their teleconnections. J. Clim. 10, 1769–1786.
Hu, K., Huang, G., Huang, P., Kosaka, Y., and Xie, S.-P. (2021). Intensification of El Niño-induced atmospheric anomalies under greenhouse warming. Nat. Geosci. 14, 377–382. doi: 10.1038/s41561-021-00730-3
Huang, B., Thorne, P. W., Banzon, V. F., Boyer, T., Chepurin, G., Lawrimore, J. H., et al. (2017). Extended Reconstructed Sea Surface Temperature, Version 5 (ERSSTv5): Upgrades, Validations, and Intercomparisons. J. Clim. 30, 8179–8205. doi: 10.1175/JCLI-D-16-0836.1
Jia, L., Delworth, T. L., Kapnick, S., Yang, X., Johnson, N. C., Cooke, W., et al. (2022). Skillful seasonal prediction of North American summertime heat extremes. J. Clim. 22, 356. doi: 10.2022/JCLI-D-21-0364.1/JCLI-D-21-0364.1.xml
Jia, L., Yang, X., Vecchi, G., Gudgel, R., Delworth, T., Fueglistaler, S., et al. (2017). Seasonal prediction skill of northern extratropical surface temperature driven by the stratosphere. J. Clim. 30, 4463–4475. doi: 10.1175/JCLI-D-16-0475.1
Joh, Y., Delworth, T. L., Wittenberg, A. T., Cooke, W. F., Yang, X., Zeng, F., et al. (2022). Seasonal-to-decadal variability and prediction of the kuroshio extension in the GFDL coupled ensemble reanalysis and forecasting system. J. Clim. 22, 6756. doi: 10.5194/egusphere-egu22-6756
Johnson, C., and Feldstein, S. B. (2010). The continuum of North Pacific sea level pressure patterns: Intraseasonal, interannual, and interdecadal variability. J. Clim. 23, 851–867. doi: 10.1175/2009JCLI3099.1
Johnson, N. C., Xie, S. P., Kosaka, Y., and Li, X. (2018). Increasing occurrence of cold and warm extremes during the recent global warming slowdown. Nat. Commun. 9, 1724. doi: 10.1038/s41467-018-04040-y
Kalnay, E., Kanamitsu, M., Kistler, R., Collins, W., Deaven, D., Gandin, L., et al. (1996). The NCEP/NCAR 40-Year reanalysis project. Bull. Am. Meteorologic. Soc. 77, 437–471.
Kirtman, B. P., Min, D., Infanti, J. M., Kinter, J. L. III., Paolino, D. A., Zhang, Q., van den Dool, H., et al. (2014). The North American Multimodel Ensemble: Phase-1 seasonal-to-interannual prediction; Phase-2 toward developing intraseasonal prediction. Bull. Am. Meteorologic. Soc. 95, 585–601. doi: 10.1175/BAMS-D-12-00050.1
Kug, J.-S., An, S.-I., Ham, Y.-G., and Kang, I. S. (2010). Changes in El Niño and La Niña teleconnections over North Pacific-America in the global warming simulations. Theoretic. Appl. Climatol. 100, 275–282. doi: 10.1007/s00704-009-0183-0
Kumar, A., and Hoerling, M. P. (1997). Interpretation and implications of observed inter- El Niño variability. J. Clim. 10, 83–91.
Lee, S., L'Heureux, M., Wittenberg, A. T., Seager, R., O'Gorman, P., and Johnson, N. C. (2022). “On the future climate of the tropical Pacific: Perspectives from observations, simulations, and theories,” in Submitted to npj climate and atmospheric science.
L'Heureux, M. L., Tippett, M. K., and Barnston, A. G. (2015). Characterizing ENSO coupled variability and its impact on North American seasonal precipitation and temperature. J. Clim. 28, 4231–4245. doi: 10.1175/JCLI-D-14-00508.1
Lopez, H., Lee, S.-K., Kim, D., Wittenberg, A. T., and Yeh, S.-W. (2022). Projections of faster onset and slower decay of El Niño in the 21st century. Nat. Commun. 13, 1915. doi: 10.1038/s41467-022-29519-7
Maloney, E. D., Camargo, S. J., Chang, E., Colle, B., Fu, R., Geil, K. L., et al. (2014). North American Climate in CMIP5 experiments: Part III: Assessment of twenty-first-century projections*. J. Clim. 27, 2230–2270. doi: 10.1175/JCLI-D-13-00273.1
Meehl, G. A., and Teng, H. (2007). Multi-model changes in El Niño teleconnections over North America in a future warmer climate. Clim. Dynam. 29, 779–790. doi: 10.1007/s00382-007-0268-3
Michel, C., Li, C., Simpson, I. R., Bethke, I., King, M. P., and Sobolowski, S. (2020). The change in the ENSO teleconnection under a low global warming scenario and the uncertainty due to internal variability. J. Clim. 33, 4871–4889. doi: 10.1175/JCLI-D-19-0730.1
Müller, W. A., and Roeckner, E. (2008). ENSO teleconnections in projections of future climate in ECHAM5/MPI-OM. Clim. Dynam. 31, 533–549. doi: 10.1007/s00382-007-0357-3
Murakami, H., Delworth, T. L., Cooke, W. F., Zhao, M., Xiang, B., and Hsu, P. C. (2020). Detected climatic change in global distribution of tropical cyclones. Proceed. Nat. Acad. Sci. 117, 10706–10714. doi: 10.1073/pnas.1922500117
Pascale, S., Kapnick, S. B., Delworth, T. L., and Cooke, W. F. (2020). Increasing risk of another Cape Town “Day Zero” drought in the 21st century. Proceed. Nat. Acad. Sci. 117, 29495–29503. doi: 10.1073/pnas.2009144117
Perry, S. J., McGregor, S., Gupta, A. S., and England, M. H. (2017). Future changes to El Niño–Southern Oscillation temperature and precipitation teleconnections. Geophysic. Res. Lett. 44, 10608–10616. doi: 10.1002/2017GL074509
Perry, S. J., McGregor, S., Sen Gupta, A., England, M. H., and Maher, N. (2020). Projected late 21st century changes to the regional impacts of the El Niño-southern oscillation. Clim. Dynam. 54, 395–412. doi: 10.1007/s00382-019-05006-6
Power, S., Delage, F., Chung, C., Kociuba, G., and Keay, K. (2013). Robust twenty-first-century projections of El Niño and related precipitation variability. Nature 502, 541–545. doi: 10.1038/nature12580
Power, S. B., and Delage, F. P. (2018). El Niño–Southern Oscillation and associated climatic conditions around the world during the latter half of the twenty-first century. J. Clim. 31, 6189–6207. doi: 10.1175/JCLI-D-18-0138.1
Rohde, R., Muller, R. A., Jacobsen, R., Perlmutter, S., Rosenfeld, A., Wurtele, J., et al. (2013). Berkeley earth temperature averaging process. Geoinform. Geostatic. Overview 1, 2. doi: 10.4172/2327-4581.1000103
Ropelewski, C. F., and Halpert, M. S. (1987). Global and regional scale precipitation patterns associated with the El Niño/Southern Oscillation. Monthly Weather Rev. 115, 1606–1626.
Sardeshmukh, P. D., Compo, G. P., and Penland, C. (2000). Changes of probability associated with El Niño. J. Clim. 13, 4268–4286.
Seager, R., Cane, M., Henderson, N., Lee, D.-E., Abernathy, R., and Zhang, H. (2019). Strengthening tropical Pacific zonal sea surface temperature gradient consistent with rising greenhouse gases. Nat. Clim. Change 9, 517–522.
Seager, R., Naik, N., and Vogel, L. (2012). Does global warming cause intensified interannual hydroclimate variability? J. Clim. 25, 3355–3372. doi: 10.1175/JCLI-D-11-00363.1
Shepherd, T. G. (2019). Storyline approach to the construction of regional climate change information. Proceed. Roy. Soc. A: Mathematic. Physic. Eng. Sci. 475, 20190013, doi: 10.1098/rspa.2019.0013
Shepherd, T. G., and Sobel, A. H. (2020). Localness in climate change. Comparat. Stud. South Asia, Africa and the Middle East 40, 7–16. doi: 10.1215/1089201X-8185983
Smoliak, B. V., Wallace, J. M., Stoelinga, M. T., and Mitchell, T. P. (2010). Application of partial least squares regression to the diagnosis of year-to-year variations in Pacific Northwest snowpack and Atlantic hurricanes. Geophysic. Res. Lett. 37, L03801. doi: 10.1029/2009GL041478
Sterl, A., van Oldenborgh, G. J., Hazeleger, W., and Burgers, G. (2007). On the robustness of ENSO teleconnections. Clim. Dynam. 29, 469–485. doi: 10.1007/s00382-007-0251-z
Stevenson, S., Fox-Kemper, B., Jochum, M., Neale, R., Deser, C., and Meehl, G. (2012). Will there be a significant change to El Niño in the 21st century? J. Clim. 25, 2129–2145. doi: 10.1175/JCLI-D-11-00252.1
Stevenson, S., Wittenberg, A. T., Fasullo, J., Coats, S., and Otto-Bliesner, B. (2021). Understanding diverse model projections of future extreme El Niño. J. Clim> 34, 449–464. doi: 10.1175/JCLI-D-19-0969.1
Stevenson, S. L. (2012). Significant changes to ENSO strength and impacts in the twenty-first century: results from CMIP5. Geophysic. Res. Lett. 39, L17703. doi: 10.1029/2012GL052759
Taschetto, A. S., Ummenhofer, C. C., Stuecker, M. F., Dommenget, D., Ashok, K., Rodrigues, R. R., et al. (2020). “ENSO atmospheric teleconnections,” in El Niño Southern Oscillation in a Changing Climate (eds M.J. McPhaden, A. Santoso and W. Cai), p. 14.
Trenberth, K. E., Branstator, G. W., Karoly, D., Kumar, A., Lau, N. C., and Ropelewski, C. (1998). Progress during TOGA in understanding and modeling global teleconnections associated with tropical sea surface temperatures. J. Geophysic. Res. 103 14291–14324. doi: 10.1029/97JC01444
Tseng, K.-C., Johnson, N. C., Kapnick, S. B., Cooke, W., Delworth, T. L., Jia, L., et al. (2022). When will humanity notice its influence on atmospheric rivers? J. Geophysic. Res. Atmosph. 127, e2021JD036044. doi: 10.1029/2021JD036044
Tseng, K.-C., Johnson, N. C., Kapnick, S. B., Delworth, T. L., Lu, F., Cooke, W., et al. (2021). Are multiseasonal forecasts of atmospheric rivers possible? Geophysic. Res. Lett. 48, e2021GL094000. doi: 10.1029/2021GL094000
Wilks, D. S. (2016). “The stippling shows statistically significant grid points”: how research results are routinely overstated and overinterpreted, and what to do about it. Bull. Am. Meteorologic. Soc. 97, 2263-2273. doi: 10.1175/BAMS-D-15-00267.1
Wittenberg, A. T. (2009). Are historical records sufficient to constrain ENSO simulations? Geophysic. Res. Lett. 36, L12702. doi: 10.1029/2009GL038710
Wold, H. (1966). “Multivariate Analysis,” in Estimation of Principal Components and Related Models by Iterative Least Squares, ed Krishnajah, P.R. (New York, NY: Academic), p. 391–420.
Xiang, B., Harris, L., Delworth, T. L., Wang, B., Chen, G., Chen, J., et al. (2022). S2S prediction in GFDL SPEAR: MJO diversity and teleconnections. Bull. Am. Meteorologic. Soc. 103m E463–E484. doi: 10.1175/BAMS-D-21-0124.1
Yeh, S.-W., Cai, W., Min, S.-K., McPhaden, M. J., Dommenget, D., Dewitte, B., et al. (2018). ENSO atmospheric teleconnections and their response to greenhouse gas forcing. Rev. Geophysic. 56, 185–206. doi: 10.1002/2017RG000568
Zhang, G., Murakami, H., Cooke, W. F., Wang, Z., Jia, L., Lu, F., et al. (2021). Seasonal predictability of baroclinic wave activity. npj Clim. Atmosphere. Sci. 4, 50. doi: 10.1038/s41612-021-00209-3
Zhang, L., and Cooke, W. (2021). Simulated changes of the Southern Ocean air-sea heat flux feedback in a warmer climate. Clim. Dynam. 56, 1–16. doi: 10.1007/s00382-020-05460-7
Keywords: El Niño-Southern Oscillation, teleconnection patterns, time of emergence, climate change, internal climate variability
Citation: Johnson NC, Wittenberg AT, Rosati AJ, Delworth TL and Cooke W (2022) Future changes in boreal winter ENSO teleconnections in a large ensemble of high-resolution climate simulations. Front. Clim. 4:941055. doi: 10.3389/fclim.2022.941055
Received: 11 May 2022; Accepted: 02 August 2022;
Published: 25 August 2022.
Edited by:
Andrea Taschetto, University of New South Wales, AustraliaReviewed by:
Nicholas Tyrrell, Finnish Meteorological Institute, FinlandDoug Richardson, CSIRO, Australia
Copyright © 2022 Johnson, Wittenberg, Rosati, Delworth and Cooke. This is an open-access article distributed under the terms of the Creative Commons Attribution License (CC BY). The use, distribution or reproduction in other forums is permitted, provided the original author(s) and the copyright owner(s) are credited and that the original publication in this journal is cited, in accordance with accepted academic practice. No use, distribution or reproduction is permitted which does not comply with these terms.
*Correspondence: Nathaniel C. Johnson, TmF0aGFuaWVsLkpvaG5zb25Abm9hYS5nb3Y=