 Horst Fehrenbach
 Silvana Bürck
- ifeu - Institute for Energy and Environmental Research Heidelberg gGmbH, Heidelberg, Germany
Biomass-based fuels are frequently considered a Greenhouse Gas (GHG) emission reduction option. However, the aspect of foregone emission reduction which is related to alternative options such as renaturation is neglected in most cases. This study outlines carbon opportunity costs (COC) for crop-based biofuels used in Germany. In 2020, energy crops for 44 peta joules of biofuels were cultivated on arable land in Germany. The area required for this amounts to 0.461 million hectares, after deducting the area for co-products such as rapeseed meal. A large part of the biofuels used in Germany is imported and occupies extensive areas, particularly in Asia, mainly through the cultivation of oil palms. In total, the biofuels consumed in Germany occupy 1.23 million hectares worldwide, which corresponds to more than 10% of Germany's arable land. According to official data, the greenhouse gas emissions saved by using biofuels based on crops instead of fossil fuels amounted to 9.2 million t CO2 -eq. in 2020. If this saving were renounced and instead natural vegetation were allowed to grow on the land occupied for biofuels, an average annual carbon sequestration of over 16 million t CO2 would be possible as a result. These are the COC of biofuel production, and they are significantly higher than the emission reductions from replacing fossil fuels.
Introduction
Biomass-based fuels are long seen as an option to reduce transport-related greenhouse gas (GHG) emissions. Biomass regrows, so the carbon dioxide (CO2) produced when it is burned, is generally considered to be climate neutral. The assumption is that this CO2 was previously captured from the air as the plant biomass grew. So it is in a cycle. Nevertheless, biofuels are not climate-neutral because their production is comparatively resource-intensive. The cultivation of biomass as well as the processing of the raw materials into fuel is energy-intensive and causes emissions. In the so-called “net balance” (i.e., the emissions from the production of biofuels minus the emissions from the fossil diesel and petrol fuels they replace), biofuels still typically show GHG emission savings according to official calculations.
However, this only applies if the use of biomass does not cause any land-use change. In this case, the cycle of biogenic CO2 is not closed and the climate neutrality mentioned above is not given. Worldwide, the conversion of forests to agricultural land leads to GHG emissions of 5.2 billion tons of CO2 (IPCC, 2019), which is considerable given the total of 47 billion tons of greenhouse gas emissions worldwide. Moreover, land-use changes not only affect the climate, but also have a massive impact on biodiversity, water budgets and soils (IPBES, 2019).
Due to the COVID outbreak in 2019, a reduction in biofuel consumption in the EU has been observed. However, it is expected that biofuel consumption in the EU picks-up again (Flach et al., 2021). The driver for biofuel production is EU policy, which prescribes minimum quotas of renewable energy in the transport sector. The basis for this is the Renewable Energy Directive (RED) or its new version (RED II), which has been in force since 2021. Only biofuels that meet certain sustainability criteria and can prove this through certification are accountable for the targets. The criteria also include a minimum saving in GHG emissions. Emission saving means: production use of the energetically equivalent amount of fuel based on fossil sources (i.e., diesel and gasoline) would cause more GHG emissions than the respective biofuel production and use. The calculation method for this is also defined in the RED and RED II. In Germany, 13.2 million tons of CO2 equivalents (eq.) are reported as certified emission savings associated with the use of biofuels for the year 2020 (BLE, 2021). 9.2 million t CO2 -eq. refer to crop-based biofuel, while 4 million t CO2 -eq. of the GHG savings relate to biofuel from waste and renewable materials. The latter are not considered here because they do not require any land.
The question raised in Fehrenbach and Bürck (2022) was: How high are the carbon opportunity costs (COC) associated with this saving through the replacement of fossil fuels? And, would the overall GHG balance including COC still lead to GHG saving? With COC we consider the forgone benefits by occupying a considerable area of arable land with the production of biomass for biofuels instead of making it available for the development of a natural forest, for example. COC has become established among experts as a term for this type of foregone benefit (see, among others, Schmidinger and Stehfest, 2012; Searchinger et al., 2018; Wirsenius et al., 2020; Hayek et al., 2021). In a sense, COC is the complement to land use change (LUC). The difference is that it is not about the change of the state before cropping for biomass, but about the possible change by abstaining from cropping.
In the followings we outline the results of Fehrenbach and Bürck (2022) on how much carbon or CO2 can be sequestered annually if we allow renaturation of the areas that have been used for biofuels in Germany and worldwide. We are aware, that in addition to the forgone sink potential, the cultivation of crops for biofuels misses out on other ecological opportunities, such as the development of natural areas with high biodiversity. However, the article at hand concentrates exclusively on the carbon balance. Consequently, it does not give a holistic view on the performance of biofuels. Other aspects associated with the provision and consumption of biofuels (be they positive or negative) need to be assessed in further studies.
The choice of renaturation serves various political goals. Not only the increase of carbon storage on the land, but also the promotion of biodiversity and of wilderness areas go hand in hand with it. On the other side, the renaturation option is not the only opportunity. For example, conversion to organic farming also requires more land. This would be an alternative option that a farm can take individually. The option of energy crop cultivation in crop rotation can also be considered in another scenario. Due to the fact that building up carbon storage is a current political goal within the framework of the German Climate Protection Act (German Federal Government, 2021), the authors have chosen the option of renaturation.
Data and methods
Data
The presented calculations and assessments are based on the German biofuel situation in the year 2020. Germany is a large-scale user of biofuel, which imports significant amounts of biofuel, but also a large-scale producer, which exports relevant parts of its production (Flach et al., 2021). Therefore, the assessment follows two different viewpoints: We look at (a) the land used in Germany for the production of biofuels and (b) the land used in Germany and worldwide for the production of biofuels.
We refer to the official data, supplemented by data from scientifically recognized work. The data sources presented in Table 1 are the basis for the study. The data from the BLE (2021) are official data on the origin and typology of biofuels used in Germany. The BLE maintains the Nabisy (Nachhaltige Biomasse Systeme) register, which provides evidence of sustainability for approval for quota crediting in Germany. Based on this data, the BLE publishes an annual evaluation and experience report containing the feedstocks for biofuels consumed in Germany, differentiated by origin and raw material. These data correspond to the biofuels counted toward the quota obligation in Germany, i.e., the biofuels used by means of blending. These include both the biofuels produced in Germany (minus those exported from Germany) and the biofuels that Germany imports. Based on this, the annual BLE report calculates the official GHG emissions or GHG savings of the biofuels used compared to the use of fossil fuels.
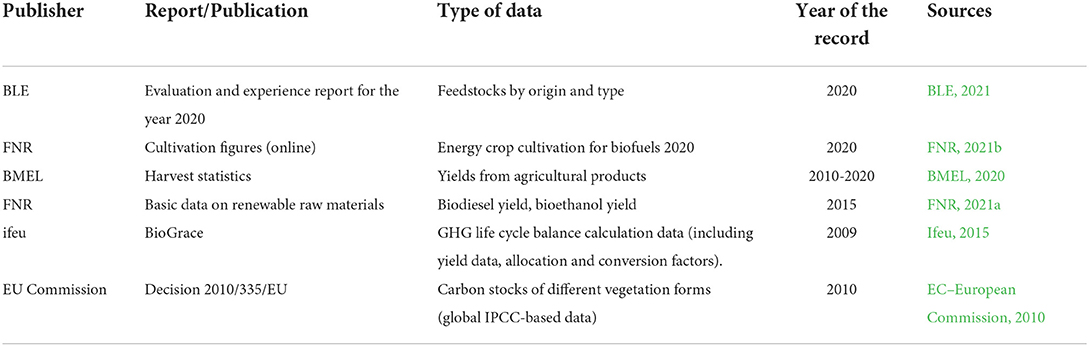
Table 1. Overview of central data bases.
Another central data source is the data from the Agency for Renewable Resources (FNR) on the cultivation of renewable raw materials in Germany (FNR, 2021a). The FNR data is also official data from the registered association Fachagentur Nachwachsende Rohstoffe e.V., which reports to the Federal Ministry of Food and Agriculture (BMEL). Data on biofuels, such as cultivation figures and land use data for energy crops, are published annually on the FNR website. In contrast to the data from the BLE, this information does not refer to the biofuels used in Germany, but to the biofuels (or feedstocks) produced on German land, including exports and excluding imports. According to FNR (2021a), biofuel production takes up 6.6% of the arable land in Germany, predominantly for rapeseed.
The data from the BMEL on harvest statistics (BMEL, 2020) and the data on fuel yields from the FNR (2021b) are included in the analysis in order to convert the FNR land use values into fuel quantities. For the BLE data, harvest quantities from BioGrace (Ifeu, 2015) are used.
Data from EC–European Commission (2010) are used to estimate the carbon content of various natural ecosystems. This includes the carbon stored in the above-ground and below-ground biomass of agricultural systems and natural vegetation types, differentiated by continent and climatic characteristics.
In Table 2 the data used on crop yields, land use for biofuels on German agricultural land, biofuel yields and allocation factors are compiled according to the data sources shown in Table 1.
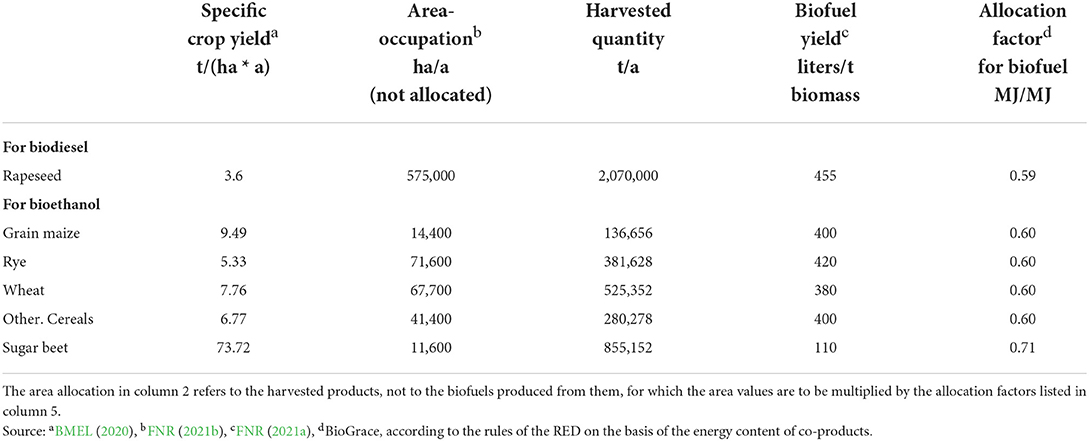
Table 2. Overview of the data used on crop yields, land use in Germany, biofuel yields and allocation factors for the distribution of greenhouse gas emissions and land use between biofuel and the respective by-products.
For the sake of completeness, it should be mentioned that a small proportion of biomethane upgraded from biogas and produced from crops is also used as transport fuel in Germany. However, it accounts for <0.5% of crop-based fuels and is therefore neglected in this analysis. For electricity and heat production, on the other hand, biogas use has a major role in Germany.
Methods
From a spatial perspective, this study covers the amount of biofuels produced and consumed in Germany. The date of the data basis is 2020, as the data of the BLE and FNR refer to this year.
The potential renaturation of cultivated areas for biofuels is a dynamic process whose development must be considered over a longer period of time. With a view to 2050, as the central target year of climate policy, the observation period of carbon storage over the course of natural vegetation development is set at 30 years. The annual saving of greenhouse gas emissions (represented by the data situation in 2020) is compared with an annual storage of CO2 in the natural growth as an average value over 30 years.
Land occupation due to the cultivation of energy crops for biofuels
The data of the BLE and the FNR are available in different units. While the FNR's data on energy crop cultivation for biofuels is already available in hectares, the BLE's data refers to mega joules. In order to be able to refer to the unit area, the data from the BLE are converted into area occupation data using yield data from the GHG emissions calculation tool for biofuels “BioGrace”.
Going further, the land use data of the FNR are compared with yield data in tons per hectare and year [t/(ha*a)] of the BMEL (2020) and biofuel yields in liters per ton of biomass (l/t BM) of the FNR (FNR, 2021a) and converted into peta joules (PJ).
Since co-products (e.g., rapeseed extraction meal, distillation residues) are also obtained from the agriculturally produced biomass along the production chain toward biofuels, the land use is divided among the various products. This step of considering co-products in the calculation is called allocation. Both the FNR's and the BLE's land use data are consequently offset with an allocation value. This is carried out according to the same standard as prescribed by the legislation (RED): based on the lower heating value, i.e., the energy content. The calculation of the allocation factors is based on the heating values according to RED (Annex III, data in mega joules per liter, MJ/l) and the yields of main products and by-products according to BioGrace. These allocation factors assign the respective biofuel to its share of the land use—the so-called allocated land use occupation. For example, according to the BLE, the land use for rapeseed in Germany comprises 0.266 million ha. If the co-products (rapeseed meal and glycerine) are taken into account, the value is reduced by 42% to 0.156 million ha. Consequently, 58% of the rapeseed area is attributed to biofuel.
Carbon sink potential through renaturation and carbon opportunity costs (COC)
The COC of German biofuels are determined on the basis of the potential for carbon storage on an area released for renaturation. For thisf purpose, a hypothetical scenario is considered in which Germany completely abandons the production and use of biofuels and thus also energy crop cultivation. Instead, these areas, which were previously occupied by energy crop cultivation, are left to their own devices. Natural vegetation communities develop on these areas. As in the previous steps, the carbon storage potentials are determined both on the basis of the biofuels produced in Germany and on the basis of the biofuels consumed in Germany. The latter also includes a consideration of the areas in the countries from which Germany imports biofuels or agricultural raw materials for biofuels.
For the areas in Germany, the potential carbon storage on the land left to itself is determined based on the concept of today's potential natural vegetation (hpnV). Suck et al. (2014a) is used to investigate which vegetation form can develop on agricultural land. For the cultivation areas outside Germany, the energy crop cultivation areas, differentiated by country and energy crop, are identified on the basis of the BLE reports. This step is essential to determine which potential vegetation can develop on these areas.
For the assignment of the potentially developing vegetation and the associated potential carbon storage, data on carbon storage in different vegetation types of the EC–European Commission (2010) are used. According to this, for example, the vegetation type tropical rainforest, Asia (islands), with a carbon content of up to 230 million t/ha in the juvenile stage, would develop on agricultural land in Indonesia if management were not carried out anymore. This information on the carbon content of vegetation types and of agricultural land is available at the level of large climatic regions.
To derive an annual carbon sequestration rate, the difference between the carbon stock of the agricultural land and the carbon content of the developing vegetation type in the juvenile forest stage is formed. It is assumed that the corresponding forest stage of EC–European Commission (2010) will be developed within a period of 30 years. Therefore, the difference in carbon stocks is divided by a factor of 301. The data on carbon stocks of agricultural land and developing vegetation forms are taken from EC–European Commission (2010). Under the simplifying assumption that carbon sequestration occurs evenly over time, this corresponds to the annual carbon storage rate. These carbon storage rates are multiplied by the areas of cultivated land.
The potential carbon storage from renaturation corresponds to the COC of biofuels. This means that they correspond to the lost potential carbon storage if the use of biofuels continues.
To compare the COC with the reported greenhouse gas emission savings of biofuels, emission savings from the most recent report of the BLE are used (BLE, 2021). Here, the GHG emission shares based on waste biomass (especially biodiesel based on used vegetable oil) are subtracted from the overall reported total GHG emission savings.
Results
Inventory of biofuels
Volume of biofuels produced in Germany
Table 3 shows the derivation of the amount of biofuel produced with biomass grown on German agricultural land based on FNR data and BMEL yield data. According to this, 942 million liters of rapeseed-based biodiesel and 621 million liters of bioethanol were produced on German arable land in 2020. In total, therefore, 1,560 million liters of biofuels were produced. Converted into energy content, this is a total of 44.1 PJ of biofuels. The largest share is accounted for by biodiesel based on rapeseed (70.4 %), followed by bioethanol from cereals (mainly wheat and rye, 25.1% cereals in total) and bioethanol from sugar beet (4.5%) (Figure 1).
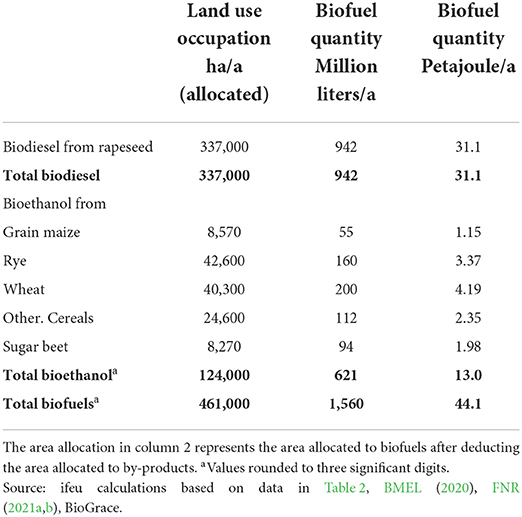
Table 3. Quantities of biofuels produced on German agricultural land.
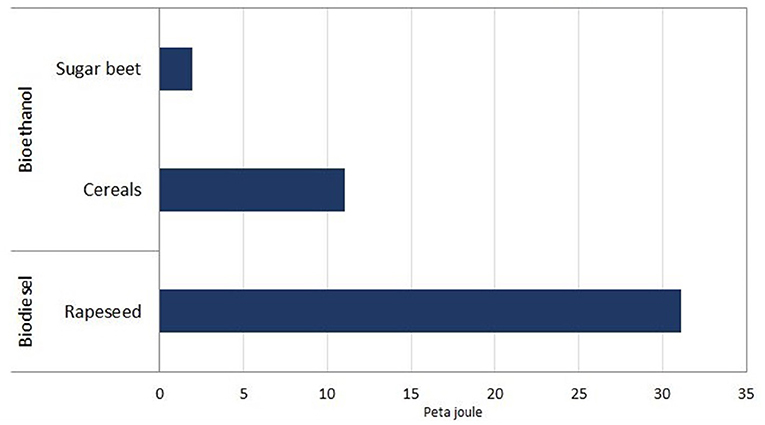
Figure 1. Energy quantities of biofuels produced on German agricultural land in 2020 [Source: ifeu calculations based on data in Table 2, (BMEL, 2020; FNR, 2021a,b)].
As mentioned above, these figures only describe the amount of biofuels produced on the basis of biomass grown in Germany, including the share of exported biofuels. The quantities do not correspond to the biofuels actually used or consumed in Germany.
The amount of biofuel actually used in Germany, on the other hand, also includes a high imported share, as explained in the following chapter.
Volume of biofuels used in Germany
In total, 121.2 PJ of crop-based biofuels were used in Germany in 2020. This means that this quantity was fuelled in Germany and counted toward the greenhouse gas quota. Table 4 shows the whole range of different feedstock of the biofuels used in Germany. According to this, biodiesel is largely made up of palm oil and rapeseed oil. Soya and sunflower take up much smaller shares in biodiesel. Furthermore, bioethanol consists primarily of grain and, to a lesser extent, sugar beet and sugar cane.
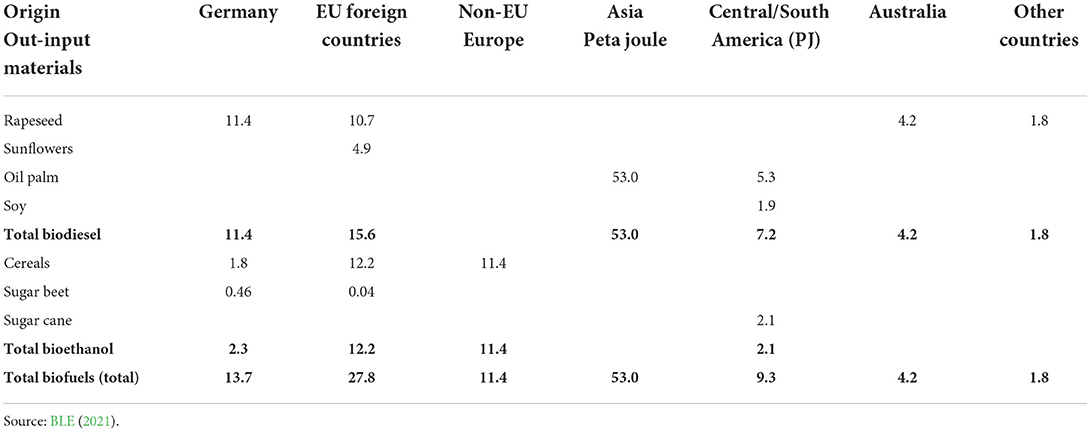
Table 4. Quantities of crop-based biofuels used in Germany, differentiated by feedstock and origin (values rounded).
In addition, the origin of the agricultural feedstock is shown in Figure 2. The majority of biofuels imported into Germany from cultivated biomass originate from Asia (53.0 PJ) and consist of palm oil2. Germany imports a further 27.8 PJ of crop-based biofuels from EU countries, most of which are fuels based on rapeseed, sunflower and cereals from Hungary and Poland. In third place are the biofuels produced and used in Germany, including primarily rapeseed oil-based fuels.
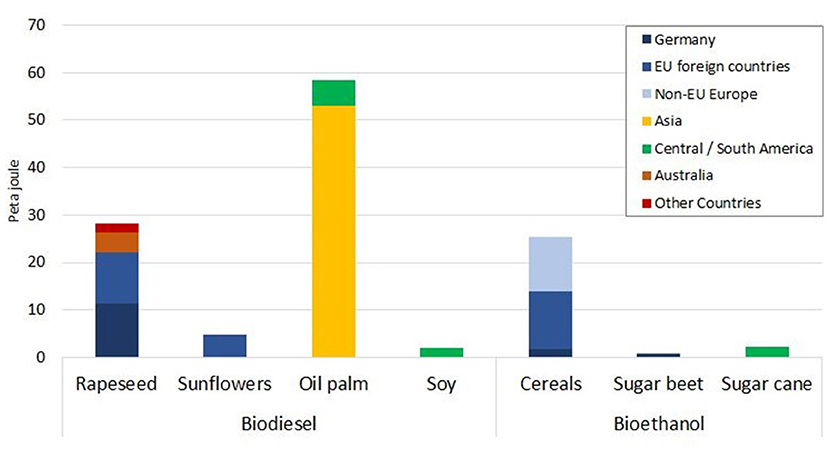
Figure 2. Biofuels based on cultivated biomass used in Germany in 2020 [Source: (BLE, 2021)].
Land occupation for biofuels
Land occupation for biofuels produced in Germany
According to FNR (2021b), 0.78 million ha of energy crops for biofuels are cultivated on German fields. If the by-products are deducted, as explained in Section Methods, this figure is reduced to 0.461 million ha. This area is about twice as large as the area of the Saarland. On this land, rapeseed is primarily cultivated for biodiesel (0.34 million ha) (Figure 3). In addition, 0.12 million ha of grain is cultivated for bioethanol and a small amount of sugar beet (0.01 million ha).
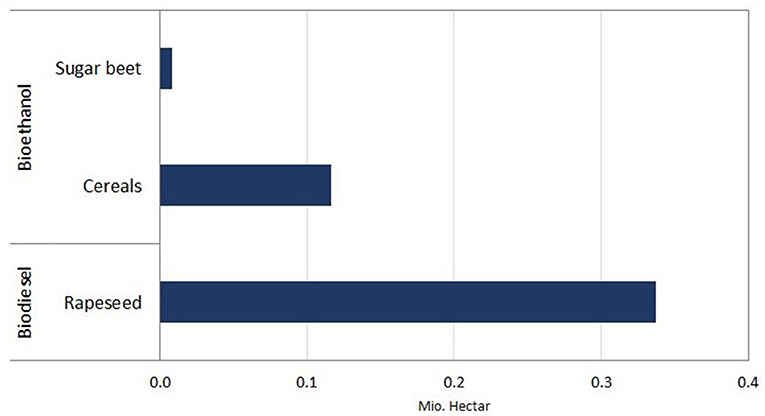
Figure 3. Land use occupation of cultivated energy crops produced in Germany in 2020 [Source: ifeu calculations based on data from Ifeu (2015), FNR (2021a)].
Land occupation of biofuels consumed in Germany
The total area covered by biofuels used in Germany in 2020 is 1.88 million ha, or 1.23 million ha if co-products are deducted. This area corresponds to about five times the area of Saarland or slightly less than the area of Schleswig-Holstein. High land use occupation is associated with rapeseed cultivation, oil palm cultivation and cereal cultivation. As can be seen from Figure 4 the cultivation of oil palms in particular occupies 0.35 million ha of land, mostly in Indonesia. For the cultivation of rapeseed, large areas are occupied both in Germany (0.16 million ha) and in other EU countries (0.15 million ha). In addition, grain for bioethanol is cultivated on 0.17 and 0.18 million ha in other EU countries and in European countries outside the EU.
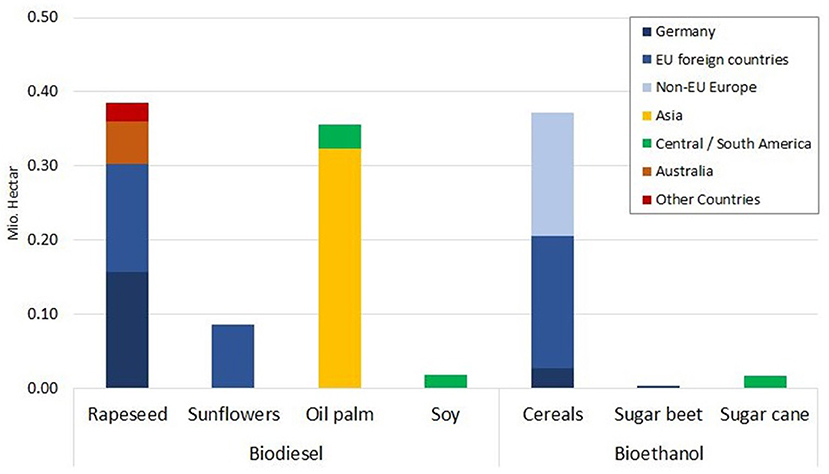
Figure 4. Land use occupation of biomass-based biofuels used in Germany in 2020 [Source: ifeu calculations based on data from Ifeu (2015), BLE (2021)].
Forgone carbon storage
The next step is to consider which natural carbon sinks could in principle develop on the land currently occupied for cultivating crops for biofuels. This is done analogously to previous results, on the one hand for biofuels produced in Germany and secondly for biofuels used in Germany.
Renaturation of the areas of energy crops produced in Germany
Assuming that the production of biofuels is not carried out on German agricultural land, 0.461 million ha are available for renaturation in Germany. In order to find out what kind of vegetation can develop on these areas, information from the concept of potential natural vegetation is used.
The map “Potential Natural Vegetation of Germany” commissioned by the Federal Agency for Nature Conservation (BfN) (Suck et al., 2013, 2014a,b) shows the potential vegetation of Germany in relation to present-day site conditions. This representation thus corresponds to today's potential natural vegetation (hpnV). According to the map, under current conditions primarily forest communities of beech forests would develop. Thus, it can be assumed that forest communities with beech forests would develop in the long term on the agricultural land used for fuel provision if management were not carried out anymore.
Renaturation of the areas of energy crops consumed in Germany
According to the Section Inventory of biofuels, a total of 1.23 million ha are available for renaturation worldwide, assuming that the biofuels used in Germany are not produced anymore.
In coherence with Section Renaturation of the areas of energy crops produced in Germany, a development toward natural vegetation communities on the areas is assumed if the use of biofuels is omitted. Since different vegetation forms would develop on these globally distributed areas, the countries from which the raw materials for the biofuels used in Germany originate were identified using the data from BLE (2020). The latest report of the BLE (2021) no longer contains a distinction of the individual countries of origin, but only information at the level of major regions and continents. Therefore, the BLE report of the year 2020 was used here.
Table 5 provides an overview of the primary production countries of the biofuels used in Germany, including the energy crops cultivated there, based on data from the BLE (2020, 2021). In addition, Table 5 contains information on vegetation types potentially developing there, based on an assignment of the production countries to the ecozones in EC–European Commission (2010). According to this, forest systems would develop on the majority of the areas. While in Europe and North America these are primarily forests of the temperate continental zone, secondary tropical rainforests may develop on the land in Southeast Asia and Central and South America. In Peru and Australia, it is assumed that tropical scrubland would develop on the agricultural areas.
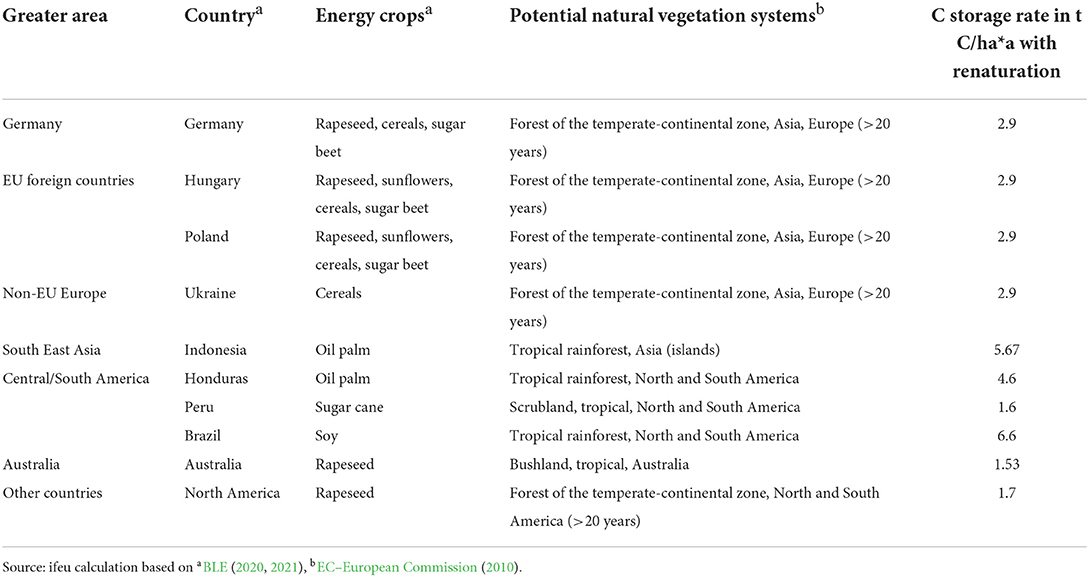
Table 5. Overview of potential vegetation development and associated sequestration rates.
Carbon opportunity costs of crop-based biofuels produced in Germany
According to the explanations in Section Carbon sink potential through renaturation and carbon opportunity costs (COC), the mean annual carbon storage rate is calculated from the difference between the carbon stocks of the existing cultivated areas and the potentially developing natural vegetation.
Table 5 shows the resulting annual carbon storage rates differentiated by production country. For Germany, the average annual carbon storage rate is 2.9 t C/ha*a. On average, this amount could be sequestered annually by the growth of natural vegetation on the agricultural land currently covered with cultivated biomass in Germany and Europe. This means that on the 0.461 million ha currently required for cultivated biomass in Germany, an average of 4.9 million t CO2 could be sequestered per year. Assuming continuous carbon sequestration, the total carbon store after 30 years would be ~147 million t CO2.
Carbon opportunity costs of crop-based biofuels consumed in Germany
If all agricultural land currently used worldwide for biofuel production for biofuel used in Germany were left to itself and the vegetation types listed in Table 5 would develop on these areas over a period of 30 years, an average of 16.37 million tons of CO2 could be sequestered annually (Figure 5). The storage rates vary from 1.53 t C/ha*a on tropical bushland in Australia to 6.6 t C/ha*a in the tropical rainforest of Brazil.
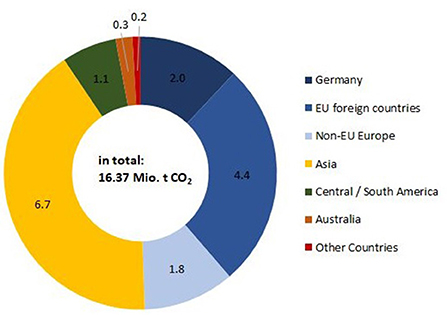
Figure 5. Mean annual CO2 storage by natural vegetation growth on current cropland for the production of biofuels used in Germany [Illustration ifeu; Source: ifeu calculations based on data from Europäische Kommission (2010), Ifeu (2015), BLE (2021)].
Over a 30-year period, a carbon sink of a total of 491 million t CO2 could develop. In Asia in particular, especially Indonesia, a carbon sink of approx. 200 million t CO2 could be established due to the high land use occupation on the one hand and the high annual storage rate on the other.
Comparison of official greenhouse gas emission savings from biofuels with carbon opportunity costs
According to the latest official figures, the use of biofuels in Germany in 2020 saved a total of 13.2 million t CO2 -eq. (BLE, 2021). This figure is calculated from the emissions of 2.77 million t CO2 -eq. caused by the provision of biofuels and the emissions of 15.92 million t CO2 -eq. saved by replacing the corresponding quantity of fossil fuels.
With these figures, it should be noted that a not insignificant share is accounted for by waste-based biofuels, especially from used cooking oil. After deducting these, 9.21 million t CO2 -eq. of calculated GHG emission savings remain that are based on biofuels from cultivated biomass.
In Figure 6 the COC of biofuels determined in Section Carbon opportunity costs of crop-based biofuels consumed in Germany are compared with the GHG emission savings according to BLE (2021). While the production and use of biofuels produced from crops and thus replacing fossil fuels saves 9.2 million t CO2 -eq. per year according to official figures, the same area (1.23 million ha in 2020) would store an average of about 16.4 million t CO2 per year if natural vegetation were allowed to grow up. This means that the CO2 costs of crop-based biofuels significantly exceed the reported CO2 savings from their use.
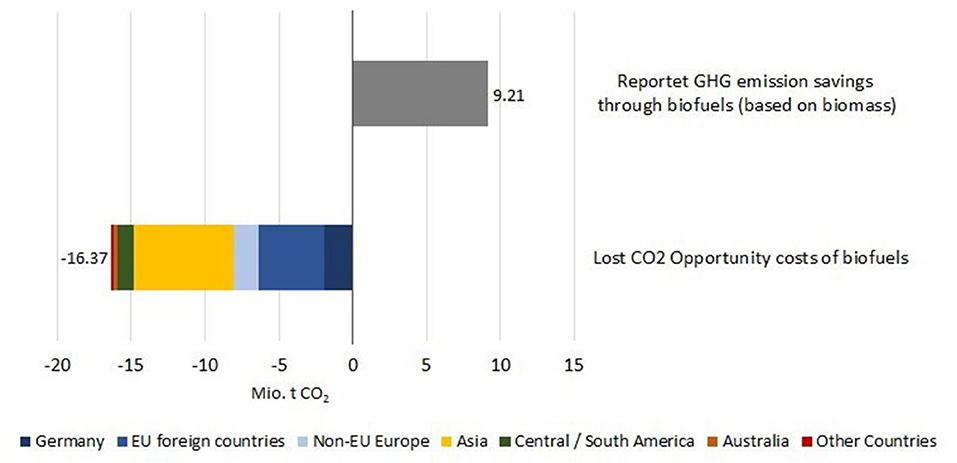
Figure 6. Comparison of GHG emission savings in Germany through biofuels based on biomass according to BLE (2021) with the CO2—opportunity costs of biofuels, differentiated by production region [Illustration ifeu; Source: ifeu calculations based on data of Europäische Kommission (2010), Ifeu (2015), BLE (2021)].
Discussion
This study has analyzed questions about the amount and extent of German biofuels and the question of lost natural carbon sinks and other ecological aspects. Incidentally, the discussion here also discusses limitations and boundaries of these analyses.
Inventory
For the inventory, i.e., the presentation of biofuel quantities and land use occupation, the results represent the first comprehensive presentation of the current situation of biofuels according to our current knowledge. This presentation was based on the original data from the BLE (122 PJ from crops) and FNR (782,000 hectares of land for biofuels). When determining the land requirements for biofuels, the co-products that are also produced (e.g., rapeseed meal) were considered by allocation in line with the RED rules and the total area was only proportionally allocated to the production of biofuels.
These data show that the volumes of biofuels produced from crops grown in Germany differ considerably from the biofuel volumes and types consumed in Germany. The example of biodiesel from rapeseed oil shows that although 31 PJ are produced in Germany, 20 PJ of this is exported abroad. In return, Germany imports 17 PJ of rapeseed oil biodiesel and rapeseed for biodiesel production from other countries, including significant parts from Australia. However, palm oil contributes the largest share of imports with 58 PJ in 2020. It should be noted that palm oil in Germany will no longer be accountable for the quotas from 2023 onwards.
It should be mentioned here that the above-mentioned 122 PJ of crop-based biofuels credited to Germany in 2020 to meet the quota, correspond to a share of 5.3% of final energy consumption in transport in Germany in 20203. According to the Act on the Further Development of the Greenhouse Gas Reduction Quota (Bundestag, 2021) a cap of 4.4% is prescribed for this type of biofuel from 2022. The amount in 2020 is thus significantly above this limit. Moreover, the share of palm oil-based biofuels was over 50%. The law excludes palm oil from creditability from 2023 onwards. At the same time, it commits to a greenhouse gas reduction of 25% in energy use in transport by 2030. This will keep the pressure to provide a high amount of biofuels in order to be credited. It remains to be seen which raw materials will then be used to meet the quota requirements.
Critical consideration of the reported emission savings from cultivated biofuels
It should also be pointed out at this point that the background of these values, which are considered official and which were created by the market players via the calculation and certification specifications according to the RED, are not transparent. For example, the emission values for several biofuel types have been developing significantly downwards for several years—which on the one hand is desirable and also the goal of the legal implementation of the RED in Germany via the GHG reduction quota. On the other hand, some of the values are not plausible, despite random checks by the BLE without knowledge of the underlying basic data. For example, the emission values for the production of ethanol based on cereals are extremely low: for ethanol based on wheat even only 3.16 g CO2 -eq./MJ. It should be noted that the cultivation of wheat already produces around 20 g CO2 -eq. per MJ ethanol produced from it (EC–European Commission, 2021a)4. The significantly lower total value results from the practice of operators to credit themselves externally for the use of CO2. However, the effective climate benefit is highly disputed here (Deutscher Bundestag, 2019). Policymakers should therefore apply stricter standards here and only allow verified emission reductions to be credited.
Renaturation potential
The renaturation potentials were determined on the basis of the two observation levels (biofuels grown in Germany and biofuels consumed in Germany). In the first case, 0.461 million hectares are available for this, in the second case 1.2 million hectares if biofuel production is omitted. The authors emphasize that this consideration is the assessment of a potential. The specific areas on which raw materials for biofuels were cultivated in 2020, for example, are not known in detail. In the preceding and subsequent years, other areas may have been used for this purpose. Accordingly, the assumption of the potentially developing vegetation forms is also made on a general basis.
In addition to the option of leaving these areas to their own devices, there are in principle other sensible measures such as conversion to organic farming or agroforestry. There is also the possibility of targeted afforestation of the remaining areas, in order to bring them back into forest management.
The approach of leaving the potentially released land to itself was chosen here because it addresses both climate protection and other ecological aspects. It is also in line with the National Strategy on Biological Diversity, which aims to increase the proportion of natural land (BMUB, 2015) by 10% through, for example, rewetting and renaturation. The Bundesregierung (2021) emphasizes in the framework of the Climate Protection Act that natural sinks such as forests should be strengthened. The action programme “Natural Climate Protection” even explicitly calls for the restoration of degraded ecosystems (Deutscher Bundestag, 2021). At European and international level, too, the demand for renaturation is becoming more and more important. For example, legal requirements on binding renaturation targets are currently expected at the EU level (EC–European Commission, 2021b). At the international level (UNEP and FAO, 2021) have announced the Decade of Restoration. During the COP26 in Glasgow, the carbon storage of forests was also a central topic and a pact for the protection of forests was concluded. It can therefore be assumed that the role of carbon storage by natural vegetation species will also become an increasingly important issue at the political level.
Carbon opportunity costs of biofuels
Within the framework of the study, average annual carbon stocks of 5 or 16 million t CO2 were determined on the renaturation areas, depending on whether domestic cultivation (according to FNR) or domestic use (according to BLE) of the biofuels was considered. The amount of 16 million t CO2 corresponds to approx. 2.2% of total German greenhouse gas emissions. Thus, in principle, a not inconsiderable proportion of greenhouse gases could be sequestered by implementing the renaturation option on current agricultural land for biofuels. There are various works on regional carbon sequestration rates in a global context (e.g., Cook-Patton et al., 2020). The values of the applied annual storage rates are associated with certain uncertainties. These refer on the one hand to the carbon stocks of agricultural land and forest or shrubland areas, and on the other hand to the assumption that the respective carbon stocks of the vegetation types develop within 30 years.
It has to be pointed out that the area on which biomass for biofuels is cultivated is not determined as such. It can change spatially and temporally. Often, not even farmers know which market his crops will end up in, whether they will become food, animal feed or biofuels. It is therefore not a question of a specific acreage of energy crops being specifically converted to natural area, but on the entire amount of acreage. However, the conversion can occur when the political incentive for crop-based biofuel production is abandoned and, at the same time, effective incentives are set for augmenting carbon stocks on the land.
As far as the calculation of the COC is concerned, the authors are aware that carbon sequestration is not a constant process and is subject to certain fluctuations. Thus, the authors would like to emphasize that carbon stocks are seen as potential reservoirs. The assumption that the carbon stock of vegetation forms is to be reached within 30 years is a simplification. Against the backdrop of new findings on the regenerative capacity of tropical forests (Heinrich et al., 2021) this observation period seems plausible for tropical regions in any case. The authors note that carbon storage is far more dynamic and differentiated in space and time. For example, it can be assumed that within the first 10 years, carbon sequestration is stronger in the tropics than in temperate latitudes. Thus, the data on carbon storage in the tropics tend to be an underestimate, while those for the temperate and boreal regions tend to be an overestimate.
Incidentally, it should be emphasized that the carbon stock determined in this study does not include soil carbon. Depending on the region, this can account for a considerable share of the total carbon stock in forest systems. Literature reveals that filling this gap in the balance sheet would ultimately only increase the effect of the COC (Cook-Patton et al., 2020; Neufeld, 2022). Thus, the applied figures even correspond to an underestimation.
GHG emission savings vs. carbon opportunity costs
The work at hand illustrates that a significant potential carbon sink is foregone when arable land is used for biofuel production. This conclusion confirms the findings of other studies (Righelato and Spracklen, 2007; Evans et al., 2015).
Considering the complexity of agricultural systems, the presented carbon balances and GHG emissions contain a number of simplifications. Many other conceivable factors for a sustainability assessment of biofuels are not the subject of the study at hand. However, the starting point is the officially reported saving of 9.2 million t CO2 -eq. in 2020 calculated with the RED methodology. The present study serves to supplement these figures with the aspect of COC.
In addition, the image of biofuels, which has been restricted here to the topic of climate impacts, must be supplemented by other aspects in the future. This will make it possible to draw a holistic picture of biofuels. Besides issues of ecological opportunity costs (biodiversity), topics such as energy security should be addressed. The fact that this is an extremely important aspect in the overall field of energy is shown by the highly explosive nature of the topic in the wake of Russia's invasion of Ukraine and the subsequent import stop on Russian energy sources. One objection may be that the reference to 2020 does not consider possible future developments. The authors cannot rule out the potential of higher yields and good practice of co-cropping crops with significantly lower land consumption. However, yields would have to almost double in order to achieve a reversal of results.
Conclusions
This study presents the so-called COC for biofuels used in Germany. The volume of crop-based biofuel that has been used in 2020 to meet the quota obligation occupies 1.2 million hectares worldwide, after deducting the area for co-products such as rapeseed meal. This corresponds to more than 10% of Germany's arable land. According to official data, the greenhouse gas emissions saved by using crop-based-biofuels instead of fossil fuels amounted to 9.2 million t CO2 -eq. If this saving were renounced and instead natural vegetation were allowed to grow on the land occupied for biofuels, an average annual carbon sequestration of over 16 million t CO2 would be possible as a result. These are the COC of biofuel production, and they are significantly higher than the emission reductions from replacing fossil fuels.
The calculation is based on numerous official data and scientific papers. Some of the factors used, such as the carbon storage rates of different ecosystems, are associated with uncertainty ranges—especially on the question of soil carbon, which was not considered in this paper. There is undoubtedly a need for further research here. However, the statements of the article can be regarded as reliable due to the conservative approach. Deviations in the concrete figures do not lead to a change in the core statement.
This means, considering COC, driving with fossil diesel has an overall better GHG balance than crop-based biofuels. However, the continued use of fossil diesel is not an option. Hence, there is a need for further alternatives. Fehrenbach and Bürck (2022) brought in the alternative system solar-based battery electric vehicle (BEV). They figured out that the land request (and therefore the COC) for BEV loaded by PV electricity is only 3% of the area required by the cultivation of biomass for biofuels to produce the same mileage in an internal combustion vehicle.
The recommendation for policy is therefore: the incentive for crop-based biofuel should be further reduced, as it effectively yields less greenhouse gas reduction than the official accounts would suggest. Instead, policy should effectively incentivize increased carbon storage on former agricultural land—or support other ecologically sensible conversions (e.g., using the land for increasingly organic farming). The far greater climate protection benefit in transport compared to crop-based biofuels can be achieved through e-mobility.
Data availability statement
The original contributions presented in the study are included in the article/supplementary material, further inquiries can be directed to the corresponding author/s.
Author contributions
All authors listed have made a substantial, direct, and intellectual contribution to the work and approved it for publication.
Funding
The research leading to results presented in this paper was funded by the Deutsche Umwelthilfe (DUH), Germany.
Conflict of interest
Authors HF and SB were employed by Institute for Energy and Environmental Research Heidelberg gGmbH.
Publisher's note
All claims expressed in this article are solely those of the authors and do not necessarily represent those of their affiliated organizations, or those of the publisher, the editors and the reviewers. Any product that may be evaluated in this article, or claim that may be made by its manufacturer, is not guaranteed or endorsed by the publisher.
Footnotes
1. ^The uniform averaging over 30 years represents a simplification here, as carbon sequestration is not a constant process and is subject to certain fluctuations.
2. ^According to BLE (2021) Asia is also Germany's largest exporter of used cooking oil for biodiesel with 17.8 PJ in 2020.
3. ^According to the Working Group on Energy Balances (AGEB, 2021) final energy consumption in transport (excluding air and sea transport) in Germany was 2,292 PJ in 2020.
4. ^While market participants have been calculating GHG values for their biofuels themselves instead of the default values for some years now, no values are calculated themselves for cultivation, but the so-called NUTS2 values referenced in the preceding footnote are usually used (see also Deutscher Bundestag, 2019).
References
AGE (2021). Auswertungstabellen zur Energiebilanz Deutschland—Daten für die Jahre von 1990 bis 2020. Available online at: https://ag-energiebilanzen.de/wp-content/uploads/2020/09/awt_2020_d.pdf (accessed December 27, 2021).
BLE (2020). Evaluations-und Erfahrungsbericht für das Jahr 2019. Biomassestrom-Nachhaltigkeitsverordnung. Biokraftstoff-Nachhaltigkeitsverordnung. Available online at: https://www.ble.de/SharedDocs/Downloads/DE/Klima-Energie/Nachhaltige-Biomasseherstellung/Evaluationsbericht_2019.html (accessed December 22, 2021).
BLE (2021). Evaluations-und Erfahrungsbericht für das Jahr 2020. Biomassestrom-Nachhaltigkeitsverordnung. Biokraftstoff-Nachhaltigkeitsverordnung. Available online at: https://www.wochenblatt-dlv.de/media/2021-12/Evaluationsbericht_2020.pdf (accessed December 22, 2021).
BMEL (2020). Besondere Ernte- und Qualitätsermittlung (BEE). Available online at: https://www.bmel-statistik.de/fileadmin/daten/EQB-1002000-2020.pdf (accessed December 23, 2021).
BMUB (2015). Nationale Strategie zur biologischen Vielfalt. Kabinettsbeschluss vom 7. Available online at: https://www.bmu.de/fileadmin/Daten_BMU/Pools/Broschueren/nationale_strategie_biologische_vielfalt_2015_bf.pdf (accessed December 22, 2021).
Bundesregierung (2021) “Klimaschutzgesetz: Klimaneutralität bis 2045,” in Bundesregierung-Startseite. Available online at: https://www.bundesregierung.de/breg-de/themen/klimaschutz/klimaschutzgesetz-2021-1913672 (accessed February 1, 2022).
Cook-Patton, S. C., Leavitt, S. M., Gibbs, D., Harris, N. L., Lister, K., Anderson-Teixeira, K. J., et al. (2020). Mapping carbon accumulation potential from global natural forest regrowth. Nature 585, 545–550. doi: 10.1038/s41586-020-2686-x
Deutscher Bundestag (2019). Unterrichtung durch die Bundesregierung. Available online at: https://dserver.bundestag.de/btd/19/079/1907990.pdf (accessed February 2, 2022).
Deutscher Bundestag (2021). “Grüne fordern Aktionsprogramm Natürlicher Klimaschutz,” in Deutscher Bundestag. Available onilne at: https://www.bundestag.de/presse/hib/842982-842982 (accessed February 1, 2022).
EC–European Commission (2010). Beschluss der Kommission vom 10. Juni 2010 über Leitlinien für die Berechnung des Kohlenstoffbestands im Boden für die Zwecke des Anhangs V der Richtlinie 2009/28/EG. Available online at: https://eur-lex.europa.eu/legal-content/DE/TXT/PDF/?uri=CELEX:32010D0335 (accessed December 22, 2021).
EC–European Commission (2021a). Values reported to the Commission by the EU Member States implementing Article 19 (2) of the Renewable Energy Directive (Directive 2009/28/EC). Available online at: https://ec.europa.eu/energy/sites/default/files/documents/pre-iluc_directive_nuts2_report_values_mj_kg_july_2018.pdf (accessed February 2, 2022).
EC–European Commission (2021b). Consultation Strategy Impact Assessment Accompanying a Draft Legislative Proposal on eu Nature Restoration Targets. Available online at: https://ec.europa.eu/environment/strategy/biodiversity-strategy-2030/eu-nature-restoration-targets_en (accessed February 1, 2022b).
Europäische Kommission (2010). Beschluss der Kommission vom 10. Juni 2010 über Leitlinien für die Berechnung des Kohlenstoffbestands im Boden für die Zwecke des Anhangs V der Richtlinie 2009/28/EG (Bekannt gegeben unter Aktenzeichen K(2010) 3751). Available online at: https://op.europa.eu/de/publication-detail/-/publication/55f1c6e9-d08a-4678-9ad4-193c06df52ff (accessed June 9, 2020).
Evans, S. G., Ramage, B. S., DiRocco, T. L., and Potts, M. D. (2015). Greenhouse gas mitigation on marginal land: a quantitative review of the relative benefits of forest recovery vs. biofuel production. Environ. Sci. Technol. 49, 2503–2511. doi: 10.1021/es502374f
Fehrenbach, H., and Bürck, S. (2022). CO2-Opportunitätskosten von Biokraftstoffen in Deutschland. S. 41. Available online at: https://www.duh.de/fileadmin/user_upload/download/Projektinformation/Naturschutz/Agrokraftstoffe/ifeu_Studie_Agrokraftstoffe_2302022_final.pdf (accessed April 29, 2022).
Flach, B., Lieberz, S., and Bolla, S. (2021). European Union: Biofuels Annual. Available online at: https://www.fas.usda.gov/data/european-union-biofuels-annual-1 (accessed May 9, 2022).
FNR (2021a). Entwicklung Biodiesel-Produktion und -Absatz in Deutschland. Available online at: https://basisdaten.fnr.de/bioenergie/biokraftstoffe (accessed December 24, 2021).
FNR (2021b). FNR-Pflanzen: Anbauzahlen. Available online at: https://pflanzen.fnr.de/anbauzahlen (accessed December 21, 2021).
German Federal Government (2021). Bundes-Klimaschutzgesetz. Available online at: https://www.gesetze-im-internet.de/ksg/ (accessed August 31, 2022).
Hayek, M. N., Harwatt, H., Ripple, W. J., and Mueller, N. D. (2021). The carbon opportunity cost of animal-sourced food production on land. Nat. Sustain. 4, 21–24. doi: 10.1038/s41893-020-00603-4
Heinrich, V. H. A., Dalagnol, R., Cassol, H. L. G., Rosan, T. M., de Almeida, C. T., Silva Junior, C. H., et al. (2021). Large carbon sink potential of secondary forests in the Brazilian Amazon to mitigate climate change. Nat. Commun. 12, 1785. doi: 10.1038/s41467-021-22050-1
Ifeu (2015). BIOGRACE. Available online at: https://www.biograce.net/home (accessed December 21, 2021).
IPBES (2019). Summary for policymakers of the global assessment report on biodiversity and ecosystem services. Zenodo. Available online at: https://zenodo.org/record/3553579 (accessed February 01, 2022).
IPCC (2019). Climate Change and Land: An IPCC Special Report on Climate Change, Desertification, Land Degradation, Sustainable Land Management, Food Security, and Greenhouse Gas Fluxes in Terrestrial Ecosystem - Technical Summary. Available online at: https://www.ipcc.ch/site/assets/uploads/sites/4/2020/07/03_Technical-Summary-TS_V2.pdf
Neufeld, D. (2022). “Visualizing Carbon Storage in Earth's Ecosystems,” in Visual Capitalist. Available online at: https://www.visualcapitalist.com/visualizing-carbon-storage-in-earths-ecosystems (accessed February 2, 2022).
Righelato, R., and Spracklen, D. V. (2007). Carbon mitigation by biofuels or by saving and restoring forests? Science 317, 902–902. doi: 10.1126/science.1141361
Schmidinger, K., and Stehfest, E. (2012). Including CO2 implications of land occupation in LCAs-method and example for livestock products. Int. J. Life Cycle Access. 17, 962–972. doi: 10.1007/s11367-012-0434-7
Searchinger, T. D., Wirsenius, S., Beringer, T., and Dumas, P. (2018). Assessing the efficiency of changes in land use for mitigating climate change. Nature. 564, 249–253. doi: 10.1038/s41586-018-0757-z
Suck, R., Bushart, M., Hofmann, G., and Schröder, L. (2013). Karte der Potentiellen Natürlichen Vegetation Deutschlands. Band II Kartierungseinheiten. Unter Verwendung von Ergebnissen aus dem F + E-Vorhaben FKZ 3508 82 0400. BfN-Skripten BfN, Bonn-Bad Godesberg.
Suck, R., Bushart, M., Hofmann, G., and Schröder, L. (2014a). Karte der Potentiellen Natürlichen Vegetation Deutschlands. Band I Grundeinheiten. Unter Verwendung von Ergebnissen aus dem F + E-Vorhaben FKZ 3508 82 0400. BfN-Skripten BfN, Bonn-Bad Godesberg.
Suck, R., Bushart, M., Hofmann, G., and Schröder, L. (2014b). Karte der Potentiellen Natürlichen Vegetation Deutschlands. Band III Erläuterungen, Auswertungen, Anwendungsmöglichkeiten, Vegetationstabellen. BfN, Bonn-Bad Godesberg.
UNEP and FAO (2021). “UN Decade on Restoration,” in UN Decade on Restoration. Available online at: http://www.decadeonrestoration.org/node (accessed February 1, 2022).
Wirsenius, S., Searchinger, T., Zionts, J., Peng, L., Beringer, T., and Dumas, P. (2020). Comparing the Life Cycle Greenhouse Gas Emissions of Dairy and Pork Systems Across Countries Using Land-Use Carbon Opportunity Costs. Available online at: https://files.wri.org/d8/s3fs-public/comparing-life-cycle-greenhouse-gas-emissions-dairy-pork-systems_0.pdf (accessed December 22, 2021).
Keywords: carbon opportunity costs, biofuels, GHG emissions, foregone sequestration, renaturation
Citation: Fehrenbach H and Bürck S (2022) Carbon opportunity costs of biofuels in Germany—An extended perspective on the greenhouse gas balance including foregone carbon storage. Front. Clim. 4:941386. doi: 10.3389/fclim.2022.941386
Received: 11 May 2022; Accepted: 08 September 2022;
Published: 05 October 2022.
Edited by:
Michael Martin, Swedish Environmental Research Institute (IVL), SwedenReviewed by:
Jacopo Giuntoli, Independent Researcher, Montecatini Terme, ItalyRoozbeh Feiz, Linköping University, Sweden
Copyright © 2022 Fehrenbach and Bürck. This is an open-access article distributed under the terms of the Creative Commons Attribution License (CC BY). The use, distribution or reproduction in other forums is permitted, provided the original author(s) and the copyright owner(s) are credited and that the original publication in this journal is cited, in accordance with accepted academic practice. No use, distribution or reproduction is permitted which does not comply with these terms.
*Correspondence: Horst Fehrenbach, aG9yc3QuZmVocmVuYmFjaEBpZmV1LmRl