 Daniel Lückerath
 Erich Rome
 Katharina Milde
- Adaptive Reflective Teams, Fraunhofer Institute for Intelligent Analysis and Information Systems IAIS, Sankt Augustin, Germany
As the climate crisis accelerates, the resilience of Europe's aging critical infrastructure systems shifts more and more into focus. However, the rising interconnectedness of critical infrastructure systems and the dependency of their operation on multiple stakeholders makes approaches that target the resilience of isolated infrastructures insufficient and might even result in a decrease of the resilience of the whole system. This need for more resilience thinking in interconnected infrastructure systems has resulted in advances in risk analyses of supply chains and analyses of interdependencies in infrastructure systems from a Critical Infrastructure Protection/Resilience perspective. However, results from such analyses on the level of interconnected infrastructure systems have seldomly be broken down to the level of individual corporate value chains, a necessity as national/regional resilience efforts need to be supported on the local level. In this paper we therefore propose a novel approach for value chain climate risk and vulnerability analysis that combines a participatory, indicator-based approach with a semi-quantitative risk matrix approach to allow linking analyses from national to local scale and supports economic assessment of climate change impacts for individual businesses. This approach has been developed and prototypically applied in a case study in a German metropolitan area located at the Rhine River. The results allow to identify where along the dependency chains of interconnected infrastructure systems, hazards and impacts might manifest, which cascading (economic) impacts result on the level of individual infrastructure operators, and where resilience measures should be taken to be most effective and (cost) efficient.
1. Introduction
Critical Infrastructure is essential for everyday life and for the functioning of society; it is the backbone of vital societal functions as well as the social and economic wellbeing of people. Critical Infrastructure includes many types of public and private assets, like transportation, communication, electricity, and water networks, food production, supply chains, waste treatment, industrial facilities, governmental facilities, and cultural assets. At least 70 countries1 have introduced definitions of what qualifies as and constitutes their Critical Infrastructure, but these definitions vary due to the differences in available infrastructure, abilities, and resources for protecting such infrastructure, as well as governance and political priorities. Therefore, we will use “infrastructure” and “Critical Infrastructure” synonymously in the remainder of this article. Over the last decades, infrastructure systems have transformed from widely isolated service providers to interdependent parts in a “system of systems” (cf. Eusgeld et al., 2011)—tightly organized networks that are carried by a multitude of actors, involve a myriad of physical and digital structures, and offer services to society through all sorts of physical and digital channels. Without these tightly organized networks, the international division of labor and global economy would not be possible. But it is also an inherent feature of this tight organization that risk, including climate risk, can propagate along dependencies in these networks and cause local, regional, national, and transboundary impacts.
The infrastructure sector is responsible for 79 percent of total greenhouse gas emissions and 88 percent of all adaptation costs (Thacker et al., 2021). It therefore takes on a key role to achieve the Paris 2015 goals and needs to be better adapted to the unavoidable impacts from climate change we are already experiencing. Physical climate-driven hazards such as heatwaves, droughts, wildfires, fluvial and coastal floods, as well as windstorms already have significant impact on the aging European infrastructure systems (European Commission, 2021a) and these impacts will increase even more in the coming years, especially in places already exposed to high temperatures and along coasts (cf. IPCC, 2022).
As infrastructure becomes even more connected, it becomes necessary to focus on the full spectrum of dependencies within the connected system of systems to fully address its climate mitigation and adaptation potential, and move to a “resilience thinking” approach for managing infrastructure systems (Forzieri et al., 2016, 2018). On a European level, several new or updated policies (European Commission, 2019, 2020, 2021b) acknowledge this fact and require measures for making infrastructures and “critical entities” more resilient to threats—including threats induced by climate change. While such policies become increasingly mutually consistent, the increasing interdependence of infrastructure systems raises several questions: Where along the dependency chains of interdependent infrastructure systems do climate hazards originate? Where will the impacts of these hazards manifest? Where will cascading impacts manifest? What risks result from these impacts? Where along the dependency chain should adaptation and mitigation measures against climate change risks be taken to be most efficient and effective? Who should be responsible for implementing these measures? And who should bear the costs of these measures, considering that multiple stakeholders along the dependency chains might benefit from their implementation?
A first step toward answering some of these questions would be to conduct a climate risk assessment that allows to locate impacts and risks along dependency chains of infrastructure systems and enables to quantify the socio-economic losses posed by climate change impacts as well as the potential benefits of adaptation/mitigation measures for different stakeholders. To do so, it would be necessary to understand the nature of the dependencies within the global system of systems: infrastructure systems and economic networks and their substructures. Contributions to advance such an understanding have been made in different fields. In the research area of Critical Infrastructure Protection and Resilience, numerous investigations on critical infrastructures, their dependencies, and cascading failures have been made (e.g., Luiijf et al., 2010; Setola et al., 2017). In economics, methods for analyzing commodity chains, supply chains, and value chains have been developed for specific analytical purposes in macro-economy or on business level. Some of these methods have been further developed to inform risk management, so it seems logical to integrate climate risk assessment into such established methods. However, despite the rising need to increase the resilience of infrastructure systems against extreme weather events, methods to assess climate risks along their corporate value chains are still lacking2 and have become moderately popular only in the food industry (Oxfam, 2012). In addition, only few economic assessments of future infrastructure developments under different climate scenarios, like recently (Hänsel et al., 2020), have been developed.
To take a step toward closing these gaps, in this paper we propose a novel approach for value chain climate risk and vulnerability assessment (CRVA) that combines a participatory, indicator-based approach with a semi-quantitative risk matrix approach to allow linking analyses from national to local scale and supports economic assessment of climate change impacts for individual businesses. This approach has been developed and prototypically applied in a case study as part of the research project “Unpacking climate Impact Chains—a new generation of climate change risk assessments” (UNCHAIN). In UNCHAIN, ten research organizations and universities collaborate on a systematic study to improve a particular indicator-based CRVA approach using Impact Chains (ICs). The research and development took place in twelve case studies that the project partners conducted in seven countries, each covering different sectors, spatial scales, and innovation approaches. Some of the work originating from other UNCHAIN case studies, a more detailed presentation of the use of Impact Chains for CRVA, an overview and assessment of the achieved innovations, and a description of the research pipeline in UNCHAIN please find in other UNCHAIN related articles of this journal issue.
The case study, in which the work presented in this paper has been developed, addressed climate risk for a German metropolitan area located at the Rhine River, including critical infrastructure. Specifically, the case study focused on the major metropolitan region of Mannheim—a heavily industrialized region—the companies and residents located therein, as well as energy production and freight transport via the Rhine River as critical infrastructure systems. A specific goal of the case study was to connect the regional risk analysis to the more general national German climate Impact Chains (Umweltbundesamt, 2016) on the one hand, and to individual stakeholders' business continuity management on the other hand, spanning three levels of governance scale. In particular, we collaborated with the City of Mannheim and other regional stakeholders to assess the “Risk of negative impacts of extended periods of drought and low waters of the Rhine River on infrastructure, logistics and population in the metropolitan region of Mannheim,” using climate Impact Chains. It should be noted that besides the research goals, it was also a goal to provide actionable decision support to the stakeholders participating in the case study for their climate risk assessments.
The remainder of the paper is structured as follows. After a brief introduction into participative, Impact Chain-based climate risk and vulnerability assessment (IC-based CRVA), we describe the background situation of the case study and introduce the applied value chain CRVA process. The “Results” section then describes the major outcomes of the case study, before we discuss the main insights from the case study and the achieved innovation of the value chain CRVA. We conclude the paper by providing hints for future work.
2. An introduction to participative, IC-based CRVA
Climate risk and vulnerability assessments can be conducted using different methods, depending on the aims and scope of the analysis. Quantitative methods, like quantitative risk assessments using damage functions or event tree analysis, are usually extremely data demanding, but allow detailed analysis from international to site-specific spatial scales that can support cost-benefit analysis and the identification of cascading effects. (Semi-) Qualitative approaches, like the risk matrix approach or the indicator-based approach, on the other hand, are less data demanding, allow the inclusion of expert judgements, and are usually easier to understand for a broader range of stakeholders. However, their results heavily depend on participating stakeholders, usually cannot easily support cost-benefit analysis, and—in the case of the indicator-based approach—are often not applicable at small (site-specific) spatial scales.
One well-known implementation of the indicator-based approach was developed by Eurac Research for studies on climate vulnerability in the Alps. First published in Schneiderbauer et al. (2013), it has been further developed for the national climate vulnerability assessment for Germany and the Vulnerability Sourcebook on climate vulnerability assessment in the context of international cooperation (Fritzsche et al., 2014). The Vulnerability Sourcebook provides a modular CRVA framework for understanding, systematizing, and prioritizing the factors that drive climate impact related vulnerability in a specific system of concern. The framework is known as the “Vulnerability Sourcebook method” and is divided in a highly participative, qualitative phase and a less participative, quantitative assessment phase. It has been applied in numerous cases, usually at national, regional, or local—i.e., city or county—scale. Since 2017, the framework was adapted to the new IPCC Assessment Report 5 (IPCC, 2014) concept of climate risk and was recommended for climate risk assessments in the context of Ecosystem Based Adaptation (Hagenlocher et al., 2018). At the same time, the framework was also adapted by Fraunhofer in the European research project RESIN for climate risk assessments of cities and infrastructures (Lückerath et al., 2018; Rome et al., 2018), also investigating the potential of combining indicator-based approaches with quantitative risk assessments and risk matrix approaches using damage functions (Rome et al., 2018). For applying the original Vulnerability Sourcebook method and its updates extensive guidelines are available (Fritzsche et al., 2014; GIZ and EURAC, 2017; Hagenlocher et al., 2018; Rome et al., 2018). In this introduction, we present only the basic underlying concepts of this family of IC-based CRVA methods.
At the core of the Vulnerability Sourcebook method lies the development of Impact Chains, cause-effect models that describe the relationship between climate change-induced hazards (e.g., a heavy rain event), exposed elements (e.g., businesses located in a specific area) and their vulnerability (e.g., availability of flood protection measures), and resulting impacts (e.g., erosion upstream that contributes to flooding downstream). According to the IPCC Assessment Report 5 (IPCC, 2014), the final risk “results from the interaction of vulnerability, exposure, and hazard.” Works like (GIZ and EURAC, 2017) and (Rome et al., 2018) are first operationalizations of that IPCC definition of climate risk, using its risk components hazard, exposure, and vulnerability as defined by the IPCC. Both works look at risk components in more detail and subdivide them into (risk) factors: Factors of the hazard under consideration are climate signals and direct physical impacts, exposure factors are one or more entities exposed to the hazard, vulnerability factors are sensitivities and capacities of these exposed entities (GIZ and EURAC, 2017). Again, IPCC definitions are used for these terms.
Impact Chains are composed of all these elements: risk components, risk factors, and additionally, intermediate impacts. According to GIZ and EURAC (2017), “intermediate impacts are not a risk component by themselves but merely an auxiliary tool to fully grasp the cause-effect chain leading to the risk.” Intermediate impacts can capture, for instance, cascading effects like infrastructure failures propagating after a first physical impact. The Impact Chain concept is depicted in Figure 1. An Impact Chain is represented in graphical form, which is typically a diagram like that in Figure 1, but with more and concrete elements. In some works, like (Rome et al., 2018), stressors are added as external factors that could aggravate impacts of a hazard, like a garbage worker strike during a heat wave.
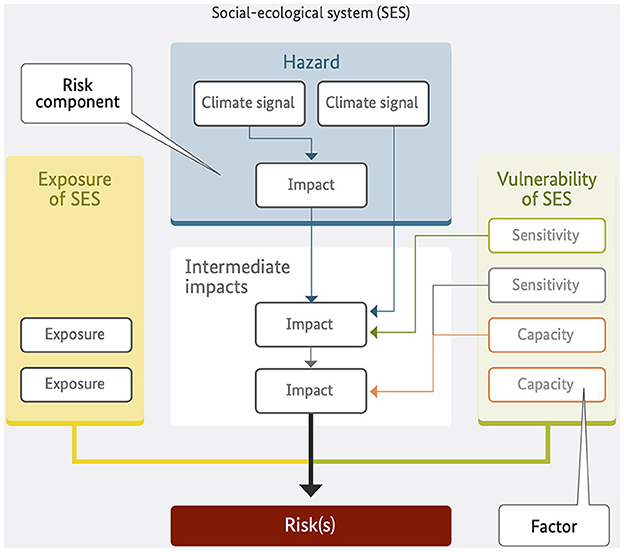
Figure 1. Structure and elements of an Impact Chain. Source: Hagenlocher et al. (2018). With kind permission of K. Renner, EURAC. Climate risk results from the interaction of the risk components vulnerability, exposure, and hazard (IPCC, 2014). Risk components are subdivided into (risk) factors: Factors of the hazard under consideration are climate signals and direct physical impacts, exposure factors are one or more entities exposed to the hazard, vulnerability factors are sensitivities and capacities of these exposed entities (GIZ and EURAC, 2017). “Intermediate impacts are not a risk component by themselves but merely an auxiliary tool to fully grasp the cause-effect chain leading to the risk” (GIZ and EURAC, 2017), including cascading effects like propagation of infrastructure failure.
Impact Chains are usually developed in participative settings with local stakeholders. A validation of an Impact Chain is conducted by gathering and integrating feedback of the participating domain experts until a final approval of the results by all stakeholders. A final validated Impact Chain captures the cause-effect relationships of the investigated climate risk in a structured way and provides pointers to first options for adaptation: increasing identified capacities, reducing identified sensitivities, and mitigating identified intermediate impacts. But Impact Chains also serve as the backbone for an indicator-based CRVA; they are the basis for the selection of appropriate indicators as well as a backbone for the aggregation of indicators to composite risk indicators. CRVA based on Impact Chains can combine data and model driven approaches with expert-based approaches. However, Impact Chains as a core modeling element are more versatile and can be the basis for different analyses, from the analysis of transboundary knock-on effects, like diminished local industrial or agricultural production, to the analysis of cross-sectoral local effects, for example, the disruption of local supply chains. In addition, Impact Chains are also a useful tool for communication of complex cause-effect relationships of impacts and risks.
The participative nature of IC-based CRVA has shown to be particularly effective in providing actionable results that are usable by relevant decision-makers and practitioners, compared to conventional CRVA approaches, in which researchers or industry professionals provide consultancy services as a “black box” or where isolated departments of single businesses conduct risk analyses in a top-down fashion (Klein and Juhola, 2014; Bremer and Meisch, 2017; Palutikof et al., 2019). This effect is especially pronounced in interdependent infrastructure systems and value chains, where a myriad of stakeholders from different backgrounds and institutions, each with differing expectations and agendas, need to collaborate to make the whole system and value chain more resilient in a cost-efficient and effective way.
The positive effects of transdisciplinary methods for knowledge co-production that include experiences from various points of views have been acknowledged by a growing number of scientists and policymakers, who argue for reconceptualizing the roles of experts, practitioners and citizens in the production and use of scientific knowledge (European Commission, 2009; Rodela and Gerger Swartling, 2019). The need for better collaboration and combination of knowledge and expertise is also emphasized in several European and national strategies. For example, the Recommendations for National Risk Assessment for Disaster Risk Management in the European Union (Poljansek et al., 2021), the new German resilience strategy (Bundesregierung, 2022), and the German guidelines for national and regional climate impact and vulnerability analyses, targeting national and regional authorities (Umweltbundesamt, 2017).
The Impact Chain-approach to CRVA is especially suited for such knowledge co-production approaches, as it makes extensive use of participatory workshops in which assessment goals, Impact Chains, and indicators are jointly defined between researchers, experts from municipalities, local businesses, Non-Governmental Organizations, civil society, and other local stakeholder groups, thus validating the results and ensuring ownership and sustainability. For more in-depth information on this assessment method, we refer the reader to the elaborated guidelines (Fritzsche et al., 2014; Rome et al., 2017; Hagenlocher et al., 2018), the publications (Schneiderbauer et al., 2013; Rome et al., 2018), the identification of challenges and opportunities of the approach (Menk et al., 2022), and the discussion on the value of innovating the method in another paper in this journal issue.
3. Case study background, process, and applied methods
In this section, we describe the regional and nationwide setting of our case study, characterize the case study process, and describe in detail how we applied IC-based CRVA on the regional level and how we combined IC-based CRVA with Value Chains on the corporate level.
For being able to properly conduct a climate risk assessment for the metropolitan region of Mannheim, we collected relevant background information from various sources to get an understanding of the situation in the region. The guiding questions for the research were:
• What is the economic importance of the Rhein River for Germany, what are its infrastructure functions, how was it affected by the weather extremes of 2018?
• What is the current understanding of the current and future situation regarding climate risk in general and drought and low water in particular in Germany and in the metropolitan region?
• What is the local situation in the Mannheim region in terms of infrastructure, economy, climate risk, exposure, adaptation policies, and action plans?
3.1. Case study background
3.1.1. Economic importance of the Rhine river
The Rhine is the most important waterway in Europe. It connects important industrial locations from Switzerland to the Netherlands. The transport of goods by inland waterway vessels via the Rhine is of great economic importance for many companies, for the riparian states and for Europe. In Germany, 80 percent of the goods transported by inland waterway vessels are shipped via the Rhine (IfW, 2018). Restrictions on the transport of goods via the Rhine can lead to considerable economic losses. In the summer of 2018, 132 low-water days were registered on the Rhine—a record since data recordings began. According to the Federal Statistical Office (Destatis, 2019, p. 11) and the Kiel Institute for the World Economy (IfW, 2018, p. 2), the low water of the Rhine caused a 0.2 percent decline in Germany's gross domestic product in the 3rd quarter of 2018. A study (Streng et al., 2020) by the Erasmus Center for Urban, Port and Transport Economics puts the economic damage of the low water level of the Rhine in 2018 at a nominal €2.4 billion for Germany and €295 million for the Netherlands.
Even if the share of goods transported annually by inland waterway in Germany is “only” about 6 percent of the total inland transport volume, 4.8 percentage points of which are on the Rhine alone, the share is considerably higher for certain types of goods, namely 28 percent for raw materials like coal, crude oil, petroleum, natural gas, and 21 percent for derivatives like coke, petroleum products (Ademmer et al., 2018). The Kiel Institute for the World Economy concludes: “These goods tend to be at the beginning of many production chains, so transport-related failures could lead to production disruptions in downstream production stages” (Ademmer et al., 2018; 15).3
The shallowest and most critical points of the Rhine River are near gauging station Kaub. All shipments from the ARA4 seaports and the Nether and Middle Rhine ports to the Upper Rhine region—and vice versa—must pass Kaub. This includes a good part of the industrial production of the metropolitan region of Mannheim and the raw materials and derivatives needed for it.
But the Rhine River is not just used as transport infrastructure, it also provides water for many purposes, including cooling water for the industry, process water for the production industry, and water for firefighting. Low waters of the Rhine may lead to restrictions of water intake.
3.1.2. Current understanding of the national situation regarding drought and low waters and recent forecasts
The year 2018 brought several weather extremes to Germany, which influenced the choice of the hazards to be analyzed in our case study. By then it was the warmest recorded year since 1881, the sunniest year since the recording started in 1951, and it was too dry for 10 months in a row (from February through November)5, resulting in an agricultural drought in most parts of the country.6 The most recent comprehensive assessment of the situation in Germany with respect to drought, low water, and ground water recharge is provided in Umweltbundesamt (2021). The authors state that the accumulation of agricultural droughts that hit six European countries between 2014 and 2018 has not occurred in Central Europe for 250 years.
In Germany, the agricultural drought returned in 2019 and in 2020. Today, in August 2022, the soil in entire Germany is too dry again. Adaptation measures are already being taken, both in enterprises—including infrastructure operators—and in politics. Enterprises, for example, improve their business continuity management and health protection of workers, secure their water supply, and use renewable energy, as well as improved and intelligent logistics.
The year 2018 also brought an extremely long period–132 days—of extreme low waters of the Rhine River (hydrological drought), leading to significantly reduced freight transport volumes on Europe's most important inland waterway. In August 2022, the water levels of the Rhine dropped again to extremely low values (Bloomberg, 2022).
Regarding adaptation on the national level, the German Federal Ministry of Transport and Digital Infrastructure (BMVI) has issued an eight-point action plan “Low Water Rhine” (BMVI, 2019) for securing the freight transport on the Rhine River. A German specialty is the fact that the national government has included German national climate Impact Chains (Umweltbundesamt, 2016, 2019a) in the German Adaptation Strategy, structured into twelve national fields of action. The progress of implementing the national adaptation strategy is monitored on an annual basis and published in annual monitoring reports (Umweltbundesamt, 2019b).
3.1.3. Situation in the metropolitan region of Mannheim
The metropolitan region around Mannheim, the Rhein-Neckar region, is an agglomeration of three large cities—Mannheim, Ludwigshafen, and Heidelberg—five smaller cities and seven counties across three German federal states: Baden-Wuerttemberg, Rhineland-Palatinate, and Hesse. Since 2005, the region is a “European metropolitan region.” About 2.4 million citizens live within this seventh largest industrial region of Germany.
The regional climate is warmer than the German average. The years 2018, 2019, and 2020 belong to the warmest years in the region since recording started in 1881 (KLIWA, 2021). For Mannheim, the recent city climate analysis (Stadt Mannheim, 2021) stated that the average temperature for the period 1990–2019 was 2°C above the average temperature for the period 1881–1910.
The recent second climate monitoring report of Baden-Wuerttemberg (KLIWA, 2021) also contains an assessment of past fluvial hydrological discharges in the federal state. Discharge patterns and quantities are regionally quite different and depend on many factors, like the number of gauging stations and the quality of data delivered by these stations. Nevertheless, the report concludes that for the hydrological water management summer semester (the months May–October), the number of gauging stations with significantly decreasing discharge trends rises clearly (KLIWA, 2021, p. 55).
Mannheim with its 300,000 citizens belongs to the most advanced cities in Germany regarding climate protection and adaptation. In 2017, the City of Mannheim signed the climate protection pact of the State of Baden-Württemberg and thereby committed to strong climate protection activities. The city has a municipal climate protection office responsible for the city-wide coordination and implementation of climate protection projects and is committed to bringing the climate protection strategy of the city “Mannheim on climate course”7 into action.
For conducting the case study, we collaborated with a diverse group of stakeholders that were relevant for and interested in the case study: the state-owned Rhein-Neckar Port Authority that operates the inland ports at the Rhine and Neckar confluence in Mannheim; the City of Mannheim's municipal departments Climate Protection Office, Economic and Structural Development, Urban Development, Public Health Office, and Professional Firefighters; the logistics company Contargo; the sanitary paper production company essity; the Mannheim Large Powerplant; and experts from the German Federal Institute of Hydrology (BfG).
3.2. Case study process
The case study started with two preparatory phases to collect relevant information on the climatic and economic situation in Mannheim (desktop research), as well as establishing initial stakeholder commitment (in individual meetings with stakeholders). A summary of the desktop research results can be found in the previous section and the Appendix “Case study background.” A kick-off meeting with all involved stakeholders was then used to define the scope of the CRVA, establish a common understanding on the terms of collaboration, and clarify expectations from stakeholders and researchers. Afterwards, a first “test run” for the participative, IC-based CRVA (Rome et al., 2017; Hagenlocher et al., 2018) was conducted with a limited number of stakeholders from the Municipality of Mannheim. Here, the CRVA process was conducted partially to co-produce a qualitative IC that models the risk of extended heatwaves for vulnerable population groups in Mannheim (IC 1) and showcase how to use the German national ICs as a foundation for the IC development. Based on the experiences of this “test run”, the main IC-based CRVA (IC 2) to examine the risk on prolonged periods of low water of the Rhine River was conducted. To be able to keep the focus of the activities and to keep participation time and workshop times to a tolerable limit, not all stakeholders were included in all activities. Table 1 provides an overview of the whole case study process in a chronological order and lists the applied methods, the participants, taken actions and outcomes, respectively. As the main innovation—the development of the IC-based value chain CRVA—took place during the second half of the case study process (creation of IC 2 and beyond), the following sections focus in detail on this part of the case study.
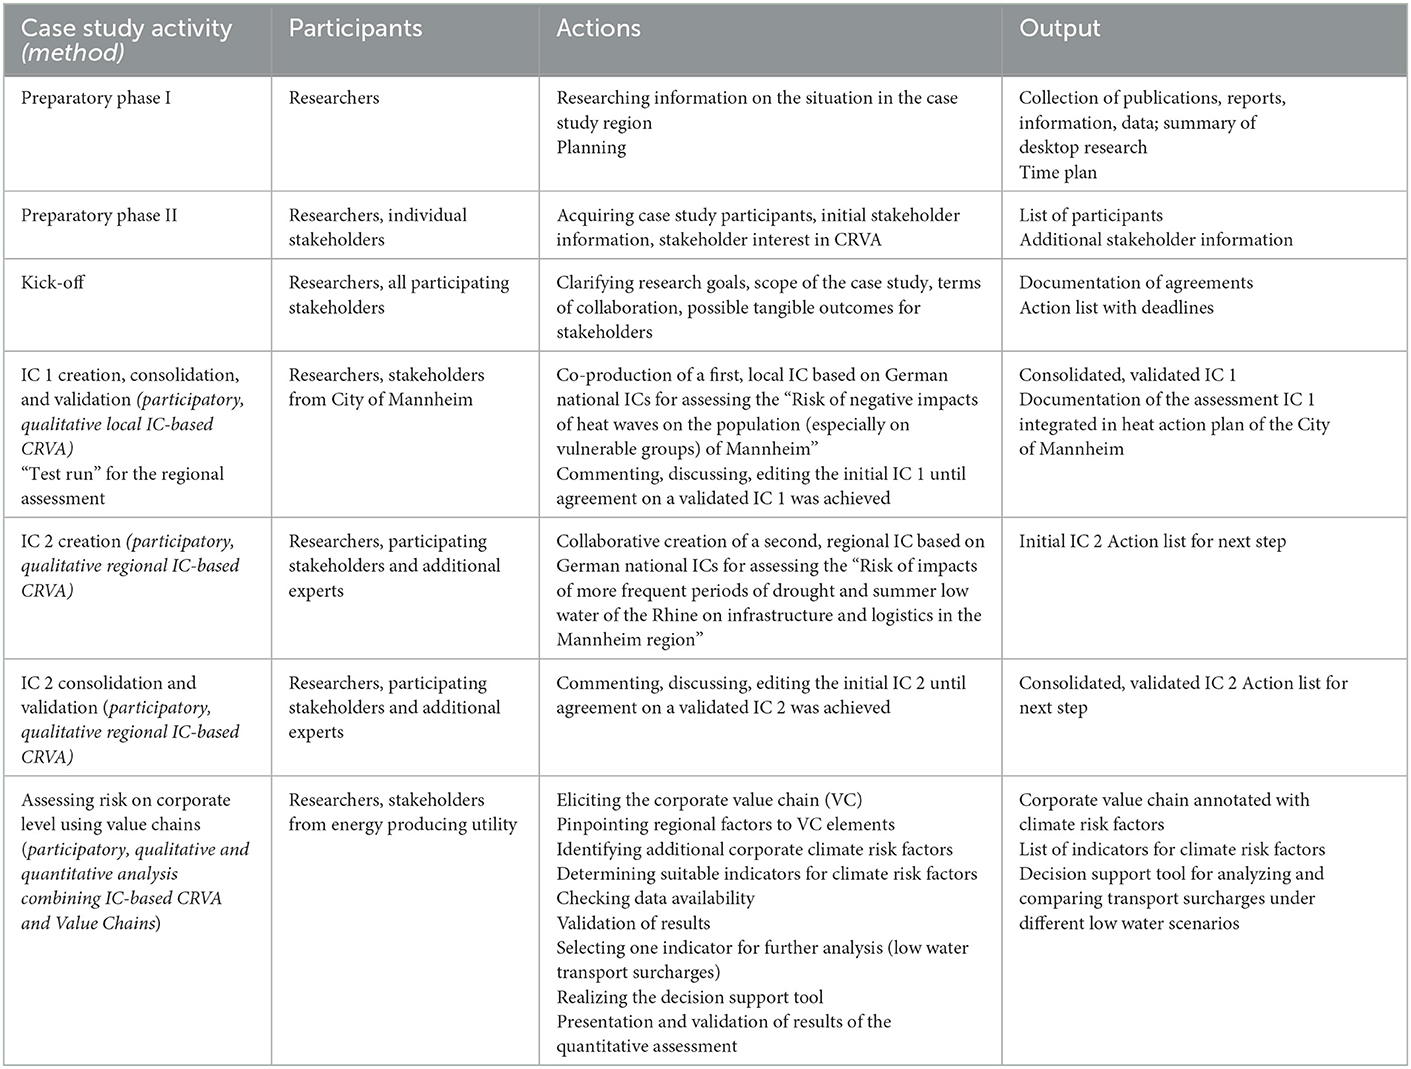
Table 1. Overview of the case study activities (optional: methods), participants, actions, and results.
3.3. Case study methods
3.3.1. Impact chain co-production with stakeholders of the metropolitan region of Mannheim
For the regional climate risk assessment, we co-developed an Impact Chain with the full group of regional stakeholders. In addition, a researcher from the Institut National des Sciences Appliquées de Strasbourg, an UNCHAIN research partner, was also involved. This Impact Chain covered the risk of “Negative impacts of extended periods of drought and low waters of the Rhine River on infrastructure, logistics and population in the metropolitan region of Mannheim.”
Prior to working together with the experts and local stakeholders, we prepared an initial Impact Chain for the workshop. This version contained extracted information from different climate Impact Chains of the German Environment Agency (Umweltbundesamt, 2016, 2019b) and was visualized—without causal connections—in a miro8-board and corresponding to the Impact Chain layout from the Vulnerability Sourcebook (Fritzsche et al., 2014). In this version, we already clustered consequences, sensitivities and capacities based on the “fields of action” of the German Adaptation Strategy (Bundesregierung, 2008) and added some questions and comments to guide the workshop (e.g., reference to further fields of action).
In a joint workshop (lasting approximately 4 h) with the above-mentioned stakeholders from Mannheim and the UNCHAIN project, the initial Impact Chain was systematically expanded. First, the Impact Chain method was explained before individual participants explained the relevant impacts of dry periods and summer low water on their companies and specialist areas based on their experience. Based on this exchange, the individual sections of the Impact Chain were further filled-in during a moderated working session. The workshop concluded with collecting sensitivities and capacities. This approach encouraged the participants to discuss with each other their individual or sector perspectives on and approaches to risk and adaptation, leading to mutual awareness of which adaptation measures are necessary for whom or are already in use.
In a next step, we analyzed the collected information and developed proposals for restructuring, simplification, and causal connections. This version was provided to the participants and their feedback was implemented. The process of finalizing the Impact Chain in feedback loops with the stakeholders until their consistent final approval for correctness and completeness—according to their points of views, respectively—leads to a validation of an Impact Chain. This has been implemented as an iterative process, starting with discussing and modifying the “raw” initial Impact Chain that resulted from the co-production workshop. The comments and replies of the participants regarding the elements of the IC and their relations have been documented. These minutes and the modified IC have been distributed to the participants for the next round of discussions. This process has been repeated until a final outcome has been agreed. The minutes and the intermediate versions are kept as documentation, including all arguments, such that the evolution of the IC can be understood even by persons who were not involved in the process. The result of this qualitative IC-based CRVA, a validated Impact Chain, is explained in the “Results” section of this article.
3.3.2. CRVA on corporate level using value chains
For preparing a more in-depth, quantitative CRVA on corporate level, we designed the assessment of the climate change risk for value chains of a company as a multi-step process. This procedure requires a regional or corporate Impact Chain as input and is based on methods of economics for the analysis of dependency chains.
3.3.2.1. Methods of economics for the analysis of dependency chains
In economics, methods for analyzing commodity chains, supply chains, and value chains have been developed for specific analytical purposes. Since these terms are often confused, we have depicted the ranges of and relations between these related concepts in Figure 2. Global commodity chain analysis methods shall yield insights in the organizational structure and dynamic processes of the globalized economy (Hopkins and Wallerstein, 1977; Wallerstein and Hopkins, 1993; Bockel and Tallec, 2005). On corporate scale, supply chain analysis is aimed at optimization in delivering a product or service, like minimizing costs, maximizing customer value, or strategic planning, and it informs supply chain management. Subjects of the analysis can be the entire supply chain or its manufacturing, service, or distribution parts (distribution chains). Value chain analysis (Porter, 1985, 1991) is aimed at identifying which elements of corporate business contribute to what extent to the corporate margin, for the purposes of raising the margin or getting advantage over competitors.
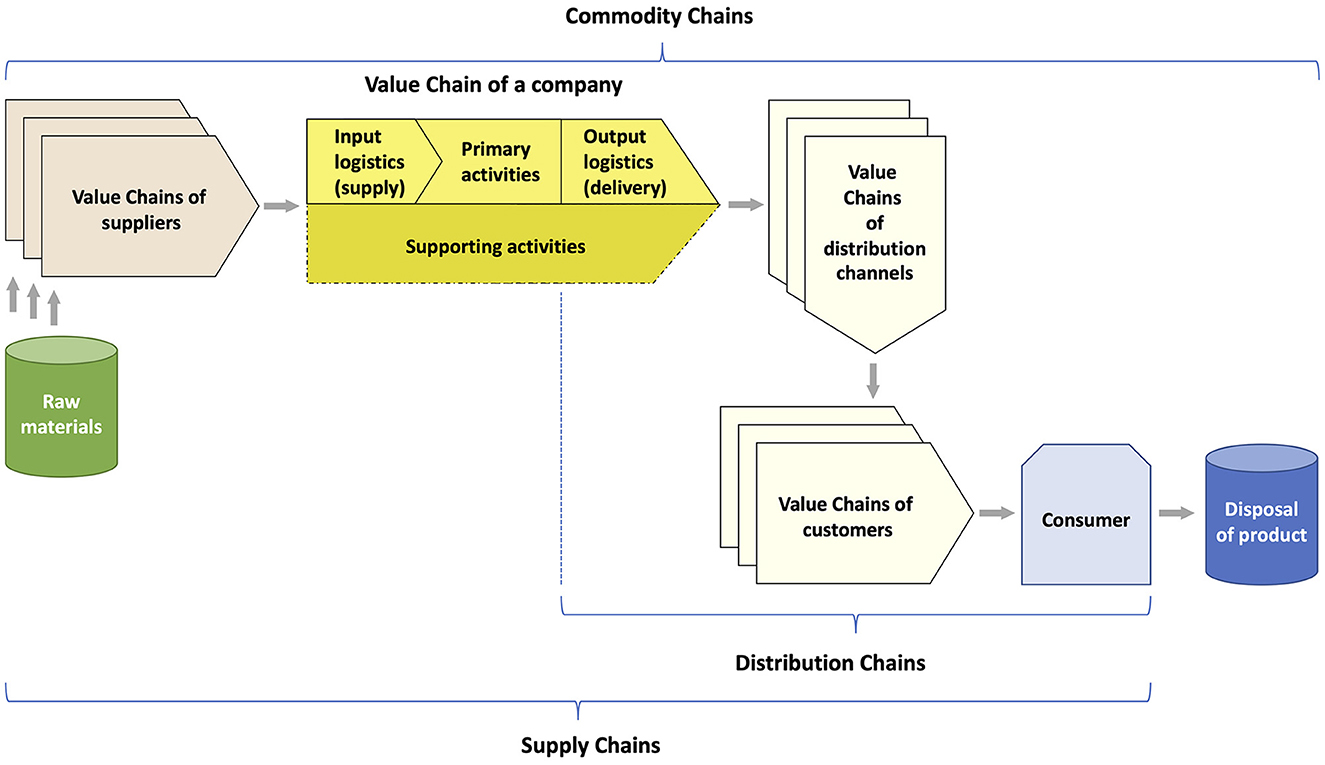
Figure 2. Ranges of and relations between commodity chains, supply chains, distribution chains, and value chains.
The international Association for Supply Chain Management promotes the supply chain operations reference (SCOR9) model as a standard method for supply chain analysis. Since its introduction in 1997, the process oriented SCOR model has been improved and extended. SCOR can now also be used for supporting supply chain risk management (Wilkerson, 2011; Rotaru et al., 2014), a subtask of supply chain management that has become increasingly important (Wieland and Wallenburg, 2012). A prerequisite is that an overall corporate risk management is already in place.
American economist Michael E. Porter developed the concept of the value chain and introduced it in Porter (1985). Porter looks not just at business processes. He starts by roughly dividing a company's activities into primary and supporting activities. Value chain diagrams describe these company activities in graphical form (Figure 3). The task of value chain analysis is to get a clear picture which business activities and which units contribute to which extent to the business margin. The further division of a company's activities into areas and intertwining processes that take place in and across these areas offers various opportunities for analysis and optimization.
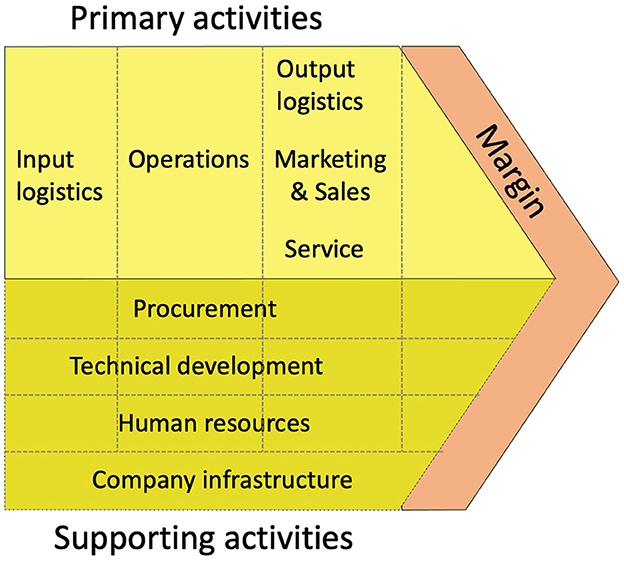
Figure 3. Value chain of a company [after (Porter, 1991)]; light yellow, upper half: primary company activities; dark yellow, lower half: supporting company activities; orange, leading chevron shape: company margin.
This type of modeling is also suited for informing risk management but can yield different or additional information compared to supply chain analysis. Also, value chain analysis helps identifying the “business fence lines”, that is, which business activities and processes are fully internal, and which require external interaction, like input logistics, product delivery, and customer service. For managing risk, including climate risk, this modeling approach allows pinpointing risk factors to business processes, activities, and units, and, furthermore, could hint at which risk factors are within the business fence lines, and which go beyond them.
A fundamental prerequisite for being able to carry out such analyses at all is an in-depth understanding of the company's activities. For eliciting a corporate value chain, one must acquire knowledge from company experts on how their company operates. This can be done by means of interviews or by facilitated participative workshops with company experts.
3.3.2.2. The process of creating a value chain CRVA
The individual steps of the proposed procedure for eliciting a corporate value chain are adapted to the individual needs and the existing information and data situation of the company to achieve a result that is useful for the corporate stakeholders. Whenever possible, the process should build on existing results and information. In the final fifth step, the risk analysis is validated, and exemplary adaptation measures are derived. Figure 4 shows an overview of the individual steps of the proposed procedure.
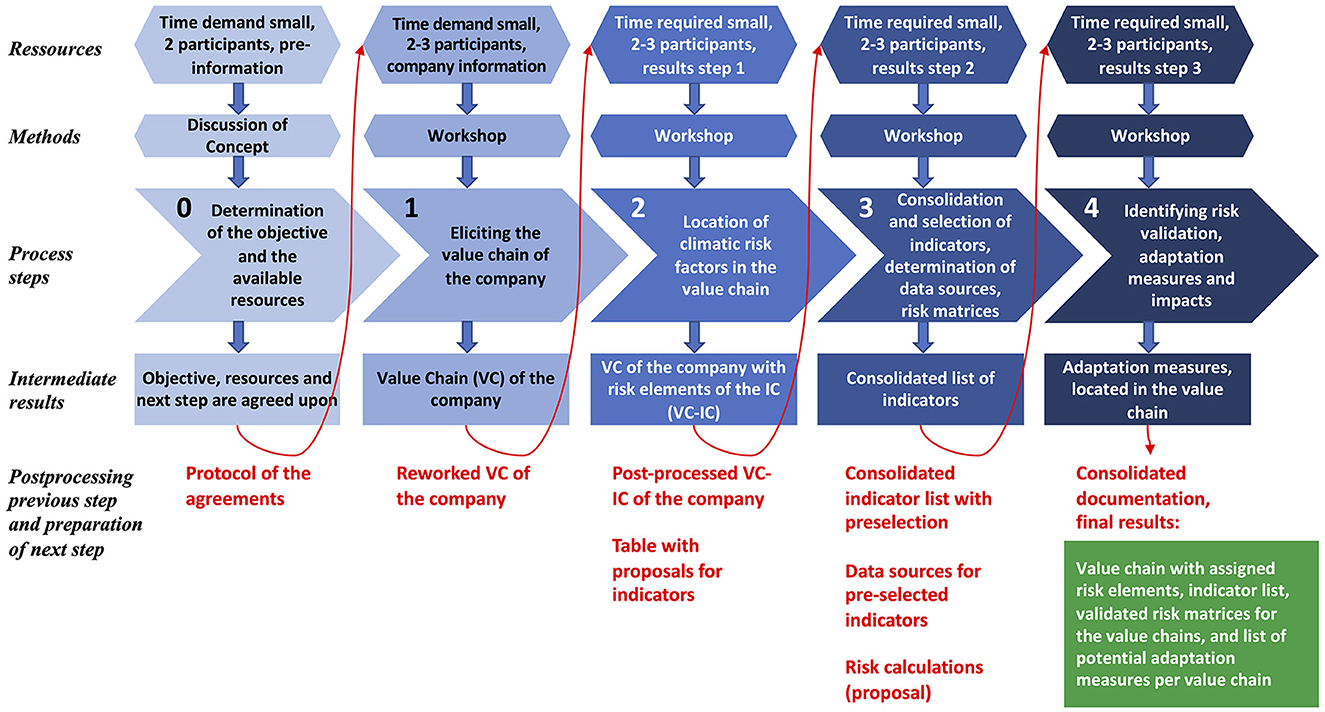
Figure 4. Procedures for the elicitation of a value chain, for pinpointing risk factors therein, for risk quantification and validation, and for the planning of adaptation measures.
The development of all results takes place in cooperation between researchers and representatives of the company by means of discussions, information exchange via e-mail, and through workshops. In total, a maximum of four half-day workshops can be expected, in addition to a preliminary discussion of up to 90 min duration and possible further short periods of time for validation of the results. The participants from the company are ideally one or two main contact persons and, if necessary, experts on specific company areas (depending on the planned scope of the in-depth risk analysis). The steps of the process are briefly explained below.
Step 0: Determination of the objective and the available (personnel) resources
Together with the users, the goal of the risk analysis is specified in more detail: How detailed should the risk analysis be? Which company departments or persons should be involved? What information is available (organizational charts, process manuals, annual business reports, etc.)? What do confidentiality agreements look like? When should the next step be taken? The agreements are recorded in a results protocol.
Step 1: Elicitation of a company's value chain
If a documentation of a corporate value chain does not exist, it needs to be elicited. In our case study, researchers and stakeholders have performed this elicitation jointly. The level of detail can vary depending on the objectives and available time/personnel resources. At a minimum, the different company divisions involved in the value creation (like purchasing/procurement, sales, production, etc.) and their activities and core processes should be included. Preliminary information, e.g., organizational charts or descriptions of the structural and process organization, can be used for preparation. Areas of the value chain that are particularly interesting and/or affected by climate change can then be broken down in more detail, if necessary. The intermediate result of this step is the value chain of the company in diagram form (Figure 5). Afterwards, the terminology can be harmonized, and the presentation can be made more precise, which is then validated by the participants before the next step.
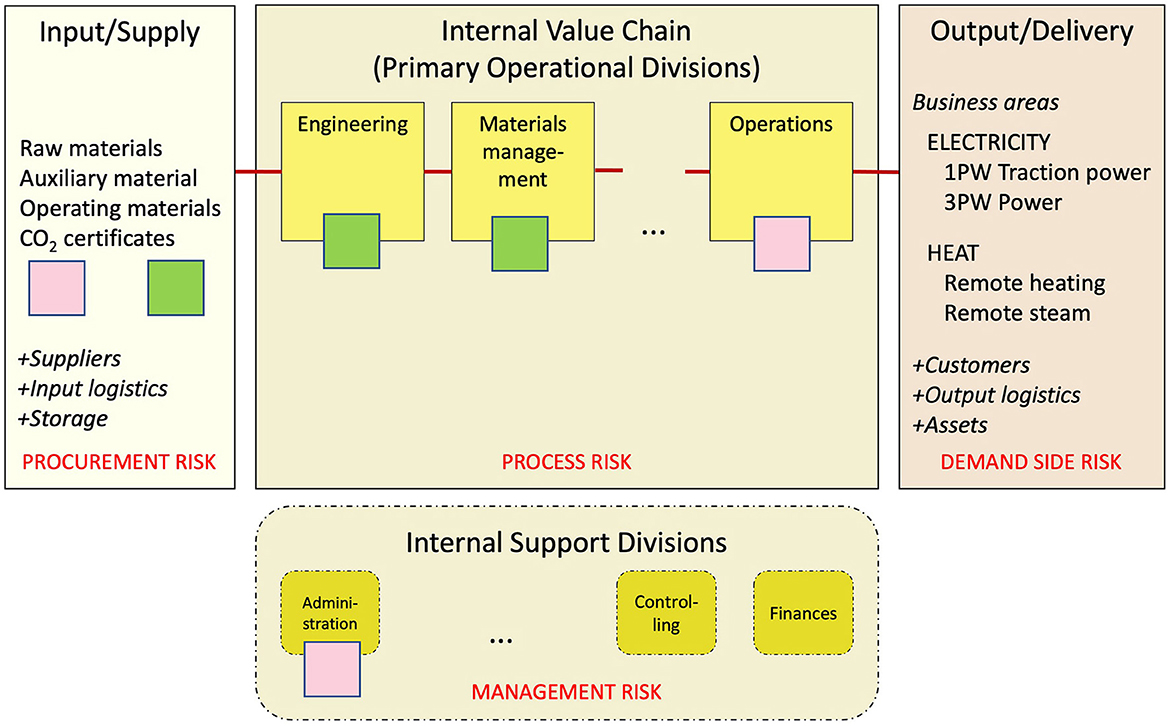
Figure 5. Scheme of the corporate value chain enriched with risk factors. For each group of units, activities, and processes, a group of associated risk factors is designated. Each such element of the value chain may have any number of assigned capacities (green squares) and sensitivities (pink squares). The full enriched value chain created in the case study is confidential.
An initial catalog of questions on the following four topics is prepared for eliciting of the corporate value chain. Here, we provide the catalog used in our case study as an example.
• Organization, products, and customers of the company.
° Definition of the most important products (output) and raw materials and supplies (input): Are our stated inputs and outputs correct, or is there a need for change?
° Definition of business areas: What are the main business areas?
° Who are the customers? Is the list complete?
° How does the regulation of the power grids affect the business?
° Who imports/exports the electricity?
• Value chains of the company (if already elicited).
° Which business units are involved in the production of the different products and how? (per business unit/product)
° Example question: “Which company areas are involved in the generation of traction current—from purchasing to generation?”
° What is the process/sequence from purchasing to production? (per business unit/product).
• Core processes and value creation processes of the company.
° Consideration of the most important processes per value creation step/company area: Please explain roughly what exactly happens in the value creation step.
° Are there any relevant external factors that need to be considered for value creation?
° If applicable, if time available: Identify key interrelationships between the main processes of the value-adding steps.
• Check for completeness.
° Relation between process steps, externals factors, and maybe more.
The elicitation approach should lead from the organization to individual processes, roughly in the following order:
1) Building understanding of the business and the organization.
2) Identification of organizational units relevant for value creation and their sequence (per product).
3) Identification of process steps within organizational units and their sequence (per product).
4) Understanding of the company's resilience mechanisms (e.g., business continuity management and IT security).
5) Other interrelationships and relevant external business factors (e.g., market and market mechanisms).
6) Categorization according to core processes, support processes, and management processes.
Intended outcomes of the elicitation include:
• List/mapping of organizational units relevant for value creation and their interrelationships (per product).
• List/mapping of process steps within individual organizational units (per product).
• External factors relevant for the business
• Visualization of the value chain (see Figure 5).
• Subdivision into core processes, support processes, and management processes.
Step 2: Pinpointing the climatic risk factors in the value chain
Based on the post-processed value chain and the pre-defined risk to be investigated, the researchers and stakeholders jointly record the potential climate change-related impacts on individual areas and process steps of the value chain (e.g., delivery delays or failures, increased production costs, necessary changes in regular transport modes) as well as the relevant associated risk factors. The intermediate result of this step is the value chain with the relevant risk elements from the climate Impact Chain assigned to the business units, activities, and process steps (see Figure 5). If a climate Impact Chain already exists, its risk elements (hazards, sensitivities, capacities, and impacts) can be assigned to the value chain and, if necessary, further specified.
In our case study, the joint researcher and stakeholder team transferred relevant risk factor from the second regional Impact Chain (“drought and low water risk”) to appropriate elements in the value chain. Subsequently, the stakeholders named additional company-specific risk factors that were also pinpointed to elements of the value chain. Figure 5 shows the graphical scheme of the enriched value chain. As before, harmonization and clarifications that still need to be validated can be made subsequently.
Step 3: Consolidation and selection of indicators, determination of data sources, assessing risk quantitatively
In this step, the risk is assessed and visualized along the value chain. If sufficient data is available, a quantitative risk assessment can be made; otherwise, a semi-quantitative risk assessment can be made using expert estimates. Even with good availability of company data, it is possible that indicator data cannot be provided in nominal form due to confidentiality. In such cases (partial), anonymization techniques can be applied, such as conversion to percentage values or reporting additional costs instead of total costs.
In our case study, the joint team proposed indicators for each linkage of risk element/process step/element of the value chain. The result is a table containing potential indicators per combination of risk area, element of the value chain (business unit), process step in that element, and risk factor (like impact, capacity, and sensitivity). For each potential indicator, its dimension and data availability are entered. Table 2 shows an excerpt of the table generated in our case study.
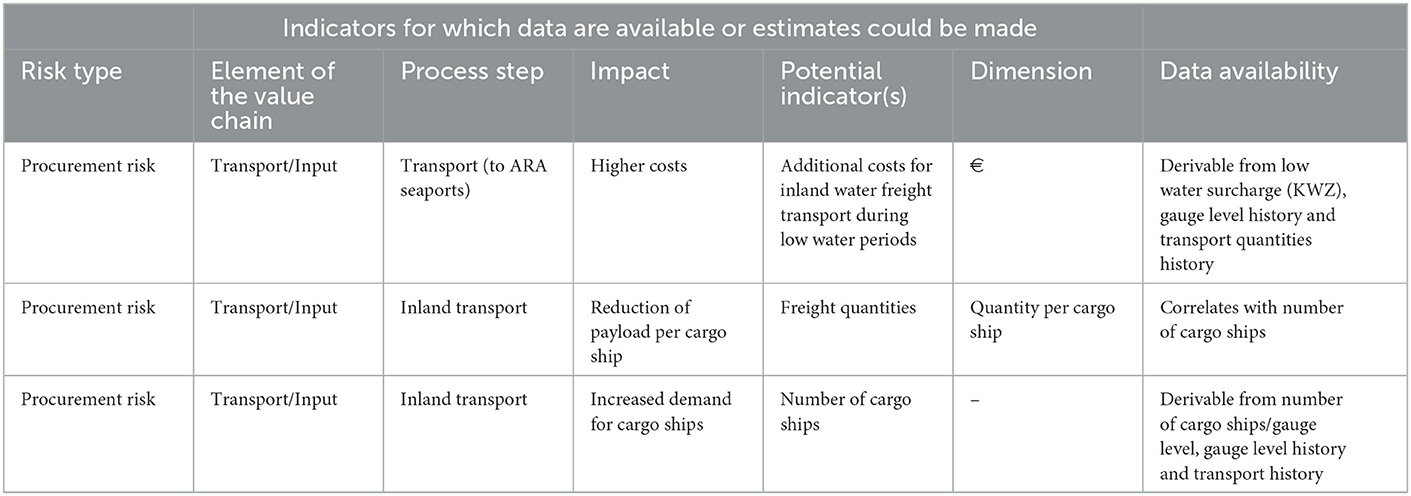
Table 2. List of potential indicators for corporate climate risk (excerpt for risk factor “impact”).
Step 4: Identification of potential adaptation measures and their impacts
Based on the calculated risk, a check is made for the most severely affected areas and process steps in the value chain to determine whether and, if so, which adaptation measures are required. To do this, it is first necessary to identify the resilience mechanisms already in place, which are components of business continuity management, or which result from external market mechanisms. Then, the effects of the adaptation measures are determined, both direct effects on the value chain (e.g., changes in process flow) and indirect effects (e.g., increased production costs).
4. Case study results
Using the process described in the previous section, three major results were produced that jointly present the research innovations achieved within our case study. These results are:
• A co-produced Impact Chain for the risk of “Negative impacts of extended periods of drought and low waters of the Rhine River on infrastructure, logistics and population in the metropolitan region of Mannheim” that employs an adapted visualization scheme compared to the original Vulnerability Sourcebook method;
• A corporate value chain for the Mannheim Large Powerplant, enriched with risk elements from the co-produced Impact Chain, allowing qualitative risk assessments of the value chain; and
• An Excel-based risk analysis tool to estimate risks of “Additional costs for inland water freight transport during low water periods.”
These results are described in detail in the next sections.
4.1. Impact chain co-produced with stakeholders of the metropolitan region of Mannheim
The validated regional Impact Chain is shown in Figure 6. The layout of the resulting final Impact Chain is an adaptation of the original Impact Chain layout as introduced in the Vulnerability Sourcebook: As the stakeholders involved in the risk analysis work with distinct, but potentially related sets of exposed elements (e.g., harbor infrastructure, container ships, and electricity production), we grouped impacts, sensitivities, capacities, and exposed elements in the Impact Chain into different “impact fields”, based on the fields of action of the German Adaptation Strategy (e.g., logistics, traffic infrastructure, industry & trade, energy industry, water balance and water management, ecology/hygiene, and tourism and leisure industry). These impact fields are included in the Impact Chain as gray, transparent, labeled rounded rectangles into which all other Impact Chain elements, except hazards, were placed. Impact fields can overlap, if they have impacts, sensitivities, capacities, or exposed elements in common, and they can also be nested, if it is necessary to distinguish between different sub-groups of impacts (e.g., changes to the ecosystem are defined as a sub-group of the impact field ecology/hygiene). In total, the Impact Chain contains 50 direct physical and intermediate impacts. For instance, a long duration of extreme heat could increase water temperature in the river (direct physical impact), leading to a sequence of intermediate impacts: increased temperature of cooling water taken from the river, impaired use of cooling water, cooling water shortage for thermal plant, service interruption, reduced turnover.
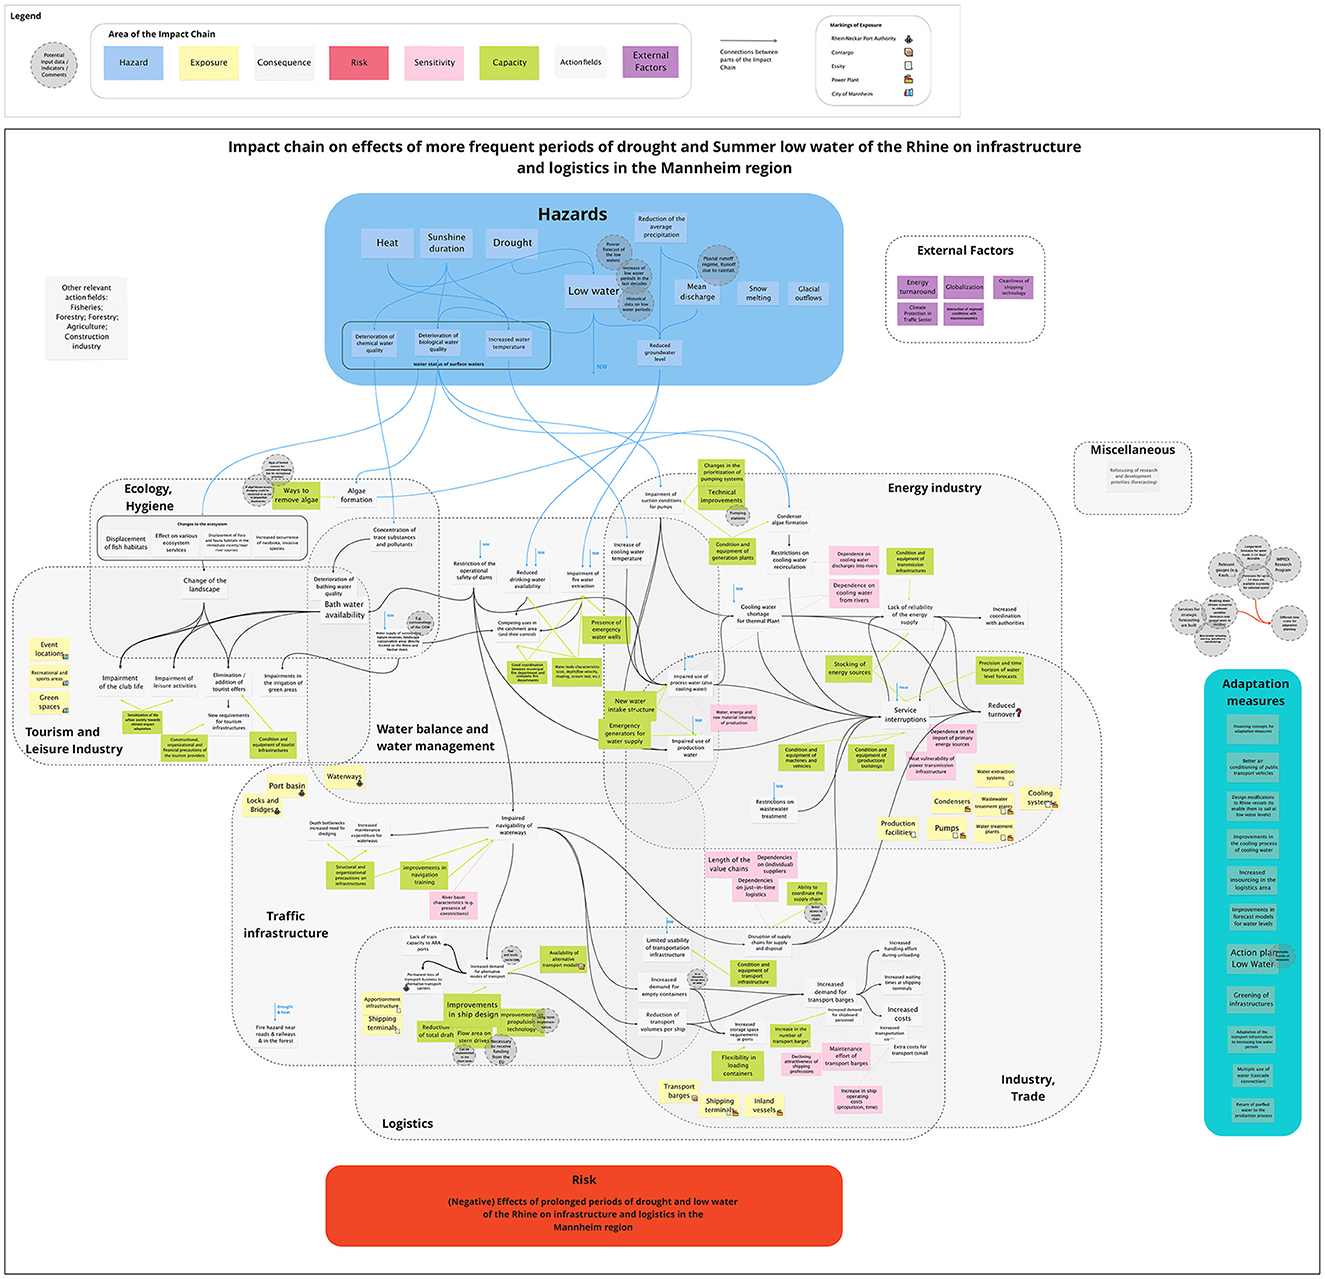
Figure 6. Impact Chain depicting the results of the qualitative assessment of the risk of “negative impacts of extended periods of drought and low waters of the Rhine River on infrastructure, logistics and population in the metropolitan region of Mannheim.”
Clustering impacts, exposed elements, sensitivities, and capacities within impact fields allows to show interdependencies and potential cascading effects between businesses and impact fields. In addition, it allows to identify joint adaptation measures and measures of one stakeholder that support another stakeholder, which can in turn allow to identify adaptation measures early in a dependency chain that help to reduce cascading effects for following businesses. This latter approach allows to make adaptation efforts of different business partners transparent and allows to facilitate a joint discussion, e.g., on distributing adaptation costs fairly across the dependency chain.
The Impact Chain also contains a stack of adaptation measures—right side of Figure 6—that were mentioned during the workshops or during the validation process, and circular dark gray labels containing comments or hints to potential data sources. A legend is contained in the top row of Figure 6. Also included, but omitted here for space limitations, we provided IPCC definitions of the risk factors.
4.2. Quantitative risk assessment using combined impact chains and value chains of individual businesses
For performing a quantitative risk assessment based on results of the qualitative regional assessment, we collaborated with the Mannheim Large Powerplant that operates several fossil-thermal units. We started with applying the method described in section “CRVA on corporate level using Value Chains.” Here, we provide some additional information on the actual application of the method.
During step 1, we separated the value chain of the company into four sections: (1) input/supply (i.e., all units, activities, and process steps related to suppliers, input logistics, and inbound storage); (2) internal value chain (i.e., all units, activities, and process steps related to the internal value production); (3) internal support divisions (i.e., all supporting units, activities, and process steps that are relevant to enable the actual value production, but do not contribute directly to it); and (4) output/delivery (i.e., all units, activities, and process steps related to customers, output logistics, and assets). After this separation, the different business units, their relevant process steps, and the relations between the different business steps are identified (e.g., via organigrams or business process documentation). Lastly, the value chain sections, business units, and activities are visualized in diagrammatic form, similar to Impact Chains, with the input section either at the top or on the left, the internal value chain in the middle, the internal support division beside the internal value chain, and the output section at the bottom or on the right (see Figure 5).
Step 2: Once this value chain model was created, we pinpointed the risk factors—impacts, sensitivities, and capacities—from the regional Impact Chain within the corporate value chain model, by trying to place them beside the operational processes, which constitute the exposed elements of the combined Impact/value chain. If risk factors cannot be related to individual process steps, it is also possible to locate them at the level of business units. The actual value chain diagram produced cannot be shown here for reasons of confidentiality. In the discussion part of this paper, we will point to the ethical dimension of assessing vulnerabilities of Critical Infrastructure. Also, we will explain why we believe that omitting the full risk-enhanced value chain does not impair the reproducibility of our approach.
Pinpointing Impact Chain elements within the value chain of a business allows to identify potential cascading effects that might otherwise be missed. In addition, this approach allows to locate potential adaptation measures within different business units or even process steps.
Step 3: For identifying indicators, the risk factors pinpointed in the validated combined Impact and value chain are transferred to tabular form. For each risk factor, the table specifies the risk type (as shown in Figure 5), the element of the value chain, and the (operational) process step. The potential indicator (or indicators) is (are) entered: designation or description, dimension (the indicator must be measurable), and known data availability. Table 2 shows an excerpt of the working table that was co-produced.
Due to resource limitations—explained in the Section “Discussion,” we agreed with the stakeholders to perform an exemplary quantitative assessment using only one of the indicators. The stakeholders proposed to use the indicator “Additional costs for inland water freight transport during low water periods”, abbreviated to “low water transportation surcharges.” The next section describes in detail how we proceeded for concluding step 3 of the method.
4.3. Risk assessment tool for a power production company
We adopted a risk matrix approach to visualize the outcomes of the quantitative risk assessment. The method is standardized10 and is employed for civil protection (BBK, 2011) and in many other areas. Using this method had the additional advantage of familiarity, since the Mannheim Large Powerplant also uses a risk matrix approach for other operational aspects. The risk matrix is a tabular representation of risk and relates the magnitude of impact or damage caused by a hazard to the likelihood or probability of the hazard's occurrence. The user then must decide which combinations of impact and likelihood, for instance, are acceptable, require staying alert, or require immediate action. Such decisions may be political ones, as in the case of civil protection, or based on business continuity or corporate risk management policies.
For our case study, we selected the low water transportation surcharge as an indicator for further assessment. The estimated additional transportation costs under a given scenario are categorized in six different impact levels, while the likelihood is based on the frequency of the water level at the gauging level at station Kaub ranging within a specific interval that is relevant for any of five different transport surcharge ranges. The combination of impact and likelihood (see Figure 7) then constitutes the basis for the stakeholders' risk classification.
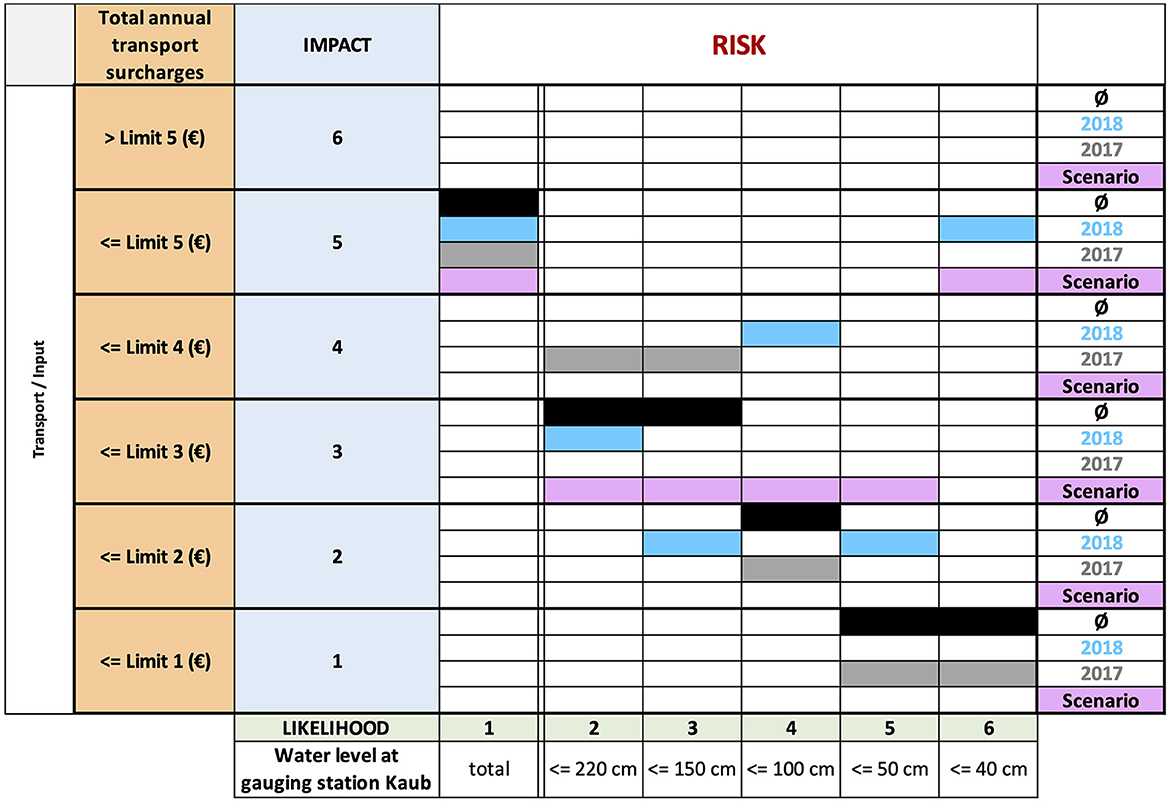
Figure 7. Risk matrix for transport surcharges per low water days in water level interval, i.e., likelihood based on frequency, and annual surcharges (impact). The colored matrix cells indicate the magnitude of the surcharge total per water level interval wlij, j∈{2,…,6}, (“likelihood” class) for each of the 4 years (historic average year Ø, 2017, 2018, and a fictive “Scenario” year). The additional column for “likelihood” class 1 is not related to a specific water level interval but indicates the total impacts for each of the four scenarios.
Waterway transport surcharges grow exponentially with decreasing water levels. Certain water levels mark critical surcharge amounts: 220 cm (first significant rise), 150, 100, 50, and 40 cm (highest cost, several times as high as normally). These water level (wl) values delimit surcharge relevant intervals wli2,…, wli6 (in list order):
For determining likelihoods, we used water level data from gauging station Kaub11 for the 120-year spanning period 1900–2020. We first calculated the number of days per year in which the daily mean gauging level at Kaub falls within the surcharge relevant water level intervals. Based on these values, we then created a reference scenario by calculating the 120-year average number of days in each of the five intervals and then we calculated the fictive expected surcharge for an “average year” (based on current surcharge rates) against which historical or fictive low water scenarios can be compared.
To determine the impact classes, we calculated the average transportation amount of coal—in tons—using the monthly transportation values for 2017 and 2018 provided by Mannheim Large Powerplant as reference. For these years, we estimated the additional transportation costs—the surcharge—using the number of days the gauging levels at station Kaub fell within a specific surcharge interval, i.e.,
, where:
Ij denotes the impact contribution of surcharge interval j, j∈{2, …, 6}, i.e., the total annual transport surcharge in euros for water level interval wlij, j∈{2, …, 6},
adtq denotes the average daily coal transport quantity in tons,
dwlj denotes the number of days per year in which the water level at gauging station Kaub was in water level interval wlij, j∈{2, …, 6}, and
sj denotes the surcharge costs per ton associated with water level interval wlij, j∈{2, …, 6}.
The total impact sums up the total annual transport surcharge.
Based on these calculated values, we introduced an initial impact classification Ck, k∈{1, …, 6} using five empirically determined surcharge values, Limit1, …, Limit5. The impact Ij, j∈{1, …, 6} belongs to impact class Ck where:
These five thresholds are determined by stakeholders' risk management. For completing a standard risk matrix, the stakeholders also must assign risk categories—typically three to five—to each of the 30 possible combinations of impact and likelihood. These risk categories may indicate the type of action that is required to compensate the surcharge costs, like switching to cheaper transport modalities or saving money in other business areas.
Since fluvial water levels are highly volatile and low water days do not follow regular patterns, we proposed using the risk matrix representation for creating a decision support tool that helps comparing impacts (transport surcharges) and frequencies of low water days for a few scenarios.
Using the impact and likelihood classification, we designed a matrix with the likelihood classes on the x axis and the impact classes on the y axis. At each intersection of a likelihood class with an impact class, this matrix contains four cells, each representing additional transportation costs:
1) for the reference scenario year calculated based on the 120-year averages,
2) for the historical values of 2017,
3) for the historical values of 2018, and
4) for a user-defined fictive scenario year. In addition, the matrix contains one column that calculates (and categorizes as impact) the sum of all additional transportation costs under a given scenario. The scheme of the resulting matrix is shown in Figure 7.
The resulting tool allows entering all relevant data: distribution of low water days in the cost-relevant intervals, transport surcharge per such interval, and annual volume of fuel shipped via inland water transport. The scenario allows assessing the consequences of more frequent and severe low water situations and may aid decision-making. That is, the stakeholder may now answer questions like:
• “How did last year compare to an average year in terms of distribution of low water days and resulting surcharges?”
• “How would a year with even more extreme low water levels than 2018 compare to 2018 and to the average year?”
• “What total transport surcharges could we expect for three extreme years in a row?”
The four examples displayed in Figure 7 show that for all four scenarios, the distributions and amounts of surcharge costs can be vastly different. Combined with improved water level forecast methods, the tool may support early preparedness for low water situations, optimizing transport modes and minimizing costs.
4.4. Narratives—providing additional information for the risk analysis
To combine the information from the Impact Chains, value chains, and risk analysis with relevant additional information, we produced an eight-page dossier “Evaluation of the Reports and Analyses on Economic Damage Caused by Summer Low Water in the Rhine”. This dossier gathers information on the investigated risk, its impacts, adaptation measures (implemented, on-going, and planned), and policies (political and industrial). It has been produced by research in the scoping phase, by gathering stakeholder information during the co-production workshops, and by parallel research updates. A good part of this information has been covered in the section “Case study background” and in the annex of this paper. Here, we focus on adaptation measures to mitigate negative impacts of low water periods of the Rhine River.
One of the points in the BMVI's action plan “Low Water Rhine” (BMVI, 2019) has recently been implemented, namely an improved forecast of low water levels. In July 2022, the Federal Institute of Hydrology (BfG) has deployed a 6-weeks forecast for several gauging stations to users—typically logistics companies and industries along the Rhine. Before July, the forecast was limited to 10 days. Another important action point, the “off-loading optimization of the navigation channels on the Middle Rhine,” will take until 2030 to be realized (BMVI, 2019). The plan involves several constructive measures for removing the depth bottlenecks. The goal is to increase the off-loading depth from 1.90 m to 2.10 m on a length of almost 50 km, 11 km downstream of the gauging station Kaub and 38 km upstream.
Implemented, on-going, and planned adaptation measures include also:
• Installing re-cooling systems for enabling the reuse of river water. It is by law prohibited to discharge industrial cooling water from power plants and production facilities into a river when the temperature of the river is equal to or higher than 25°C. Re-cooling systems cool down used and thus heated cooling water and enable to reuse it several times for cooling in a closed cycle, instead of discharging it after one use and extracting fresh river water. Without re-cooling systems, power plants and industrial plants might need to be shut down if the river temperature stays in the prohibitive temperature range for too long a time.
• Optimization of loading and unloading times at ports for accelerated dispatch of the higher number of cargo ships required for transporting the same total amount of payload in periods of low water levels.
• One company that extracts water from the Rhine River for industrial processes, for cooling, and for firefighting has constructed a new facility for uptake of river water from the Rhine that can cope with much lower water levels than the previous facility, and
• Conversion of cargo ships for improved navigability during periods of low river water levels. This includes lighter ship structures and modified propulsion for reducing the overall height of the ship.
5. Discussion
5.1. Methodological implications
The rising need for more resilient infrastructure systems has resulted in advances in risk analyses of supply chains and analyses of interdependencies in infrastructure systems from a Critical Infrastructure Protection and Resilience perspective. However, results from such analyses on the level of interconnected infrastructure systems have seldomly be broken down to the level of individual corporate value chains. We address this gap by introducing and combining four improvements to IC-based climate risk and vulnerability analyses.
First, we developed an adapted visualization method for Impact Chains, by introducing the concept of “impact fields” and clustering exposed elements, sensitivities, capacities, and impacts within these fields. We argue that this allows pinpointing which stakeholders need to deal with which impacts along the dependency chains and who might bear the brunt of the impacts (as well as their related economic losses). This in turn enables stakeholders to identify where mitigation measures might be most (cost) effective, by allowing to identify measures that can be implemented early on in the dependency chain to prevent or lessen the impact down the line. This approach also allows to identify sensitivities and capacities that influence individual or multiple impact fields, thus allowing to identify adaptation measures that affect multiple impact fields. We believe that this in turn can allow to identify the most efficient adaptation measures, i.e., measures that can have positive effects on multiple impact fields. In combination, locating exposed elements, sensitivities, capacities, and related adaptation measures within (overlapping) impact fields allows to identify which stakeholders need to take (or are already taking) action and where the (initial investment) costs of these actions (currently) lie, making the efforts (and investments) of individual stakeholders and their effects more transparent to all stakeholders of the infrastructure system.
Second, we based the regional climate risk assessment on national ICs and their fields of action. From a knowledge co-production perspective, not starting from scratch with the Impact Chain creation but using relevant parts of the more general national (German) climate Impact Chains had two effects: (1) co-production started with concrete examples, which avoided “re-inventing the wheel” and gave case study participants an easier start toward commencing the CRVA process, and (2) the resulting qualitative ICs are consistent with the national ICs. We believe that this can be an advantage for subsequent adaptation measures, as they can be related to national-level measures and potential funding options. The first effect is consistent with experiences of the authors from the Horizon 2020 project RESIN12, in which municipal stakeholders often articulated the need for adaptable Impact Chain “blueprints” to make the method less time consuming and more accessible.
Third, we developed a method to locate risk components from regional Impact Chains within value chains of individual businesses. This allows to break down national/regional impacts of climate change toward individual business units and even single process steps, supporting more targeted adaptation measures within organizations and allowing to connect national/regional CRVA with business continuity practices. We believe that this approach leads to more consistency of climate risk assessments across governance levels.
Fourth, we developed a method for economic assessment of climate impacts that links individual (impact) indicators under different scenarios to economic losses, allowing to link the IC-based value chain CRVA approach to the Risk Matrix Approach, which is a standard and familiar way of visualizing risk in business continuity practice. We argue that the presented approach is in principle generalizable for all kinds of impacts, provided there is sufficient data available or experts for providing value judgements.
Overall, the application of the methods involved the exploitation of qualitative (stakeholder knowledge) as well as quantitative information and data (publicly available resources). We did not explicitly address and report any potential uncertainties of these information and data used, though we are aware of sources of uncertainty. For instance, the calculation tool that we provided can be used in two ways: (1) analysis of historic data for assessing the influence of low water periods on transport costs and (2) assessing potential future scenarios. For case (1), the stakeholders may use the real costs; thus, the uncertainty in our model calculation—explained in the next paragraph—is not relevant for this application case. For case (2), stakeholders need to assume future developments of transport volumes, transport costs, duration of low water periods and water levels during those periods. The first two parameters are hypothetic and thus uncertainties would be present and could be derived from economic forecast, but we believe that this is not necessary for exploring future cost scenarios. The assumptions regarding low water periods may be aligned with regional climate models, and then the uncertainties of these models would apply.
One source of uncertainty originates from our specific use of the water level data. The data for the water level at the gauging station Kaub are validated values of the measured water level provided by the German Federal Institute of Hydrology. We used a set of daily mean water level values, derived by the data provider, to determine the number of days per calendar year in which the water level lies within one of the surcharge-determining intervals. By using this provided data, it may be possible that although the average water level value for a given day lies within a certain interval range, the real water level on that day may lie outside that interval for several hours. Given the approximate travel time of 3 days between the ARA seaports and Mannheim, we may assume that a possible shift of the water level to another surcharge interval for a couple of hours intra-day does not have a significant influence on the total surcharge for one such trip.
5.2. Limitations of the method, lessons learned, and need for additional research
The method presented in this paper has been successfully applied to create a regional Impact Chain with multiple stakeholders and to locate risk components from this Impact Chain down toward the value chain of one individual business. While both the Impact Chain approach and modeling value chains are well-established approaches that have been applied in numerous case studies, their combination—as described in this paper—is a novel approach that needs further validation by applying it to further businesses, ideally to businesses within the same region or within the same supply chain. The steps described in this paper (see section “The process of creating value chain CRVA”) and the building blocks (Impact Chains and value chains) provided, should allow other researchers to conduct further case studies to validate the method. Although the specific value chain created within out case study cannot be disclosed, the scheme we describe can be applied to all businesses of the production sector. However, as every business has its individual organizational setup, the value chain model will have to be further adapted to fit the specific needs of the business. We believe that applying the method to additional business within the same supply chain would allow to identify how impacts and risks from the regional Impact Chain that are located up and downstream of an individual value chain propagate through the whole supply chain.
We were also not able to complete the fourth step of the process presented in Figure 4, due to resources limitations—partially resulting from the fact that the impacts of the Russian-Ukrainian war required the stakeholders needing to reorganize their fuel procurement and transport activities, leaving them no time to complete the planned fourth step. Consequently, while our approach enables calculating economic impacts of different low water scenarios, which would allow to include effects of different adaptation measures, we did not have the chance to test this hypothesis with specific adaptation measures identified with the case study stakeholders.
With this case study, we provided a proof of concept for a single business. For a clear validation of the generality of our proposed method it would be necessary to apply the method also to another type of business. We want to point out here that Porter's value chain model has been applied to numerous, different types of businesses over the last 40 years. This fact makes us confident that our proposed combination of using the Value Chain approach to model business system elements and then pinpointing climate risk elements onto these elements would also work for other businesses.
One thing that we learned in case studies across three different, related projects is that stakeholders are almost always short of personnel resources for climate change risk analysis and adaptation. This holds especially for small and medium sized enterprises and municipalities. Risk analysis, adaptation planning, and monitoring need to be scaled such that the stakeholders can manage it with their resources. Hence it is crucial to know for external experts and scientists who engage in such activities and for the participating stakeholders what the estimated resource demand of the methods presented in this paper—or alternative methods—actually is. We consider the experience values for the time demand of the activities that we provided here a valuable piece of empirical information.
5.3. Ethical dimension of assessing vulnerabilities and implications for reproducibility
Climate risk assessment includes the identification of sensitivities and vulnerabilities. When applied to Critical Infrastructure, identified vulnerabilities of certain system elements may point to a security risk. If a stakeholder decides to keep such an assessment result confidential, then we believe that it would be irresponsible and unethical to publish it. This is the reason why we have omitted the full risk-enhanced value chain diagram in the Results section.
Does this restriction impair the reproducibility of our method? We believe that it does not. The concept of Value Chains has been introduced almost 40 years ago. There is ample literature on Value Chain analysis, and guidance for eliciting Value Chain diagrams is available13 and is not complicated to apply. The Value Chain elements need to be elicited and the workflow of processes between business units determined as described in this paper. This is already sufficient, determining the margin is not necessary here. Instead, risk elements are pinpointed to Value Chain elements. This is easy and requires just the stakeholder knowledge of their enterprise, common sense thinking, and facilitation of the process—as detailed in Figure 4—from the scientific-technical experts.
6. Conclusion
With the accelerating climate crisis and the rising interconnectedness of critical infrastructure systems, it becomes more relevant to move away from analyses for single infrastructure sectors toward the analysis of whole infrastructure systems and cross-sectoral dependencies. However, as the functioning of these interconnected infrastructure systems is dependent on a myriad of different stakeholders and actors from European to local level who need to cooperate to operate them, the need to increase the resilience of these systems of systems brings questions of shared responsibilities for implementation and financing of mitigation/adaptation measures to the fore to ensure their efficiency and effectiveness.
In this paper, we have presented a case study that tried to take a step toward closing these gaps by addressing shared implementation of adaptation measures using an integrative approach to CRVA. The first type of integration is the (vertical) uptake of results from CRVAs from higher governance levels on lower ones, the second type of integration is the (horizontal) multi-stakeholder, multi-sectoral regional CRVA. Our case study employed a novel approach for value chain climate risk and vulnerability analysis that combines a participatory, indicator-based method with a semi-quantitative risk matrix method that allows linking analyses from national to local scale and also supports economic assessment of climate change impacts for individual businesses. This approach has been successfully applied within a multi-stakeholder case study in the metropolitan region of Mannheim, where a part of the results have been and will be transferred into daily practice: (1) The Impact Chain developed with municipal stakeholders as a “test run” (IC 1) has been included in Mannheim's heat action plan; and (2) the developed risk assessment tool is currently being evaluated by the Mannheim Large Powerplant for inclusion in their business continuity management. The risk-enhanced value chain diagrams also offer opportunities for further coordinating risk analysis along supply chains or along value chains that span more than one business due to shared organization of work.
The workshops for creating the regional Impact Chain led to an exchange of information on implemented and on-going adaptation measures and to better awareness of the regional situation. Some stakeholders have expressed their wish to continue exchanges on regional adaptation beyond the duration of the case study.
We believe that our case study makes a significant contribution to better understanding of socio-economic impacts within and adaptation measures for interconnected infrastructure systems. However, further application of the proposed method in additional case studies is necessary to assure it is applicable for a broad range of infrastructure systems affected by different climatic hazards.
Moreover, our approach currently solely focuses on CRVA for preparing climate change adaptation. But for an infrastructure system to become truly resilient—and to avoid mal-adaptation/-mitigation—it would be advisable to also examine how to include climate change mitigation measures and effects within the approach. This would require additional research to extend the IC-based CRVA—and specifically the Impact Chain method—with a way to account for (positive or negative) mitigation effects of impacts and adaptation measures, an avenue that should be pursued further in future.
Our case study showed that IC-based CRVA can be meaningfully combined with other risk assessment practices that are common in businesses, namely value chains and risk matrices. This facilitates the integration of outcomes of IC-based CRVA in existing risk management and business continuity practices of organizations.
Data availability statement
The data analyzed in this study is subject to the following licenses/restrictions: Data on gauging levels is available upon request at the German Federal Institute of Hydrology BfG (https://www.pegelonline.wsv.de/gast/start). Data related to business practices and economic impacts used for the risk assessment is not provided due to confidentiality reasons. Requests to access these datasets should be directed to DL, ZGFuaWVsLmx1ZWNrZXJhdGhAaWFpcy5mcmF1bmhvZmVyLmRlLg==
Author contributions
DL contributed the idea of combining Impact Chains and Value Chains and co-designed the Impact Chain graphical template with KM. KM and DL jointly analyzed and post-processed the co-produced Impact Chains, indicator lists, the Value Chain diagrams, and jointly processed and aggregated the raw water level data. ER designed and implemented the risk matrix like tool for estimating the transport surcharges, performed most of the background and context research for the case study, and contributed the idea of building the Impact Chains for the case study on the national Impact Chains. All authors jointly prepared, conducted, documented, and evaluated the participative stakeholder co-production of knowledge in the described case study. All authors contributed to the article and approved the submitted version.
Funding
The work presented here was carried out entirely within the framework of the UNCHAIN project. UNCHAIN is part of the JPI Climate ERA-NET Consortium AXIS and received funding from the German Federal Ministry of Education and Research (BMBF) (Grant Agreement FKZ 01LS1908B), NFR (Norway), Formas (Sweden), FFG (Austria), ANR (France), NWR (The Netherlands), MINECO (Spain), with co-fund support of the European Union (under Horizon 2020 Grant Agreement reference 776608) via JPI AXIS. We gratefully acknowledge this support.
Acknowledgments
This work would not have been possible without the support and active participation of the stakeholders from the Mannheim metropolitan region. We gratefully acknowledge the support of the state-owned Rhine-Neckar Port Authority; the City of Mannheim's municipal departments Climate Office, Economic and Structural Development, Urban Development, Public Health Office, and Professional Firefighters; the logistics company Contargo; and the sanitary paper production company essity. Special thanks go to the experts from the Mannheim Large Powerplant for the continued in-depth risk assessment and the trustful collaboration; and to the experts from the German Federal Institute of Hydrology BfG, who contributed their invaluable expertise and data regarding the hydrological situation of the Rhine. We would also like to thank the UNCHAIN project partners for the close collaboration on case study protocol, research design, and evaluation framework, for exchange of experiences in case studies, co-production, and methods, and for the generally excellent spirit. Special thanks go to Carlo Aall of WNRI and his coordination team, including Adeline Cauchy of Ramboll; to Ghislain Dubois and Carlo Aall for creating the UNCHAIN project idea; to Linda Menk of PLUS for the close collaboration on the core CRVA methods; to Åsa Gerger Swartling of SEI and Carlo Aall for planning and coordinating the UNCHAIN publication work; to Florence Rudolph and her team at INSA for mutual exchange of case study background and experience; and—last but not least—to Marc Zebisch and Kathrin Renner and their team at Eurac Research and Stefan Kienberger for creating and further developing the methods introduced in the Vulnerability Sourcebook.
Conflict of interest
The authors declare that the research was conducted in the absence of any commercial or financial relationships that could be construed as a potential conflict of interest.
Publisher's note
All claims expressed in this article are solely those of the authors and do not necessarily represent those of their affiliated organizations, or those of the publisher, the editors and the reviewers. Any product that may be evaluated in this article, or claim that may be made by its manufacturer, is not guaranteed or endorsed by the publisher.
Supplementary material
The Supplementary Material for this article can be found online at: https://www.frontiersin.org/articles/10.3389/fclim.2023.1037117/full#supplementary-material
Footnotes
1. ^https://websites.fraunhofer.de/CIPedia/index.php/Critical_Infrastructure
2. ^On the level of individual organizations, risk analyses are usually part of business continuity planning, which is often confidential and cannot be shared publicly.
3. ^Translated with www.DeepL.com/Translator (free version).
4. ^ARA: Amsterdam, Rotterdam, Antwerp.
5. ^German Weather Service (DWD), 28.12.2018 https://www.dwd.de/DE/presse/pressemitteilungen/DE/2018/20181228_deutschlandwetter_jahr2018_news.html.
6. ^German Drought Monitor at https://www.ufz.de/index.php?de=47252.
7. ^https://www.mannheim.de/de/service-bieten/mannheim-auf-klimakurs/abteilung-klimaschutz-klimaschutzleitstelle
8. ^miro: web-based collaborative whiteboard software.
9. ^https://scor.ascm.org/processes/introduction
10. ^ISO 31010.
11. ^The water level data have been kindly provided by the German Federal Institute of Hydrology.
13. ^For instance, https://miro.com/blog/value-chain-diagram/.
References
Ademmer, M., Boysen-Hogrefe, J., Fiedler, S., Groll, D., Jannsen, N., Kooths, S., et al (2018). Aufschwung stößt an Grenzen – Belebung nur temporär. Kieler Konjunkturberichte Nr. 50 (2018|Q4). Available online at: https://www.ifw-kiel.de/de/publikationen/kieler-konjunkturberichte/2018/aufschwung-stoesst-an-grenzen-belebung-nur-temporaer-11863/ (accessed September 5, 2022).
BBK (2011). German Federal Office of Civil Protection and Disaster Assistance: Method of Risk Analysis for Civil Protection. Bonn: Wissenschaftsforum. ISBN: 978-3-939347-41-5.
Bloomberg (2022). Rhine to Recede Further as Climate Crisis Adds to Energy Crunch. By Wittels, J., Malsch, L., and Longley, A. Available online at: https://www.bloomberg.com/news/articles/2022-08-12/rhine-river-set-to-shrink-to-critical-threshold-for-navigability (accessed August 16, 2022).
BMVI (2019). Aktionsplan “Niedrigwasser Rhein” für zuverlässigen Transport. Available online at: https://www.bmvi.de/SharedDocs/DE/Artikel/WS/gemeinsame-erklaerung-acht-punkte-plan-niedrigwasser-rhein.html (accessed September 5, 2022).
Bockel, L., and Tallec, F. (2005). Commodity Chain Analysis: Constructing the Commodity Chain Functional Analysis and Flow Charts. EASYPol series 043. Rome: FAO.
Bremer, S., and Meisch, S. (2017). Co-production in climate change research: reviewing different perspectives. WIREs Clim Change 8, e482. doi: 10.1002/wcc.482
Bundesregierung (2008). Deutsche Anpassungsstrategie an den Klimawandel vom Bundeskabinett am beschlossen. Berlin, Germany. Available online at: https://www.bmuv.de/download/deutsche-anpassungsstrategie-an-den-klimawandel (accessed December 17, 2008).
Bundesregierung (2022). Deutsche Strategie zur Stärkung der Resilienz gegenüber Katastrophen – Umsetzung des Sendai Rahmenwerks für Katastrophenvorsorge (2015–2030) – Der Beitrag Deutschlands 2022–2030. Berlin, Germany: Bundesministerium des Inneren und für Heimat, Juli 2022. Available online at: https://www.bmi.bund.de/SharedDocs/downloads/DE/publikationen/themen/bevoelkerungsschutz/BMI22017-resilienz-katastrophen.pdfjsessionid=C2B4C6A587FCB5C2561918533E51C2DC.1_cid332?__blob=publicationFileandv=2 (accessed September 5, 2022).
Destatis (2019). Volkswirtschaftliche Gesamtrechnungen • Inlandsproduktberechnung Saisonbereinigte Vierteljahresergebnisse nach Census X-12-ARIMA und BV4.1, 4. Vierteljahr 2018. Fachserie 18 Reihe 1.3, Destatis, Wiesbaden, 2019. Available online at: https://www.statistischebibliothek.de/mir/receive/DEHeft_mods_00096398 (accessed September 5, 2022).
European Commission (2009). Challenging futures of science in society: emerging trends and cutting-edge issues: report of the MASIS expert group setup by the European Commission. European Commission, Directorate-General for Research and Innovation. Luxemburg: Publications Office of the European Union.
European Commission (2019). European Commission COM(2019) 640 final, The European Green Deal. Brussels, Belgium.
European Commission (2020). European CommissionCOM(2020) 829 final, Proposal for a Directive of the European Parliament and of the Council on the resilience of critical entities. Brussels, Belgium.
European Commission (2021a). Overview of natural and man-made disaster risks the European Union may face: 2020 edition. European Commission, Directorate-General for European Civil Protection and Humanitarian Aid Operations (ECHO). Luxemburg: Publications Office of the European Union. Available online at: https://data.europa.eu/doi/10.2795/1521 (accessed September 5, 2022).
European Commission (2021b). European Commission COM(2021) 82 final, Forging a climate-resilient Europe – the new EU Strategy on Adaptation to Climate Change. Brussels, Belgium.
Eusgeld, I., Nan, C., and Dietz, S. (2011). “System-of-systems” approach for interdependent critical infrastructures. Reliab. Eng. Syst. Safety 96, 679–686. doi: 10.1016/j.ress.2010.12.010
Forzieri, G., Bianchi, A., Marin Herrera, M., Bastita, E., Silva, F., Feyen, L., et al. (2016). Resilience of Large Investments and Critical Infrastructure in Europe to Climate Change. Luxembourg: Publications Office of the European Union. JRC100313.
Forzieri, G., Bianchi, A., Silva, E., Batista, F., Marin Herrera, M., Leblois, A., et al. (2018). Escalating impacts of climate extremes in critical infrastructures in Europe. Global Environ. Change 48, 97–107. doi: 10.1016/j.gloenvcha.2017.11.007
Fritzsche, K., Schneiderbauer, S., Bubeck, P., Kienberger, S., Buth, M., Zebisch, M., et al (2014). The Vulnerability Sourcebook. Concept and guidelines for standardised vulnerability assessments. Bonn and Eschborn: German Federal Ministry for Economic Cooperation and Development and Deutsche Gesellschaft für Internationale Zusammenarbeit (GIZ) GmbH. Available online at: http://www.adaptationcommunity.net/?wpfb_dl=203 (accessed May 18, 2018).
GIZ and EURAC (2017). Risk Supplement to the Vulnerability Sourcebook. Guidance on How to Apply the Vulnerability Sourcebook's Approach with the New IPCC AR5 Concept of Climate Risk. Bonn: GIZ.
Hagenlocher, M., Schneiderbauer, S., Sebesvari, Z., Bertram, M., Renner, K., Renaud, F., et al (2018). Climate risk assessment for ecosystem-based adaptation: A guidebook for planners and practitioners. Bonn and Eschborn: German Federal Ministry for Economic Cooperation and Development and Deutsche Gesellschaft für Internationale Zusammenarbeit (GIZ) GmbH. Available online at: https://www.adaptationcommunity.net/wp-content/uploads/2018/06/giz-eurac-unu-2018-en-guidebook-climate-risk-asessment-eba.pdf (accessed September 5, 2022).
Hänsel, S., Nilson, E., Patzwahl, R., Forbriger, M., Klose, M., and Krieger, B. (2020). Einflüsse naturgefahrenbedingter Streckensperrungen auf überregionale Verkehrsströme – Verkehrsträgerübergreifende Stresstestszenarien für die Region Mittelrhein. Schlussbericht des Schwerpunktthemas Fokusgebiete Binnen (SP-109) im Themenfeld 1 des BMVI-Expertennetzwerks (Simulation einer extrem langen Niedrigwasserperiode).
Hopkins, T. K., and Wallerstein, I. (1977). Patterns of development of the modern world-system. Review 1, 111–145.
IfW (2018). Zum Einfluss des Niedrigwassers auf die Konjunktur. IfW-Box 2018.17. Kiel, Germany: IfW. Available online at: https://www.ifw-kiel.de/fileadmin/Dateiverwaltung/IfW-Publications/-ifw/IfW_Box/2018/box_2018-17_niedrigwasser.pdf (accessed September 5, 2022).
IPCC (2014). “Climate Change 2014: Synthesis Report,” in Contribution of Working Groups I, II and III to the Fifth Assessment Report of the Intergovernmental Panel on Climate Change, eds. R.K. Pachauri and L.A. Meyer (Geneva, Switzerland: IPCC).
IPCC (2022). “Summary for Policymakers,” in Climate Change 2022: Impacts, Adaptation, and Vulnerability. Contribution of Working Group II to the Sixth Assessment Report of the Intergovernmental Panel on Climate Change, eds. H.-O., Pörtner, D.C., Roberts, M., Tignor, E.S., Poloczanska, K., Mintenbeck, A., Alegría, et al. (Cambridge, UK: Cambridge University Press).
Klein, R. J. T., and Juhola, S. (2014). A framework for Nordic actor-oriented climate adaptation research. Environ. Sci. Policy 40, 101–115. doi: 10.1016/j.envsci.2014.01.011
KLIWA (2021). Klimawandel in Süddeutschland – Veränderungen von meteorologischen und hydrologischen Kenngrößen. Klimamonitoring im Rahmen der Kooperation KLIWA, Monitoring Bericht 2021. Available online at: https://www.kliwa.de/_download/KLIWA_Monitoringbericht_2021.pdf (accessed September 5, 2022).
Lückerath, D., Bogen, M., Rome, E., Sojeva, B., Ullrich, O., Worst, R., et al. (2018). “The RESIN climate change adaptation project and its simple modeling approach for risk-oriented vulnerability assessment,” in Proceedings of ASIM-Workshop STS/GMMS. Workshop 2018 ASIM/GI-Fachgruppen (ASM 2018) (Hochschule Heilbronn, Germany) 21–26.
Luiijf, H. A. M., Nieuwenhuijs, A. H., and Klaver, M. H. A. (2010). Empirical findings on European critical infrastructure dependencies. Int. J. Syst. Eng. 2, 3–18. doi: 10.1504/IJSSE.2010.035378
Menk, L., Terzi, S., Zebisch, M., Rome, E., Lückerath, D., Milde, K., et al. (2022). Climate change impact chains: a review of applications, challenges, and opportunities for climate risk and vulnerability assessments. Weather, Clim. Soc. 14, 619–636. doi: 10.1175/WCAS-D-21-0014.1
Oxfam (2012). Value Chain Climate Resilience – A guide to Managing Climate Impacts in Companies and Communities. Oxfam, BSR: PREP report.
Palutikof, J. P., Street, R. B., and Gardiner, E. P. (2019). Decision support platforms for climate change adaptation: an overview and introduction. Clim. Change, 153, 459–476. doi: 10.1007/s10584-019-02445-2
Poljansek, K., Casajus Valles, A., Marin Ferrer, M., Artes Vivancos, T., Boca, R., Bonadonna, C., et al. (2021). Recommendations for National Risk Assessment for Disaster Risk Management in EU: Where Science and Policy Meet, Version 1. Luxembourg: Publications Office of the European Union. ISBN 978-92-76- 30256-8.
Porter, M. E. (1985). Competitive Advantage: Creating and Sustaining Superior Performance. New York: Simon and Schuster. ISBN 13: 9781416595847.
Porter, M. E. (1991). Towards a dynamic theory of strategy. Strat. Manage. J. 12, 95–117. doi: 10.1002/smj.4250121008
Rodela, R., and Gerger Swartling, Å. (2019). Environmental governance in an increasingly complex world: Reflections on transdisciplinary collaborations for knowledge coproduction and learning. Env. Pol. Gov. 9, 83–86. doi: 10.1002/eet.1842
Rome, E., Bogen, M., Lückerath, D., Ullrich, O., Voss, H., Voss, N., et al. (2017). “IVAVIA guideline,” in Deliverable D2.3 Realisation and implementation of IVAVIA. EU H2020 Project RESIN (Sankt Augustin, Germany).
Rome, E., Ullrich, O., Lückerath, D., Worst, R., Xie, J., and Bogen, M. (2018). “IVAVIA: impact and vulnerability analysis of vital infrastructures and built-up areas,” in Proceedings of CRITIS 2018, the 13th International Conference on Critical Information Infrastructures Security, Kaunas, Lithuania (Springer LNCS) 11260, 84–97. doi: 10.1007/978-3-030-05849-4_7
Rotaru, K., Wilkin, C., and Ceglowski, A. (2014). Analysis of SCOR's approach to supply chain risk management. Int. J. Oper. Prod. Manage. 34, 1246–1268. doi: 10.1108/IJOPM-09-2012-0385
Schneiderbauer, S.M, Zebisch, S., and Kass Pedoth, L. (2013). “Assessment of vulnerability to natural hazards and climate change in mountain environments – examples from the Alps,” in Measuring Vulnerability to Natural Disasters, eds. J. Birkmann (Tokyo, United University Press) 349–380.
Setola, R., Rosato, V., Kyriakides, E., and Rome, E. (2017). Managing the Complexity of Critical Infrastructures – A Modelling and Simulation Approach. Series: Studies in Systems, Decision and Control. Cham: Springer. ISBN 978-3-319-51042-2.
Stadt Mannheim (2021). Stadtklimaanalyse Mannheim 2020 – Abschlussbericht. GEO-NET Umweltconsulting GmbH, ÖKOPLANA. Available online at: https://www.mannheim.de/de/nachrichten/stadtklimaanalyse-mannheim-2020 (accessed September 5, 2022).
Streng, M., van Saase, N., and Kuipers, B. (2020). Economische impact laagwater – Een analyse van de effecten van laagwater op de binnenvaartsector en de Nederlandse en Duitse economie. Rotterdam, The Netherlands: Erasmus Centre for Urban, Port and Transport Economics.
Thacker, S., Adshead, D., Fantini, C., Palmer, R., Ghosal, R., Adeoti, T., et al. (2021). Infrastructure for Climate Action. Copenhagen, Denmark: UNOPS.
Umweltbundesamt (2016). Klimawirkungsketten Umweltbundesamt, 2016. Dessau-Roßlau: Umweltbundesamt. Available online at: https://www.umweltbundesamt.de/sites/default/files/medien/380/dokumente/klimawirkungsketten_umweltbundesamt_2016.pdf (accessed September 5, 2022).
Umweltbundesamt (2017). Leitfaden für Klimawirkungs- und Vulnerabilitätsanalysen. Dessau-Roßlau: Umweltbundesamt.
Umweltbundesamt (2019a). “Folgen des globalen Klimawandels für Deutschland,” Erster Teilbericht: Die Wirkungsketten in der Übersicht, eds. M., Peter, M., Guyer, J. Füssler (Dessau-Roßlau: Umweltbundesamt) Available online at: https://www.umweltbundesamt.de/sites/default/files/medien/1410/publikationen/2019-10-02_cc_20-2019_impactchain_ap1_fuer_climate_change_reihe_final_2019_plain.pdf (accessed September 5, 2022).
Umweltbundesamt (2019b). Monitoringbericht 2019 zur Deutschen Anpassungs-strategie an den Klimawandel – Bericht der Interministeriellen Arbeitsgruppe Anpassungs-strategie der Bundesregierung. Berlin, Germany. Available online at: http://www.umweltbundesamt.de/publikationen/monitoringbericht-2019 (accessed September 5, 2022).
Umweltbundesamt (2021). Niedrigwasser, Dürre und Grundwasserneubildung – Bestandsaufnahme zur gegenwärtigen Situation in Deutschland, den Klimaprojektionen und den existierenden Maßnahmen und Strategien. Abschlussbericht (Report). ISSN 1862–4804.
Wallerstein, I., and Hopkins, T. K. (1993). “Commodity Chains: Construct and Research,” in Commodity Chains and Global Capitalism, eds. G. Gereffi, and M., Korzeniewicz (Westport, CT: Praeger), 17–20.
Wieland, A., and Wallenburg, C. M. (2012). Dealing with supply chain risks: Linking risk management practices and strategies to performance. Int. J. Phys. Distr. Logist. Manage. 42, 887–905. doi: 10.1108/09600031211281411
Wilkerson, T. (2011). “Governing Tangible Risk - The SCOR Model,” in. X-SCM The New Science of X-treme Supply Chain Management, Chapter 6, eds L. H. Harrington, S. Boyson, and T. Corsi (New York, NY: Routledge).
Appendix
List of non-standard acronyms.
Keywords: climate change adaptation, climate risk assessment, impact chains, supply chains, knowledge co-production, case study
Citation: Lückerath D, Rome E and Milde K (2023) Using impact chains for assessing local climate risk—A case study on impacts of extended periods of fluvial low waters and drought on a metropolitan region. Front. Clim. 5:1037117. doi: 10.3389/fclim.2023.1037117
Received: 05 September 2022; Accepted: 25 January 2023;
Published: 09 February 2023.
Edited by:
Emmanuel M. N. A. N. Attoh, Wageningen University and Research, NetherlandsReviewed by:
Bruno Merz, GFZ German Research Centre for Geosciences, GermanyDavid Daou, Institute for Environment and Human Security (UNU), Germany
Copyright © 2023 Lückerath, Rome and Milde. This is an open-access article distributed under the terms of the Creative Commons Attribution License (CC BY). The use, distribution or reproduction in other forums is permitted, provided the original author(s) and the copyright owner(s) are credited and that the original publication in this journal is cited, in accordance with accepted academic practice. No use, distribution or reproduction is permitted which does not comply with these terms.
*Correspondence: Daniel Lückerath,  ZGFuaWVsLmx1ZWNrZXJhdGhAaWFpcy5mcmF1bmhvZmVyLmRl