 Mathilda Englund
 Marlon Vieira Passos
 Karin André
 Åsa Gerger Swartling
 Karina Barquet
- Stockholm Environment Institute, Stockholm, Sweden
Floods disproportionately affect disadvantaged groups. Social vulnerability assessments are the first step in designing just and equitable flood risk reduction strategies. In Sweden, earlier social vulnerability indices apply top-down approaches. In this paper, we develop and apply a combined bottom-up and top-down approach to assess social vulnerability to flooding at a sub-municipal level in Sweden. We tested an indicator-based climate risk and vulnerability framework, more specifically the impact chain method suggested by the Vulnerability Sourcebook. We involved stakeholders using various participatory methods in three workshops, interviews, and informal exchanges to identify variables and indicators for social vulnerability. The Indicators were aggregated into a composite social vulnerability index using exploratory factor analysis. We thereafter mapped the social vulnerability index scores to uncover spatial injustices. We found that the proposed social vulnerability index captures municipal nuances better than national-level approaches. Our findings indicate an uneven spatial distribution of social vulnerability that mimics the overall patterns of income segregation found in the municipality. Many areas that score low in social vulnerability endure high exposure to floods. The social vulnerability index can support municipalities in designing just and equitable interventions toward flood risk reduction by serving as an input to policymaking, investment strategies, and civil protection.
1. Introduction
Floods cause major human suffering, economic damages, and infrastructure disruptions (UNDRR, 2022). However, impacts vary across communities. Disadvantaged groups tend to experience disproportionate losses and distress (Wisner et al., 2004). Exposure and vulnerability are driven by deep-rooted societal injustices (Thomas et al., 2020). To address this challenge, the Intergovernmental Panel on Climate Change (IPCC) (IPCC, 2022), European Union (European Union, 2021) and United Nations (UNDRR, 2022) plead for just and equitable resilience to prevent vulnerable groups from being left behind.
Sweden endures growing social injustices and inequalities (Bertelsmann Stiftung, 2019) which is expected to entrench social vulnerabilities further and complicate efforts toward disaster risk reduction (Pettersson et al., 2021). Flood risk is gaining national recognition in Swedish policymaking, as in, for example, the National Floods Directive (2009), the National Strategy for Climate Change Adaptation (2018), and Planning and Building Act (2010). Most legislation, however, neglects the social dimension of flooding although the European Union Floods Directive (European Union, 2021) encourages member states to consider fairness and solidarity in their flood risk management.
In Sweden, civil contingency planning focuses on maintaining critical infrastructures and vital societal functions rather than empowering people (Eriksson et al., 2011). Although research on social vulnerability in Sweden is emerging (see for example Nieminen Kristofersson, 2007; Guldåker, 2009; Sparf, 2015; Orru et al., 2022), few decision-support tools and policy instruments exist for assessing disaster justice and social vulnerability (Pettersson et al., 2021). Social vulnerability assessments are the first step in designing just and equitable risk reduction strategies and strengthening resilience among the most vulnerable segments of the population (Chakraborty et al., 2019).
Social vulnerability indices have gained recognition as a powerful decision support tool among both policymakers and researchers (Rufat et al., 2015; Oulahen et al., 2019). These indices consist of several variables and indicators representing social vulnerability and can map its spatial and temporal dimension using census areal units (Cutter and Finch, 2008). Social vulnerability indices can bring to light the injustices that drive differentiated impacts across groups and draw attention to the unequal spatial distribution of vulnerability and exposure (Chakraborty et al., 2019).
In Sweden, social vulnerability indices are gaining increasing attention. The geographical resolution varies, and includes municipal census areal units, regional census areal units (RegSO-areas), and demographic census areal units (DeSO-areas). Karagiorgos et al. (2021) replicate an existing social vulnerability index developed for the United States for Sweden using municipal census areal units and DeSO-areas. Indicator selection for DeSO-areas was, however, limited due to insufficient data availability. Haas et al. (2021) develop an adapted version of the social vulnerability index based on a literature review to investigate the spatial distribution of social vulnerability to landslides, flooding, and wildfires at a national level. The study includes both municipal census areal units and RegSO-areas.
Most previous research employs a top-down approach using secondary statistical data and academic literature to derive indicators for social vulnerability (Benzie, 2014; Beccari, 2016; Parsons et al., 2016). In Sweden, all previous social vulnerability indices apply a top-down approach (Haas et al., 2021; Karagiorgos et al., 2021). There is an untapped potential made of local experiences and knowledge, which can ensure that conceptualizations of injustices and vulnerabilities are anchored in the social, economic, and political reality experienced by the local community. A bottom-up approach allows local communities to define who is vulnerable and why, and avoid reproducing misrepresentations of injustices formulated by outsiders (Velasco-Herrejon and Bauwens, 2020). More importantly, bottom-up approaches can reconceptualize what constitutes expert knowledge and open scientific and technocratic processes for non-academic stakeholders to participate (Daniels et al., 2020). Co-benefits might be generated from the participatory process such as strengthened social networks and mutual learning (Hansson and Polk, 2018; Cvitanovic et al., 2019; Bremer et al., 2021). It can capture the social amplification of risk, and serve as a bridge between technical experts and public risk perceptions (Kasperson et al., 1988). Moreover, a bottom-up approach can identify socially-just flood protection that accounts for local conditions and avoids maladaptation that triggers new injustices and vulnerabilities (Malloy and Ashcraft, 2020).
In this paper, we wish to further advance the current state of the art by presenting and applying a combined bottom-up and top-down social vulnerability assessment process with an emphasis on local injustices and thereby enable policymakers to design socially-just flood protection. To this end, we aim to design and test a social vulnerability index to floods at a sub-municipal level in Sweden. We combine a bottom-up stakeholder involvement and top-down statistical analysis to derive a social vulnerability index. We use the smallest census areal unit (DeSO-areas). This allows us to study social vulnerability in depth and context to form an understanding of how social vulnerability varies within the same municipality. We also map the social vulnerability index scores to uncover potential spatial injustices.
To meet these objectives, we run a pilot study in which we zoom into Halmstad Municipality. Halmstad Municipality makes an interesting case as it endures significant exposure to coastal and river flooding while also battling with substantial socioeconomic inequalities (National Board of Housing Building Planning, 2020), which allows us to study the interaction between exposure and societal inequality and its effects on social vulnerability. It allows us to explore whether disadvantaged and marginalized areas suffer from higher flood exposure or not.
The remainder of the paper is organized as follows: First, we delve into the concept of social vulnerability. Thereafter, the methodology is introduced. The following section presents the results starting with the variables determining social vulnerability, followed by an analysis of the spatial distribution of vulnerability to flooding. We thereafter discuss the implications for research and practice and juxtapose our findings with previous research. Finally, conclusions are provided.
2. Social vulnerability to natural hazards
2.1. Social vulnerability
The literature on vulnerability contains a wealth of definitions as a result of being a field that engages researchers from disparate disciplines such as development studies, disaster management, economics, geography, ecology, anthropology, and medicine to name a few (Vogel et al., 2007; Cutter et al., 2009; Armaṣ and Gavriṣ, 2013; Segnestam, 2014). Cutter (1996) finds 18 definitions of vulnerability that diverge in terms of their unit of analysis, epistemological traditions, and conceptualizations. Two archetypes, however, exist: biophysical vulnerability which assesses the likelihood and magnitude of a hazard, and social vulnerability which focus on people's capacity to cope with stresses (Brooks, 2003; Cutter and Finch, 2008).
We use the definition presented in the IPCC Fourth Assessment Report (AR4) (IPCC, 2007, p. 883): “the degree to which a system is susceptible, or unable to cope with adverse effect of climate change, including climate variability and extremes, vulnerability is a function of the character, magnitude and rate of climate variation to which a system is exposed, its sensitivity, and its adaptive capacity”. It captures complex socio-ecological interactions, and allows us to structure the assessment around exposure, sensitivity (the degree which a system is affected), and adaptive capacity (ability to adjust). The latest IPCC definition of vulnerability omits exposure as a function of vulnerability. It overlooks exposure as a precondition and driver of vulnerability, hence neglecting socially differentiated exposure although it can generate an additional layer of injustice (Ishtiaque et al., 2022).
While hazards are shaped by timing, location, and meteorological context, variables like livelihoods, politics, finances, infrastructures, and culture shape their impact on people (Tapsell et al., 2010; Garbutt et al., 2015; Fekete, 2019). Social vulnerability is a pre-existing condition that stems from societal injustices, in which political and cultural structures put certain groups at disadvantage based on their individual characteristics, social standing, and human and financial resources (Bullard, 2008; Rahimi-Golkhandan et al., 2021; Drakes and Tate, 2022). Accordingly, social vulnerability tends to be attributed to a range of socioeconomic and demographic variables (see Table 1 for an overview).
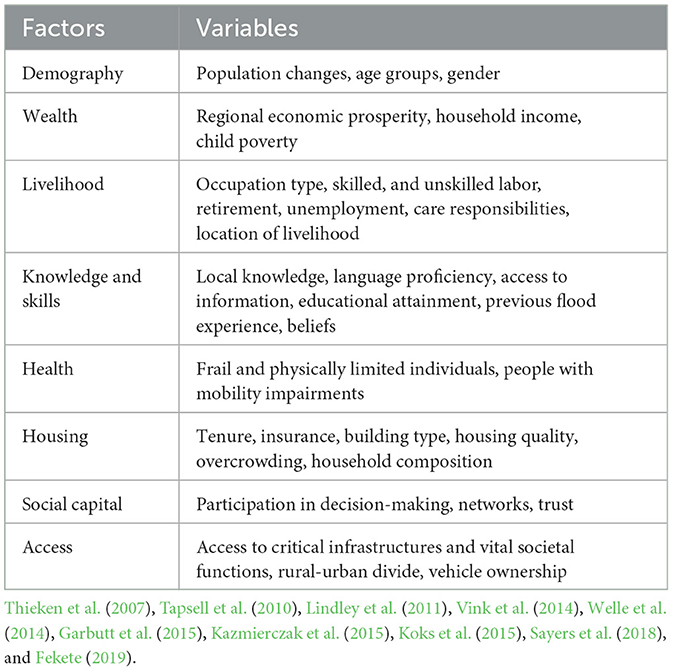
Table 1. Factors and variables for assessing social vulnerability.
Framing disasters as social phenomena that emerge from deep-rooted inequalities gives rise to claims for justice (Bankoff, 2018). Disaster studies using a social vulnerability lens show significant injustices in which disadvantaged and marginalized people are disproportionality affected in disasters (Wisner et al., 2004; Cutter and Finch, 2008; Segnestam, 2017). Accordingly, social vulnerability is about structural injustices rather than inadequate capacities and resources (Thomas et al., 2020). That is, social vulnerability links to distributional justice (fair distribution of costs and benefits) and procedural justice (fair decision-making processes and recognition of different forms of knowledge) (Lukasiewicz, 2020). A better understanding of social vulnerability can both uncover flood-disadvantaged people as well as the pre-existing forces that create or cement disaster injustices (Chakraborty et al., 2019).
2.2. Measuring social vulnerability
Many methods exist for assessing social vulnerability (see Birkmann et al., 2013 for an overview). As noted by Tate (2012, p. 326), “the social analog to the quantitative physical hazard model is the social vulnerability index”. The social vulnerability index has been applied and adapted to numerous contexts and hazards (see for example de Loyola Hummell et al., 2016; Hagenlocher et al., 2016; Roder et al., 2017; Kirby et al., 2019; Tascón-González et al., 2020; El-Zein et al., 2021). Social vulnerability indices can represent socio-ecological complexity; monitor social vulnerability over time and space; pinpoint areas for intervention; and in the end ensure just flood risk management (Chakraborty et al., 2019).
Methodologically, the choice of indicators requires further attention. Indicators diverge across indices, due to diverging conceptualizations; contextual characteristics; intangible and immeasurable variables; and insufficient data availability (Garbutt et al., 2015). Social vulnerability indices are at times “black boxes” with little theoretical and empirical justification (Beccari, 2016). Approaching index construction from the bottom-up can overcome such challenges by involving stakeholders in a transparent and open dialogue in which underlying assumptions surface. It also ensures that the choice of indicators reflects the local context and its complexities (Daniels et al., 2020).
In Sweden, social vulnerability must be explored across analysis scales. So far, existing social vulnerability indices have municipalities as their areal units of analysis (Haas et al., 2021; Karagiorgos et al., 2021). The smallest census areal unit, DeSO-areas, is underutilized. Municipal areal units provide an insufficient spatial resolution as social vulnerability can vary significantly within the same municipality (Nelson et al., 2015). In practice, municipalities hold the primary responsibility for flood risk management and emergency services (Bynander and Becker, 2017). Methodologically, the risk for ecological fallacy increases as census aerial units grow, i.e., attributing the characteristics of a group to an individual. The population is more homogenous the smaller the census aerial units (Wood et al., 2010).
3. Methods
To develop a social vulnerability index, we applied an exploratory mix-method approach combining stakeholder engagement and statistical analysis. We structured the social vulnerability index around (i) factors describing a group of interdependent variables, (ii) variables describing a characteristic that determines social vulnerability, and (iii) indicators describing the metrics that measure the variables.
In this study, we followed the indicator-based climate risk and vulnerability assessment approach the “impact chain” method outlined in the Vulnerability Sourcebook (Fritzsche et al., 2014). The impact chain method draws on the definitions provided by the IPCC AR4, and breaks vulnerability into its components of exposure, sensitivity, and adaptive capacity. The impact chain illustrates the main cause-effect relationships behind climate change and its impacts on people: climate change exposure (e.g., heavy precipitation or meteorological drought) interacts with the system's sensitivity (e.g., population pressure or resource depletion) and adaptive capacity (e.g., financial resources or risk awareness) to produce potential impacts and vulnerabilities.
Operationally, the impact chain method combines stakeholder engagement and quantitative data analysis in an eight-step approach: scoping, developing impact chains, identifying and selecting indicators, data acquisition and management, normalizing, aggregating indicators, aggregating vulnerability components, and presenting the outcomes. We merged some steps since they overlapped (see Figure 1). The impact chain method encourages collaborative stakeholder engagement to strengthen the policy-science interface; ensure contextual relevance; build stakeholder ownership of outcomes and risk awareness; and improve research legitimacy and uptake (Menk et al., 2022). We involved stakeholders using various participatory methods in three workshops, interviews, and informal exchanges during the scoping phase, impact chain development, and validation process. Stakeholders were not involved in the statistical analysis, in which we instead departed from methods found in the academic literature.
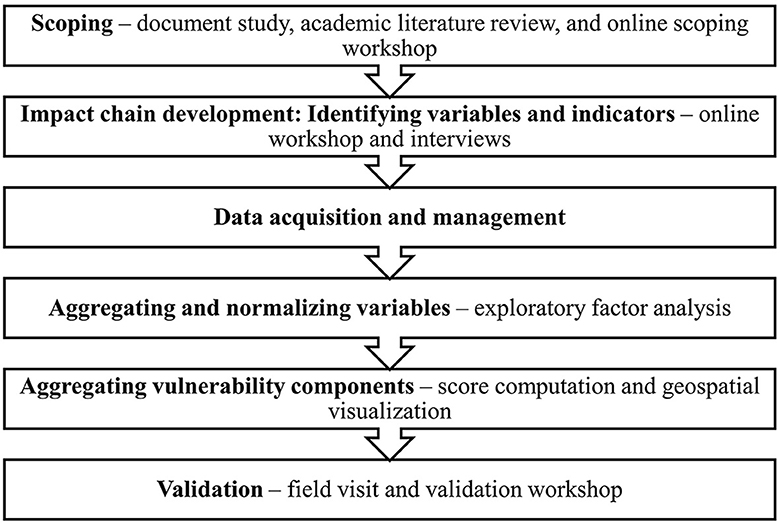
Figure 1. Methodology overview.
3.1. Scoping
The scoping phase included several steps to further specify our aims and research questions and to inform the design of the case study and the participatory process. To gain a better understanding of the context, we first conducted a brief document study reviewing available documentation on climate risk and disaster risk reduction in Halmstad Municipality. Key documents included a flood risk and impact assessment, climate adaptation plan, risk and vulnerability assessment, climate change situation analysis, and spatial plan. It allowed us to tap into ongoing work in the municipality, and ensure relevance for policy and practice.
We thereafter reviewed the academic literature on social vulnerability indices to better understand the scientific debate and state of art. We performed a scoping study to collect variables used for assessing social vulnerability. It is worth noting that the review was not designed to be exhaustive, but to anchor our process in scientific research and gather input for the participatory process (for a meta-analysis of social vulnerability metrics see Rufat et al., 2015). At the time of research, there was no social vulnerability index for Sweden as Haas et al. (2021) and Karagiorgos et al. (2021) published their work in 2021 (after we conducted our initial search). We, therefore, broadened the search to include studies from similar contexts in Northwestern Europe. We identified literature by applying intuitive Boolean searches in Scopus, LubSearch, and Google Scholar. Keywords included “social vulnerability”, “Europe”, and “index”. The search period was set to 2005–2020. In total, we reviewed 11 articles. Variables were noted and clustered into themes.
In close dialogue with our contact person in Halmstad Municipality, we invited 17 stakeholders to an online scoping workshop about capacity needs. Ten stakeholders participated representing different areas of work: climate adaptation, water engineering, social services, risk management, urban planning, and environmental protection. The workshop aimed to establish collaboration and partnership, discuss capacity needs, and scope the context. During the workshop, we co-explored current and future challenges and risks in the municipality. We thereby gained an initial understanding of relevant hazards, past impacts, capacities, and non-climatic drivers. We defined the scope of the social vulnerability assessment together as a group. The researchers then further refined the aims and research questions based on the stakeholder input in order to boost the relevance and usefulness of the research to the problem context.
3.2. Impact chain development: identifying variables and indicators
We engaged stakeholders in a collaborative process to identify variables and indicators for social vulnerability in Halmstad Municipality. The Halmstad Municipality climate adaptation plan and stakeholder inputs from the workshop served as a point of departure in order to ensure context and location-specific relevance. It was an iterative feedback process that built on a close collaboration between the researchers and stakeholders, in which the list of variables and indicators was refined as the process moved along.
We invited 16 representatives from Halmstad Municipality to a second online workshop. In total, eight participants attended. The aim was to continue to co-explore drivers of social vulnerability. We used the digital tools Miro and MentiMeter to support the stakeholder dialogue. We asked the participants to brainstorm about what social groups might render vulnerable in the case of river flooding and coastal inundation in Halmstad Municipality. We divided the participants into smaller groups in which they discussed the political, social, economic, and institutional factors that determine sensitivity and adaptive capacity in Halmstad Municipality. The participants were brought back to the full group to share their main points from their discussions. We asked the participants to justify and elaborate their answers to challenge underlying assumptions.
After the workshop, the research team extracted an initial list of variables for social vulnerability. At this stage, we added variables found in the academic literature to identify gaps that the upcoming data collection had to address. This formed the basis for a survey consisting of 19 variables. The survey consisted of four-point Likert-scale questions. The survey delved into two questions: What social groups are vulnerable in the case of a disruptive event? What social groups might need assistance in the case of a disruptive event?
We shared the survey with the same group of stakeholders in online interviews. Five group interviews were conducted virtually, involving nine municipal representatives. The interviews aimed to further refine the list of variables for social vulnerability, and ensure its contextual relevance. Considering the online format, the survey served as a basis for discussion. Participants were first asked to individually fill out the survey and informed that the results would not be included in the formal analysis but support the full group discussion. We thereafter shared the results with the full group. It was followed by a discussion about the results in which the participants elaborated and justified their answers. No quantitative data were included for analysis. Instead, we extracted variables for social vulnerability from the interview notes and transcripts.
Findings were thereafter consolidated by the researchers into a list of contextually relevant variables for further analysis. We assigned quantitative indicators to the variables.
3.3. Data acquisition and management
Data was collected for the indicators from Statistics Sweden and the Delegation against Segregation (Delmos). Data was gathered for DeSO-areas that consist of 700-2700 inhabitants for 2018. From a total of 56 DeSO-areas in Halmstad Municipality, 41 with complete datasets were considered.
We then collected data for flood exposure. A coastal inundation map was generated for Halmstad Municipality using the results from the NEMO-Nordic model (Hordoir et al., 2018). A flooding map along the Nissan River was obtained from the Swedish Civil Contingencies Agency. Both maps corresponded to storms of a 100-year return period, with sea level rise and land uplift assumed for the year 2,100 under the RCP8.5 climate change scenario.
3.4. Aggregating and normalizing indicators
To mitigate the influence of overlapping variables when determining the social vulnerability index, exploratory factor analysis was conducted to group correlated indicators into a reduced number of factors (Cutter et al., 2003; Holand et al., 2011). Principal component analysis is another commonly applied method to aggregate variables to develop vulnerability indices (Haas et al., 2021; Karagiorgos et al., 2021). We preferred exploratory factor analysis over principal component analysis as it allowed us to interpret the patterns arising from the latent variables instead of only reducing the number of variables (Widaman, 1993). The data reduction was realized by investigating whether the collected indicators were linearly related to a smaller number of factors that account for a particular amount of variance in the observed data. The exploratory factor analysis was conducted in three steps: (i) testing of data adequacy, (ii) determination of the number of factors, and (iii) interpretation of factors.
The Kaiser-Meyer-Olkin Test was applied to the dataset to measure sample adequacy. The obtained score of 0.79 is considered adequate for sample sizes below 100 (Shrestha, 2021). We found the included indicators appropriate for exploratory factor analysis based on Barlett's Test of Sphericity. We carried out a scree-test to determine the appropriate number of factors. Eigenvalues were calculated as the ratio between common and specific variances associated with the extracted factors. Kaiser's Eigenvalue Criterion states that an eigenvalue >one is significant since the associated factor is explained more by the common variance than the specific variance (Shrestha, 2021). Extreme positive and negative loadings were considered as appropriate variables that explain the variability within each factor. We selected the orthogonal approach with the varimax rotation method over the oblique approach to perform factor rotation. It provided results that were easier to interpret and maximized the spread of loadings after extraction (Shrestha, 2021).
Each factor score was then comprised of a sum of indicators that increase or decrease vulnerability, representing either sensitivity or adaptive capacity. We normalized the data from zero to one using a minimum-maximum scaling technique.
To account for flood exposure, we added a factor representing the average distance to areas exposed to inundation. Exposure was not included in the exploratory factor analysis as it is possible to be exposed but not sensitive (IPCC, 2007). We calculated the distance from inundated areas due to extreme storm surges or river discharge by using the buffer tool in ArcMap 10.8. The distances were averaged within each demographic area. Averaging has the limitation that smaller demographic areas near inundation maps are more exposed than larger areas.
3.5. Aggregating vulnerability components
To find social vulnerability index values, individual factor scores were added together. In line with previous research (Tate, 2012), we adopted an equally weighted approach. We presented the standardized normal variables (Z-scores) to highlight the data variability relative to the mean value. We assumed that the results were normally distributed. Areas corresponding to one standard deviation above the mean were considered the most vulnerable.
We then presented the results in a geospatial format. We retrieved the latest GIS layer containing DeSO boundaries from February 2020 from Statistics Sweden (SCB, 2022a). Using Python's libraries GeoPandas and GeoViews, the Z-Score results for each demographic area were merged into their corresponding boundaries in the DeSO geodata and plotted as choropleth maps. Geographic visualizations were produced for the aggregated social vulnerability index values, as well as the individual factors.
3.6. Validation
In spring 2022, we conducted fieldwork in Halmstad Municipality to collect observations of the neighborhoods that scored high and low in the social vulnerability index. It put the findings into context, and helped us to justify the selection of variables and indicators.
Thereafter, an interactive validation workshop was held with seven representatives from Halmstad Municipality. The aim was to share the findings with the stakeholders and gather their feedback for further improvement. We first presented the selected variables, factors, and geospatial visualizations. This was followed by a discussion, in which the participants provided additional information for areas that scored high and low in the social vulnerability index. We then provided the participants with printed impact chains for them to elaborate on the findings and make changes as deemed appropriate.
In the workshop, the stakeholders commended the quality of the results and validated them. No changes were made to the selected variables and indicators. However, the factors were renamed based on stakeholder input. Moreover, the stakeholders provided additional input to the justification of variables and indicators based on their local expertise and experience. It anchored the findings in the local context and improved the accuracy and transparency of the information.
4. Results
In this section, we present the social vulnerability index and its application in Halmstad Municipality. The results section is structured around the impact chain method. We first present findings from the scoping phase, and provide a brief description of Halmstad Municipality. We proceed with introducing the results from the impact chain development process. Variables and indicators were interpreted and extracted from the stakeholder dialogues. Thereafter, the aggregation of indicators is presented followed by the aggregation of vulnerability components. The aggregation of indicators and vulnerability components is accompanied by a visual representation to showcase the spatial distribution of social vulnerability.
We integrate secondary data from the scoping phase throughout the results section. It allows for the empirical data to be presented in a wider societal context, and reduces the risk of individual biases interfering with the results.
4.1. Scoping: about Halmstad municipality
Halmstad Municipality is located in Halland county (see Figure 2) in the southwest of Sweden, with a population of around 105,000. Since 1970, the population has grown by 48% (SCB, 2022b) and it is expected to continue growing (Halmstad Municipality, 2022a). Most inhabitants reside in urban settlements. About half of the households are single-person households (SCB, 2022b). The municipality receives a large influx of tourists every summer, which results in a three fold population increase (Jouper et al., 2019).
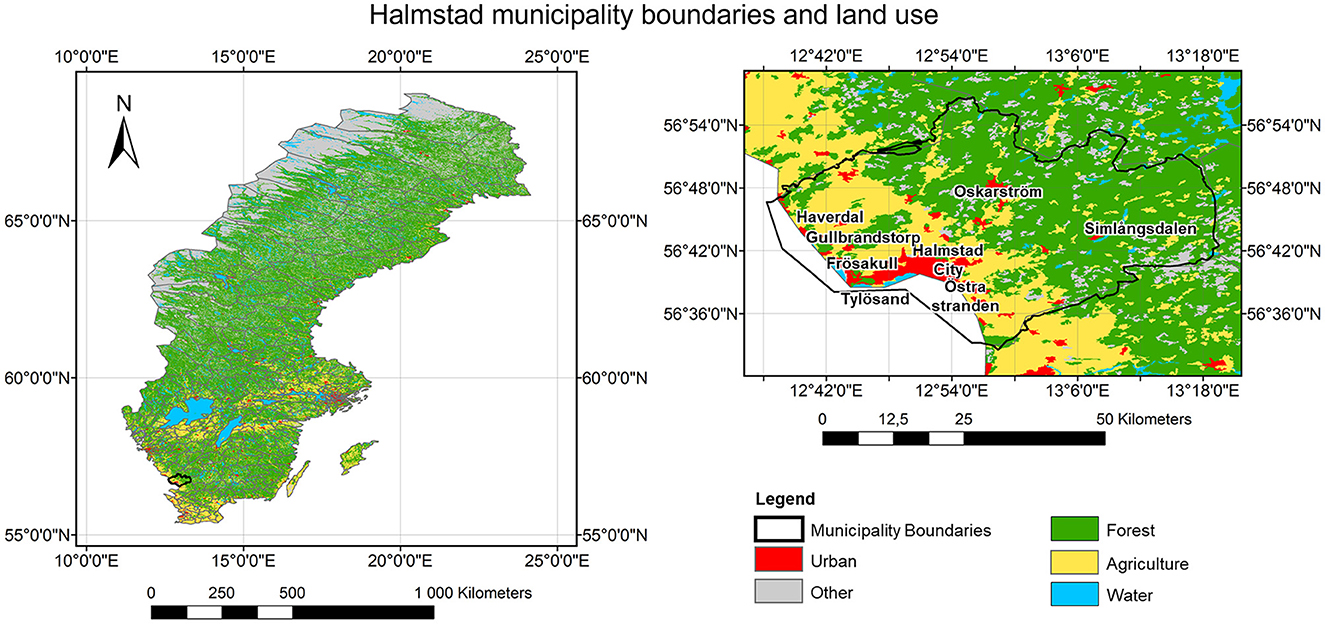
Figure 2. Halmstad municipality (Copernicus, 2018).
In Halmstad Municipality, the average income is less than the Swedish average (SCB, 2022b). In total 14% of the population has a disposable income <60% of the national median. In line with national trends, foreign-born persons are three times more likely to have a disposable income < 60% of the national median (Delmos, 2020a). The biggest employers in the municipality are the regional and municipal administration, the Swedish Armed Forces, Biltema Logistics, Halmstad University, and Martin & Servera Logistics (Halmstad Municipality, 2022a).
Its geographical location makes Halmstad Municipality prone to various natural hazards, including, but not limited to, storm surges, erosion, river flooding, heatwaves, droughts, and heavy precipitation (Jouper et al., 2019). As climate change unfolds, extreme weather events are expected to increase in frequency and magnitude (SMHI, 2014). The municipality is located in Laholmsbukten where there is a local effect triggering extreme water levels. Water levels are 50–100 centimeters higher in Halmstad compared to nearby coastal towns in the case of an extreme weather event (Johansson, 2018).
4.2. Impact chain development: variables and indicators for social vulnerability
From the stakeholder dialogues and interviews, we extracted ten variables for social vulnerability to flooding in Halmstad Municipality. The variables represent human and social capital, access to resources, and exposure. Some variables represent sensitivity (increase vulnerability), whereas others represent adaptive capacity (decrease vulnerability). We assigned one or more indicators for all variables (see Table 2 for an overview).
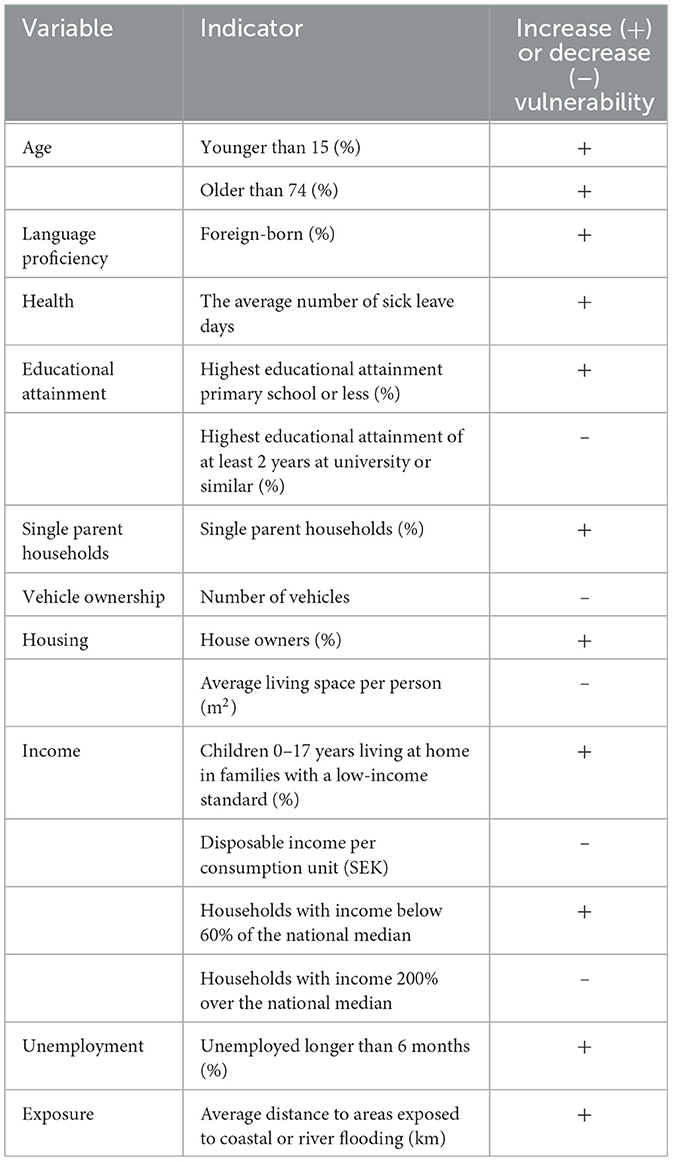
Table 2. Overview of variables and indicators for social vulnerability to flood hazards in Halmstad Municipality.
4.2.1. Age
Stakeholders highlighted the very young and very old as the vulnerable groups in case of flooding due to their dependency on others (e.g., evacuating without support from others), difficulty accessing information, and potential mobility constraints. Haas et al. (2021) suggest considering the percentage of people younger than 15 as an indicator for children when assessing social vulnerability in Sweden. Drawing from epidemiological research, the percentage of people aged 75+ serves as an indicator for the elderly as this age group is more likely to have various health conditions (Tapsell et al., 2002).
4.2.2. Language proficiency
From the stakeholder discussions we identified language as a variable for social vulnerability. It was, for example, argued that language barriers inhibit information access as witnessed during the COVID-19 pandemic. There is, however, no data on language proficiency in Sweden. In line with previous research (Fielding, 2012; Kazmierczak et al., 2015; Koks et al., 2015; Kirby et al., 2019), the percentage of foreign-born persons is used as a proxy indicator for language proficiency. Foreign-born persons may also lack an understanding of the Swedish crisis management system. It was noted during the stakeholder dialogue that foreign-born persons comprise a diverse group with different capacities and sensitivities depending on other intersecting variables such as housing, educational attainment, income, and time of residence in Sweden.
4.2.3. Illness and disability
In line with previous research (Vink et al., 2014; Welle et al., 2014), the stakeholder dialogues revealed that health conditions and impairments increase vulnerability. Some groups depend on others for safety including people with significant mobility impairments, developmental disabilities, intellectual disabilities, and healthcare service users.
We are using the number of sick leave days as an indicator of illness and disability. It indicates the number of people with reduced functional capacity due to illness or disability. It excludes people with minor illnesses or disabilities as they have the functional capacity to take personal responsibility for their safety. The indicator shows the number of days paid by social insurance in relation to the number of people with insurance aged 20–64. It includes paid days with sickness cash benefits, sickness compensation, activity compensation, and rehabilitation allowance (Delmos, 2022).
4.2.4. Educational attainment
Further, it was noted during the dialogues that adults with lower levels of educational attainment have less access to information. Low educational attainment correlates with low income (Cutter et al., 2003; Fekete, 2010; Welle et al., 2014). In line with previous research (Bremberg et al., 2015), two indicators are included: (i) the percentage of people who have completed primary education or less and (ii) the percentage of people who have an educational attainment of at least 2 years of university or similar.
4.2.5. Single parent households
In line with previous research (Garbutt et al., 2015; Sayers et al., 2018), it was noted during the participatory process that single parent households are a potentially vulnerable group. Extreme weather events impose increased demands on parents. Single parents are less likely to share the responsibility with another adult in comparison to co-habiting parents. It increases the dependency on childcare services. The number of single parent households in an area serves as an indicator for this group.
4.2.6. Vehicle ownership
As suggested by previous research (Kazmierczak et al., 2015; Sayers et al., 2018), insights from the stakeholder dialogue suggested that owning a vehicle reduces social vulnerability as it can facilitate the evacuation of people and goods. We use the number of vehicles per capita in an area as an indicator.
4.2.7. Housing
House owners have greater responsibilities than apartment dwellers in the case of flooding. Apartment dwellers can rely on their housing association for proactive and reactive flood risk management. Costs and benefits are shared in a larger group compared to house owners, who have the legal responsibility for protecting their property against natural hazards. We used an indicator that includes the percentage of house owners in an area.
4.2.8. Income
In line with previous research (Holand et al., 2011; Rød et al., 2012; Breil et al., 2018; Fekete, 2019), income was identified as a critical variable for determining social vulnerability. Households below average income have less capacity to cope in the case of a crisis as they have fewer financial resources to invest in efforts toward flood risk management. To assess income, we included four indicators: (i) households with an income <60% of the national median, (ii) households with an income >200% of the national median, (iii) disposable income, and (iv) children living in households below the poverty threshold.
4.2.9. Unemployment
In line with previous research (Aroca-Jimenez et al., 2017; Breil et al., 2018; Nikkanen et al., 2021), insights from the stakeholder dialogue suggested that people in long-term unemployment are less likely to have the financial resources to cope in the event of a flood. To assess long-term unemployment, we included an indicator that considered those unemployed longer than 6 months [as defined by SCB (2020a)].
4.2.10. Exposure
Human exposure to flooding was highlighted as an important variable for social vulnerability. Flood exposure can translate to social and economic impacts. As mentioned earlier, we use the average distance to areas exposed to river floods and coastal inundation as an indicator.
4.2.11. Gender
When interpreting the empirical data, we found conflicting findings with regard to gender and its impact on social vulnerability to flooding. During the analysis, we decided to exclude gender as a variable for social vulnerability to flooding in Sweden. Gender might play an important role when assessing social vulnerability to other hazards. During the interviews, some stakeholders from Halmstad Municipality identified men and women as vulnerable in the event of a flood. However, these differentiated vulnerabilities were attributed to variables of vulnerabilities already included in our study: women have more caring responsibilities and lower incomes. In line with earlier research (Jonkman and Kelman, 2005; Doocy et al., 2013; Salvati et al., 2018), it was noted that men are overrepresented in flood-related causalities due to risk-taking behavior.
This is in line with the literature on social vulnerability in Nordic countries. Gender is an important determinant of vulnerability in some contexts (Fekete, 2010; Vink et al., 2014; Garbutt et al., 2015), whereas in other contexts it is not (Holand and Lujala, 2013; Drakes and Tate, 2022). Nordic countries rank among the most gender equal in the world. It reduces the role of gender in determining vulnerability (Holand et al., 2011). Variations within genders appear greater than variations across genders due to intersecting variables related to for example class, ethnicity, and physical and mental ability (Ajibade et al., 2013; Rufat et al., 2015).
4.3. Aggregation of indicators
We performed a scree test to generate a composite index from the selected variables and indicators. The scree plot identified three factors according to the Kaiser criterion for retaining factors. This amount was applied to generate a loading table for further analysis (see Table 3). The analysis reduces the indicators into three factors consisting of correlated indicators for sensitivity and adaptive capacity.
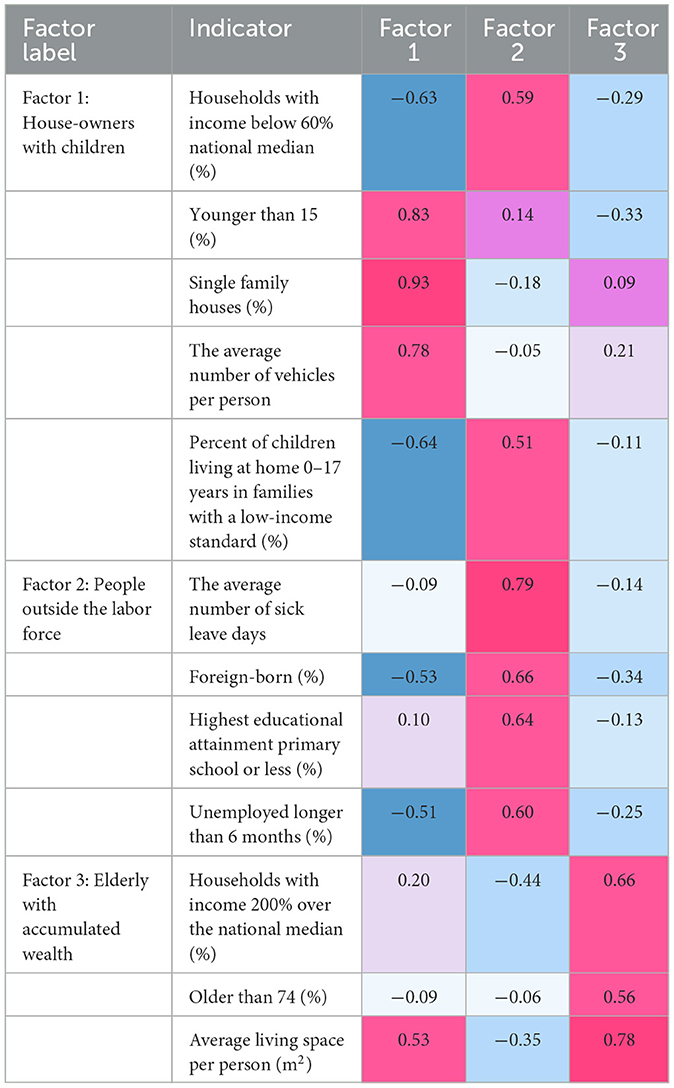
Table 3. Factor analysis loadings.
Table 3 shows the social vulnerability index and its factor labels, dominant variables, and factor loadings. The factors account for 70% of the cumulative variability. The first factor, which we named “House-owners with children”, explains 32% of the dataset variability and is characterized by a high incidence of single-family houses, people below 15 years old, a higher number of vehicles per residence, and low presence of households with income below 60% national median. The second factor, which we called “People outside the labor force”, explains 23% of the variance found in the dataset and is dominated by a large number of sick leave days, foreign-born people, highest educational attainment primary school or less, households with income below 60% national median, and unemployment. The third factor was labeled “Elderly with accumulated wealth”, and represents 15% of the dataset variability. It consists of households with an income of >200% of the national median, people with larger living spaces, and people aged 75+.
The spatial distribution for each factor is illustrated in Figure 3. Blue indicates decreased vulnerability, red indicates increased vulnerability, and dark gray indicates missing data. Even though the adopted indicators characterize vulnerability, factor labels are considered neutral and describe major societal groups in the municipality. These groups could be more or less vulnerable depending on their specific indicators. Therefore, vulnerability results are interpreted according to their absolute numerical values, where positive values are more vulnerable and negative numbers are less vulnerable, for every factor label. The main characteristics of each factor and their vulnerability hotspots within municipality areas are described next.

Figure 3. Separate factor relative vulnerability distributions in Halmstad Municipality.
4.3.1. First factor—House-owners with children
The first factor, “House-owners with children”, scored high in rural areas and small towns. Only 30% of the population in Halmstad Municipality lives outside the city of Halmstad (Halmstad Municipality, 2022b). Most land is used for agriculture or forestry (Copernicus, 2018). Most households are located far from the commercial center. Most households reside in single family houses (Delmos, 2020b). Many residents own a vehicle (SCB, 2021a), due to the long distance to municipal services and employment opportunities.
4.3.2. Second factor—People outside the labor force
The second factor, “People outside the labor force”, presented the highest level of vulnerability. In this factor, the eastern part of Halmstad scored high. Most neighborhoods were built during the 1965–1975 wave of great investment in housing (also known as the Million Housing Program) (National Board of Housing, 2022). At this point, most urban planning applied the SCAFT Guidelines 1968—principles for urban planning for road safety. To stimulate safety, residential areas were designed as low-traffic neighborhoods. This has implications for response efforts, as rescue services struggle to enter and exit the residential area (The Swedish Police Authority, 2015). Most inhabitants reside in rental apartments. Unemployment is twice the municipal average (Delmos, 2020c). Around half of the inhabitants have a low economic income (Delmos, 2020a). Foreign-born persons make up a majority of the population (SCB, 2021b).
Östra Stranden also scored high. Östra Stranden is characterized by tourism and summer houses. Few people have their permanent residence at Östra Stranden. In the low tourist season, summer houses are often sublet. Sublet agreements are often poor, attracting students and others struggling to find accommodation. Östra Stranden endures high exposure to coastal and fluvial floods. Risk and vulnerability assessments show that flooding may cut off Östra Stranden from critical infrastructures and their services, which has serious implications for emergency services (Halmstad Municipality, 2022c).
Oskarström also scored high. With a population of 4,157 (SCB, 2020b), Oskarström is the second-largest locality in the municipality. Around 17% have an income <60% of the national median income (Delmos, 2020a). Most have completed upper-secondary education, whereas few have a post-secondary education from a university or similar (Delmos, 2020d). Most inhabitants are born in Sweden (SCB, 2021b).
4.3.3. Third factor—Elderly with accumulated wealth
The final factor, “Elderly with accumulated wealth”, presented the lowest level of vulnerability. This factor is dominated by the western part of the municipality close to the coast. The coastal neighborhoods attract residents with an income above the national median (Delmos, 2020a). In the summer season, the population exponentially increases due to an influx of tourists (Halmstad Municipality, 2022c). Most reside in single-family houses (Delmos, 2020b).
4.3.4. Fourth factor—Exposure
As expected, we found that flood exposure within Halmstad Municipality was higher in areas near the coast and the Nissan River (Figures 4A, B). In general, the most populated neighborhoods are located in these risk areas and host major residential and commercial activities. Touristic beaches are subject to coastal inundation. Surrounding rural areas stand out as the least exposed to flooding.
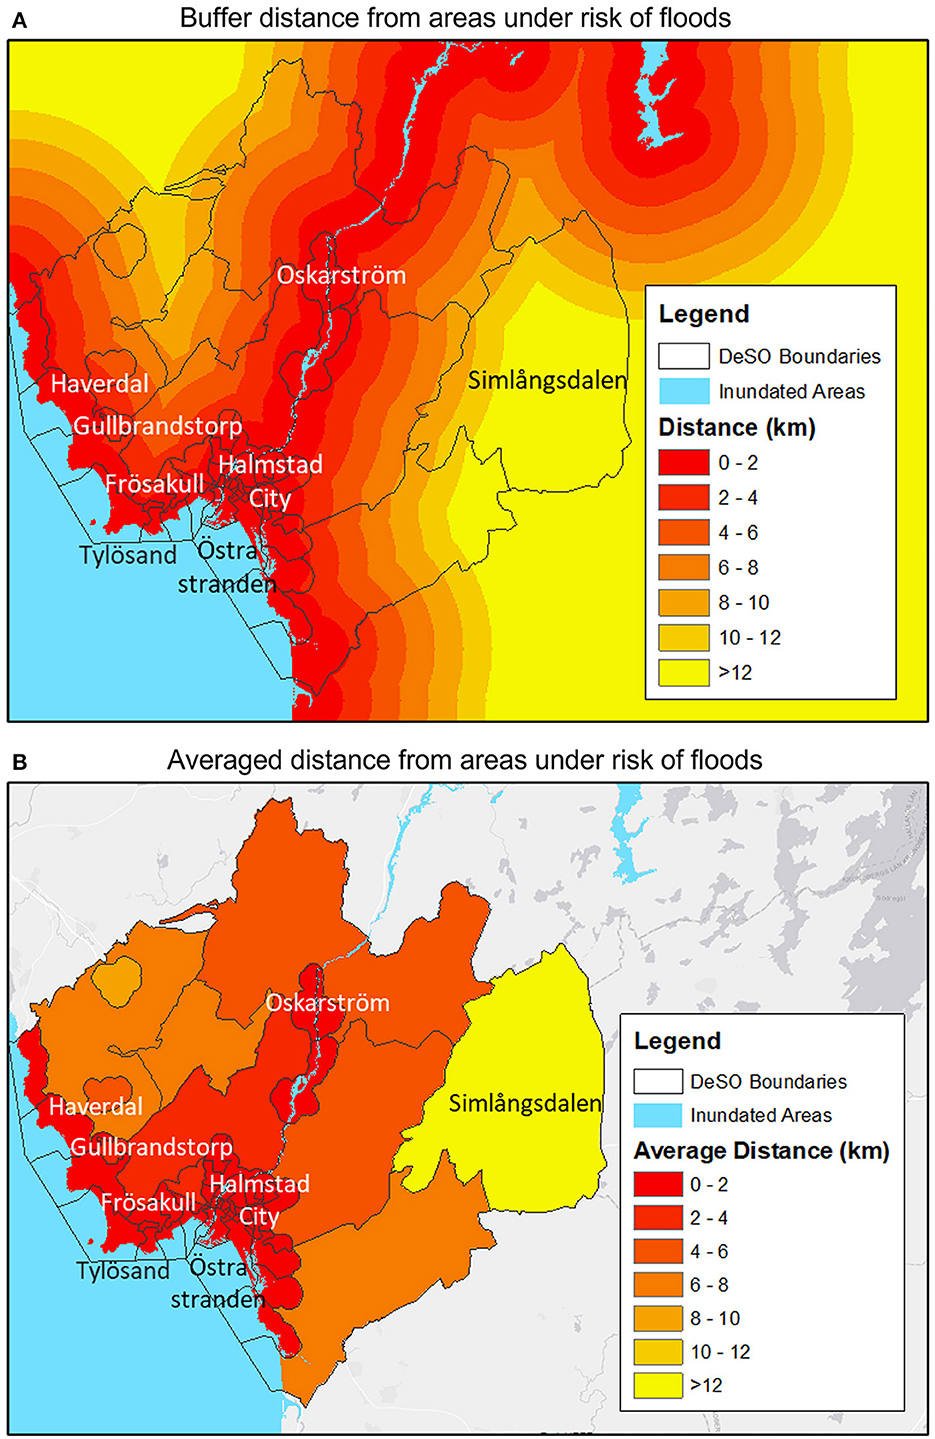
Figure 4. (A) Buffer distance to inundated areas. (B) Average distance to inundated areas.
4.4. Aggregation of vulnerability components
The aggregated social vulnerability index score is illustrated in Figure 5, visualizing the spatial distribution of social vulnerability in Halmstad Municipality. The Nissan River runs through Halmstad, dividing the city into two areas with clear socioeconomic differences. Citizens residing in the eastern neighborhoods have less education, income, and employment opportunities in comparison to those living in their western counterparts (Delmos, 2020e).
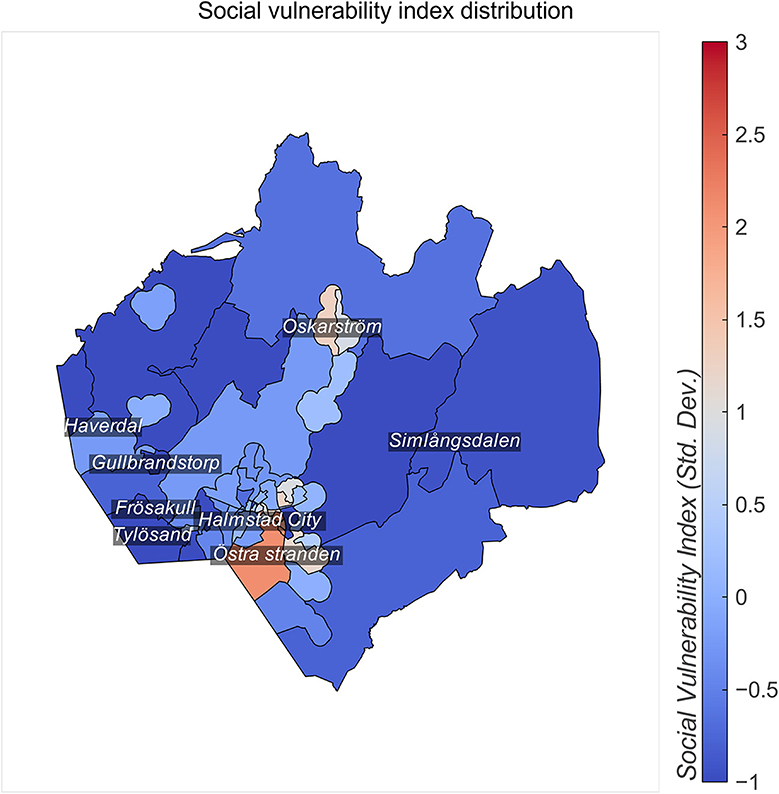
Figure 5. Social vulnerability index distribution in Halmstad Municipality.
The results vary from −1.7 standard deviations to 2.1 standard deviations. Eleven DeSO-areas are considered the most vulnerable as they have standard deviations > +1. Neighborhoods with high levels of vulnerability have 21,910 inhabitants, and account for 22% of the total population.
5. Discussion
In this section, we discuss the findings and research process. First, we juxtapose the findings from developing and applying a social vulnerability index to floods at a sub-municipal level in Sweden against earlier social vulnerability and justice research. We pay special attention to the exposure and vulnerability paradox. Thereafter, we proceed with discussing the methodological contributions of combining bottom-up stakeholder involvement and top-down statistical analysis, ensuring fine-grained spatial data, and utilizing the impact chain method.
5.1. Mapping social vulnerability to uncover spatial injustices
In Sweden, the social dimension of flood risk remains understudied despite that growing socioeconomic inequality is expected to spur increases in social vulnerability. We address this gap by developing and applying a local social vulnerability index. In line with previous research (Roncancio and Nardocci, 2016; Sayers et al., 2018; Kim and Bostwick, 2020), the application of the social vulnerability index shows an uneven spatial distribution of social vulnerability that reflects the overall pattern of societal inequality and development. It uncovers injustices faced by the vulnerable segments of the population, and acknowledges the importance of considering the social dimension for flood risk management and climate adaptation to be effective, efficient, and equitable.
As stressed in the Vulnerability Sourcebook (Fritzsche et al., 2014), it is critical to involve stakeholders with local expertise and experience when assessing vulnerability. We identified variables and indicators for social vulnerability in close collaboration with stakeholders representing different departments in the municipal administration. The choice of variables and indicators for social vulnerability reflected the local context with respect to the vulnerability dimensions expressed by the stakeholders, but was also justified by earlier literature on social vulnerability to flooding in other countries in Northwestern Europe. Our findings show that social vulnerability depends on personal finances and resources, functional capacity, skills and knowledge, social capital, and housing. Some indicators stand in conflict to earlier top-down social vulnerability assessments. For example, both Haas et al. (2021) and Karagiorgos et al. (2021) include renters as an indicator of vulnerability. Little justification is provided other than references to academic literature, of which most studies were taking place in the United States before 2015 (Morrow, 1999; Cutter et al., 2003; Collins and Bolin, 2009; Gaither et al., 2011, 2015; Poudyal et al., 2012; Rufat et al., 2015; Wigtil et al., 2016; Davies et al., 2020). In this paper, we include house owners as an indicator of vulnerability as they have the legal obligation to protect their property (Planning and Building Act, 2010). House owners are alone bearing the financial burden in the case of a flood whereas renters or apartment dwellers can share the cost.
We found that many areas that score low in social vulnerability endure high exposure to floods, despite that the environmental justice literature asserts that marginalized and disadvantaged groups endure disproportionate flood exposure (Walker and Burningham, 2011; Fielding, 2012; Breil et al., 2018). In Sweden, people with a higher income, and therefore adaptive capacity, tends to settle near the waterfront despite the risk of river and coastal flooding (Delmos, 2020a). That is, there is little association between flood exposure and indicators of social vulnerability. Similar patterns are found in the United States (Chakraborty et al., 2014). That leads us to conclude that vulnerability is not the product of merely exposure, but also depends on sensitivity and adaptive capacity (Collins et al., 2018). Social vulnerability is a pre-existing condition influencing the human-hazard interaction rather than an outcome of a hazard event (Drakes and Tate, 2022). Social vulnerability exists irrespective of a hazard and illustrates societal injustices and inequities. Human exposure can bring societal inequalities to light, and trigger cascades beyond the inundated area itself. For example, flooding can reduce performance of infrastructures that may trigger cascading disruptions beyond the inundated area (Alexander and Pescaroli, 2019; Arrighi et al., 2020) ultimately exposing new groups to service and infrastructure disruptions.
5.2. Methodological contributions
This study makes a methodological contribution by assessing social vulnerability using a combined bottom-up and top-down approach that captures municipal nuances better than national-level assessments. We put a strong emphasis on stakeholder involvement to ensure that the choice of indicators for social vulnerability represented the political, institutional, economic, and social context experienced by the local community. Local stakeholders were engaged representing the municipality in an open and transparent scientific process with the ambition to prompt procedural justice. In theory, collaborative stakeholder engagement can bring about contextual relevance; yield intangible co-benefits such as strengthened social networks and trust, improved organizational capacity, and social learning; improve research legitimacy and uptake; and in the end bridge research and practice (Wall et al., 2017; Daniels et al., 2020; Menk et al., 2022). However, evaluations are recommended to investigate the participatory process and its impact on procedural justice and whether any intangible co-benefits emerge. We also suggest that future research engages disadvantaged groups when constructing social vulnerability indices and impact chains to prompt procedural justice for the most vulnerable segments of the population.
As noted in the section above, identifying social vulnerability indicators from the bottom-up produces different results compared to top-down approaches. It challenges previous top-down assessments building on academic literature, and highlights differences between countries and their vulnerability contexts. In line with previous research (Holand and Lujala, 2013), we argue that social vulnerability indices must be carefully modified and contextualized through close dialogue with local stakeholders before being replicated in a new context.
We argue that future social vulnerability indices must build on fine-grained spatial data in order to effectively inform policy and practice. In Sweden, municipalities have the primary responsibility for identifying, reducing, and addressing flood risk (Bynander and Becker, 2017; van Well et al., 2018). Local level assessments employing fine-grained spatial data produce findings in a more appropriate scale and resolution for municipalities, thus facilitating the process of transforming knowledge into policy and practice (Ernst et al., 2019; Daniels et al., 2020; André et al., 2021).
Besides its operational benefits, fine-grained spatial data also better locates the vulnerable segments of the population. We find significant differences in sensitivity and adaptive capacity across neighborhoods in Halmstad Municipality, whereas spatial variations in social vulnerability within the municipality remain by and large unnoticed in earlier top-down assessments (Haas et al., 2021; Karagiorgos et al., 2021). In line with previous research (Wood et al., 2010), we find that larger census areal units produce ecological fallacy i.e., attributing group characteristics to an individual. It can spur discrimination and injustices if assuming that individuals have certain characteristics or behaviors due to the group they belong to. It can produce an unjust and inefficient distribution of resources for flood risk management, ultimately entrenching vulnerabilities and inequalities.
However, using fine-grained spatial data also comes with challenges. We encountered limitations regarding the data input. The social vulnerability index builds on open access data to ensure procedural justice and transparency, as well as stimulate further refinement and application. Open access data is, however, limited for DeSO-areas. In addition, data on specific indicators were missing for some DeSO-areas. Census data only include registered citizens, hence excluding potential vulnerable groups such as tourists, undocumented migrants, and the homeless. Also, census data show where citizens have their residence not their actual location in the case of a disruptive event. The question also remains as to whether the suggested social vulnerability index can explain situations beyond Halmstad Municipality. Future research is needed to test the social vulnerability index across spatial scales and contribute to further refinement and validation, at the end supporting the implementation of socially-just flood risk management and climate adaptation.
To develop the social vulnerability index we followed the impact chain method outlined in the Vulnerability Sourcebook (Fritzsche et al., 2014). While the method identifies knowledge, technology, institutions, and the economy as drivers of vulnerability, it provides limited attention to disadvantaged and marginalized groups (Fritzsche et al., 2014). This study shows that it can support social vulnerability assessment processes by capturing the multidimensional, time-dependent, and situational factors that determine social vulnerability, and thus go beyond climatic and technical factors. The practical and standardized step-by-step approach thus appear to be applicable for various sectors and topics, geographical scales, and time horizons, and it can help stakeholders and researchers to disentangle social vulnerability and its complexities. The impact chain method can anchor the social vulnerability index in the local context, define measurable indicators, describe and visualize vulnerability pathways, and provide a sound knowledge base for disaster risk reduction and climate adaptation.
6. Conclusions
In this paper, we present a social vulnerability index for flooding in Sweden. We complement earlier research by assessing social vulnerability using a combined bottom-up and top-down approach with an emphasis on stakeholder involvement and local context. When mapping the social vulnerability index scores, we find pronounced injustices arising from the uneven distribution of social vulnerability across neighborhoods and groups. It highlights that flood risk assessments must go beyond climatic and technical parameters and consider people and their vulnerabilities, in order to design just risk reduction strategies and avoid reproducing inequalities.
The social vulnerability index can support Swedish flood risk management policy and practice, and prompt socially just-informed decision-making processes. Social vulnerability indices can guide decisions and investments in disaster risk reduction by identifying and locating vulnerable populations. It can shed light on distributional injustices, and spur actions toward just and equitable flood risk management in which no one is left behind. The social vulnerability index can also support monitoring and evaluation, and provide conclusions on whether policies and actions are effective–or not—in addressing the vulnerability of different social groups. It can help to avoid producing or reproducing injustices, and prevent other maladaptive outcomes such as gentrification and entrenched inequalities.
Our findings add to the body of research investigating social vulnerability. We make a significant contribution to Swedish flood risk management, by shedding light on the social dimension that constitutes flood risk. Above all, this can strengthen the justice and disaster risk reduction nexus and improve overall flood risk management.
Data availability statement
The raw data supporting the conclusions of this article will be made available by the authors, without undue reservation.
Author contributions
ME: conceptualization, methodology, validation, formal analysis, investigation, writing—original draft, writing—review, editing, and supervision. MV: methodology, formal analysis, writing—original draft, and writing—review and editing. KA: methodology, investigation, writing—original draft, writing—review and editing, project administration, and funding acquisition. ÅG and KB: writing—review and editing, project administration, and funding acquisition. LS: conceptualization, writing—review and editing, and funding acquisition. All authors contributed to the article and approved the submitted version.
Funding
This work derives from the projects HydroHazards, CrisAct, and UNCHAIN. HydroHazards was funded by the Swedish Civil Contingencies Agency (MSB) and FORMAS. CrisAct was funded by the Swedish Research Council—VR project 2021-06309. UNCHAIN: Unpacking Climate Impact Chains was funded through the EU funding mechanisms Joint Programming Initiative (JPI) and Assessment of Cross (X)-sectoral climate impacts and pathways for Sustainable transformation (AXIS), with support from the EU (Grant No. 776608). All UNCHAIN partners are granted financial support through their national funding agency, of which the Stockholm Environment Institute received support from FORMAS (SE) (2018-02737) and the EU (Grant No. 776608).
Acknowledgments
We thank Hanna Billmayer from Halmstad Municipality for her support and input. We thank Aline Regnell for her support in collecting data. We are grateful to all informants who participated in the study. We also thank the three reviewers for their valuable feedback.
Conflict of interest
The authors declare that the research was conducted in the absence of any commercial or financial relationships that could be construed as a potential conflict of interest.
Publisher's note
All claims expressed in this article are solely those of the authors and do not necessarily represent those of their affiliated organizations, or those of the publisher, the editors and the reviewers. Any product that may be evaluated in this article, or claim that may be made by its manufacturer, is not guaranteed or endorsed by the publisher.
References
Ajibade, I., McBean, G., and Bezner-Kerr, R. (2013). Urban flooding in Lagos, Nigeria: Patterns of vulnerability and resilience among women. Global Environ. Change 23, 1714–1725. doi: 10.1016/j.gloenvcha.2013.08.009
Alexander, D., and Pescaroli, G. (2019). What are cascading disasters? UCL Open Eviron. 1. doi: 10.14324/111.444/ucloe.000003
André, K., Järnberg, L., Gerger Swartling, Å., Berg, P., Segersson, D., Amorim, J. H., et al. (2021). Assessing the Quality of Knowledge for Adaptation–Experiences From Co-designing Climate Services in Sweden. Front. Clim. 3, 1–12. doi: 10.3389/fclim.2021.636069
Armaṣ, I., and Gavriṣ, A. (2013). Social vulnerability assessment using spatial multi-criteria analysis (SEVI model) and the Social Vulnerability Index (SoVI model) – a case study for Bucharest, Romania. Nat. Hazards Earth Syst. Sci. 13, 1481–1499. doi: 10.5194/nhess-13-1481-2013
Aroca-Jimenez, E., Bodoque, J. M., Garcia, J. A., and Diez-Herrero, A. (2017). Construction of an integrated social vulnerability index in urban areas prone to flash flooding. Nat. Hazards Earth Syst. Sci. 17, 1541–1557. doi: 10.5194/nhess-17-1541-2017
Arrighi, C., Pregnolato, M., and Castelli, F. (2020). Indirect Flood Impacts and Cascade Risk Across Interdependent Linear Infrastructures. Natural Hazards and Earth System Sciences. doi: 10.5194/nhess-2020-371
Bankoff, G. (2018). Blame, responsibility and agency: ‘Disaster justice' and the state in the Philippines. Environ. Plann. E 1, 363–381. doi: 10.1177/2514848618789381
Beccari, B. (2016). A comparative analysis of disaster risk, vulnerability and resilience composite indicators. PLoS Curr. 8, ecurrents.dis.453df025e34b682e9737f95070f9b970. doi: 10.1371/currents.dis.453df025e34b682e9737f95070f9b970
Benzie, M. (2014). Social Justice and Adaptation in the UK. EandS 19, art39. doi: 10.5751/ES-06252-190139
Birkmann, J., Cardona, O. D., Carreño, M. L., Barbat, A. H., Pelling, M., Schneiderbauer, S., et al. (2013). Framing vulnerability, risk and societal responses: the MOVE framework. Nat. Hazards 67, 193–211. doi: 10.1007/s11069-013-0558-5
Breil, M., Downing, C., Kazmierczak, A., Mäkinen, K., and Romanovska, L. (2018). Social vulnerability to climate change in European cities - state of play in policy and practice. European Topic Centre on Climate Change impacts, Vulnerability and Adaptation (ETC/CCA).
Bremberg, E., Slättman, H., and Alarcón, P. (2015). Skillnadernas Stockholm: Kommissionen för ett socialt hållbart Stockholm. Stockholm: Stockholms stad.
Bremer, S., Wardekker, A., Jensen, E. S., and van der Sluijs, J. P. (2021). Quality Assessment in Co-developing Climate Services in Norway and the Netherlands. Front. Clim. 3, 627665. doi: 10.3389/fclim.2021.627665
Brooks, N. (2003). Vulnerability, risk and adaptation: A conceptual framework, Tyndall Centre Working Paper No. 38. Tyndall Centre for Climate Change Research and Centre for Social and Economic Research on the Global Environment (CSERGE) School of Environmental Sciences, Norwich.
Bullard, R. D. (2008). Differential vulnerabilities: environmental and economic inequality and government response to unnatural disasters. Soc. Res. 75, 753–784. doi: 10.1353/sor.2008.0035
Bynander, F., and Becker, P. (2017). “The system for crisis management in sweden: collaborative, conformist, contradictory,” in Chapter 4: Handbook of Disaster Risk Reduction and Management. World Scientific, eds. N., Christian, C. H. Kuei 69–95 (New York: Routledge). doi: 10.1142/9789813207950_0004
Chakraborty, J., Collins, T. W., Montgomery, M. C., and Grineski, S. E. (2014). Social and spatial inequities in exposure to flood risk in Miami, Florida. Nat. Hazards Rev. 15, 04014006. doi: 10.1061/(ASCE)NH.1527-6996.0000140
Chakraborty, L., Rus, H., Henstra, D., Thistlethwaite, J., and Scott, D. (2019). A place-based socioeconomic status index: Measuring social vulnerability to flood hazards in the context of environmental justice. Int. J. Disaster Risk Red. 43, 101394. doi: 10.1016/j.ijdrr.2019.101394
Collins, T. W., and Bolin, B. (2009). Situating hazard vulnerability: people's negotiations with wildfire environments in the U.S. Southwest. Environ. Manage. 44, 441–455. doi: 10.1007/s00267-009-9333-5
Collins, T. W., Grineski, S. E., and Chakraborty, J. (2018). Environmental injustice and flood risk: A conceptual model and case comparison of metropolitan Miami and Houston, USA. Reg. Environ. Change 18, 311–323. doi: 10.1007/s10113-017-1121-9
Copernicus (2018). CORINE Land Cover — Copernicus Land Monitoring Service [WWW Document]. Available online at: https://land.copernicus.eu/pan-european/corine-land-cover (accessed October 25, 22).
Cutter, S. L. (1996). Vulnerability to environmental hazards. Progr. Human Geogr. 20, 529–539. doi: 10.1177/030913259602000407
Cutter, S. L., Boruff, B., and Shirley, W. (2003). Social Vulnerability to Environmental Hazards. Soc. Sci. Quart. 84, 242–261. doi: 10.1111/1540-6237.8402002
Cutter, S. L., Emrich, C. T., Webb, J., and Morath, D. (2009). Social Vulnerability to Climate Variability Hazards: A Review of the Literature. Hazards and Vulnerability Research Institute, University of South Carolina, Columbia.
Cutter, S. L., and Finch, C. (2008). Temporal and spatial changes in social vulnerability to natural hazards. Proc. Natl. Acad. Sci. U.S.A. 105, 2301–2306. doi: 10.1073/pnas.0710375105
Cvitanovic, C., Howden, M., Colvin, R. M., Norström, A., Meadow, A. M., and Addison, P. F. E. (2019). Maximising the benefits of participatory climate adaptation research by understanding and managing the associated challenges and risks. Environ. Sci. Policy 94, 20–31. doi: 10.1016/j.envsci.2018.12.028
Daniels, E., Bharwani, S., Gerger Swartling, Å., Vulturius, G., and Brandon, K. (2020). Refocusing the climate services lens: Introducing a framework for co-designing “transdisciplinary knowledge integration processes” to build climate resilience. Clim. Serv. 19, 1–15. doi: 10.1016/j.cliser.2020.100181
Davies, T., Mead, S., Bebbington, M., Dunant, A., Harmsworth, G., Harte, D., et al. (2020). Multi-Hazard Risk Model, Flooding Case Study: Selection of River System and Potential Hazard Cascades. Technical Report.
de Loyola Hummell, B. M., Cutter, S. L., and Emrich, C. T. (2016). Social Vulnerability to Natural Hazards in Brazil. Int. J. Disaster Risk Sci. 7, 111–122. doi: 10.1007/s13753-016-0090-9
Delmos (2020a). Statistiklabbet - Andel personer med låg respektive hög ekonomisk standard (2020) [WWW Document]. Segregationsbarometern. Available online at: https://segregationsbarometern.delmos.se/labbet/#/statistiklabbet/map?indicator=2-1,2andlocation=kommun (accessed February 10, 2022).
Delmos (2020b). Statistiklabbet - Andel boende per upplåtelseform (2018) [WWW Document]. Segregationsbarometern. Available online at: https://segregationsbarometern.delmos.se/labbet/#/statistiklabbet/map?indicator=6-8,9,10,11andlocation=kommun (accessed February 10, 2022).
Delmos (2020c). Statistiklabbet - Andel arbetslösa längre än sex månader (2020) [WWW Document]. Segregationsbarometern. Available online at: https://segregationsbarometern.delmos.se/labbet/#/statistiklabbet/map?indicator=16andlocation=kommun (accessed February 10, 2022).
Delmos (2020d). Statistiklabbet - Utbildningsnivå 2020 [WWW Document]. Segregationsbarometern. Available online at: https://segregationsbarometern.delmos.se/labbet/#/statistiklabbet/map?indicator=20-12,13,14,15,16andlocation=kommun (accessed February 10, 2022).
Delmos (2020e). Halmstad [WWW Document]. Segregationsbarometern. Available online at: https://segregationsbarometern.delmos.se/kommun/halmstad/ (accessed February 10, 2022).
Delmos (2022). Statistiklabbet - Genomsnittligt antal ohälsodagar (2008-2019) i dagar [WWW Document]. Segregationsbarometern. Available online at: https://segregationsbarometern.delmos.se/labbet/#/statistiklabbet/table?indicator=19andlocation=kommun (accessed February 10, 2022).
Doocy, S., Daniels, A., Murray, S., and Kirsch, T. D. (2013). The human impact of floods: a historical review of events 1980-2009 and systematic literature review. PLoS Curr. 5, ecurrents.dis.f4deb457904936b07c09daa98ee8171a. doi: 10.1371/currents.dis.f4deb457904936b07c09daa98ee8171a
Drakes, O., and Tate, E. (2022). Social vulnerability in a multi-hazard context: a systematic review. Environ. Res. Lett. 17, 5140. doi: 10.1088/1748-9326/ac5140
El-Zein, A., Ahmed, T., and Tonmoy, F. (2021). Geophysical and social vulnerability to floods at municipal scale under climate change: The case of an inner-city suburb of Sydney. Ecol. Indic. 121, 106988. doi: 10.1016/j.ecolind.2020.106988
Eriksson, J., Juhl, A.-K., Wikström, T., and Rinne, A. (2011). Vägledning för risk- och sårbarhetsanalyser. Karlstad: Swedish Civil Contingencies Agency.
Ernst, K. M., Swartling, Å. G., André, K., Preston, B. L., and Klein, R. J. T. (2019). Identifying climate service production constraints to adaptation decision-making in Sweden. Environ. Sci. Policy 93, 83–91. doi: 10.1016/j.envsci.2018.11.023
Fekete, A. (2010). Assessment of Social Vulnerability for River-Floods in Germany (PhD Thesis). Köln - University of Applied Sciences, Köln.
Fekete, A. (2019). Social vulnerability change assessment: monitoring longitudinal demographic indicators of disaster risk in Germany from 2005 to (2015). Nat. Hazards 95, 585–614. doi: 10.1007/s11069-018-3506-6
Fielding, J. L. (2012). Inequalities in exposure and awareness of flood risk in England and Wales. Disasters 36, 477–494. doi: 10.1111/j.1467-7717.2011.01270.x
Fritzsche, K., Schneiderbauer, S., Bubeck, P., Kienberger, S., Buth, M., Zebisch, M., et al. (2014). The Vulnerability Sourcebook: Concept and guidelines for standardized vulnerability assessments. Deutsche Gesellschaft für Internationale Zusammenarbeit (GIZ) GmbHGIZ, Germany.
Gaither, C., Goodrick, S., Murphy, B., and Poudyal, N. (2015). An Exploratory Spatial Analysis of Social Vulnerability and Smoke Plume Dispersion in the U.S. South. Forests 6, 1397–1421. doi: 10.3390/f6051397
Gaither, C. J., Poudyal, N. C., Goodrick, S., Bowker, J. M., Malone, S., and Gan, J. (2011). Wildland fire risk and social vulnerability in the Southeastern United States: An exploratory spatial data analysis approach. Forest Policy Econ. 13, 24–36. doi: 10.1016/j.forpol.2010.07.009
Garbutt, K., Ellul, C., and Fujiyama, T. (2015). Mapping social vulnerability to flood hazard in Norfolk, England. Environ. Hazards 14, 156–186. doi: 10.1080/17477891.2015.1028018
Guldåker, N. (2009). Krishantering, hushåll och stormen Gudrun: att analysera hushålls, krishanteringsförmåga och sårbarheter (PhD thesis). Lunds University, Lund.
Haas, J., Karagiorgos, K., Pettersson, A., de Goër de Herve, M., Gustavsson, J., Koivisto, J., et al. (2021). Social sårbarhet för klimatrelaterade hot: Delstudie 2: Generella och hotspecifika index för social sårbarhet i Sverige (No. MSB1978 – maj 2022). MSB, Karlstad.
Hagenlocher, M., Hölbling, D., Kienberger, S., Vanhuysse, S., and Zeil, P. (2016). Spatial assessment of social vulnerability in the context of landmines and explosive remnants of war in Battambang province, Cambodia. Int. J. Disaster Risk Reduct. 15, 148–161. doi: 10.1016/j.ijdrr.2015.11.003
Halmstad Municipality (2022a). Statistik [WWW Document]. Halmstad. Available online at: https://www.halmstad.se/kommunochpolitik/kommunfakta/statistik.n2412.html (accessed October 22, 2022).
Halmstad Municipality (2022b). Halmstad tätort [WWW Document]. Halmstad. Available online at: https://www.halmstad.se/halmstadvaxer/halmstadstatort.n3952.html (accessed October, 2022).
Halmstad Municipality (2022c). Framtidsplan 2050: kommunens översiktsplan. Halmstad: Halmstad Municipality
Hansson, S., and Polk, M. (2018). Assessing the impact of transdisciplinary research: The usefulness of relevance, credibility, and legitimacy for understanding the link between process and impact. Res. Eval. 27, 132–144. doi: 10.1093/reseval/rvy004
Holand, I. S., and Lujala, P. (2013). Replicating and adapting an index of social vulnerability to a new context: a comparison study for Norway. Profess. Geogr. 65, 312–328. doi: 10.1080/00330124.2012.681509
Holand, I. S., Lujala, P., and Rød, J. K. (2011). Social vulnerability assessment for Norway: A quantitative approach. Norsk Geografisk Tidsskrift - Norwegian J. Geogr. 65, 1–17. doi: 10.1080/00291951.2010.550167
Hordoir, R., Axell, L., Höglund, A., Dieterich, C., Fransner, F., Gröger, M., et al. (2018). Nemo-Nordic 1.0: A NEMO based ocean model for Baltic and North Seas, research and operational applications. Geosci. Model Develop. 12, 363. doi: 10.5194/gmd-2018-2
IPCC (2007). “Climate Change 2007: Synthesis Report,” in Contribution of Working Groups I, II and III to the Fourth Assessment Report of the Intergovernmental Panel on Climate Change (IPCC, Geneva, Switzerland).
IPCC (2022). “Summary for Policymakers [H.-O. Pörtner, D.C. Roberts, E.S. Poloczanska, K. Mintenbeck, M. Tignor, A. Alegría, M. Craig, S. Langsdorf, S. Löschke, V. Möller, A. Okem (eds.)],” in Climate Change 2022: Impacts, Adaptation, and Vulnerability (Cambridge University Press).
Ishtiaque, A., Estoque, R. C., Eakin, H., Parajuli, J., and Rabby, Y. W. (2022). IPCC's current conceptualization of ‘vulnerability' needs more clarification for climate change vulnerability assessments. J. Environ. Manage. 303, 114246. doi: 10.1016/j.jenvman.2021.114246
Jonkman, S. N., and Kelman, I. (2005). An analysis of the causes and circumstances of flood disaster deaths. Disasters 29, 75–97. doi: 10.1111/j.0361-3666.2005.00275.x
Jouper, T., Rispling, A.-L., Rosenqvist, J., and Wallgren, T. (2019). Risk- och sårbarhetsanalys för Halmstads kommun (2019). Halmstad municipality, Halmstad.
Karagiorgos, K., Haas, J., Pettersson, A., and Nyberg, L. (2021). Index över social sårbarhet för klimatrelaterade risker i Sverige. MSB.
Kasperson, R. E., Renn, O., Slovic, P., Brown, H. S., Emel, J., Goble, R., et al. (1988). The social amplification of risk: a conceptual framework. Risk Analy. 8, 177–187. doi: 10.1111/j.1539-6924.1988.tb01168.x
Kazmierczak, A., Cavan, G., Connelly, A., and Lindley, S. (2015). Mapping Flood Disadvantage in Scotland 2015. Edinburgh: Scottish Government.
Kim, S. J., and Bostwick, W. (2020). Social Vulnerability and Racial Inequality in COVID-19 Deaths in Chicago. Health Educ. Behav. 47, 509–513. doi: 10.1177/1090198120929677
Kirby, R. H., Reams, M. A., Lam, N. S. N., Zou, L., Dekker, G. G. J., and Fundter, D. Q. P. (2019). Assessing Social Vulnerability to Flood Hazards in the Dutch Province of Zeeland. Int. J. Disaster Risk. Sci. 10, 233–243. doi: 10.1007/s13753-019-0222-0
Koks, E. E., Jongman, B., Husby, T. G., and Botzen, W. J. W. (2015). Combining hazard, exposure and social vulnerability to provide lessons for flood risk management. Environ. Sci. Policy 47, 42–52. doi: 10.1016/j.envsci.2014.10.013
Lindley, S., O'Neill, J., Kandeh, J., Lawson, N., Christian, R., and O'Neill, M. (2011). Climate change, justice and vulnerability. Joseph Rowntree Foundation.
Lukasiewicz, A. (2020). “The Emerging Imperative of Disaster Justice,” in Natural Hazards and Disaster Justice: Challenges for Australia and Its Neighbours eds. A., Lukasiewicz, C., Baldwin (Singapore: Springer) 3–23. doi: 10.1007/978-981-15-0466-2_1
Malloy, J. T., and Ashcraft, C. M. (2020). A framework for implementing socially just climate adaptation. Climatic Change 160, 1–14. doi: 10.1007/s10584-020-02705-6
Menk, L., Terzi, S., Zebisch, M., Rome, E., Lückerath, D., Milde, K., et al. (2022). Climate change impact chains: a review of applications, challenges, and opportunities for climate risk and vulnerability assessments. Weather, Clim. Soc. 1, 14. doi: 10.1175/WCAS-D-21-0014.1
Morrow, B. H. (1999). Identifying and mapping community vulnerability. Disasters 23, 1–18. doi: 10.1111/1467-7717.00102
National Board of Housing Building and Planning (2020). Halmstad [WWW Document]. Segregationsbarometern. Available online at: https://segregationsbarometern.boverket.se/kommun/halmstad/ (accessed March 2, 2023).
National Board of Housing, Building and Planning. (2022). Miljonprogram 1965-1974: Antal lägenheter efter upplåtelseform [WWW Document]. Boverket. Available online at: https://gis2.boverket.se/apps/js/miljonprogram/ (accessed April 04, 2022).
National Strategy for Climate Change Adaptation. (2018). Nationell strategi för klimatanpassning (proposition 2017/18:163).
Nelson, K. S., Abkowitz, M. D., and Camp, J. V. (2015). A method for creating high resolution maps of social vulnerability in the context of environmental hazards. Appl. Geogr. 63, 89–100. doi: 10.1016/j.apgeog.2015.06.011
Nieminen Kristofersson, T. (2007). Om social sårbarhet i samband med extraordinära händelser - en intervjustudie i 12 kommuner. LUCRAM - Lunds universitets centrum för riskanalys och riskhanterig, Lund.
Nikkanen, M., Räsänen, A., and Juhola, S. (2021). The influence of socioeconomic factors on storm preparedness and experienced impacts in Finland. Int. J. Disaster Risk Reduct. 55, 102089. doi: 10.1016/j.ijdrr.2021.102089
Orru, K., Hansson, S., Gabel, F., Tammpuu, P., Krüger, M., Savadori, L., et al. (2022). Approaches to ‘vulnerability' in eight European disaster management systems. Disasters 46, 742–767. doi: 10.1111/disa.12481
Oulahen, G., McBean, G., Shrubsole, D., and Chang, S. E. (2019). Production of risk: multiple interacting exposures and unequal vulnerability in coastal communities. Reg. Environ. Change 19, 867–877. doi: 10.1007/s10113-018-1440-5
Parsons, M., Glavac, S., Hastings, P., Marshall, G., McGregor, J., McNeill, J., et al. (2016). Top-down assessment of disaster resilience: A conceptual framework using coping and adaptive capacities. Int. J. Disaster Risk Reduct. 19, 1–11. doi: 10.1016/j.ijdrr.2016.07.005
Pettersson, A., Turesson, K., de Goër de Herve, M., Gustavsson, J., Koivisto, J., Karagiorgos, K., et al. (2021). Studie av social sårbarhet för klimatrelaterade risker : Delstudie 1, Litteraturstudie om social sårbarhet i Norden. MSB, Karlstad.
Poudyal, N. C., Johnson-Gaither, C., Goodrick, S., Bowker, J. M., and Gan, J. (2012). Locating spatial variation in the association between wildland fire risk and social vulnerability across six southern states. Environ. Manage. 49, 623–635. doi: 10.1007/s00267-011-9796-z
Rahimi-Golkhandan, A., Aslani, B., and Mohebbi, S. (2021). Predictive resilience of interdependent water and transportation infrastructures: A sociotechnical approach. Socio-Econ. Plan. Sci. 80, 101166. doi: 10.1016/j.seps.2021.101166
Rød, J. K., Berthling, I., Lein, H., Lujala, P., Vatne, G., and Bye, L. M. (2012). Integrated vulnerability mapping for wards in Mid-Norway. Local Environ. 17, 695–716. doi: 10.1080/13549839.2012.685879
Roder, G., Sofia, G., Wu, Z., and Tarolli, P. (2017). Assessment of Social Vulnerability to Floods in the Floodplain of Northern Italy. Weather, Clim. Soc. 9, 717–737. doi: 10.1175/WCAS-D-16-0090.1
Roncancio, D. J., and Nardocci, A. C. (2016). Social vulnerability to natural hazards in São Paulo, Brazil. Nat. Hazards 84, 1367–1383. doi: 10.1007/s11069-016-2491-x
Rufat, S., Tate, E., Burton, C. G., and Maroof, A. S. (2015). Social vulnerability to floods: Review of case studies and implications for measurement. Int. J. Disaster Risk Reduct. 14, 470–486. doi: 10.1016/j.ijdrr.2015.09.013
Salvati, P., Petrucci, O., Rossi, M., Bianchi, C., Pasqua, A. A., and Guzzetti, F. (2018). Gender, age and circumstances analysis of flood and landslide fatalities in Italy. Sci. Total Environ. 610, 867–879. doi: 10.1016/j.scitotenv.2017.08.064
Sayers, P., Penning-Rowsell, E. C., and Horritt, M. (2018). Flood vulnerability, risk, and social disadvantage: current and future patterns in the UK. Reg. Environ. Change 18, 339–352. doi: 10.1007/s10113-017-1252-z
SCB (2020a). Långtidsarbetslösheten ökade [WWW Document]. Statistics Sweden. Available online at: https://www.scb.se/hitta-statistik/statistik-efter-amne/arbetsmarknad/arbetskraftsundersokningar/arbetskraftsundersokningarna-aku/pong/statistiknyhet/arbetskraftsundersokningarna-aku-1a-kvartalet-2020/ (accessed March 9, 2023).
SCB (2020b). Tätortsbefolkning, antal efter region, kön, ålder och vart 5:e år [WWW Document]. Statistikdatabasen. Available online at: https://www.statistikdatabasen.scb.se/pxweb/sv/ssd/START__MI__MI0810__MI0810A/TatortAlderNN/table/tableViewLayout1/
SCB (2021a). Personbilar efter status och region. År (2015-2021). [WWW Document]. Statistikdatabasen. Available online at: https://www.statistikdatabasen.scb.se/pxweb/sv/ssd/START__TK__TK1001__TK1001Z/PersBilarDeso/
SCB (2021b). Folkmängden per region efter medborgarskap och kön. År (2010-2021). [WWW Document]. Statistikdatabasen. Available online at: https://www.statistikdatabasen.scb.se/pxweb/sv/ssd/START__BE__BE0101__BE0101Y/FolkmDesoMedKonN/
SCB (2022a). Open data for DeSO – Demographic Statistical Areas [WWW Document]. SCB. Available online at: https://www.scb.se/en/services/open-data-api/open-geodata/deso–demographic-statistical-areas/ (accessed August 17, 2022).
SCB (2022b). Kommuner i siffror. [WWW Document]. SCB. Available online at: https://kommunsiffror.scb.se/?id1=1380andid2=0180 (accessed August 22, 2022).
Segnestam, L. (2014). Culture and Capacity: Drought and Gender Differentiated Vulnerability of Rural Poor in Nicaragua, 1970-2010. Stockholm: Acta Universitatis Stockholmiensis.
Segnestam, L. (2017). Gendered Experiences of Adaptation to Drought: Patterns of Change in El Sauce, Nicaragua. Latin Am. Res. Rev. 52, 807–823. doi: 10.25222/larr.220
Shrestha, N. (2021). Factor analysis as a tool for survey analysis. AJAMS 9, 4–11. doi: 10.12691/ajams-9-1-2
SMHI (2014). Risker, konsekvenser och sårbarhet för samhället av förändrat klimat – en kunskapsöversikt (No. SE-601 76). SMHI, Norrköping.
Sparf, J. (2015). Individens förmåga att ta ansvar för sin egen säkerhet Särskilt utsatta grupper. MSB, Karlstad.
Tapsell, Penning-Rowsell, E. C., Tunstall, S. M., and Wilson, T. L. (2002). Vulnerability to flooding: health and social dimensions. Philos. Trans. R. Soc. A Mathem. Phys. Eng. Sci. 360, 1511–1525. doi: 10.1098/rsta.2002.1013
Tapsell, S., Mccarthy, S., Faulkner, H., and Alexander, M. (2010). Social Vulnerability to Natural Hazards. London: CapHAZ-Net.
Tascón-González, L., Ferrer-Julià, M., Ruiz, M., and García-Meléndez, E. (2020). Social vulnerability assessment for flood risk analysis. Water 12, 558. doi: 10.3390/w12020558
Tate, E. (2012). Social vulnerability indices: a comparative assessment using uncertainty and sensitivity analysis. Nat. Hazards 63, 325–347. doi: 10.1007/s11069-012-0152-2
The Swedish Police Authority (2015). Utsatta områden - sociala risker, kollektiv förmåga och oönskade händelser. Stockholm: Nationella operativa avdelningen.
Thieken, A. H., Kreibich, H., Müller, M., and Merz, B. (2007). Coping with floods: preparedness, response and recovery of flood-affected residents in Germany in 20. Hydrol. Sci. J. 52, 1016–1037. doi: 10.1623/hysj.52.5.1016
Thomas, D. S. K., Jang, S., and Scandlyn, J. (2020). The CHASMS conceptual model of cascading disasters and social vulnerability: The COVID-19 case example. Int. J. Disaster Risk Reduct. 51, 101828. doi: 10.1016/j.ijdrr.2020.101828
UNDRR (2022). Global assessment report on disaster risk reduction: Our World at Risk: Transforming Governance for a Resilient Future (Summary for Policymakers). Geneva: United Nations Office for Disaster Risk Reduction.
van Well, L., Keur, P., van der Harjanne, A., Pagneux, E., Perrels, A., and Henriksen, H. J. (2018). Resilience to natural hazards: An analysis of territorial governance in the Nordic countries. Int. J. Disaster Risk Red. 31, 1283–1294. doi: 10.1016/j.ijdrr.2018.01.005
Velasco-Herrejon, P., and Bauwens, T. (2020). Energy justice from the bottom up: A capability approach to community acceptance of wind energy in Mexico. Energy Res. Soc. Sci. 70, 101711. doi: 10.1016/j.erss.2020.101711
Vink, K., Takeuchi, K., and Kibler, K. M. (2014). A Quantitative Estimate of Vulnerable People and Evaluation of Flood Evacuation Policy. J. Disaster Res. 9, 887–900. doi: 10.20965/jdr.2014.p0887
Vogel, C., Moser, S. C., Kasperson, R. E., and Dabelko, G. D. (2007). Linking vulnerability, adaptation, and resilience science to practice: Pathways, players, and partnerships. Global Environ. Change 17, 349–364. doi: 10.1016/j.gloenvcha.2007.05.002
Walker, G., and Burningham, K. (2011). Flood risk, vulnerability and environmental justice: Evidence and evaluation of inequality in a UK context. Crit. Soc. Policy 31, 216–240. doi: 10.1177/0261018310396149
Wall, T. U., Meadow, A. M., and Horganic, A. (2017). Developing evaluation indicators to improve the process of coproducing usable climate science. wea. Climate Soc. 9, 95–107. doi: 10.1175/WCAS-D-16-0008.1
Welle, T., Depietri, Y., Angignard, M., Birkmann, J., Renaud, F., and Greiving, S. (2014). “Chapter 5: Vulnerability Assessment to Heat Waves, Floods, and Earthquakes Using the MOVE Framework: Test Case Cologne, Germany,” in Assessment of Vulnerability to Natural Hazards: A European Perspective, eds. J., Birkmann, D., Alexander, S. Kienberger (London: Elsevier) 91–124. doi: 10.1016/B978-0-12-410528-7.00005-9
Widaman, K. F. (1993). Common factor analysis versus principal component analysis: differential bias in representing model parameters? Multiv. Behav. Res.28, 263–311. doi: 10.1207/s15327906mbr2803_1
Wigtil, G., Hammer, R. B., Kline, J. D., Mockrin, M. H., Stewart, S. I., Roper, D., et al. (2016). Places where wildfire potential and social vulnerability coincide in the coterminous United States. Int. J. Wildland Fire 25, 896. doi: 10.1071/WF15109
Wisner, B., Blaikie, P., Cannon, T., and Davis, I. (2004). At Risk. Natural Hazards, People's Vulnerability and Disasters. 2nd ed. (London and New York: Routledge).
Keywords: Sweden, flooding, justice, social vulnerability, social vulnerability index, bottom-up assessment, stakeholder involvement, impact chain method
Citation: Englund M, Vieira Passos M, André K, Gerger Swartling Å, Segnestam L and Barquet K (2023) Constructing a social vulnerability index for flooding: insights from a municipality in Sweden. Front. Clim. 5:1038883. doi: 10.3389/fclim.2023.1038883
Received: 07 September 2022; Accepted: 24 April 2023;
Published: 18 May 2023.
Edited by:
Monirul Mirza, Environment and Climate Change Canada, CanadaReviewed by:
Julie Gobert, École des ponts ParisTech (ENPC), FrancePedro Roberto Jacobi, University of São Paulo, Brazil
Copyright © 2023 Englund, Vieira Passos, André, Gerger Swartling, Segnestam and Barquet. This is an open-access article distributed under the terms of the Creative Commons Attribution License (CC BY). The use, distribution or reproduction in other forums is permitted, provided the original author(s) and the copyright owner(s) are credited and that the original publication in this journal is cited, in accordance with accepted academic practice. No use, distribution or reproduction is permitted which does not comply with these terms.
*Correspondence: Mathilda Englund, bWF0aGlsZGEuZW5nbHVuZEBzZWkub3Jn