 Takanori Horii
 Iwao Ueki
 Eko Siswanto
 Iskhaq Iskandar
- 1Research Institute for Global Change, Japan Agency for Marine-Earth Science and Technology, Yokosuka, Kanagawa, Japan
- 2Earth Surface System Research Center, Research Institute for Global Change, Japan Agency for Marine-Earth Science and Technology, Yokohama, Kanagawa, Japan
- 3Graduate School of Sciences, Faculty of Mathematics and Natural Sciences, University of Sriwijaya, Palembang, South Sumatra, Indonesia
Long-term change in the timing of coastal upwelling due to climate variations alters the heat budget and biogeochemical balance in the regional ocean and is an important issue in local fisheries. In this study, we investigated decadal changes in the onset of coastal upwelling along the southern coast of Java over the past two decades (2003–2020) based on the timing of chlorophyll-a (Chl-a) bloom. We estimated the bloom from satellite Chl-a concentration data. On average, the onset of coastal upwelling observed (the first Chl-a bloom of the year) was around mid-June. In the most recent decade (2011–2020), earlier-onset upwelling (before early June) was observed frequently, and the linear trend for the onset date during 2003–2020 was about 2 weeks earlier/decade. To explore the causes of the change in the timing of the upwelling, we focused on the season (April–June) during which these earlier upwelling onsets occurred, and investigated decadal changes in atmosphere and ocean conditions associated with climate change. While sea surface temperature (SST) trends reflected a basin-wide warming pattern in the Indian Ocean, warming was not significant in the southeastern Indian Ocean. During the onset period of coastal upwelling, significant SST warming trends were also observed west of Sumatra. In association with the SST warming pattern, enhanced convective activity and convergent zonal winds around Sumatra were observed. Atmospheric forcing revealed trends favoring Ekman downwelling in the equatorial eastern Indian Ocean and upwelling in the southeastern Indian Ocean, which was consistent with the trends in thermocline depth. This study provides the first results regarding the recent decadal shift in the onset timing of coastal upwelling. Ongoing monitoring is needed to better understand the long-term change of the upwelling system in the eastern tropical Indian Ocean.
1. Introduction
Coastal upwelling along the southern coast of Java has significant impacts on ocean temperature, surface biogeochemical variations, local ecosystem changes, and local fisheries in the southeastern tropical Indian Ocean (e.g., Wyrtki, 1962; Susanto et al., 2001; Vinayachandran et al., 2021). Coastal upwelling typically begins around June as a result of monsoonal southeasterly alongshore winds, and peaks around August–September (e.g., Susanto et al., 2001). The southeasterly winds drive offshore-ward Ekman transport, causing divergence in the coastal upper ocean and upwelling of cold, nutrient-rich waters from below. The onset of coastal upwelling results in a reduction of ocean temperature and phytoplankton development due to the higher nutrient supply (e.g., Susanto and Marra, 2005; Iskandar et al., 2009). The coastal upwelling is a major determinant of the regional marine environment (e.g., Hendiarti et al., 2005; Sartimbul et al., 2010; Lumban-Gaol et al., 2021), so understanding the timing of its onset is important.
To capture the onset and development of coastal upwelling, it is important to obtain data that resolve the intraseasonal-scale variability that prevails in the tropical Indian Ocean. Compared to the case of the open ocean (e.g., McPhaden et al., 2009), there are no temporally high-resolution hydrographic time series, such as from ocean observation buoys, in this coastal region. Although this coastal upwelling has been studied using satellite-based monthly SST and Chl-a data (Hendiarti et al., 2004; Susanto and Marra, 2005; Iskandar et al., 2009; Siswanto et al., 2020), intraseasonal-scale variations are dominant in the tropical Indian Ocean including south of Java (Chen et al., 2015; Horii et al., 2016; Cao et al., 2019) and such data are insufficient to analyze the variations. Horii et al. (2016, 2018) analyzed coastal upwelling using daily sea level variations, but did not fully study in detail how thermocline variation could affect the upper ocean. Recently, Xu et al. (2021) used daily interpolated Chl-a data and investigated the intraseasonal, seasonal, interannual, and decadal variability of Chl-a in relation to coastal upwelling. Using a daily satellite-based Chl-a observation dataset for 2003–2020, Horii et al. (2022) demonstrated that the onset of coastal upwelling was represented by the first Chl-a bloom south of Java.
In general, the first Chl-a bloom, i.e., the onset of coastal upwelling south of Java, occurs around mid-June, and upwelling peaks around August–September (e.g., Susanto et al., 2001; Wirasatriya et al., 2020; Shi and Wang, 2021; Mandal et al., 2022) (Figures 1A, B). However, the timing of the onset of coastal upwelling varies from year to year (Susanto and Marra, 2005; Horii et al., 2022) (Figures 1C–F). One cause of the different timing of the coastal upwelling is the Indian Ocean Dipole (IOD), which is a major climate mode with basin-wide anomalous SST and atmospheric circulation that affects the regional and global climate (e.g., Saji et al., 1999; Saji and Yamagata, 2003). The IOD usually has its peak during the Northern Hemisphere summer and fall seasons; however, occasionally, as in 2018 and 2019, positive IOD conditions start from spring, and strong southeasterly winds over the eastern Indian Ocean occur (e.g., Du et al., 2020), as well as early onset coastal upwelling (Figure 1E). In the negative IOD condition, such as in 2005 and 2016, the upwelling signal occurs later and is of smaller magnitude (Figures 1C, D, 2). Recently, Horii et al. (2022) demonstrated that while the timing of the upwelling onset around May to July is not highly correlated with concurrent IOD conditions, there is a strong correlation with subsequent IOD events 3–5 months later. They concluded that early onset of the intraseasonal-scale coastal upwelling can contribute to the subsequent development of positive IOD events through cold water advections from the coastal region to a wider area of the eastern Indian Ocean. This indicates that the coastal upwelling does not only follow the large-scale atmospheric and oceanic variability associated with ENSO and IOD (e.g., Susanto et al., 2001; Xu et al., 2021), and atmospheric intraseasonal-scale variation, such as the Madden–Julian Oscillation (MJO; Madden and Julian, 1994), can also affect the timing of coastal upwelling onset by changing the alongshore southeasterly monsoon winds.
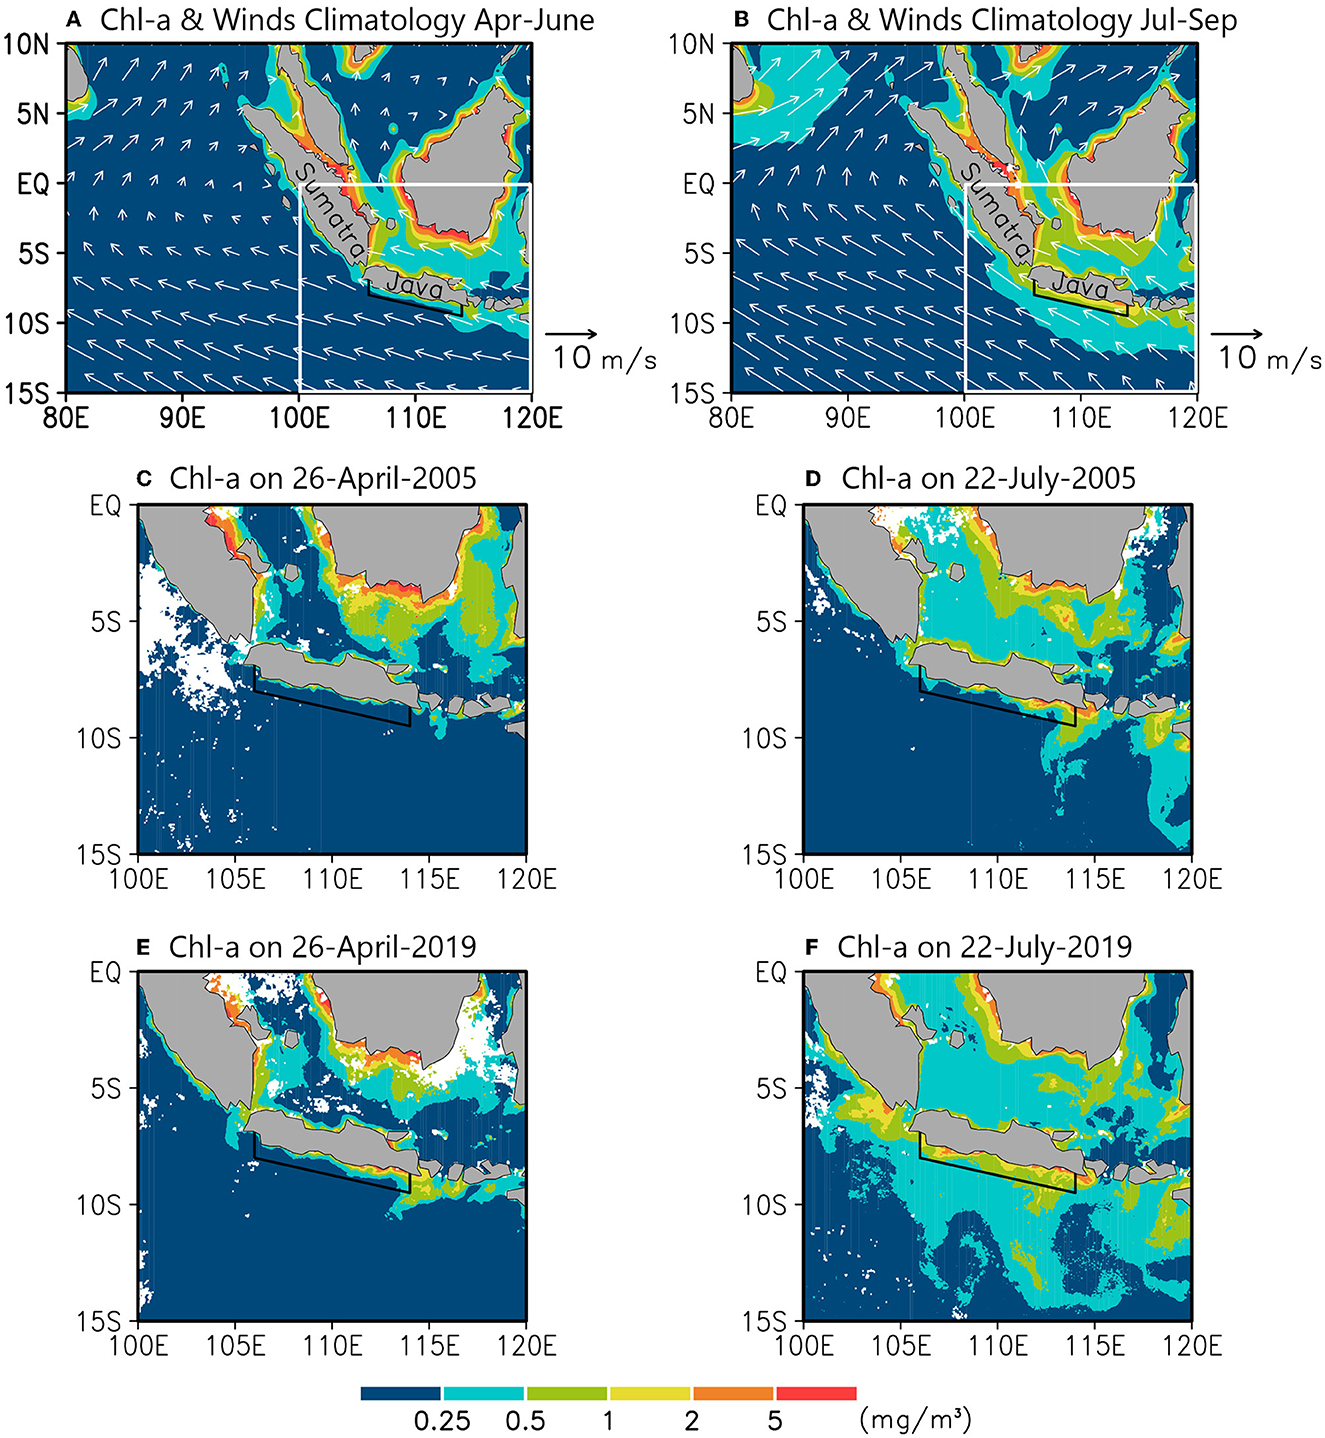
Figure 1. (A) Climatological mean chlorophyll-a (Chl-a) concentration (mg/m3) and surface winds (m/s) in April–June. (B) As in (A), but for July–September. (C) Snapshot of Chl-a distribution in late April 2005. (D–F) Are as in (C), but snapshots in late July 2005, late April 2019, and late July 2019, respectively. (D, E) Show the first Chl-a blooms in 2005 and 2019, respectively. Data are five-day averages centered on the date shown in the figures. The region enclosed by the black lines south of Java (6.5°S, 106°E to 9.0°S, 114°E) shows the area in which the average Chl-a concentration was calculated (see Figure 2).

Figure 2. (A) Time series of the average Chl-a concentration (mg/m3) south of Java (see map in Figure 1) and start date of the first Chl-a bloom (green triangle) from 2003 to 2020. Chl-a > 0.48 (mg/m3) is shaded in light green. The blue line shows the linear trend of the bloom start date. (B) Dipole Mode Index (DMI) averaged for April–June in each year.
In the most recent decade (2011–2020), early onset coastal upwelling in April–May has been observed frequently, for example in 2012, 2015, and 2017–2019 (Figure 2A). This represents a marked difference from the previous period (2003–2010) and may reflect long-term changes in the coastal upwelling system associated with climate change in the atmospheric and oceanic background condition. Although a long-term SST warming trend in the tropical Indian Ocean has been widely reported (e.g., Alory et al., 2007; Li et al., 2017; Ummenhofer et al., 2021), no observational study has examined possible long-term changes in the coastal upwelling system. Climate projections for the eastern Indian Ocean in the 21st century from multi-model ensembles indicate long-term strengthening of southeasterly winds and changes of thermocline shoaling in the eastern Indian Ocean (e.g., Vecchi and Soden, 2007; Xie et al., 2010; Wang et al., 2020). Given the influences of climate change before and during upwelling onset (around April–June), it is possible that a long-term shift to earlier-onset coastal upwelling may be observed this century. High spatiotemporal resolution Chl-a data derived from satellite ocean color data have been available since 2003 and enable us to observe the long-term change of the upwelling signal throughout the last two decades. Based on the satellite observations, Xu et al. (2021) reported a possible increasing trend of Chl-a (+0.1 to +0.2 mg/m3 per decade), probably due to changes in atmospheric forcing. However, given the error range of the satellite-based Chl-a observation data, this signal would not be statistically significant.
Understanding long-term changes in the onset of the coastal upwelling, and the associated physical mechanisms, is important for predicting how upwelling systems will respond to climate change, and for recognizing when the fisheries resources in an area will be available. Horii et al. (2022) defined the date of the first Chl-a bloom using daily Chl-a data. This study follows Horii et al. (2022) and investigates the long-term change in coastal upwelling south of Java based on the Chl-a proxy. We herein report and discuss a possible long-term trend toward earlier-onset coastal upwelling south of Java, as typified by the early onsets in April–May frequently in the most recent decade.
2. Data and methods
Daily merged surface Chl-a data were provided by the Copernicus Marine Service (Garnesson et al., 2019). We used a product (OCEANCOLOUR_GLO_BGC_L3_MY_009_103) based on multiple ocean color sensors. This dataset is an integration of daily observations, with no spatiotemporal interpolation applied. We used the data for the period 2003–2020, during which there were fewer missing values in daily data with the inclusion of the Moderate Resolution Imaging Spectrometer (MODIS) data. The original spatial resolution of the dataset is 1/12° × 1/12° (approximately 4.6 km). The region south of Java is generally cloudless during the seasonal coastal upwelling period because the intertropical convergence zone (ITCZ) is located to the north. After spatiotemporal interpolation (Horii et al., 2022), the average available data during April–September in each year was 91.5%, with a minimum of 75.6% (2010) and maximum of 99.7% (2019). To observe the climatology of Chl-a variation, we also used monthly Chl-a data from the Sea-viewing Wide-Field of view Sensor (SeaWiFS).
To calculate the proxy of coastal upwelling, we averaged the Chl-a data south of Java following the procedures in Horii et al. (2022). First, we applied a spatial Gaussian filter with an e-folding scale of 1/4° to the original Chl-a dataset, to produce data with 1/8° × 1/8° grids. To prevent errors due to missing values, we only included cases where > 50% of the data were available around each grid. Second, we applied temporal linear interpolation for a period of missing data of ~4 days. Third, we averaged the interpolated Chl-a data over the coastal region, defined as inside the line between (8.0°S, 106°E) and (9.5°S, 114°E). This region, which is approximately 100 km from the Java coast, was estimated quantitatively from the Rossby deformation radius and Argo float observations of coastal upwelling (Horii et al., 2018). We also estimated the error range and confirmed that the Chl-a signal related to the upwelling onset in each year was significant, even when errors due to missing values are taken into account; for more details, see the supporting information in Horii et al. (2022).
We estimated the timing of the first Chl-a bloom (onset of coastal upwelling) using almost the same method as that of Horii et al. (2022). We defined the timing of the onset of coastal upwelling as the first day on which Chl-a exceeded 0.48 mg/m3, i.e., the two root-mean square amplitude of Chl-a from April to June. In this study, we focused on the period from April to August in each year.
We used other datasets for the period 2001–2020 to study the atmosphere and ocean conditions associated with the long-term change in coastal upwelling. The monthly SST dataset of the Hadley Center Ice and SST (HadISST; Rayner et al., 2003) was provided by the United Kingdom Met Office (UKMO). Using the SST dataset, we calculated Dipole Mode Index (DMI; Saji et al., 1999) as the difference in SSTA between western (50°E−70°E, 10°S−10°N) and eastern regions (90°E−110°E, 10°S−0°) (Figure 2) and Niño-3.4 index as the average SSTA over the region (5°S−5°N, 170°W−120°W). The monthly interpolated outgoing longwave radiation (OLR) dataset was provided by the National Oceanic and Atmospheric Administration (NOAA) (Liebmann and Smith, 1996). Monthly 10-m horizontal wind data were obtained from the National Centers for Environmental Prediction-Department of Energy (NCEP-DOE) Reanalysis 2 datasets (Kanamitsu et al., 2002). To investigate variations in thermocline depth, we used the monthly ocean temperature dataset based on Argo floats from the Grid Point Value of the Monthly Objective Analysis (MOAA GPV) (Hosoda et al., 2008).
3. Results
3.1. Decadal shift of the timing of coastal upwelling
The average timing of the onset of coastal upwelling (first Chl-a bloom) was mid-June, with an earliest onset on 24 April, 2019 and latest onset on 11 August, 2014 (Figure 2A). These coastal upwelling onsets were concurrent with the southeasterly winds along the Java coast. In years when early onset was observed, the amplitude of Chl-a around July–August tended to be large. An example is the case in 2019 (Figures 1E, F). Six cases of early onset coastal upwelling (in or before May) were observed during 2003–2020, five of which occurred after 2012.
The timing of onset of upwelling was moderately correlated with the concurrent IOD condition (Figure 2B). The correlation between the onset timing of the coastal upwelling and DMI, for which positive (negative) IOD conditions are denoted by positive (negative) values, was 0.51. Stronger alongshore southeasterly winds and earlier-onset coastal upwelling were observed in association with positive IOD conditions, such as in 2007, 2008, 2015, 2017, and 2019. Conversely, the onset timing tended to be late in negative IOD conditions, such as 2013 and 2014. In 2016, due to the negative IOD conditions, alongshore southeasterly winds were weak throughout the upwelling period and no Chl-a bloom exceeding the threshold was observed. It should be noted that early-onset upwelling was also observed under negative-neutral IOD condition in April–June, such as in 2003, 2006, and 2012. This suggests some contributions to the coastal upwelling from intraseasonal-scale southeasterly wind forcing, which are partially independent of concurrent IOD condition (Horii et al., 2022).
During 2003–2020, a linear trend of 16 days earlier/decade was observed for the onset date of the coastal upwelling (blue line; Figure 2A). A similar long-term trend (13 days earlier/decade) was obtained for the period 1998–2020 by adding weekly Chl-a data from SeaWiFS during this period. Because it is inappropriate to discuss such trends obtained from weekly data, we hereinafter focus on the period 2003–2020. We examined the statistical significance of the observed linear trend during 2003–2020 using the t-test, as well as Mann-Kendall rank statistics (Kendall, 1938). Both results showed that the trend was significant at the 80% level, but not at the 90% level. We also used a bootstrap method (Efron and Tibshirani, 1991), selecting 1,000 bootstrap samples to test the statistical significance; the same results were obtained. Although the statistical significance was not high due to the short observation period, we believe that it is beneficial to report long-term changes of the coastal upwelling system in the tropical Indian ocean that may reflect ongoing climate change. In the following subsection, we discuss the atmospheric and oceanographic changes associated with the long-term trend in coastal upwelling south of Java.
3.2. Decadal changes of oceanic background and atmospheric forcing
Given that the long-term trend in coastal upwelling south of Java described above reflected a change in local Chl-a growth around May, we investigated climate changes in atmospheric and oceanic conditions in this season (April–June). The observed trend likely depends on long-term changes in seasonal atmospheric forcing around the southern coast of Java, and on the nutrient supply to the mixed layer due to the background thermocline/nutricline condition. Note that these two factors are related to each other because atmospheric forcing can affect the local thermocline. In addition, long-term changes in the atmosphere and ocean related to the timing of the upwelling onset would be due to decadal IOD variability, or caused by changes in the atmospheric circulation associated with long-term Indian Ocean warming. Although these two cannot be completely distinguished from each other based on the 20-year observation data, it should be noted that this period we focus on does not include the development-to-peak seasons of the IOD (July–November) so the observed trend in April–June does not depend substantially on possible frequency changes of positive or negative IOD events during 2001–2020. The relationship to long-term changes in IOD (changes in DMI) in this season will be discussed in the next section. In this section, we first aim to perceive long-term changes in the atmospheric and ocean conditions for the period April–June that were possibly related to and contribute to the long-term changes of the coastal upwelling. We herein examined long-term trends in SST, atmospheric fields (convective activity, surface wind circulation, and wind speed), and thermocline depth for the period April–June.
The period we focus on (April–June) is the season of high SST in the southeastern tropical Indian Ocean. The climatological (mean seasonal) SST variation, including the region south of Java, is highest around April-May (about 29.4°C) and lowest around September (about 28.0°C) (Figure 3A). Here we showed the SST averaged over the domain (90°E − 110°E, 10°S − 0°) of the eastern pole of the IOD. In the eastern Indian Ocean, the ITCZ locates south of the equator around January and then moves northward around May–June with the Northern Hemisphere summer monsoon. Therefore, the season from April to June is a transition period from an active period of atmospheric convection (low OLR) to inactive period (high OLR) in the southeastern tropical Indian Ocean (Figure 4A). The surface wind field transitions from winter monsoon around December–February, when cyclonic circulation is prominent in the southeastern Indian Ocean, to the period when the southeasterly summer monsoonal winds are dominant with strengthened wind speed (Figures 5A, 6A, 7A).
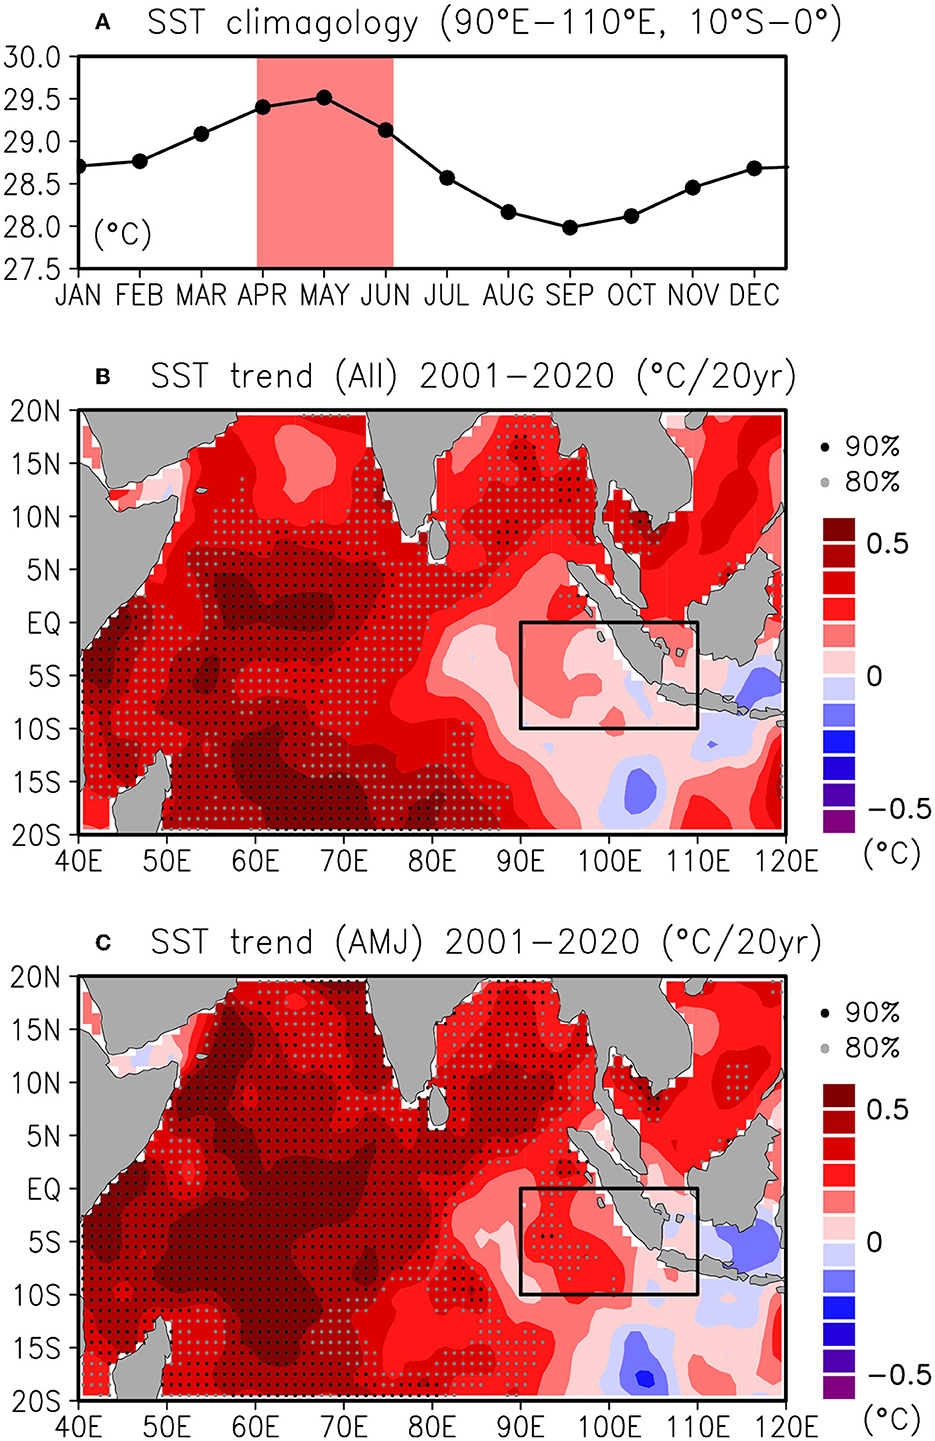
Figure 3. (A) Climatological seasonal variation in SST averaged for the region 90°E−110°E, 10°S−0°. The light red shading shows the period in April–June. (B) Observed trends in SST during 2001–2020. The black (gray) dots indicate areas where the trend is statistically significant at the 90% (80%) level according to the linear regression analysis. (C) As in (B), but only for the trends of April–June during 2001–2020.
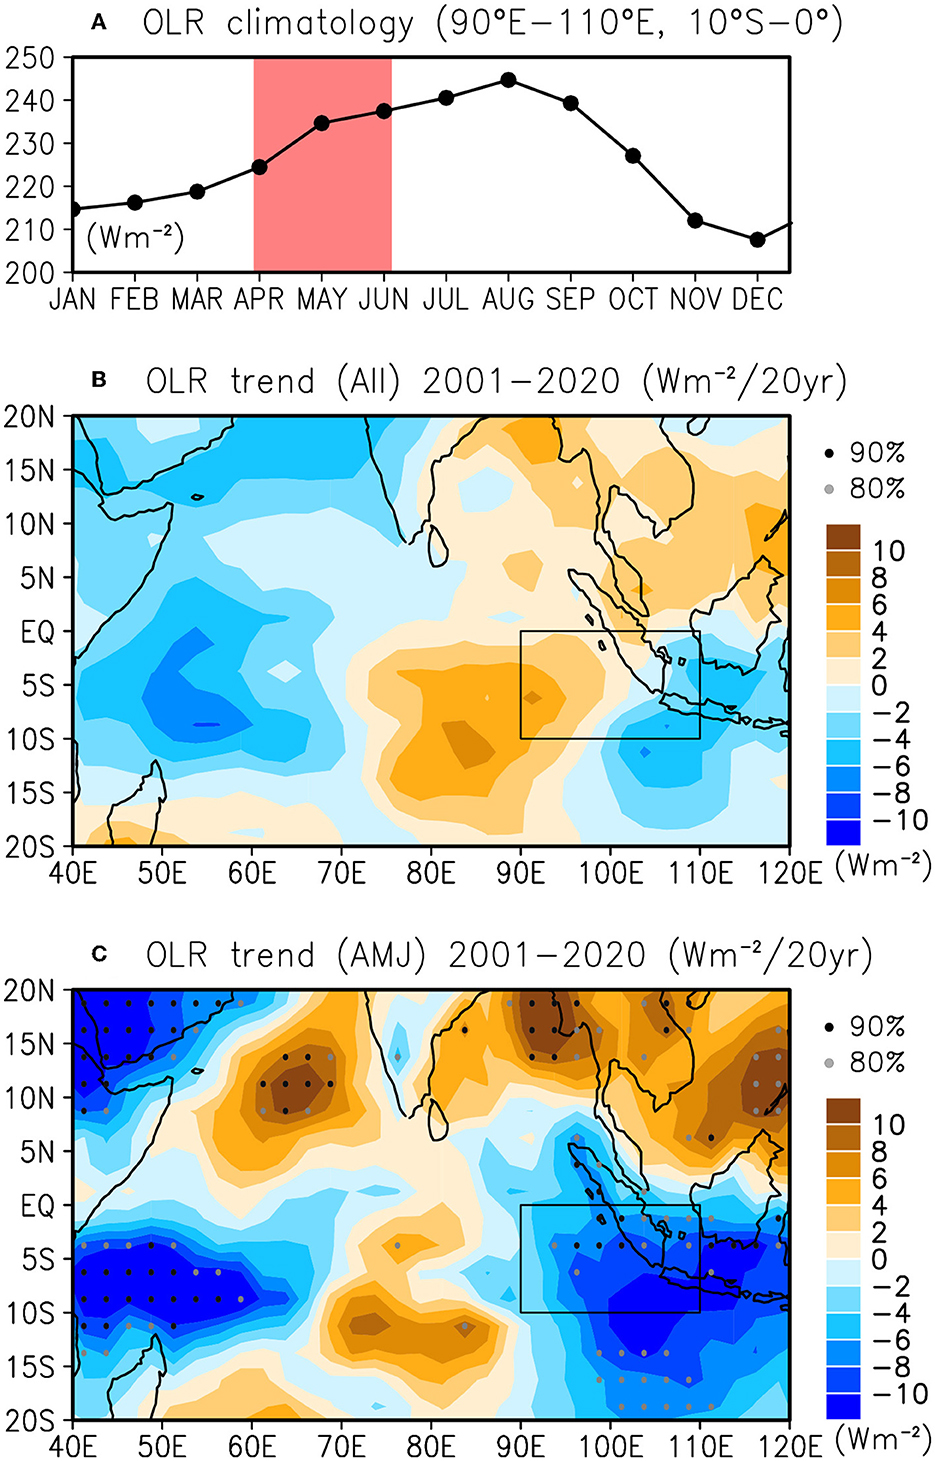
Figure 4. (A–C) Are as in Figures 3A–C, respectively, but for the observed trends in OLR during 2001–2020.
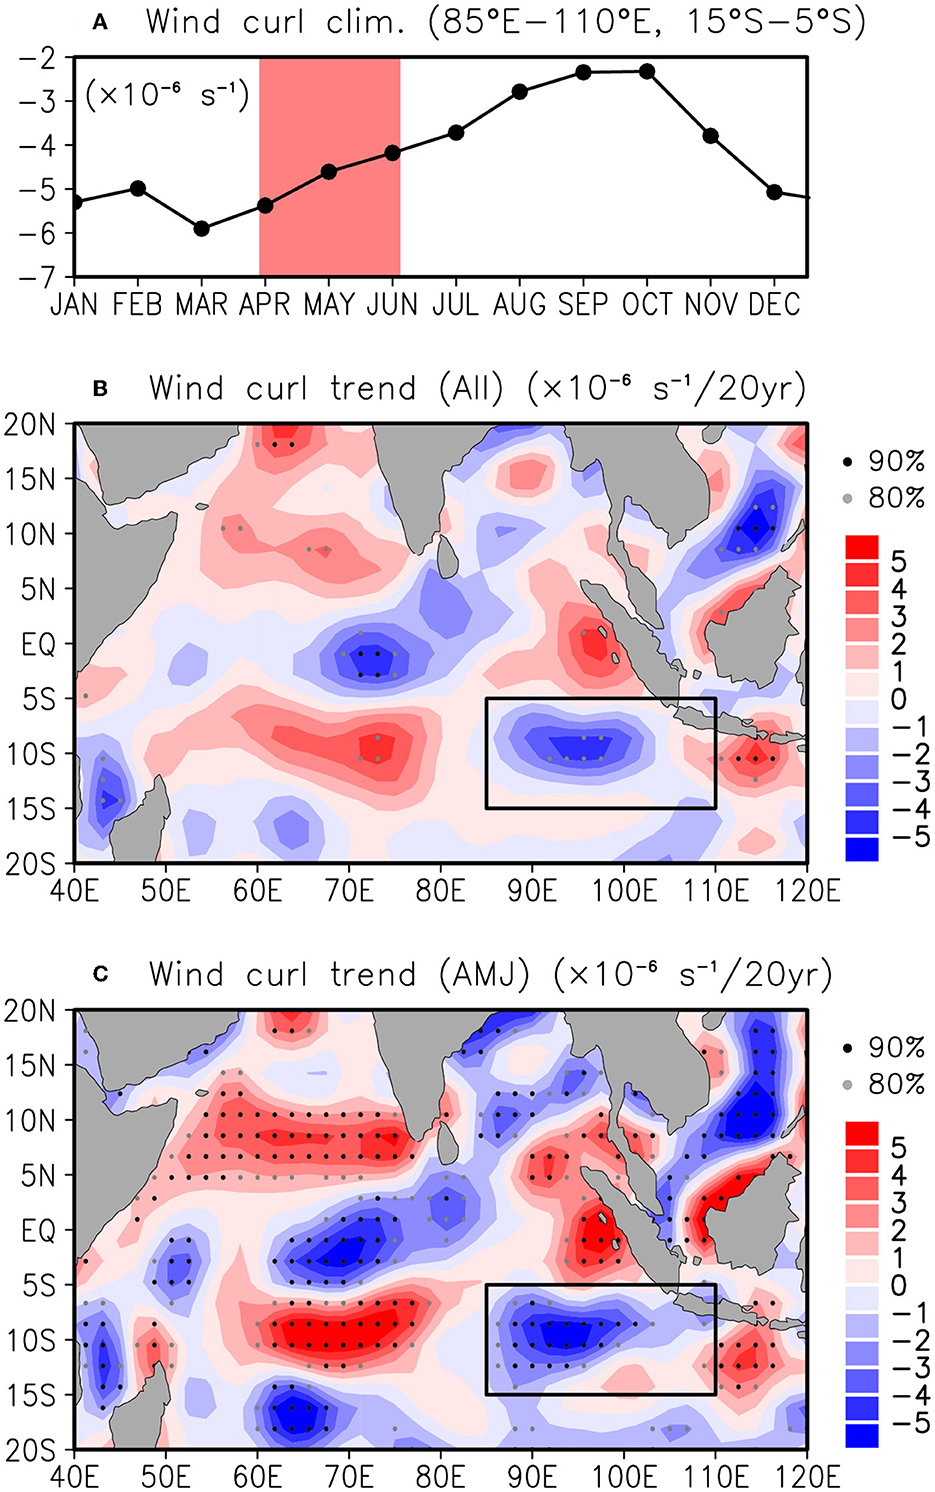
Figure 5. (A–C) Are as in Figures 3A–C, respectively, but for the observed trend in wind curl. Timeseries in (A) shows climatological seasonal variation averaged for the region 85°E − 110°E, 15°S − 5°S.
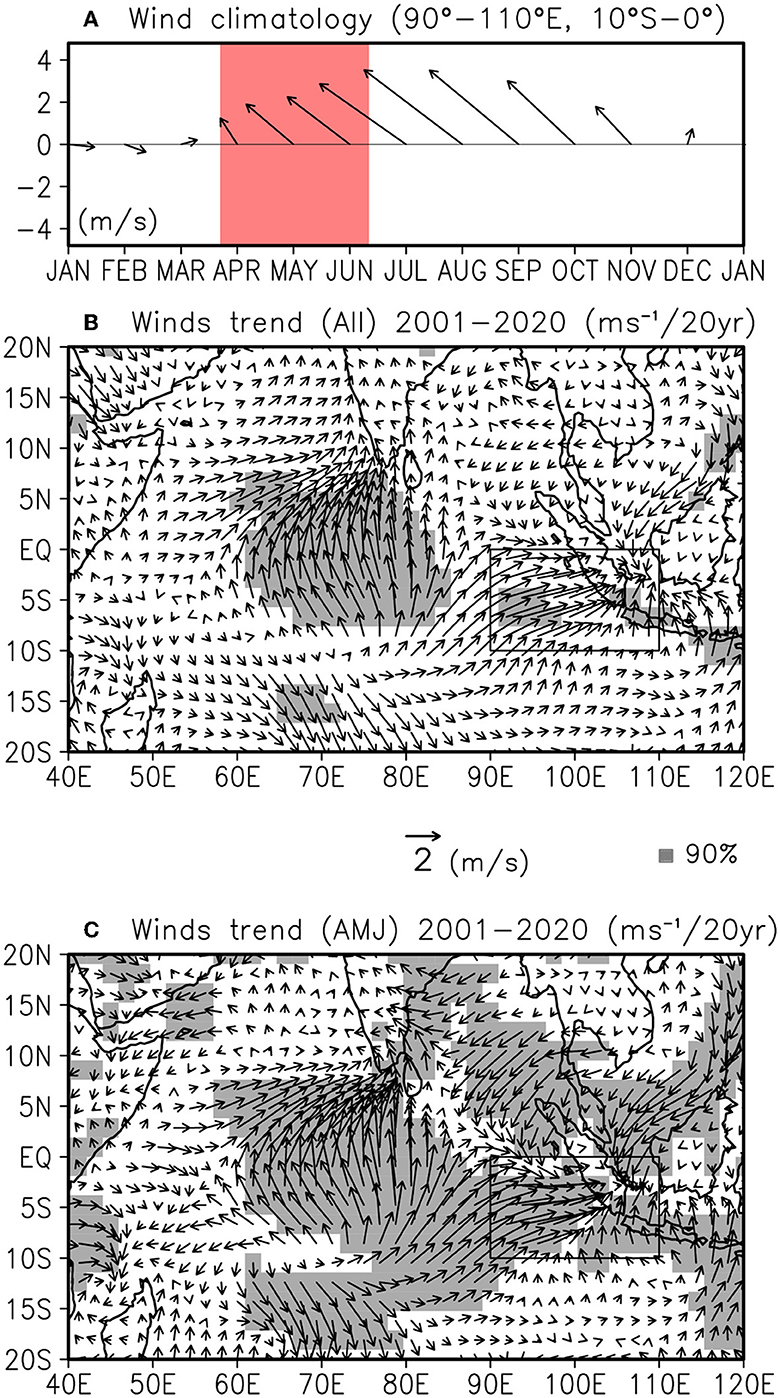
Figure 6. (A) Climatological seasonal variation in surface winds (shown as vectors) averaged for the region 90°E − 110°E, 10°S − 0°. The light red shading shows the period in April–June. (B) Observed trends in zonal and meridional components of surface winds (shown as vectors). Gray patches indicate areas where either the trend in the zonal or meridional component is significant at the 90% level. (C) As in (B), but only for the trends of April–June during 2001–2020.
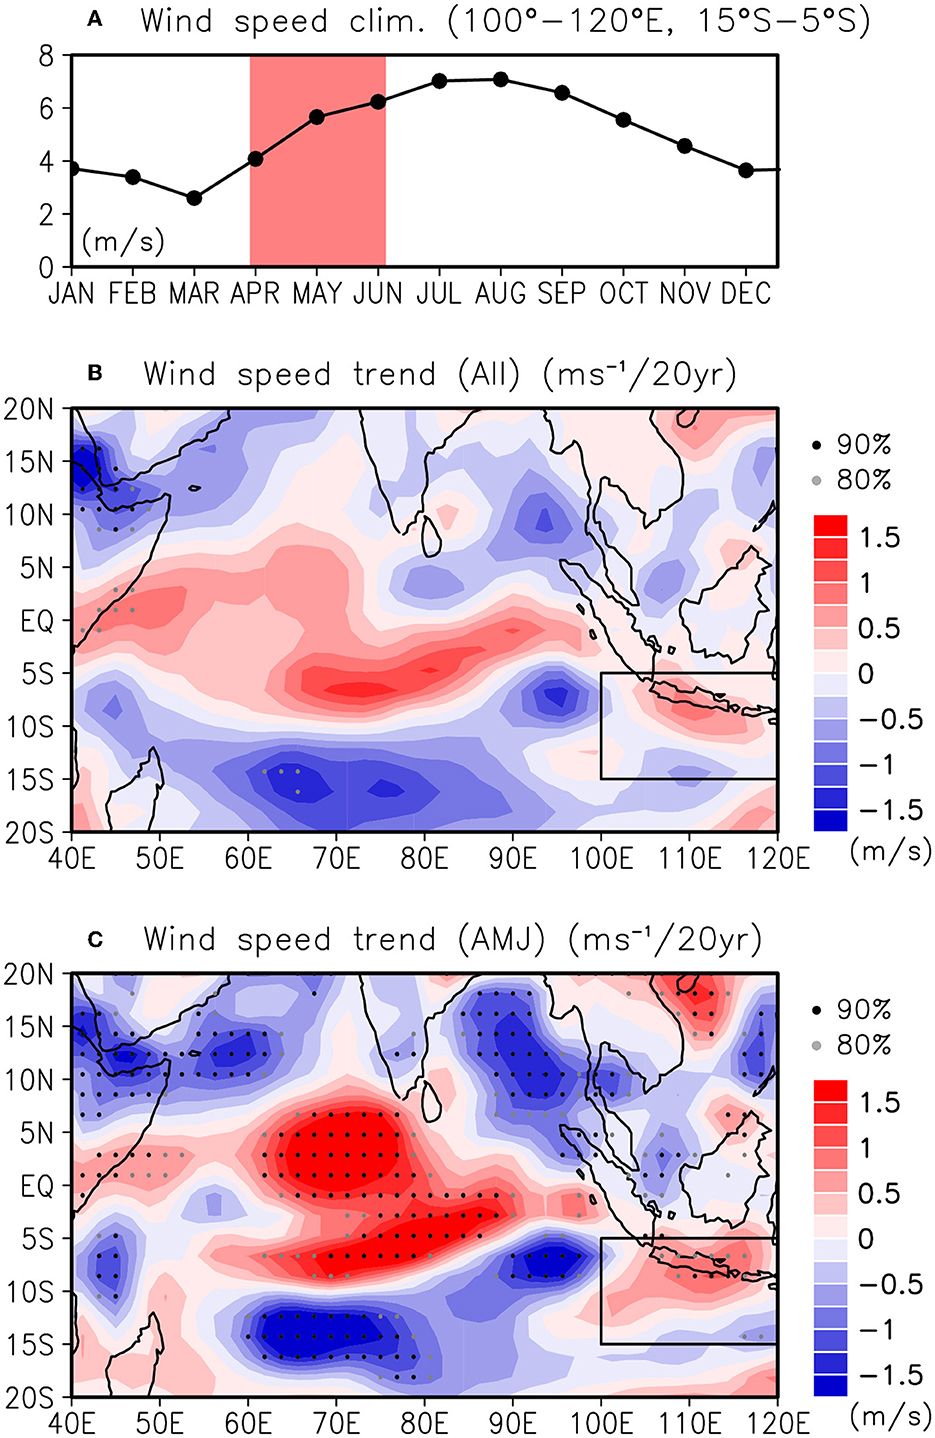
Figure 7. (A–C) Are as in Figures 3A–C, respectively, but for wind speed. Timeseries in (A) shows climatological seasonal variation averaged for the region 100°E − 120°E, 15°S − 5°S.
During 2001–2020, SST in the western tropical Indian Ocean and the Bay of Bengal showed significant warming trends, but there was no such significant trend in the eastern tropical Indian Ocean, including the region south of Java (Figure 3B). There were minor cooling trends in the Java Sea north of the Lombok Strait (around 110°E−120°E, 8°S−3°S), and in the southeastern Indian Ocean (around 100°E−105°E, 18°S−15°S), although these signals were not significant. For April–June (Figure 3C), the warming trends were generally similar to those observed for all seasons (Figure 3B), but an additional significant warming area was observed in the region west and southwest of Sumatra (around 92°E−98°E, 10°S−5°N). This region west of Sumatra has the climatological SST peak during April–May, and this trend indicates that the SST peak increased from 29.4 ± 0.18°C during 2001–2010 to 29.6 ± 0.23°C during 2011–2020. This SST increase is equivalent to the one standard deviation: while statistically significant locally (Figure 3C), the warming trends in the eastern tropical Indian Ocean are uncertain. These trends are generally consistent with the reported long-term trend in the whole Indian Ocean (e.g., Ummenhofer et al., 2021), but they also imply that the coastal upwelling south of Java during this season (April–June) may have been enhanced, as can be expected from the absence of a warming trend in that region.
To examine whether atmospheric convective activity have been affected by the significant warming trends in SST, we observed the trends in OLR (Figure 4). The OLR data for all seasons during 2001–2020 showed no significant trends, but they exhibited a tripole pattern with two negative trends (enhanced convective activity) over the western tropical Indian Ocean and southeastern tropical Indian Ocean east of 100°E, respectively, and one positive trend (reduced convective activity) centered around (80°E − 93°E, 15°S − 3°S) (Figure 4B). The long-term OLR trends in April–June (Figure 4C) revealed significant negative trends in the western tropical Indian Ocean and area surrounding Sumatra and the southeastern Indian Ocean around (80°E − 93°E, 15°S − 3°S), as well as positive trends in areas such as the region south of the Arabian Sea. Compared to the SST trend, OLR showed no basin-wide trend, probably because intraseasonal variations and variability associated with the onset of the Indian monsoon were dominant in this season. Nevertheless, it is worth noting that significant trends of enhanced convective activity west of Sumatra would be associated with local SST warming trends.
Long-term trends in surface wind circulation in the eastern Indian Ocean were consistent with the changes in SST and OLR (Figures 5–7). The results revealed trends in negative sea surface wind curl in the southeastern Indian Ocean, that is, enhanced Ekman divergence and upwelling (Figure 5). Significant long-term trends in wind curl were rarely observed for all seasons (Figure 5B), but were identified in April–June (Figure 5C). Focusing on the eastern Indian Ocean in the Southern Hemisphere, positive trends in wind curl (enhanced Ekman pumping) west of Sumatra and negative trends (enhanced Ekman upwelling) around (87°E − 100°E, 12°S − 6°S) were generated by significant westerly winds in the eastern Indian Ocean and weak southeasterly winds east of 105°E converging around Sumatra (Figure 6). Similar to the trends in wind curl, these trends in surface winds were rarely significant for all seasons (Figure 6B) but were identified in April–June (Figure 6C). The trends in wind speed were also significant only for the April–June period and indicates that southeasterly winds have strengthened off Java (Figures 7B, C). Trends in alongshore southeasterly winds, sea surface wind curl, and enhanced wind speed south of Java, that could lead to coastal upwelling south of Java (Wirasatriya et al., 2020), were observed in April–June (Figures 5C, 6C, 7C). Other trends in the surface wind circulation were observed in the central Indian Ocean and Bay of Bengal in April–June (Figures 5C, 6C, 7C). There were significant trends of southerly and northeasterly winds in the central equatorial Indian Ocean and the Bay of Bengal, respectively, indicating convergence to the equatorial region in the central Indian Ocean. The trends in increased wind speeds around (60°E − 80°E, 8°S − 6°N) indicates that monsoon winds blowing from the southeast across the equator to the north have intensified in this region (Figure 7C). However, their relationship with the trends in SST and enhanced convective activity is not clear.
These observational results are contrary to the possible changes in atmospheric circulation in the tropical Indian Ocean revealed by climate model projections for the 21st century (Vecchi and Soden, 2007; Xie et al., 2010). This topic will be discussed in the next section.
The thermocline depth in the southeastern tropical Indian Ocean, unlike the annual variations in SST and surface wind circulation, exhibits semiannual variations that deepen significantly twice a year around May to June and November (Figure 8A). This is due to the strong eastward current known as the Wyrtki jets (Wyrtki, 1973). The eastward jets occur in the equatorial Indian Ocean around April–May and October–November, and the signals subsequently propagate eastward via downwelling Kelvin waves and deepen the thermocline along the coasts of Sumatra and Java (e.g., Han et al., 1999; Sprintall et al., 2000).
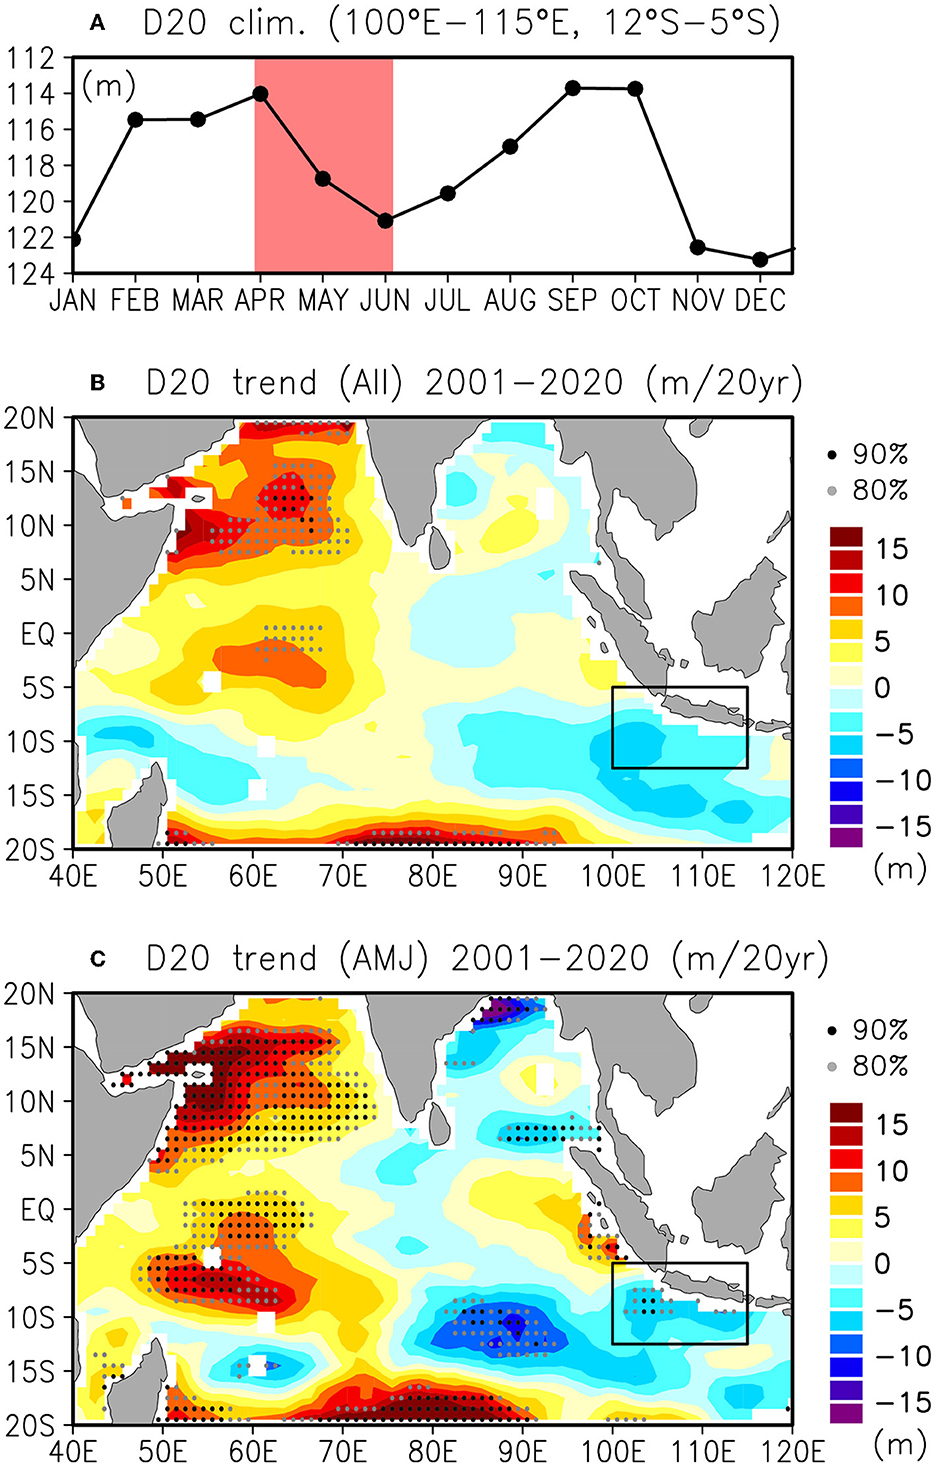
Figure 8. (A–C) Are as in Figures 3A–C, respectively, but for observed trends in 20°C isotherm depth (D20; m) during 2001–2020. Timeseries in (A) shows climatological seasonal variation averaged for the region 100°E − 115°E, 12°S − 5°S. Notice that the vertical axis is reversed.
The trends in the thermocline depth, as determined by the 20°C isotherm depths measured by Argo data, are generally consistent with the responses to atmospheric forcing (Figure 8). For all seasons, significant deepening trends in the Arabian Sea and a portion of the western equatorial Indian Ocean were seen (Figure 8B). For April–June (Figure 8C), significant shoaling trends were observed from the region in the southeastern Indian Ocean (around 80°E − 95°E, 15°S − 8°S) to the region south of Java, as well as northwest of Sumatra and in parts of the Bay of Bengal. The thermocline in the equatorial eastern Indian Ocean showed significant deepening trends. These patterns can be explained by the changes in Ekman divergence and upwelling caused by the atmospheric forcing (Figures 5B, 6B). The deepening trends in the eastern equatorial Indian Ocean likely correspond to the equatorial westerly trends. Although the long-term trends over the past two decades (2001–2020) did not show a simple zonal dipole pattern as suggested by climate model projections for the 21st century (e.g., Vecchi and Soden, 2007; Xie et al., 2010), the trends in April–June were favorable for the observed earlier onset of coastal upwelling south of Java.
4. Discussion and conclusions
Utilizing recently enhanced satellite Chl-a data, this study reports earlier-onset coastal upwelling south of Java during the recent decade (2011–2020) and a possible long-term trend in the onset date. We investigated whether this change was associated with changes in the atmosphere and ocean conditions of the eastern Indian Ocean, focusing on the season of upwelling onset (April–June). The results showed that trends in the atmospheric convective activity and wind circulation were consistent with SST warming trends west of Sumatra.
The observed SST warming trends west of Sumatra may be due to a part of long-term warming trends in the Indian Ocean caused by heat input of enhanced longwave radiation (Du and Xie, 2008). A recent study shows that the spatial pattern of long-term thermocline trends in the Indian Ocean are distinct among different seasons (Sun et al., 2022). While decadal changes in the frequency and magnitude of IOD events greatly influence the long-term annual mean trends (Figure 3B), the April–June season (Figure 3C) excludes the period of IOD developments and thus may show a uniform east-west SST warming trends (e.g., Ummenhofer et al., 2021). The eastern tropical Indian Ocean including west of Sumatra is the area where the Indian Ocean warm pool locates and experiences seasonal high SST during April–June. Assuming an enhanced trend of seasonal high SST west of Sumatra in April–June and atmospheric convergence pattern as a response to the heat source (Gill, 1980), ocean surface divergence due to southeasterly winds off Java would contribute to early onset of the coastal upwelling. There are uncertainties in this regard due to the limited data period, and continuous observations of the upwelling onset and changes in ocean circulation as a response to altered wind forcing in the eastern Indian Ocean are needed.
Cooling trends in the SST (albeit not statistically significant) and shoaling trends in the thermocline depth were only observed south of Java. Why would climate change affect the coastal upwelling system south of Java and not southwest of Sumatra? A possible reason is on the hydrographic conditions south of Java. Horii et al. (2018, 2020) showed that the coastal upwelling signal is more likely to reach the ocean mixed layer south of Java, where the thermocline is shallow and salinity stratification is weak. They also showed that the coastal upwelling signal southwest of Sumatra, where the thermocline is deep and salinity stratification is strong, is less likely to appear at the ocean surface. Due to these differences in background fields, coastal upwelling system south of Java is likely susceptible to long-term climate changes. The SST cooling trends south of Java may continue and become significant in the future, and this point should be closely monitored.
To check whether long-term changes in IOD and ENSO have affected observed changes in the coastal upwelling, we have examined the trend in IOD (DMI) and ENSO (Niño-3.4) for April–June. We obtained a statistically significant (90%) increasing trend only in DMI (positive IOD trend) during 2001–2020. However, the moderate trend (DMI: +0.18/decade) did not fully explain the changes in the timing of coastal upwelling events. In addition to that, this study observed trends of westerly winds and a deepened thermocline in the eastern Indian Ocean including west of Sumatra, unlike the climate model projections.
Under global warming, climate models have predicted that the tropical Indian Ocean could experience a positive IOD-like trend due to weakening of the Walker circulation and reduced mean westerly winds (e.g., Vecchi and Soden, 2007; Xie et al., 2010). If this were the case for the first two decades of the 21st century (2001–2020), thermocline shoaling over the whole eastern equatorial Indian Ocean related to strengthening of coastal upwelling along the coasts of Sumatra and Java would potentially have been observed. However, the results of this study did not support this. Trends of westerly winds in the eastern Indian Ocean and a deepened thermocline were observed. As suggested in previous studies (e.g., DiNezio et al., 2013; Bayr et al., 2014; Kociuba and Power, 2015), climate model projections are controversial as they also show trends that are not purely forced by global warming, but rather arise from internal variability. Rather than a change in global atmospheric circulation, a regional trend of enhanced seasonal high SST west of Sumatra in April–June and resultant surface wind circulation may have enhanced coastal upwelling south of Java. Further study is necessary to clarify the cause of the warming trend, and the possible relationship between the warm SST west of Sumatra and atmospheric response.
The period focused on in this study (2001–2020, and 2003–2020 for the onset date of coastal upwelling) would be insufficient to robustly identify a long-term trend in the coastal upwelling system associated with climate change. Although a basin-scale SST warming trend was obtained as in previous studies, the trends in the OLR and surface wind data showed a complex pattern, different from the long-term changes attributable to global warming. This may be partly due to the large intraseasonal variations, for example from the MJO, during this season (April–June). The OLR trends may be some artifacts of the calculations (so-called aliasing). Nevertheless, the significant SST changes in the high SST region west of Sumatra, enhanced convective activity, and resulting convergence of zonal winds and Ekman upwelling are consistent with the observed shoaling thermocline depth. Results on long-term seasonal trends in the eastern Indian Ocean thermocline depth reported by recent study (Sun et al., 2022) are similar with that obtained in this study. Such a climate change in the eastern Indian Ocean may have been ongoing.
Finally, the early signal of the coastal upwelling may play an active role in the more frequent appearance of positive IOD events in the recent decade. Horii et al. (2022) demonstrated that early onset of the coastal upwelling effectively supplied cold water and led anomalous SST cooling due to cold temperature advection in the southeastern tropical Indian Ocean. Assuming a shallower thermocline and a long-term shift to earlier-onset coastal upwelling, a positive IOD may be more likely to occur through the expansion of anomalously cold SST over the southeastern Indian Ocean. In addition to these dynamical changes, the earlier-onset coastal upwelling could affect local fishing activities. Further research is needed to fully understand the changes in the upwelling system in the eastern tropical Indian Ocean.
Data availability statement
Merged surface Chl-a concentration data were provided by the Copernicus Marine Service (https://resources.marine.copernicus.eu/product-detail/OCEANCOLOUR_GLO_BGC_L3_MY_009_103/INFORMATION). Monthly Chl-a data from Sea-viewing Wide Field-of-view Sensor (SeaWiFS) were provided by the Goddard Space Flight Center of NASA and were obtained through the Asia-Pacific Data-Research Center (APDRC; http://apdrc.soest.hawaii.edu/datadoc/seawif_v5.2_mon.php). HadISST data were provided by the United Kingdom Met Office (UKMO) (https://www.metoffice.gov.uk/hadobs/hadisst/data/download.html). OLR dataset were provided by Physical Sciences Laboratory (PSL), NOAA (https://psl.noaa.gov/data/gridded/data.olrcdr.interp.html). NCEP-DOE Reanalysis 2 wind data were also provided by PSL, NOAA (https://www.esrl.noaa.gov/psd/data/gridded/). The ocean temperature dataset (MOAA GPV) are available at JAMSTEC website (https://www.jamstec.go.jp/argo_research/dataset/moaagpv/moaa_en.html).
Author contributions
TH and IU addressed the idea. ES and II gave advice on the data. TH led the analysis and drafted the manuscript. All authors contributed to the analysis and commented on the manuscript. All authors contributed to the article and approved the submission.
Funding
The present study was supported by the Japan Society for the Promotion of Science (JSPS) Grants-in-Aid for Scientific Research, 18K03753 and 18H03731.
Conflict of interest
The authors declare that the research was conducted in the absence of any commercial or financial relationships that could be construed as a potential conflict of interest.
Publisher's note
All claims expressed in this article are solely those of the authors and do not necessarily represent those of their affiliated organizations, or those of the publisher, the editors and the reviewers. Any product that may be evaluated in this article, or claim that may be made by its manufacturer, is not guaranteed or endorsed by the publisher.
References
Alory, G., Wijffels, S., and Meyers, G. (2007). Observed temperature trends in the Indian Ocean over 1960–1999 and associated mechanisms. Geophys. Res. Lett. 34, L02606. doi: 10.1029/2006GL028044
Bayr, T., Dommenget, D., Martin, T., and Power, S. B. (2014). The eastward shift of the Walker circulation in response to global warming and its relationship to ENSO variability. Clim. Dyn. 43, 2747–2763. doi: 10.1007/s00382-014-2091-y
Cao, G., Xu, T., He, Y., Wang, L., Wang, D., Wei, Z., et al. (2019). Seasonality in intraseasonal sea surface temperature variability along the Sumatra-Java southern coast. J. Geophys. Res. Oceans 124, 5138–5157. doi: 10.1029/2018JC014853
Chen, G., Han, W., Li, Y., Wang, D., and Shinoda, T. (2015). Intraseasonal variability of upwelling in the equatorial Eastern Indian Ocean. J. Geophys. Res. Oceans 120, 7598–7615. doi: 10.1002/2015JC011223
DiNezio, P. N., Vecchi, G. A., and Clement, A. C. (2013). Detectability of changes in the Walker circulation in response to global warming. J. Clim. 26, 4038–4048. doi: 10.1175/JCLI-D-12-00531.1
Du, Y., and Xie, S. P. (2008). Role of atmospheric adjustments in the tropical Indian Ocean warming during the 20th century in climate models. Geophys. Res. Lett. 35, 8. doi: 10.1029/2008GL033631
Du, Y., Zhang, Y., Zhang, L. Y., Tozuka, T., Ng, B., Cai, W., et al. (2020). Thermocline warming induced extreme Indian Ocean dipole in 2019. Geophys. Res. Lett. 47, e2020GL.090079. doi: 10.1029/2020GL090079
Efron, B., and Tibshirani, R. (1991). Statistical data analysis in the computer age. Science 253, 390–395. doi: 10.1126/science.253.5018.390
Garnesson, P., Mangin, A., Fanton d'Andon, O., Demaria, J., and Bretagnon, M. (2019). The CMEMS GlobColour chlorophyll a product based on satellite observation: Multi-sensor merging and flagging strategies. Ocean Sci. 15, 819–830. doi: 10.5194/os-15-819-2019
Gill, A. E. (1980). Some simple solutions for heat-induced tropical circulation. Quarterly J. Royal Meteorol. Soc. 106, 447–462. doi: 10.1002/qj.49710644905
Han, W., McCreary, J. P., Anderson, D. L. T., and Mariano, A. J. (1999). Dynamics of the eastern surface jets in the equatorial Indian Ocean. J. Phys. Oceanogr. 29, 2191–2209.
Hendiarti, N., Aldrian, E., Amri, K., Andiastuti, R., Sachoemar, S. I., Wahyono, I. B., et al. (2005). Seasonal variation of pelagic fish catch around Java. Oceanography 18, 112–123. doi: 10.5670/oceanog.2005.12
Hendiarti, N., Siegel, H., and Ohde, T. (2004). Investigation of different coastal processes in Indonesian waters using SeaWiFS data. Deep Sea Res. Part II 51, 85–97. doi: 10.1016/j.dsr2.2003.10.003
Horii, T., Siswanto, E., Iskandar, I., Ueki, I., and Ando, K. (2022). Can coastal upwelling trigger a climate mode? A study on intraseasonal-scale coastal upwelling off Java and the Indian ocean dipole. Geophys. Res. Lett. 49, e2022GL.098733. doi: 10.1029/2022GL098733
Horii, T., Ueki, I., and Ando, K. (2018). Coastal upwelling events along the southern coast of Java during the 2008 positive Indian Ocean Dipole. J. Oceanogr. 74, 499–508. doi: 10.1007/s10872-018-0475-z
Horii, T., Ueki, I., and Ando, K. (2020). Coastal upwelling events, salinity stratification, and barrier layer observed along the southwestern coast of Sumatra. J. Geophys. Res. Oceans 125, e2020JC.016287. doi: 10.1029/2020JC016287
Horii, T., Ueki, I., Syamsudin, F., Sofian, I., and Ando, K. (2016). Intraseasonal coastal upwelling signal along the southern coast of Java observed using Indonesian tidal station data. J. Geophys. Res. Oceans 121, 2690–2708. doi: 10.1002/2015JC010886
Hosoda, S., Ohira, T., and Nakamura, T. (2008). A monthly mean dataset of global oceanic temperature and salinity derived from Argo float observations. JAMSTEC Rep. Res. Dev., 8, 47–59. doi: 10.5918/jamstecr.8.47
Iskandar, I., Rao, S. A., and Tozuka, T. (2009). Chlorophyll-a bloom along the southern coasts of Java and Sumatra during 2006. Int. J. Remote Sens. 30, 663–671. doi: 10.1080/01431160802372309
Kanamitsu, M., Ebisuzaki, W., Woollen, J., Yang, S-. K., Hnilo, J. J., Fiorino, M., et al. (2002). NCEP-DOE AMIP-II reanalysis (R-2). Bull. Am. Meteorol. Soc., 83, 1631–1644. doi: 10.1175/BAMS-83-11-1631
Kendall, M. G. (1938). A new measure of rank correlation. Biometrika 30, 81–93. doi: 10.1093/biomet/30.1-2.81
Kociuba, G., and Power, S. B. (2015). Inability of CMIP5 models to simulate recent strengthening of the Walker circulation: implications for projections. J. Clim. 28, 20–35. doi: 10.1175/JCLI-D-13-00752.1
Li, Y., Han, W., and Zhang, L. (2017). Enhanced decadal warming of the southeast Indian Ocean during the recent global surface warming slowdown. Geophys. Res. Lett., 44, 9876–9884. doi: 10.1002/2017GL075050
Liebmann, B., and Smith, C. A. (1996). Description of a complete (interpolated) outgoing longwave radiation dataset. Bull. Am. Meteorol. Soc. 77, 1275–1277.
Lumban-Gaol, J., Siswanto, E., Mahapatra, K., Natih, N. M. N., Nurjaya, I. W., Hartanto, M. T., et al. (2021). Impact of the strong downwelling (upwelling) on small pelagic fish production during the 2016 (2019) negative (positive) Indian Ocean Dipole events in the eastern Indian ocean off Java. Climate 9, 29. doi: 10.3390/cli9020029
Madden, R. A., and Julian, P. R. (1994). Observations of the 40–50 day tropical oscillation: a review. Mon. Weather Rev. 122, 814–837.
Mandal, S., Susanto, R. D., and Ramakrishnan, B. (2022). On investigating the dynamical factors modulating surface chlorophyll-a variability along the south Java coast. Remote Sens. 14, 1745. doi: 10.3390/rs14071745
McPhaden, M. J., Meyers, G., Ando, K., Masumoto, Y., Murty, V. S. N., Ravichandran, M., et al. (2009). RAMA: the research moored array for African-Asian-Australian monsoon analysis and prediction. Bull. Am. Meteorol. Soc. 90, 459–480. doi: 10.1175/2008BAMS2608.1
Rayner, N. A., Parker, D. E., Horton, E. B., Folland, C. K., Alexander, L. V., Rowell, D. P., et al. (2003). Global analyses of sea surface temperature, sea ice, and night marine air temperature since the late nineteenth century. J. Geophys. Res. Atmos., 108, 4407. doi: 10.1029/2002JD002670
Saji, N. H., Goswami, B. N., Vinayachandran, P. N., and Yamagata, T. (1999). A dipole mode in the tropical Indian Ocean. Nature 401, 360–363. doi: 10.1038/43854
Saji, N. H., and Yamagata, T. J. C. R. (2003). Possible impacts of Indian Ocean dipole mode events on global climate. Clim. Res., 25, 151–169. doi: 10.3354/cr025151
Sartimbul, A., Nakata, H., Rohadi, E., Yusuf, B., and Kadarisman, H. P. (2010). Variations in chlorophyll-a concentration and the impact on Sardinella lemuru catches in Bali Strait, Indonesia. Prog. Oceanogr. 87, 168–174. doi: 10.1016/j.pocean.2010.09.002
Shi, W., and Wang, M. (2021). A biological Indian Ocean Dipole event in 2019. Sci. Rep. 11, 2452. doi: 10.1038/s41598-021-81410-5
Siswanto, E., Horii, T., Iskandar, I., Gaol, J. L., Setiawan, R. Y., Susanto, R. D., et al. (2020). Impacts of climate changes on the phytoplankton biomass of the Indonesian Maritime Continent. J. Marine Syst. 212, 103451. doi: 10.1016/j.jmarsys.2020.103451
Sprintall, J., Gordon, A. L., Murtugudde, R., and Susanto, R. D. (2000). A semiannual Indian Ocean forced Kelvin wave observed in the Indonesian seas in May 1997. J. Geophys. Res. Oceans 105, 17217–17230. doi: 10.1029/2000JC900065
Sun, S., Fang, Y., Zu, Y., and Liu, B. (2022). Seasonal differences of decadal thermocline depth anomalies in the tropical Indian Ocean. J. Clim. 35, 3947–3959. doi: 10.1175/JCLI-D-21-0476.1
Susanto, R. D., Gordon, A. L., and Zheng, Q. (2001). Upwelling along the coasts of Java and Sumatra and its relation to ENSO. Geophys. Res. Lett., 28, 1599–1602. doi: 10.1029/2000GL011844
Susanto, R. D., and Marra, J. (2005). Effects of the 1997/98 El Niño on Chlorophyll a variability along the southern coasts of Java and Sumatra. Oceanography, 18, 124–127. doi: 10.5670/oceanog.2005.13
Ummenhofer, C. C., Murty, S. A., Sprintall, J., Lee, T., and Abram, N. J. (2021). Heat and freshwater changes in the Indian Ocean region. Nat. Rev. Earth Environ. 2, 525–541. doi: 10.1038/s43017-021-00192-6
Vecchi, G. A., and Soden, B. J. (2007). Global warming and the weakening of the tropical circulation. J. Clim. 20, 4316–4340. doi: 10.1175/JCLI4258.1
Vinayachandran, P. N. M., Masumoto, Y., Roberts, M. J., Huggett, J. A., Halo, I., Chatterjee, A., et al. (2021). Reviews and syntheses: physical and biogeochemical processes associated with upwelling in the Indian Ocean. Biogeosciences 18, 5967–6029. doi: 10.5194/bg-18-5967-2021
Wang, G., Cai, W., Yang, K., Santoso, A., and Yamagata, T. (2020). A unique feature of the 2019 extreme positive Indian Ocean Dipole event. Geophys. Res. Lett. 47, e2020GL.088615. doi: 10.1029/2020GL088615
Wirasatriya, A., Setiawan, J. D., Sugianto, D. N., Rosyadi, I. A., Haryadi, H. Winarso, et al. (2020). Ekman dynamics variability along the southern coast of Java revealed by satellite data. Int. J. Remote Sens. 41, 8475–8496. doi: 10.1080/01431161.2020.1797215
Wyrtki, K. (1962). The upwelling in the region between Java and Australia during the south-east monsoon. Aust. J. Marine. Freshwater Research, 13, 217–225. doi: 10.1071/MF9620217
Wyrtki, K. (1973). An equatorial jet in the Indian Ocean. Science 181, 262–264. doi: 10.1126/science.181.4096.262
Xie, S. P., Deser, C., Vecchi, G. A., Ma, J., Teng, H., Wittenberg, A. T., et al. (2010). Global warming pattern formation: sea surface temperature and rainfall. J. Clim. 23, 966–986. doi: 10.1175/2009JCLI3329.1
Keywords: coastal upwelling, Java–Indonesia, climate change, Indian Ocean Dipole (IOD), chlorophyll-a (Chl-a), decadal variability, tropical Indian Ocean
Citation: Horii T, Ueki I, Siswanto E and Iskandar I (2023) Long-term shift and recent early onset of chlorophyll-a bloom and coastal upwelling along the southern coast of Java. Front. Clim. 5:1050790. doi: 10.3389/fclim.2023.1050790
Received: 22 September 2022; Accepted: 03 April 2023;
Published: 20 April 2023.
Edited by:
Roxy Mathew Koll, Indian Institute of Tropical Meteorology (IITM), IndiaReviewed by:
Samiran Mandal, Centre for Atmospheric Sciences, Indian Institute of Technology Delhi, IndiaAditi Modi, Indian Institute of Tropical Meteorology (IITM), India
Copyright © 2023 Horii, Ueki, Siswanto and Iskandar. This is an open-access article distributed under the terms of the Creative Commons Attribution License (CC BY). The use, distribution or reproduction in other forums is permitted, provided the original author(s) and the copyright owner(s) are credited and that the original publication in this journal is cited, in accordance with accepted academic practice. No use, distribution or reproduction is permitted which does not comply with these terms.
*Correspondence: Takanori Horii, aG9yaWl0QGphbXN0ZWMuZ28uanA=