 Zhen Gao1,2,3
 Shang-Min Long
 Jia-Rui Shi
 Lijing Cheng
 Gen Li
- 1Key Laboratory of Marine Hazards Forecasting, Ministry of Natural Resources, Hohai University, Nanjing, China
- 2State Key Laboratory of Ocean Environment Dynamics, Second Institute of Oceanography, Ministry of Natural Resources, Hangzhou, China
- 3College of Oceanography, Hohai University, Nanjing, China
- 4Woods Hole Oceanographic Institution, Woods Hole, MA, United States
- 5Institute of Atmospheric Physics, Chinese Academy of Sciences, Beijing, China
The surface ocean mixed layer (OML) is critical for climate and biological systems. Changes in ocean mixed layer depth (MLD) of the Indian Ocean under global warming are examined utilizing outputs from 24 climate models in the Coupled Model Intercomparison Project phase 6 (CMIP6) models and the Community Earth System Model 1.0 with Community Atmosphere Model version 5 (CESM1–CAM5). The results show that the MLD generally decreases in low- and high-emissions Shared Socioeconomic Pathway (SSP) scenarios (ssp126 and ssp585). In ssp126 and ssp585, the multi-model ensemble-mean OML, respectively shoals about 5 and 10% over both the northern tropics and southern subtropics, with high model consistency. This robust OML shoaling appears in the 1980s and is closely associated with increased surface buoyancy forcing and weakened winds. In contrast, the OML in the south equatorial Indian Ocean slightly deepens and displays large intermodel differences in the sign and magnitude of the changes. The effects of direct CO2 increase and wind changes on OML changes are further quantified by CESM1–CAM5 partially coupled experiments. The results show that the increased surface net heat flux from direct CO2 increase dominates OML shoaling in the northern tropics. In the southern subtropics, the increased surface heat flux, reduced wind speed, and wind-driven divergence all facilitate the OML shoaling. In the south equatorial Indian Ocean, wind changes generally deepen the OML, consistent with the CMIP6 results. Moreover, the OML shoaling-related upper ocean stratification changes are contributed by both temperature and salinity changes in the northern tropics but dominated by temperature changes south of 10°S. These results highlight the regional differences in MLD changes and their forcing, which is important for understanding regional climate changes and corresponding changes in extreme events and biological systems under global warming.
1. Introduction
The surface ocean mixed layer (OML) is closely associated with physical, chemical, and biological processes in the ocean (Sabine et al., 2004; Ito et al., 2010; Sallée et al., 2012, 2013; Yamaguchi and Suga, 2019). The uniformity and stability of the OML are critical for marine primary production and the global carbon cycle. Moreover, the OML is a key medium in ocean-atmosphere interactions for the exchange of gas, heat, and momentum between them (Russell et al., 2006; Sallée et al., 2021). The OML responds quickly and directly to external forcing, through which heat and momentum are transferred to the deeper ocean and subsequently slowly return to the atmosphere. Most water masses form in the OML, and their initial properties directly affect the oceanic uptake and storage of heat and carbon (Emery, 2001; Sallée et al., 2012; Lauderdale et al., 2013; Liu et al., 2018, 2021; Long et al., 2020; Bourgeois et al., 2022; Melet et al., 2022). The ocean mixed layer depth (MLD) is an essential metric of the OML and plays an important role in the climate system, especially in regulating changes in the sea surface temperature (SST), hydrological cycle, wind, and global energy balance (Price, 1981; Bender and Ginis, 2000; Gupta et al., 2022).
MLD changes significantly impact regional climate. For example, the Northeast Pacific OML has been observed to significantly shoal since 1980, which can exacerbate SST changes (Alexander and Penland, 1996; Alexander et al., 2000, 2018) and, thus, increase the frequency of marine heatwaves (Amaya et al., 2021; Elzahaby et al., 2022; Shi et al., 2022). OML shoaling may also weaken sea surface cooling processes caused by tropical cyclones (Wu et al., 2005; Anilkumar et al., 2006; Lin and Wu, 2008; Mei et al., 2015; Lin et al., 2017). Therefore, shoaled OML may enhance tropical cyclone intensities (Wu et al., 2018). Additionally, MLD changes can influence oceanic heat absorption and storage under global warming (Katavouta et al., 2019).
Factors influencing MLD changes include surface buoyancy forcing due to surface heat and freshwater flux, wind forcing, and ocean interior processes (Liu and Lu, 2016). Changes in surface net heat flux (Qnet) and precipitation minus evaporation (P−E) modulate surface buoyancy forcing by altering the surface water density, thereby changing the mixing efficiency and MLD. Wind forcing can influence the MLD by altering the mechanical energy inputs (i.e., wind stirring), wind stress–forced convergence/divergence, and wind-driven turbulent heat flux (Halpern, 1974; Cushman-Roisin, 1981; Somavilla et al., 2017; Young and Ribal, 2019; Ushijima and Yoshikawa, 2020; Toualy et al., 2022). Over the past half-century, upper ocean stratification has increased substantially (Capotondi et al., 2012; Li et al., 2020). Stable stratification inhibits vertical mixing, shallows the OML, and reduces the exchange of materials and energy between the surface and deeper oceans (Cai et al., 2013, 2020; Somavilla et al., 2017; Breitburg et al., 2018; IPCC, 2019; Kwiatkowski et al., 2020; Bourgeois et al., 2022). Furthermore, climate models project that the upper ocean stratification will continuously strengthen under most global warming scenarios (Yeh et al., 2009; Capotondi et al., 2012; Cabré et al., 2014; Fu et al., 2016; Moore et al., 2018), which is conducive to future OML shoaling.
The Indian Ocean plays a substantial role in global climate systems. It has shown consistent basin-scale warming since the 1950s, which affect the regional climate over multiple time scales (Saji et al., 1999; Webster et al., 1999; Alory et al., 2007; Cai et al., 2013; Han et al., 2014; Yang et al., 2022), such as extreme weather in nearby regions (Lau et al., 2006; Francis and Vavrus, 2012; Tierney et al., 2013), East Asian and Pacific climate anomalies (Xie et al., 2009, 2016; Luo et al., 2012; Zhang et al., 2019; Abram et al., 2020; Zhou et al., 2021), and the Atlantic meridional overturning circulation (Hu and Fedorov, 2019). In addition, oceanic surface warming is determined by the OML heat budget, in which MLD changes may play an important role in shaping the pattern and magnitude of the warming (Yeh et al., 2009). Moreover, MLD changes and associated ocean stratification are important for changes in mode water formation and ocean circulation changes (Xu et al., 2013; Ju et al., 2020). However, the characteristics and mechanisms of MLD changes in the Indian Ocean under global warming are not well understood, especially their regional patterns and quantitative contributions from buoyancy forcing and winds.
Therefore, the present study utilizes outputs from climate models participating in the Coupled Model Intercomparison Project Phase 6 (CMIP6) to examine MLD changes in the Indian Ocean under the Shared Socioeconomic Pathway scenarios 1–2.6 (ssp126) and 5–8.5 (ssp585) relative to the historical period. The results show that the MLD significantly decreases in most regions throughout 21st century, which is robust across models in both scenarios. However, the MLD of the south equatorial Indian Ocean deepens slightly after 2000 and displays large intermodel differences. Furthermore, partially coupled experiments using the Community Earth System Model 1.0 with Community Atmosphere Model version 5 (CESM1-CAM5, Hurrell et al., 2013) are analyzed to quantify MLD changes driven by the effect of direct CO2 increase with constant wind and the effect of wind changes alone. The results highlight the regional differences in MLD changes and corresponding driving factors, which are critical for understanding changes in regional mean climate and extreme events under global warming.
2. Data and methods
2.1. Observation and reanalysis
To examine the performance of the climate models, the MLD is calculated using monthly mean ocean temperature and salinity data from the Scripps Argo dataset (2004–2021) and the Institute of Atmospheric Physics (IAP, 1940–2021). The Argo data have a global grid of 1° and are provided by the Scripps Institution of Oceanography (Roemmich and Gilson, 2009). The IAP data feature global coverage of the oceans, at a 1° × 1° horizontal resolution on 41 vertical levels from in the upper 2,000 m, and range from 1940 to the present. The MLD is calculated as the depth at which the ocean potential density exceeding the sea surface density at a criterion of δρ = 0.125 kg/m3, following the definition for MLD outputs (referred to as “mlotst”) from the CMIP6 models.
2.2. CMIP6 models and simulation
In CMIP6, 24 models that provide MLD and related variables in historical and future simulations (Eyring et al., 2016) are utilized, specifically ACCESS-CM2, ACCESS-ESM1-5, AWI-CM-1-1-MR, BCC-CSM2-MR, CAMS-CSM1-0, CAS-ESM2-0, CESM2-WACCM, CMCC-CM2-SR5, CMCC-ESM2, CanESM5, EC-Earth3, EC-Earth3-Veg, EC-Earth3-Veg-LR, FGOALS-f3-L, FGOALS-g3, GFDL-ESM4, IPSL-CM6A-LR, MIROC6, MPI-ESM1-2-HR, MPI-ESM1-2-LR, MRI-ESM2-0, NESM3, NorESM2-LM, and NorESM2-MM. Only the first ensemble member (r1i1p1f1) of each model is selected, and all variables are interpolated into a common grid of 1° × 1° for convenient data analyses and visualization.
In ssp126, radiative forcing (RF) first increases to a peak of 3 W/m2 at ~2045 and subsequently decreases to 2.6 W/m2 by 2100 (Figure 1A, gray line). During 2050–2100, the multi-model ensemble-mean (MME) and global-mean surface temperature (GMST) change is weak, and the GMST trajectory remains nearly flat in the CMIP6 MME and most models (Long et al., 2020). In ssp585, RF increases constantly and reaches 8.5 W/m2 by 2100 (Figure 1B, gray line), which is associated with rapid, intense, and continuous GMST increase. In the MME, the increase in GMST by 2100 is < 2°C in ssp126 and ~5°C in ssp585 relative to 1850–1899 mean.

Figure 1. Global-mean surface (2 m) air temperature change (ΔGMST, °C) relative to 1850–1899 mean in (A) ssp126 and (B) ssp585. The gray thick lines indicate the radiative forcing (RF, W m−2) pathway, the colored thin lines indicate results of each model and the colored thick lines are multi-model ensemble-mean (MME).
2.3. CESM1-CAM5 experiments
Quantitative analyses of MLD changes are examined based on the CESM1-CAM5 fully coupled and partially coupled runs conducted by Liu et al. (2018). A partial coupling method based on the overriding technique (Lu and Zhao, 2012; Liu et al., 2015) is applied in specific experiments to isolate and quantify the contributions of the direct CO2 increase (dirCO2, c), wind stress (τ) forcing, and wind speed (w) forcing on the oceanic response (Table 1). The partial coupling is implemented by overriding the wind speed or wind stress from specific states of interest to isolate their effect. The overriding technique is realized through overriding the time series of one or more variables at the air–sea interface from a fully coupled run to disable the targeted process or feedback. Specifically, the fully coupled runs, a preindustrial control run (CTRL) and a quadruple CO2 run (4 × CO2), are first conducted. The overriding variables from these two coupled runs are first output for overriding purpose at each time step of air–sea coupling in CESM1–CAM5. The fully coupled total response to global warming is estimated as 4 × CO2 – CTRL. In the specific partially coupled experiments, the τ1w1c1 run is overridden by the wind stress and wind speed from CTRL run and fixes atmospheric CO2 concentration at the control run states, the τ1w1c4 run increases the atmospheric CO2 concentration to the 4 × CO2 level but is still overridden by the wind stress and wind speed from CTRL run, and the τ4w1c4 run is also forced by the 4 × CO2 increase but overridden by the wind stress from 4 × CO2 run and wind speed from CTRL run. Hence, the direct CO2 effect is calculated as τ1w1c4 – τ1w1c1 (labeled as dirCO2 effect). The effects of wind stress changes are evaluated as τ4w1c4 – τ1w1c4 (labeled as Wstr effect), and the residual is mainly the effect of wind speed changes. Further detailed information about the model and experimental design is provided in Liu et al. (2018). Note that in the dirCO2 effect, only surface heat and freshwater flux changes, and the consequential stratification-forced ocean dynamical processes resulting from CO2 increase (without wind stress and wind speed changes) influence the MLD. Wind stress and wind speed forcing alter the OML by changing the surface turbulent heat flux and surface freshwater flux. Moreover, wind stress forces the changes in wind stirring, Ekman pumping, and ocean dynamical processes to modulate the MLD. Only the last 50 years of each CESM1-CAM5 run are examined to determine the changes in the final state of the simulations.

Table 1. Design of the CESM1-CAM5 experiments.
2.4. Methods
To investigate the causes of the MLD changes in the Indian Ocean, we calculate the changes in the surface buoyancy flux and stratification in the upper ocean (0–100 m). The surface buoyancy flux and its thermal (BuoyT) and saline (BuoyS) components are defined as follows:
where Qnet is the net surface heat flux, Wnet is the net surface freshwater flux, S0 is the sea surface salinity, and is the density of the seawater. The specific heat capacity of seawater is , α is the thermal expansion coefficient, and β is the saline contraction coefficient.
Upper ocean stratification is estimated as the squared buoyancy frequency calculated by the vertical gradient of the density:
For a first-order approximation, the buoyancy frequency can be expressed as a linear combination of the temperature and salinity contributions:
where g(= 9.8 m s−2) is the acceleration of gravity, T is the seawater temperature, S is the seawater salinity, and ρ is seawater density.
The wind-driven convergence/divergence or Ekman pumping (Wek) is estimated as:
where is wind stress and f the Coriolis parameter. Positive values indicate upwelling.
3. Results
3.1. MLD changes in CMIP6 models
3.1.1. Characteristics of MLD changes
Figure 2 displays the climatology of the MLD in the Scripps Argo dataset during 2004–2021, and in the ensemble mean of the IAP and 24 CMIP6 models during 1950–1999. In the Indian Ocean, the model-simulated MLD closely resembles that of the observation (Argo, Figure 2A) and IAP data (Figure 2B). The MLD is deep in the Arabian Sea and the southern Indian Ocean (south of 10°S) but shallow in the equatorial Indian Ocean and the Bay of Bengal. In addition, the magnitudes of the MLD are comparable between the model simulations and Argo observations, despite the differences in time period. Therefore, the CMIP6 models reasonably simulate the Indian Ocean MLD, which enables further investigation in future MLD changes under low- (ssp126) and high-emissions (ssp585) scenarios.

Figure 2. The climatology of annual-mean MLD (m) in Indian Ocean for (A) the Argo dataset during 2004–2021, (B) the IAP data during 1950–1999, and (C) the CMIP6 MME during 1950–1999.
Under both ssp126 and ssp585, the MME results (Figure 3) show that, during 2050–2099, the MLD generally decreases in the Indian Ocean relative to 1950–1999. Specifically, OML shoals significantly in the northern tropics (Region 1, 50°E−98°E and 2°S−25°N) and southern subtropics (Region 3, 50°E−113°E and 30°S−14°S). In contrast, the OML deepens slightly in the south equatorial Indian Ocean, west of 85°E (Region 2, 41°E−85°E and 12°S−3°S). Moreover, the shoaling trend broadly enhances as the emissions increase from ssp126 to ssp585. In most regions of the Indian Ocean, the MLD shoaling is below 5 m in ssp126 and above 5 m in ssp585. The percentage change in MLD relative to the historical period (1950–1999) in most regions is ~5% in ssp126 and 10% in ssp585. The maximum percentage changes in ssp126 and ssp585 appear in the east equatorial Indian Ocean at ~10 and 20%, respectively.
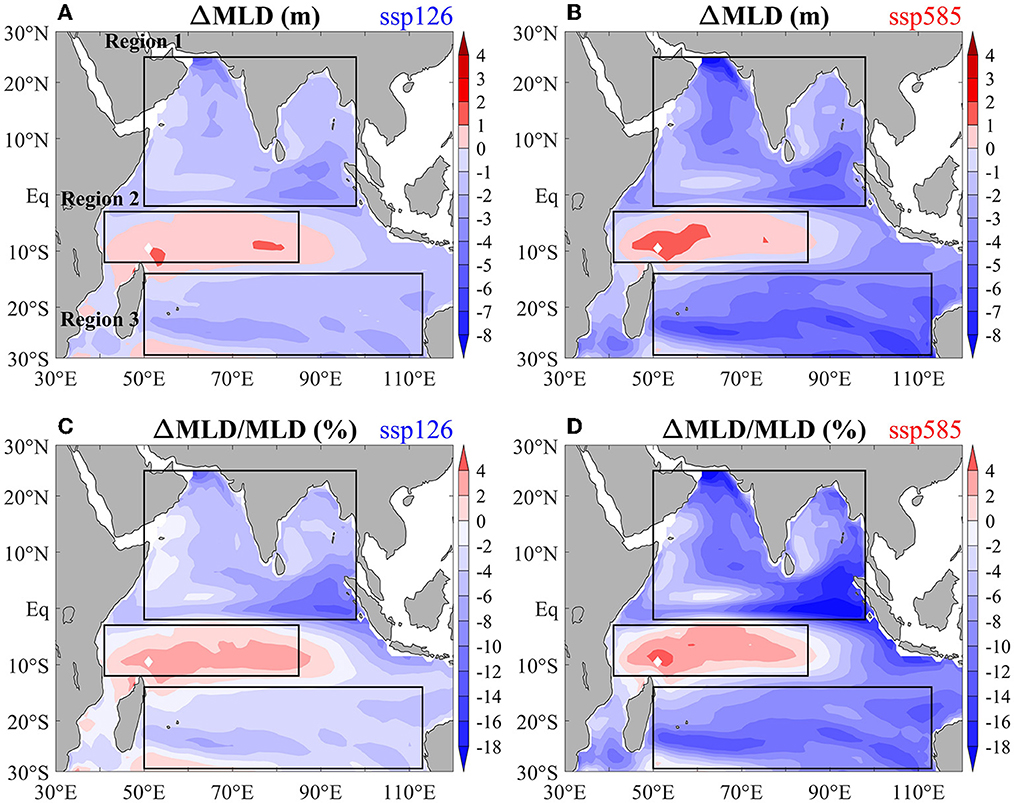
Figure 3. The CMIP6 MME changes of MLD (m) in the Indian Ocean in (A) ssp126 and (B) ssp585 relative to 1950-1999 mean. (C, D) Are respectively the same as (A, B) but for percentage changes (%) of MLD. Black boxes indicate the domain of three selected regions.
Figure 4 displays the area-mean MLD changes in the three selected regions (Figure 3) for each CMIP6 model (green bars) and the MME (black bars). In Regions 1 and 3, nearly all models consistently project a decrease in the MLD in both scenarios, despite differences in the projected magnitudes. Moreover, the model uncertainty, calculated as the intermodel standard deviations (red error bar), is smaller than the MME value, especially for ssp585. This suggests that OML shoaling is robust in Regions 1 and 3. However, in Region 2, MME changes are relatively weak and the intermodel differences in both the sign and magnitude of the changes are substantially large (Figures 4B, E). As a result, the OML deepening in Region 2 under global warming remains highly uncertain, possibly because of the large compensation between the opposite contributions from different influencing factors. Note that the signal-to-noise ratio, defined as the MME change divided by intermodel standard deviation, is smaller in ssp585 than that in ssp126, despite a higher external forcing in the former. Moreover, despite that CMIP6 models display biases in simulating the climatology MLD compared to observations and reanalysis datasets (Figure 2), there is weak and insignificant intermodel correlation between the climatology MLD and future MLD changes in all three regions (not shown).
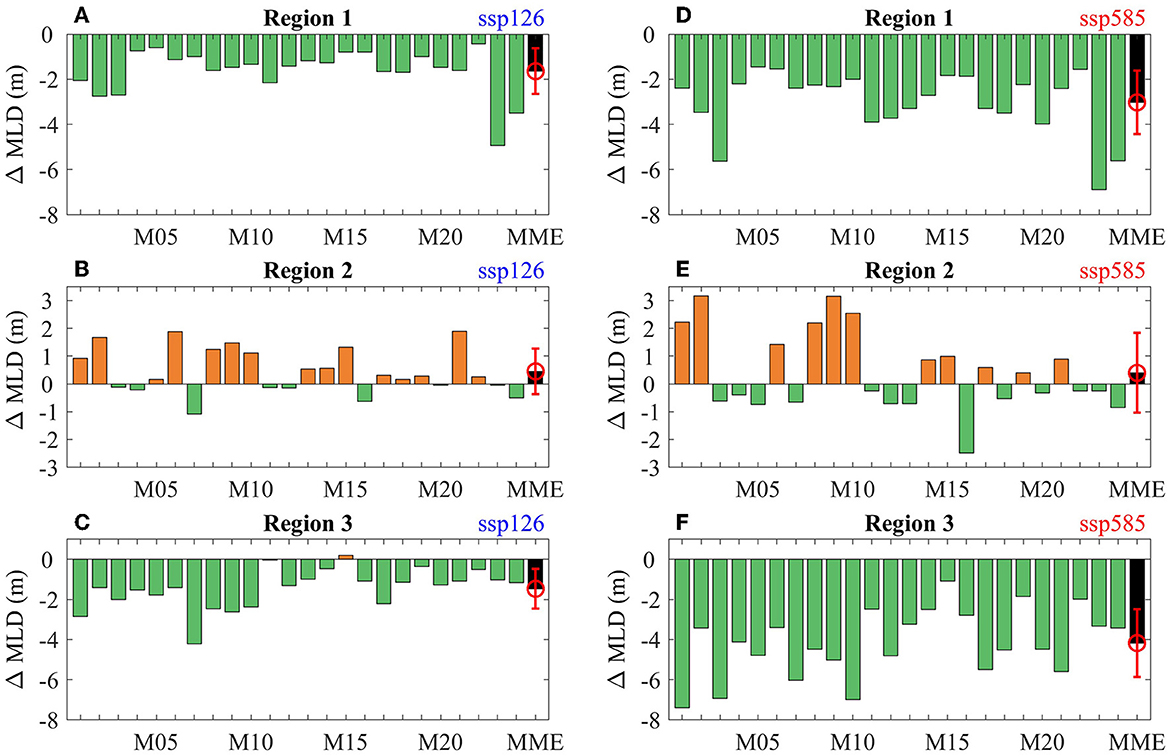
Figure 4. Changes of MLD in the Indian Ocean for each CMIP6 model (green bar) and MME (black bar) for (A) Region 1 (50°E−98°E, 2°S−25°N), (B) Region 2 (41°E-85°E, 12°S-3°S), and (C) Region 3 (50°E−113°E, 28°S−14°S) in ssp126 relative to 1950–1999 mean. (D–F) Are the same as (A, B) but for ssp585. The red error bar indicates the range of one standard deviation.
In terms of time evolution (Figure 5), the MLD displays a robust shoaling signal relative to 1950–1999 mean level in Regions 1 and 3 by 2100 under both scenarios. However, the shoaled OML slightly recovers after 2050 in ssp126 (Figures 5A, C) as RF declines and GMST stabilizes (Figure 1A). Hence, the OML shoaling peaks at ~2050 in ssp126; however, the shoaling strengthens over time in ssp585 (Figures 5D, F) following the continuous increases in RF and GMST (Figure 1B). In Region 2, a weak deepening trend of MLD appears after the 1980s. However, this trend displays a large intermodel range that exceeds the MME value (Figures 5B, E). Moreover, the model uncertainty in the MLD changes in Region 2 increases over time in ssp585 and peaks by 2100 despite large increases in RF and GMST. This suggests that, in Region 2, the intermodel discrepancies in the driving forcing for the MLD changes increases over time under the high-emissions scenario.
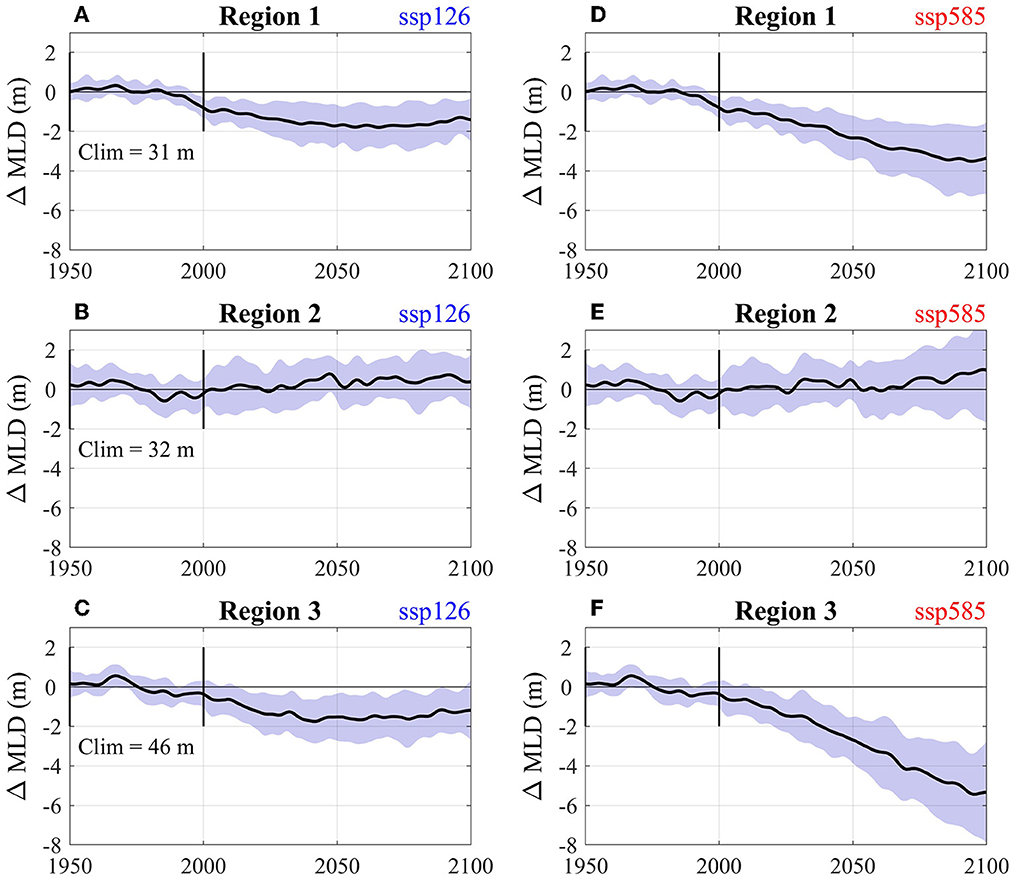
Figure 5. Time series of area-mean MLD changes relative to 1950–1999 mean for (A) Region 1, (B) Region 2, and (C) Region 3 in ssp126. (D–F) Are the same as (A–C), but for ssp585. Shading indicates the range of one standard deviation.
3.1.2. Drivers of regional MLD changes
To explore the relationships between MLD changes and surface forcing, we further examine changes in surface heat flux (Qnet), freshwater flux ((P−E)), wind speed (U10), wind stress (τ), and Ekman pumping (Wek; Figure 6) in ssp585. The results in ssp126 are similar but at a smaller magnitude (not shown). North of 10°N in Region 1, the positive Qnet and (P−E) both reduce the surface water density, thereby strengthening the surface layer stratification, which is conducive for the OML shoaling. Between 0° and 10°N, the Qnet and (P−E) tend to have opposite effects on MLD, with the former deepening the western OML while the latter shoaling it, and vice versa for the eastern OML. The surface wind weakens throughout Region 1, which largely shoals the OML owing to reduced wind stirring and suppressed wind-driven latent heat loss from the ocean. However, the wind stress-induced convergence (−Wek>0) to some extent offset this effect west of 80°E.
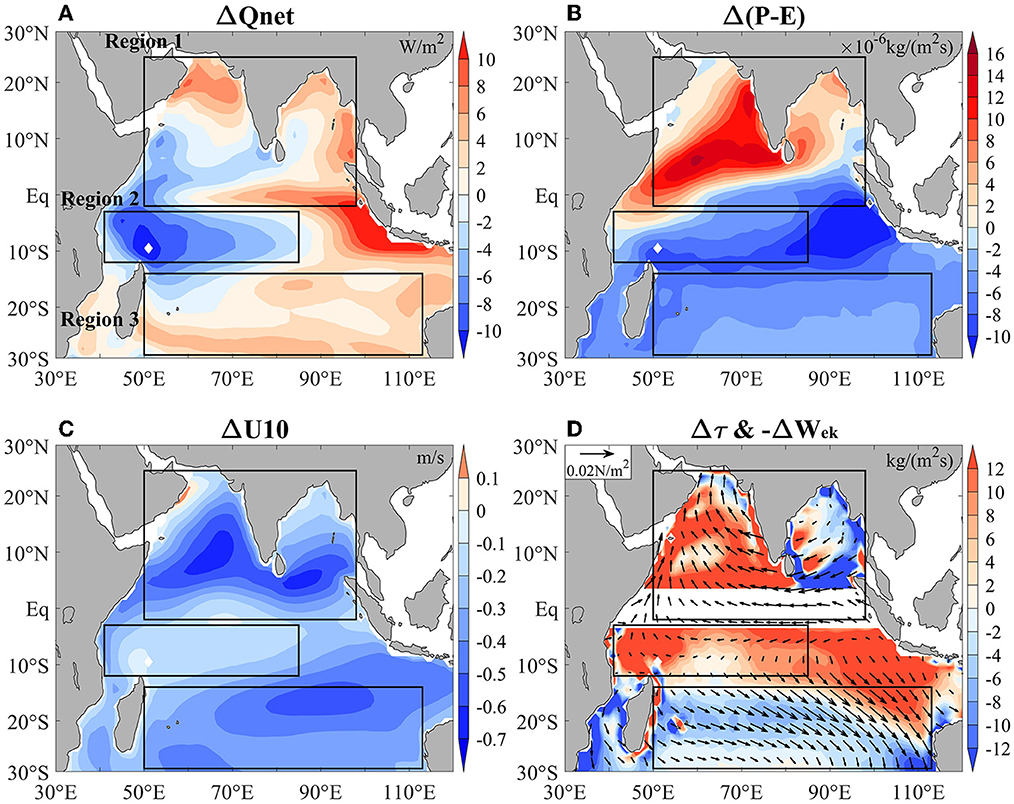
Figure 6. Changes of (A) surface heat flux Qnet (red shading for surface ocean heat gain and blue shading for heat loss), (B) surface freshwater flux P−E, (C) surface (10 m) wind speed U10, and (D) wind stress and Ekman pumping −Wek (red shading for downwelling and blue for upwelling) in ssp585 relative to 1950–1999 mean.
In Region 2, the net surface heat loss, decreased P−E, and wind stress-induced convergence all tend to deepen the OML. With these favorable surface conditions for OML deepening, the MLD in Region 2 would be expected to increase significantly. However, the deepening trend in Region 2 is much weaker than the shoaling trends in the other regions (Figures 3, 4). This suggests that ocean interior processes may largely suppress the OML deepening; Moreover, the large intermodel differences in wind changes may obscure the deepening trend. South of 10°S (Region 3), the MLD decreases the most, which is associated with a shoaling effect from Qnet>0, decreased wind speed, and −Wek>0 that may overwhelm the deepening effect from (P−E) < 0.
Furthermore, the area-mean results show that, in Region 1, the increased Qnet (Figure 7B) and P−E (Figure 7C) both lower the surface density; they display nearly equal contributions to the surface buoyancy increase (Figure 7F) and, hence, the MLD decrease (Figure 7A). The reduced wind speed (Figure 7D) is also conducive for OML shoaling but may to some extent be offset by the wind-driven convergence (−Wek>0) (Figure 7E). The model uncertainty (red error bar) is low relative to the magnitude of MME changes in surface buoyancy and wind forcing for Region 1, thereby explaining why the OML shoaling is robust across models.
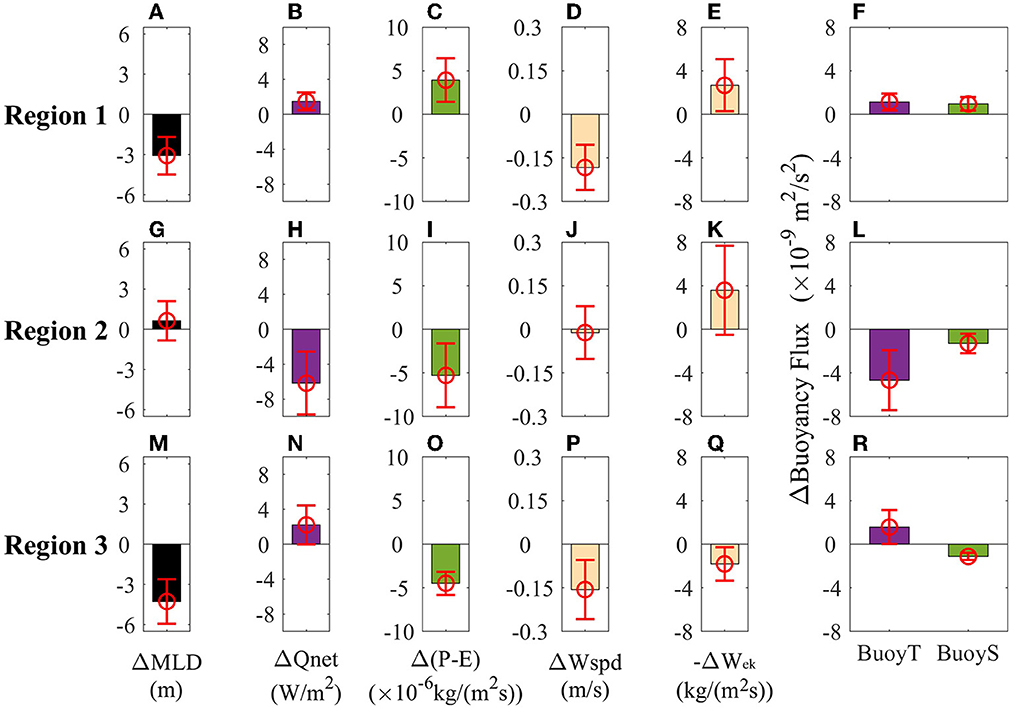
Figure 7. Area-mean changes of Region 1 (A) MLD, (B) Qnet, (C) wind speed (Wspd), (D) precipitation minus evaporation (P − E), (E) −Wek, and (F) surface buoyancy flux changes due to temperature (BuoyT) and salinity (BuoyS) in ssp585. (G–R) Are the same as (A–F) but for Region 2 and Region 3, respectively. The red error bar indicates the range of one standard deviation.
In Region 2, the slight OML deepening is a result of the wind-driven convergence and weakened buoyancy from a decrease in Qnet and P−E, possibly with a weak contribution from wind speed as its change is negligible. The surface buoyancy change resulting from the surface heat flux change is nearly twice that from the surface freshwater flux (Figures 7H, I, L). However, the effects of wind are highly uncertain because of the large intermodel spread for both wind speed and wind stress changes (Figures 7J, K), which causes smaller magnitude of MME changes than the intermodel standard deviation (Figure 7G, red error bar).
The OML shoals the most in Region 3 (Figure 7M), but the underlying driving factors differ from those in Region 1. The decreased MLD is closely associated with the enhanced buoyancy (Figure 7R) due to increased Qnet (Figure 7N), the decreased wind speed (Figure 7P), and the wind-driven divergence (−Wek < 0, Figure 7Q). As a result, OML shoals notably in Region 3 despite a decrease in P−E (Figure 7O).
To examine the detailed vertical structure associated with the MLD changes, we calculate changes in the ocean stratification in the upper 100 m (N2) and the contributions from temperature () and salinity (; Figure 8). In Region 1, the shoaled OML is accompanied by strengthened stratification in the upper 100 m. The increased Qnet and P−E tend to warm and refresh the seawater, thereby strengthening the upper ocean stratification. The thermal and saline contributions to ocean stratification change are comparable above 40 m (Figure 8A), consistent with those for surface buoyancy change (Figure 7F). This suggests that surface heat and freshwater flux display nearly equal importance in shoaling OML (green line) and the contribution from ocean interior processes may be weak. In Region 2, ocean stratification weakly decreases in the upper 40 m, which is consistent with the slightly deepened OML. The saline contribution to stratification change is nearly the same as or even larger than the thermal contribution in the upper 40 m (Figure 8B). This differs from the much weaker saline contribution than thermal contribution on surface buoyancy change (Figure 7L), illustrating that the ocean interior processes is also important in altering the MLD in Region 2. The more stratified upper layer in Region 3 is dominated by temperature changes throughout the upper 100 m (Figure 8C), with a slight negative contribution from salinity changes as the decreased P−E reduces surface buoyancy. Ocean interior process may amplify the contribution from temperature change as the surface buoyancy change resulting from the surface heat and freshwater flux are of comparable magnitudes.
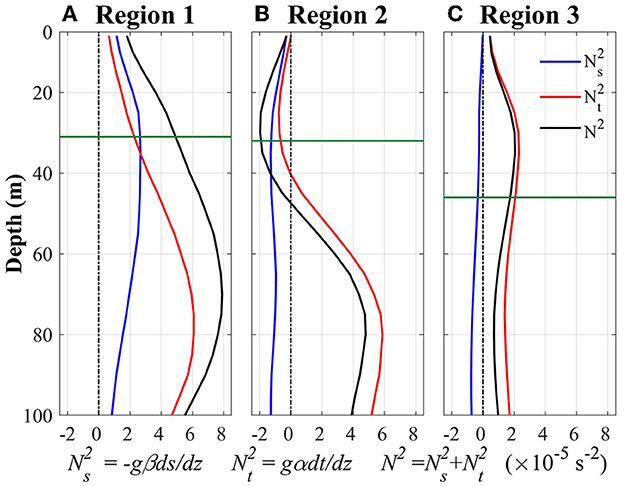
Figure 8. Change of upper ocean stratification (black line) and its component due to temperature change (red line) and salinity change (blue line) for (A) Region 1, (B) Region 2, and (C) Region 3 in ssp585. Green line indicates the location of climatology MLD in 1950–1999.
Diagnostic analyses highlight that the characteristics and driving factors of MLD changes substantially differ across regions. Additionally, under both ssp126 and ssp585, the OML shoaling in Regions 1 and 3 is robust in the CMIP6 models, whereas the deepening in Region 2 is highly uncertain (Figure 4). For both Regions 1 and 3, the robust OML shoaling is tightly associated with the increased surface heat flux, reduced wind stirring, and suppressed latent heat flux loss from the ocean. In Region 2, the decrease in Qnet and P−E and the wind-driven convergence all facilitate the OML deepening. The winds display substantial intermodel differences and are the main cause of the large uncertainty in the OML deepening. However, in the diagnostic analyses, the relative roles of surface buoyancy, wind changes, and their related processes cannot be quantified. For example, the heat flux changes caused by wind-forced turbulence cannot be isolated from those induced by direct CO2 increase.
3.2. MLD changes in CESM1-CAM5
3.2.1. Quantitative contributions from CO2 and wind
To directly compare and quantify the effects of various forcing on MLD changes, we utilize the outputs from the CESM1–CAM5 fully and partially coupled experiments to decompose the total coupled response of the MLD into the effects of the dirCO2 forcing, wind stress forcing, and wind speed forcing.
As shown in Figure 9A, in the CESM1–CAM5 fully coupled experiments, the spatial patterns of the MLD changes are highly consistent with those of the CMIP6 MME results. For example, the significant shoaling in Regions 1 and 3 and slight deepening in Region 2 are also produced in CESM1–CAM5. Furthermore, the dirCO2 forcing shoals the OML at the basin scale (Figure 9B). Wind stress forcing deepens the MLD in the south equatorial Indian Ocean and most north tropical regions west of 90°E (Figure 9C). In contrast, it predominantly shoals the OML in the eastern equatorial ocean and southern subtropics. Wind speed changes tend to decrease the MLD in most regions and increase it in limited regions in the west (Figure 9D).
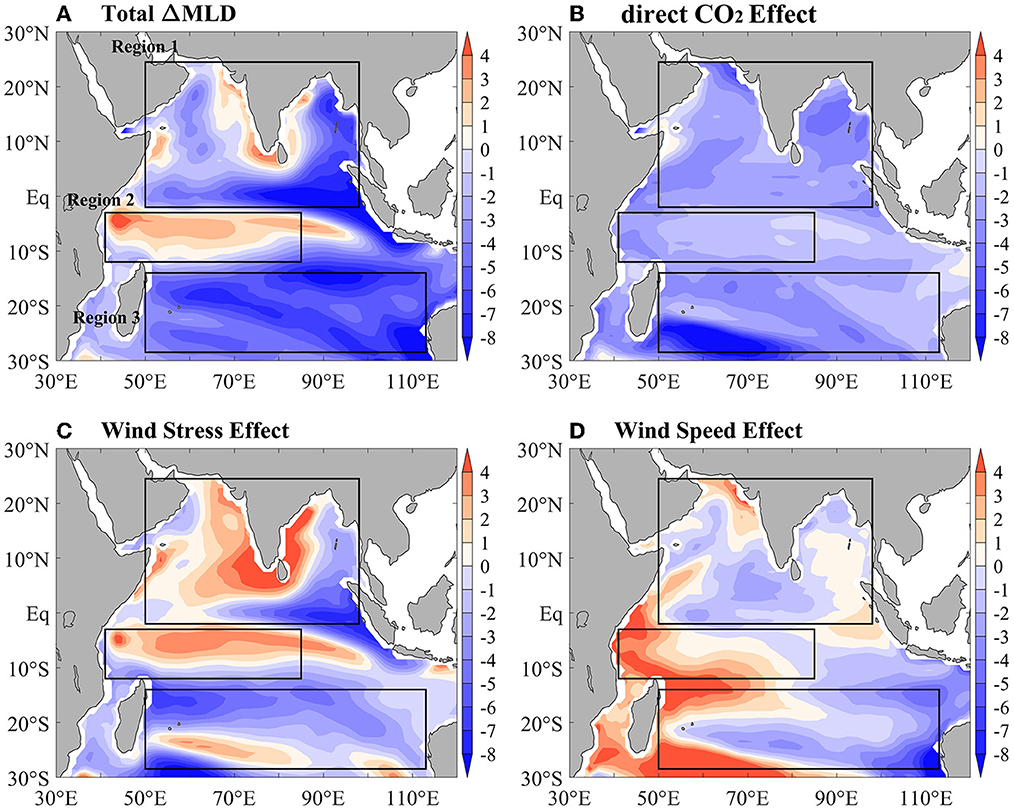
Figure 9. Changes of MLD (m) in CESM1-CAM5. (A) The total MLD response in fully coupled run (4×CO2 – CTRL). (B–D) Are the contributions resulting from the direct CO2 increase (τ1w1c4 – τ1w1c1), wind stress forcing (τ4w1c4 – τ1w1c4) and wind speed forcing (residual), respectively.
The area-mean results (Figure 10) show the quantitative contributions from the dirCO2 forcing and wind forcing on MLD changes in the three selected regions. The shoaled OML (black bar) in Region 1 is dominated by the dirCO2 effect (red bar), with a relatively weak positive contribution from wind speed forcing (purple bar). The wind stress forcing slightly deepens the OML in Region 1, which is consistent with the diagnostic results in ssp585. In Region 2, the deepened OML is primarily due to wind stress and wind speed forcing, which is dampened by the dirCO2 effect (Figure 10B). In Region 3, the dirCO2 effect and wind stress forcing jointly shoals the OML, with a weak contribution from wind speed changes.
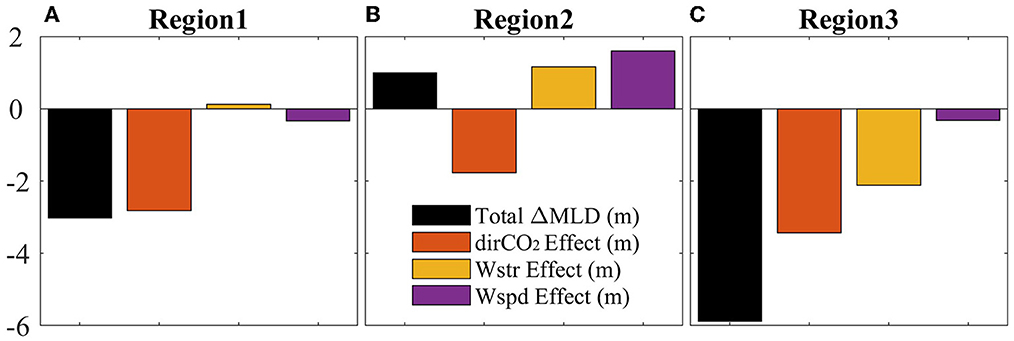
Figure 10. The total change of MLD and the contributions from dirCO2 effect, wind stress (Wstr) effect and wind speed (Wspd) effect for (A) Region 1, (B) Region 2, and (C) Region 3 in CESM1-CAM5.
As MLD largely varies across seasons, we further examine the MLD changes during each calendar month in CESM1-CAM5 (Figure 11). In Regions 1 and 3, OML shoaling occurs during most months but reaches a maximum during the local winter half year. It is dominated by the dirCO2 effect, that is, surface buoyancy forcing and ocean interior processes resulting from CO2 increase. Additionally, wind stress and wind speed changes deepen the MLD in Region 3 during certain months. In Region 2, the OML deepening mainly occurs during boreal spring and winter due to wind forcing, with a shoaling effect from the dirCO2 effect that reaches its maximum during August–November. The results highlight that the seasonal evolution of MLD changes is dominated by the dirCO2 effect in Regions 1 and 3 and by wind changes in Region 2.
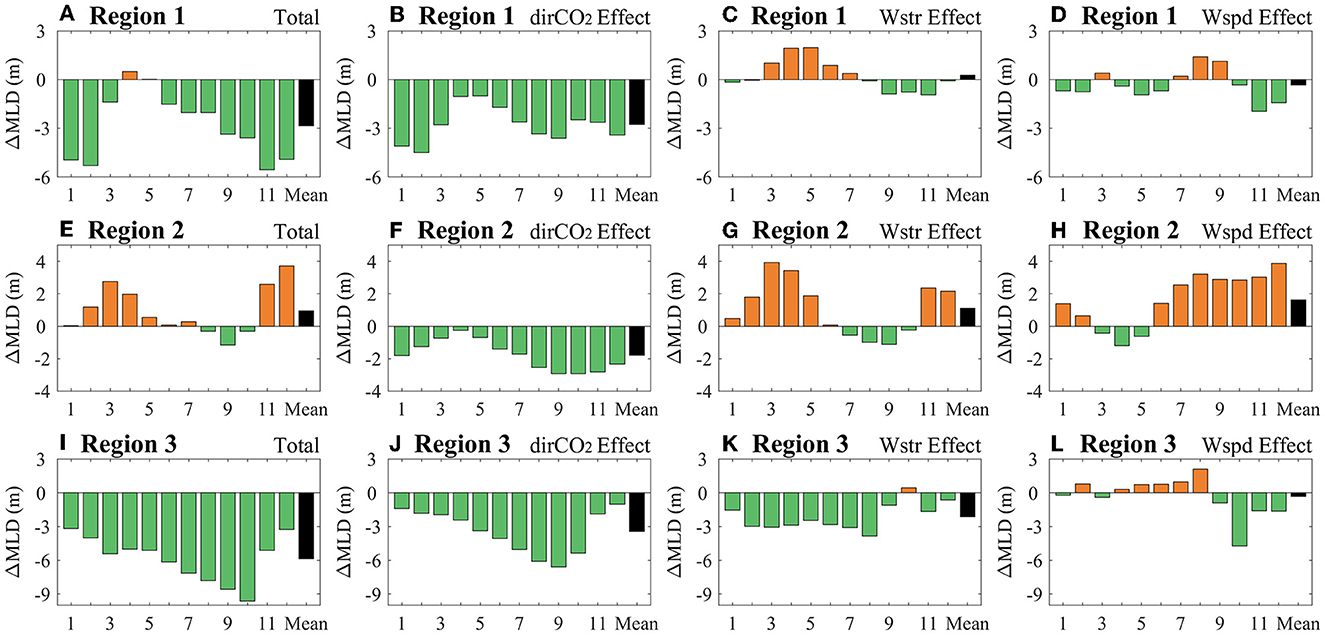
Figure 11. MLD changes at each calendar month in CESM1-CAM5. (A) The total MLD response in Region 1. (B–D) Reveal the contributions resulting from the direct CO2, wind stress and wind speed effect in Region 1. (E–L) Are the same as (A–D) but for Region 2 and Region 3, respectively.
3.2.2. Underlying processes for MLD changes
Figure 12 displays the surface buoyancy-related heat flux changes Qnet and freshwater flux changes (P−E) due to the dirCO2 forcing (τ1w1c4 – τ1w1c1), wind speed forcing, and wind stress forcing. Similar to the MME results in ssp585, the increased Qnet facilitates OML shoaling in Regions 1 and 3 by enhancing upper layer warming. Moreover, OML shoaling is closely related to the increased P−E from the dirCO2 forcing and wind stress forcing in Region 1, and the wind-driven divergence in Region 3. The basin-wide reduced wind speed decreases the MLD (Figures 10A, C) by suppressing turbulent heat loss from the ocean, thereby leading to a weak increase in Qnet over most regions (Figure 12C). In Region 2, the OML deepening is associated with positive contributions from the decreased Qnet (Figure 12B) under wind stress forcing, the decreased P−E under wind speed forcing (Figure 12F), and the wind stress-driven convergence (Figure 12H). As a result, the wind changes dominate the OML deepening in Region 2 through wind-driven thermal and dynamical processes (Figure 10B).
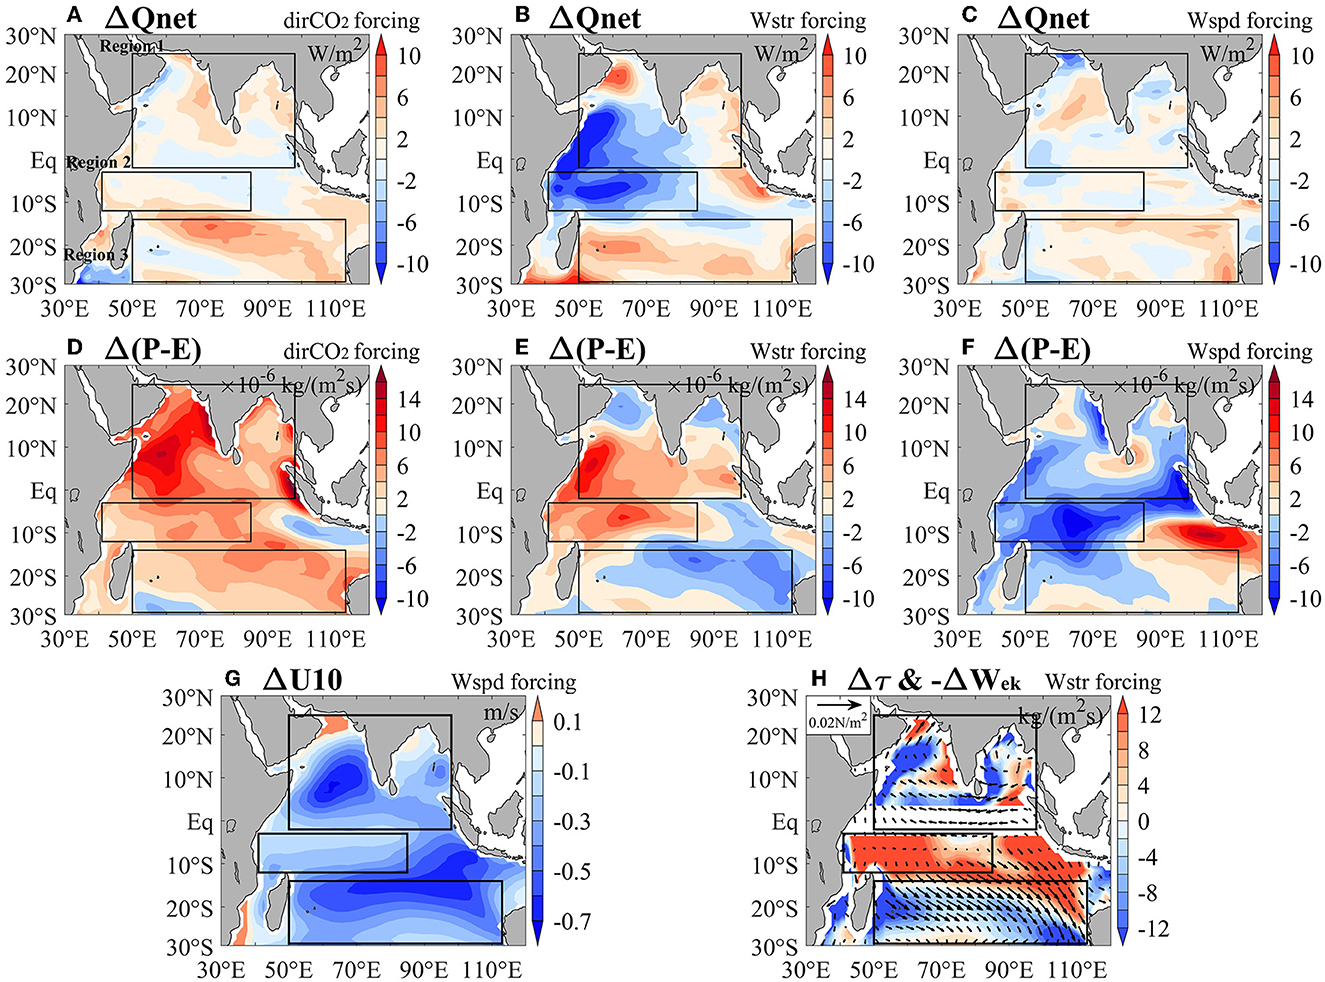
Figure 12. Surface heat flux change Qnet due to (A) direct CO2 forcing, (B) wind stress forcing, and (C) wind speed forcing in CESM1-CAM5. (D–F) Is the same as (A, B) but for surface freshwater flux change Δ(P−E). (G) Wind speed forcing U10 and (H) wind stress forcing and Ekman pumping −ΔWek (red shading for downwelling and blue shading for upwelling) in corresponding partial coupled experiments.
To examine the detailed vertical structures associated with the MLD changes, we calculate the zonal-mean stratification changes of the upper ocean in CESM1–CAM5 (Figure 13). In the fully coupled total response, ocean stratification is strengthened above 100 m in Region 1, mainly owing to the dirCO2 effect (Figure 13E). Changes in temperature and salinity in Region 1 are both important in enhancing the upper layer stratification (Figures 13F, G), associated with the increased P−E (Figure 12D) and upward-strengthened warming structures (Figure 13D). This is consistent with the CMIP6 results. However, in Region 2, ocean stratification decreases above the MLD and increases below the MLD, which cannot be explained by the dirCO2 effect. Furthermore, the OML deepening in Region 2 is associated with reduced stratification above 60 m (Figure 13I), as a result of the joint contributions from wind stress-driven convergence and wind speed-driven decrease in P−E (Figures 13L, P). Wind stress forcing reduces the stratification in Region 2 mainly via temperature changes (Figures 13I, J), with enhanced subsurface warming that reaches a maximum below 50 m (Figure 13L). The wind speed effect predominantly decreases the stratification below 30 m in Region 2 (Figure 13M), which is mainly attributed to salinity changes (Figure 13O) from the decreased P−E (Figure 12F). In Region 3, the dirCO2 effect, wind stress effect, and wind speed effect all tend to enhance upper layer stratification (Figures 13A, E, I, M). The wind-driven divergence (Figure 12D) clearly forces subsurface cooling originating from the deeper layer in Region 3 (Figure 13L).

Figure 13. Zonal-mean results in CESM1-CAM5 for (A) total ocean stratification change, (B) stratification change due to temperature change, (C) stratification change due to salinity change, and (D) ocean temperature change. (E–P) Are the same as (A–D) but for effect from direct CO2, wind stress and wind speed, respectively. The black and green curves respectively indicate the location of climatological MLD in control run and forced run.
Wind stress and wind speed forcing can also indirectly influence MLD by changing surface buoyancy flux. Given the importance of wind stress and wind speed forcing in decreasing the MLD in Region 3, we calculate the corresponding area-mean Qnet, (P−E), and their contributions to the surface buoyancy flux (Figure 14). The dirCO2, wind stress, and wind speed forcing all tend to increase Qnet and enhance surface buoyancy, which promote the OML shoaling in Region 3. The surface freshwater flux increases due to the dirCO2 effect, but to some extent, this increase is offset by the wind stress effect. Therefore, surface buoyancy flux changes resulting from surface salinity changes are much weaker than those resulting from surface temperature changes (Figures 14D, H, L). In Region 3, surface buoyancy changes are dominated by Qnet but not (P−E). The dirCO2 effect and wind changes display nearly equal contributions to increasing the Qnet.
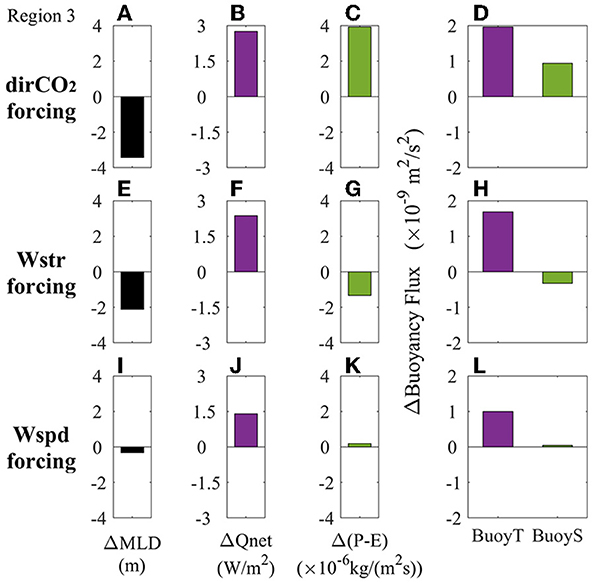
Figure 14. Changes of Region 3 (A) MLD, (B) Qnet, (C) precipitation minus evaporation (P − E), and (D) surface buoyancy flux due to temperature (BuoyT) and salinity (BuoyS) changes under dirCO2 forcing. (E–L) Are the same as (A–D), but for Wstr forcing and Wspd forcing, respectively.
4. Summary and discussion
The characteristics and driving factors of MLD changes in the Indian Ocean under global warming are investigated using outputs from 24 CMIP6 models and CESM1–CAM5. The MME results show that, the MLD generally decreases under low- and high-emission scenarios (ssp126 and ssp585) but displays notable regional variations. The MME MLD significantly decreases in the northern Indian Ocean (Region 1) and southern subtropics (Region 3), with high model consistency under both scenarios. The robust OML shoaling in these two regions appears early in the 1980s and persists through 2100 in both scenarios despite a slight recovery emerges after 2050 in ssp126. In contrast, the OML slightly deepens in the south equatorial Indian Ocean (Region 2) but displays large model uncertainty in the sign and magnitude. The fully coupled 4 × CO2 run of CESM1–CAM5 simulate a spatial pattern of MLD changes that highly resembles the CMIP6 MME pattern.
The driving factors of the regional MLD changes are investigated by diagnostic analyses using the CMIP6 models and quantitative analyses based on partially coupled experiments from CESM1–CAM5. In Region 1, the robust OML shoaling primarily results from increased surface heat and freshwater flux (with nearly equal contributions), which is highly consistent between the CMIP6 and CESM1–CAM5 results. Additionally, the increased surface buoyancy is dominated by the dirCO2 forcing, with wind forcing playing a negligible role. However, the prominent OML shoaling in Region 3 is mainly caused by the enhanced surface buoyancy and the wind-driven divergence. The dirCO2 effect and wind forcing have comparable contributions to the increased surface net heat flux in Region 3. In comparison, the increased surface freshwater flux is mainly a result of the dirCO2 effect. In Region 2, where the OML slightly deepened, the weakened wind and wind-driven convergence tend to increase the MLD in both CMIP6 MME and CESM1–CAM5, whereas surface buoyancy forcing shows the opposite effect in the two datasets. Moreover, wind forcing is the primary source of the large intermodel differences in MLD changes in Region 2. For ocean stratification changes related to the MLD changes, the results also highlight the dominant influence of temperature changes south of 10°S and the important roles of temperature and salinity changes in the northern tropics.
The results reveal the characteristics of MLD changes in three distinct regions of the Indian Ocean and highlight the regional differences in the driving factors. The percentage change of Indian Ocean MLD is ~5% in most regions in ssp126 and 10% in ssp585. Giving that a small percentage of OML shoaling is also efficient in amplifying the heating processes in the OML, thereby facilitating the surface layer warming and the occurrence of marine heatwaves (Amaya et al., 2021; Elzahaby et al., 2022; Shi et al., 2022). These changes would cause heat stress on marine ecosystems and potentially impact the monsoon climate (Saranya et al., 2022). Thus, it is important to quantifying the regional MLD changes and their underlying mechanism that can promote our understanding and projection of the changes in extreme events and regional climate under global warming. However, the influence of ocean interior dynamical processes on the MLD changes is complicated. For example, the effects of remote forcing from the tropical Pacific (Liu et al., 2016) and Southern Oceans (Hong et al., 2022) on the eastern equatorial and southern Indian Ocean, respectively, remain unclear. Xia et al. (2021) show that MLD change can be influenced by Ekman pumping, and upper-ocean cold or warm advection in the North Pacific under global warming. Further in-depth investigations are required on the detailed ocean dynamical processes related to the MLD changes in the Indian Ocean.
Data availability statement
The original contributions presented in the study are included in the article/supplementary material, further inquiries can be directed to the corresponding author.
Author contributions
All authors listed have made a substantial, direct, and intellectual contribution to the work and approved it for publication.
Funding
This work was supported by the Natural Science Foundation of China (41831175, 42141019, 42076208, and 41706026), Natural Science Foundation of Jiangsu Province (BK20211209), Fundamental Research Funds for the Central Universities (B210202135 and B210201015), and National Key Research and Development Program of China (2017YFA0604600).
Acknowledgments
We thank Wei Liu for conducting the CESM1–CAM5 experiments. We acknowledge the WCRP Working Group on Coupled Modeling, which is responsible for CMIP, and the climate modeling groups for producing and making their model outputs available. All CMIP data are available at: https://esgf-node.llnl.gov/search/esgf-llnl/. We also acknowledge the Argo Program, which is a part of the Global Ocean Observing System. The Argo datasets are available at: https://argo.ucsd.edu/data/argo-data-products/ and are collected and made freely available by the International Argo Program and the national programs that contribute to it. The IAP datasets are available at: http://www.ocean.iap.ac.cn/. The CESM1-CAM5 data can be accessed at: https://pan.baidu.com/s/1hQhrD5L4FLYyyUcwtxNlyQ?pwd=oupq. We would like to thank Editage (www.editage.com) for manuscript editing.
Conflict of interest
The authors declare that the research was conducted in the absence of any commercial or financial relationships that could be construed as a potential conflict of interest.
Publisher's note
All claims expressed in this article are solely those of the authors and do not necessarily represent those of their affiliated organizations, or those of the publisher, the editors and the reviewers. Any product that may be evaluated in this article, or claim that may be made by its manufacturer, is not guaranteed or endorsed by the publisher.
References
Abram, N. J., Wright, N. M., Ellis, B., Dixon, B. C., Wurtzel, J. B., England, M. H., et al. (2020). Coupling of Indo-Pacific climate variability over the last millennium. Nature 579, 385–392. doi: 10.1038/s41586-020-2084-4
Alexander, M. A., and Penland, C. (1996). Variability in a mixed layer ocean model driven by stochastic atmospheric forcing. J. Clim. 9, 2424–2442. doi: 10.1175/1520-0442(1996)009<2424:VIAMLO>2.0.CO;2
Alexander, M. A., Scott, J. D., and Deser, C. (2000). Processes that influence sea surface temperature and ocean mixed layer depth variability in a coupled model. J. Geophys. Res. Oceans 105, 16823–16842. doi: 10.1029/2000JC900074
Alexander, M. A., Scott, J. D., Friedland, K. D., Mills, K. E., Nye, J. A., Pershing, A. J., et al. (2018). Projected sea surface temperatures over the 21st century: changes in the mean, variability and extremes for large marine ecosystem regions of northern oceans. Elem. Sci. Anth. 6, 9. doi: 10.1525/elementa.191
Alory, G., Wijffels, S., and Meyers, G. (2007). Observed temperature trends in the Indian Ocean over 1960–1999 and associated mechanisms. Geophys. Res. Lett. 34. doi: 10.1029/2006GL028044
Amaya, D. J., Alexander, M. A., Capotondi, A., Deser, C., Karnauskas, K. B., Miller, A. J., et al. (2021). Are long-term changes in mixed layer depth influencing North Pacific marine heatwaves? Bull. Am. Meteorol. Soc. 102, S59–S66. doi: 10.1175/BAMS-D-20-0144.1
Anilkumar, N., Sarma, Y. V. B., Narasimhan, B., Sudhakar, M., and Pandey, P. C. (2006). Post-tsunami oceanographic conditions in southern Arabian Sea and Bay of Bengal. Curr. Sci. 90, 421–427.
Bender, M. A., and Ginis, I. (2000). Real-case simulations of hurricane-ocean interaction using a high resolution coupled model: effects on hurricane intensity. Mon. Weather Rev. 128, 917–946. doi: 10.1175/1520-0493(2000)128<0917:RCSOHO>2.0.CO;2
Bourgeois, T., Goris, N., Schwinger, J., and Tjiputra, J. F. (2022). Stratification constrains future heat and carbon uptake in the Southern Ocean between 30°S and 55°S. Nat. Commun. 13, 340. doi: 10.1038/s41467-022-27979-5
Breitburg, D., Levin, L. A., Oschlies, A., Gregoire, M., Chavez, F. P., Conley, D. J., et al. (2018). Declining oxygen in the global ocean and coastal waters. Science 359, eaam7240. doi: 10.1126/science.aam7240
Cabré, A., Marinov, I., and Leung, S. (2014). Consistent global responses of marine ecosystems to future climate change across the IPCC AR5 earth system models. Clim. Dyn. 45, 1253–1280. doi: 10.1007/s00382-014-2374-3
Cai, R.-S., Han, Z.-Q., and Yang, Z.-X. (2020). Impacts and risks of changing ocean on marine ecosystems and dependent communities and related responses. Clim. Change Res. 16, 182–193. doi: 10.12006/j.issn.1673-1719.2020.028
Cai, W., Zheng, X.-T., Weller, E., Collins, M., Cowan, T., Lengaigne, M., et al. (2013). Projected response of the Indian Ocean Dipole to greenhouse warming. Nat. Geosci. 6, 999–1007. doi: 10.1038/ngeo2009
Capotondi, A., Alexander, M. A., Bond, N. A., Curchitser, E. N., and Scott, J. D. (2012). Enhanced upper ocean stratification with climate change in the CMIP3 models. J. Geophys. Res. Oceans 117(C4). doi: 10.1029/2011JC007409
Cushman-Roisin, B. (1981). Deepening of the wind-mixed layer: a model of the vertical structure. Tellus A: Dyn. Meteorol. Oceanogr. 33, 564–582. doi: 10.3402/tellusa.v33i6.10777
Elzahaby, Y., Schaeffer, A., Roughan, M., and Delaux, S. (2022). Why the mixed layer depth matters when diagnosing marine heatwave drivers using a heat budget approach. Front. Clim. 4, 838017. doi: 10.3389/fclim.2022.838017
Emery, W. J. (2001). Water types and water masses. Encycl. Ocean Sci. 3179–3187. doi: 10.1006/rwos.2001.0108
Eyring, V., Bony, S., Meehl, G. A., Senior, C. A., Stevens, B., Stouffer, R. J., et al. (2016). Overview of the Coupled Model Intercomparison Project Phase 6 (CMIP6) experimental design and organization. Geosci. Model Dev. 9, 1937–1958. doi: 10.5194/gmd-9-1937-2016
Francis, J. A., and Vavrus, S. J. (2012). Evidence linking Arctic amplification to extreme weather in mid-latitudes. Geophys. Res. Lett. 39. doi: 10.1029/2012GL051000
Fu, W., Randerson, J. T., and Moore, J. K. (2016). Climate change impacts on net primary production (NPP) and export production (EP) regulated by increasing stratification and phytoplankton community structure in the CMIP5 models. Biogeosciences 13, 5151–5170. doi: 10.5194/bg-13-5151-2016
Gupta, A., Pandey, A. C., and Mitra, A. K. (2022). Development of early sea surface temperature biases in the tropical Indian Ocean in a coupled model. Dyn. Atmos. Oceans 97, 101269. doi: 10.1016/j.dynatmoce.2021.101269
Halpern, D. (1974). Observations of the deepening of the wind-mixed layer in the Northeast Pacific Ocean. J. Phys. Oceanogr. 4, 454–466. doi: 10.1175/1520-0485(1974)004<0454:OOTDOT>2.0.CO;2
Han, W., Vialard, J., McPhaden, M. J., Lee, T., Masumoto, Y., Feng, M., et al. (2014). Indian Ocean decadal variability: a review. Bull. Am. Meteorol. Soc. 95, 1679–1703. doi: 10.1175/BAMS-D-13-00028.1
Hong, Y., Zhang, Y., and Du, Y. (2022). Minimum warming in the south Indian Ocean thermocline in a warming climate linked to freshening processes. J. Phys. Oceanogr. 52, 1179–1189. doi: 10.1175/JPO-D-21-0224.1
Hu, S., and Fedorov, A. V. (2019). Indian Ocean warming can strengthen the Atlantic meridional overturning circulation. Nat. Clim. Chang. 9, 747–751. doi: 10.1038/s41558-019-0566-x
Hurrell, J. W., Holland, M. M., Gent, P. R., Ghan, S., Kay, J. E., Kushner, P. J., et al. (2013). The Community Earth System Model_A framework for collaborative research. Bull. Am. Meteorol. Soc. 94, 1339–1360. doi: 10.1175/BAMS-D-12-00121.1
IPCC (2019). “Summary for policymakers,” in IPCC Special Report on the Ocean and Cryosphere in a Changing Climate, eds H.-O. Pörtner, D. C. Roberts, V. Masson-Delmotte, P. Zhai, M. Tignor, E. Poloczanska, et al. (Cambridge, UK and New York, NY: Cambridge University Press), 3–35.
Ito, T., Woloszyn, M., and Mazloff, M. (2010). Anthropogenic carbon dioxide transport in the Southern Ocean driven by Ekman flow. Nature 463, 80–83. doi: 10.1038/nature08687
Ju, W.-S., Long, S.-M., Xie, S.-P., Wang, G., and Du, Y. (2020). Changes in the North Pacific subtropical gyre under 1.5 °C low warming scenario. Clim. Dyn. 55, 3117–3131. doi: 10.1007/s00382-020-05436-7
Katavouta, A., Williams, R. G., and Goodwin, P. (2019). The effect of ocean ventilation on the transient climate response to emissions. J. Clim. 32, 5085–5105. doi: 10.1175/JCLI-D-18-0829.1
Kwiatkowski, L., Torres, O., Bopp, L., Aumont, O., Chamberlain, M., Christian, J. R., et al. (2020). Twenty-first century ocean warming, acidification, deoxygenation, and upper-ocean nutrient and primary production decline from CMIP6 model projections. Biogeosciences 17, 3439–3470. doi: 10.5194/bg-17-3439-2020
Lau, K. M., Kim, M. K., and Kim, K. M. (2006). Asian summer monsoon anomalies induced by aerosol direct forcing: the role of the Tibetan Plateau. Clim. Dyn. 26, 855–864. doi: 10.1007/s00382-006-0114-z
Lauderdale, J. M., Garabato, A. C. N., Oliver, K. I. C., Follows, M. J., and Williams, R. G. (2013). Wind-driven changes in Southern Ocean residual circulation, ocean carbon reservoirs and atmospheric CO2. Clim. Dyn. 41, 2145–2164. doi: 10.1007/s00382-012-1650-3
Li, G., Cheng, L., Zhu, J., Trenberth, K. E., Mann, M. E., Abraham, J. P., et al. (2020). Increasing ocean stratification over the past half-century. Nat. Clim. Chang. 10, 1116–1123. doi: 10.1038/s41558-020-00918-2
Lin, I.-I., and Wu, C.-C. (2008). Typhoon–ocean interactions inferred by multisensor observations. Recent Prog. Atmos. Sci. 9, 358–372. doi: 10.1142/9789812818911_0017
Lin, T.-C., Hamburg, S. P., Hsia, Y.-J., Lin, T.-T., King, H.-B., Wang, L.-J., et al. (2017). Influence of typhoon disturbances on the understory light regime and stand dynamics of a subtropical rain forest in northeastern Taiwan. J. For. Res. 8, 139–145. doi: 10.1007/s10310-002-0019-6
Liu, M., Vecchi, G., Soden, B., Yang, W., and Zhang, B. (2021). Enhanced hydrological cycle increases ocean heat uptake and moderates transient climate change. Nat. Clim. Chang. 11, 848–853. doi: 10.1038/s41558-021-01152-0
Liu, Q. Y., and Lu, Y. Q. (2016). Role of horizontal density advection in seasonal deepening of the mixed layer in the subtropical Southeast Pacific. Adv. Atmos. Sci. 33, 442–451. doi: 10.1007/s00376-015-5111-x
Liu, W., Lu, J., and Xie, S.-P. (2015). Understanding the Indian Ocean response to double CO2 forcing in a coupled model. Ocean Dyn. 65, 1037–1046. doi: 10.1007/s10236-015-0854-6
Liu, W., Lu, J., Xie, S.-P., and Fedorov, A. (2018). Southern Ocean heat uptake, redistribution, and storage in a warming climate: the role of meridional overturning circulation. J. Clim. 31, 4727–4743. doi: 10.1175/JCLI-D-17-0761.1
Liu, W., Xie, S.-P., and Lu, J. (2016). Tracking ocean heat uptake during the surface warming hiatus. Nat. Commun. 7, 10926. doi: 10.1038/ncomms10926
Long, S.-M., Xie, S.-P., Du, Y., Liu, Q., Zheng, X.-T., Huang, G., et al. (2020). Effects of ocean slow response under low warming targets. J. Clim. 33, 477–496. doi: 10.1175/JCLI-D-19-0213.1
Lu, J., and Zhao, B. (2012). The role of oceanic feedback in the climate response to doubling CO2. J. Clim. 25, 7544–7563. doi: 10.1175/JCLI-D-11-00712.1
Luo, J. J., Sasaki, W., and Masumoto, Y. (2012). Indian Ocean warming modulates Pacific climate change. Proc. Natl. Acad. Sci. USA. 109, 18701–18706. doi: 10.1073/pnas.1210239109
Mei, W., Xie, S.-P., Primeau, F., McWilliams, J. C., and Pasquero, C. (2015). Northwestern Pacific typhoon intensity controlled by changes in ocean temperatures. Sci. Adv. 1, e1500014–e1500014. doi: 10.1126/sciadv.1500014
Melet, A. V., berg, R.H., and Marshallc, D. P. (2022). The role of ocean mixing in the climate system. Ocean Mixing 5–34. doi: 10.1016/B978-0-12-821512-8.00009-8
Moore, J. K., Fu, W., Primeau, F., Britten, G. L., Lindsay, K., Long, M., et al. (2018). Sustained climate warming drives declining marine biological productivity. Science 359, 1139–1143. doi: 10.1126/science.aao6379
Price, J. F. (1981). Upper ocean response to a hurricane. J. Phys. Oceanogr. 11, 153–175. doi: 10.1175/1520-0485(1981)011<0153:UORTAH>2.0.CO;2
Roemmich, D., and Gilson, J. (2009). The 2004–2008 mean and annual cycle of temperature, salinity, and steric height in the global ocean from the Argo Program. Prog. Oceanogr. 82, 81–100. doi: 10.1016/j.pocean.2009.03.004
Russell, J. L., Dixon, K. W., Gnanadesikan, A., Stouffer, R. J., and Toggweiler, a.J.R. (2006). The Southern Hemisphere westerlies in a warming world: propping open the door to the deep ocean. J. Clim. 19, 6382–6390. doi: 10.1175/JCLI3984.1
Sabine, C. L., Feely, R. A., Gruber, N., Key, R. M., Lee, K., Bullister, J. L., et al. (2004). The oceanic sink for anthropogenic CO2. Science 305, 367–371. doi: 10.1126/science.1097403
Saji, N. H., Goswami, B. N., Vinayachandran, P. N., and Yamagata, T. (1999). A dipole mode in the tropical Indian Ocean. Nature 401, 360–363. doi: 10.1038/43854
Sallée, J. B., Matear, R. J., Rintoul, S. R., and Lenton, A. (2012). Localized subduction of anthropogenic carbon dioxide in the Southern Hemisphere oceans. Nat. Geosci. 5, 579–584. doi: 10.1038/ngeo1523
Sallée, J. B., Pellichero, V., Akhoudas, C., Pauthenet, E., Vignes, L., Schmidtko, S., et al. (2021). Summertime increases in upper-ocean stratification and mixed-layer depth. Nature 591, 592–598. doi: 10.1038/s41586-021-03303-x
Sallée, J. B., Shuckburgh, E., Bruneau, N., Meijers, A. J. S., Bracegirdle, T. J., Wang, Z., et al. (2013). Assessment of Southern Ocean mixed-layer depths in CMIP5 models: historical bias and forcing response. J. Geophys. Res. Oceans 118, 1845–1862. doi: 10.1002/jgrc.20157
Saranya, J. S., Roxy, M. K., Dasgupta, P., and Anand, A. (2022). Genesis and trends in marine heatwaves over the tropical Indian Ocean and their interaction with the Indian summer monsoon. J. Geophys. Res. Oceans. 127, e2021JC017427. doi: 10.1029/2021JC017427
Shi, J., Tang, C., Liu, Q., Zhang, Y., Yang, H., Li, C., et al. (2022). Role of mixed layer depth in the location and development of the Northeast Pacific warm blobs. Geophys. Res. Lett. 49, e2022GL.098849. doi: 10.1029/2022GL098849
Somavilla, R., Gonzalez-Pola, C., and Fernandez-Diaz, J. (2017). The warmer the ocean surface, the shallower the mixed layer. How much of this is true? J. Geophys. Res. Oceans 122, 7698–7716. doi: 10.1002/2017JC013125
Tierney, J. E., Smerdon, J. E., Anchukaitis, K. J., and Seager, R. (2013). Multidecadal variability in East African hydroclimate controlled by the Indian Ocean. Nature 493, 389–392. doi: 10.1038/nature11785
Toualy, E., Kouacou, B., and Aman, A. (2022). Influence of wind and surface buoyancy flux on the variability of the ocean mixed layer depth in the Northern Gulf of Guinea coastal upwelling. Thalassas Int. J. Mar. Sci. 38, 599–608. doi: 10.1007/s41208-021-00358-5
Ushijima, Y., and Yoshikawa, Y. (2020). Mixed layer deepening due to wind-induced shear-driven turbulence and scaling of the deepening rate in the stratified ocean. Ocean Dyn. 70, 505–512. doi: 10.1007/s10236-020-01344-w
Webster, P. J., Moore, A. M., Loschnigg, J. P., and Leben, R. R. (1999). Coupled ocean-atmosphere dynamics in the Indian Ocean during 1997-98. Nature 401, 356–360. doi: 10.1038/43848
Wu, L., Wang, B., and Braun, S. A. (2005). Impacts of air-sea interaction on tropical cyclone track and intensity. Mon. Weather Rev. 133, 3299–3314. doi: 10.1175/MWR3030.1
Wu, L., Wang, R., and Feng, X. (2018). Dominant role of the ocean mixed layer depth in the increased proportion of intense typhoons during 1980–2015. Earth's Future 6, 1518–1527. doi: 10.1029/2018EF000973
Xia, R., Li, B., and Cheng, C. (2021). Response of the mixed layer depth and subduction rate in the subtropical Northeast Pacific to global warming. Acta Oceanol. Sin. 40, 1–9. doi: 10.1007/s13131-021-1818-y
Xie, S.-P., Hu, K., Hafner, J., Tokinaga, H., Du, Y., Huang, G., et al. (2009). Indian Ocean capacitor effect on Indo–Western Pacific climate during the summer following El Niño. J. Clim. 22, 730–747. doi: 10.1175/2008JCLI2544.1
Xie, S.-P., Kosaka, Y., Du, Y., Hu, K., Chowdary, J. S., Huang, G., et al. (2016). Indo-western Pacific Ocean capacitor and coherent climate anomalies in post-ENSO summer: a review. Adv. Atmosp. Sci. 33, 411–432. doi: 10.1007/s00376-015-5192-6
Xu, L., Xie, S.-P., and Liu, Q. (2013). Fast and slow responses of the North Pacific mode water and Subtropical Countercurrent to global warming. J. Ocean Univ. China 12, 216–221. doi: 10.1007/s11802-013-2189-6
Yamaguchi, R., and Suga, T. (2019). Trend and variability in global upper-ocean stratification since the 1960s. J. Geophys. Res. Oceans 124, 8933–8948. doi: 10.1029/2019JC015439
Yang, Y. M., Park, J. H., An, S. I., Yeh, S. W., Zhu, Z., Liu, F., et al. (2022). Increased Indian Ocean-North Atlantic Ocean warming chain under greenhouse warming. Nat. Commun. 13, 3978. doi: 10.1038/s41467-022-31676-8
Yeh, S.-W., Yim, B. Y., Noh, Y., and Dewitte, B. (2009). Changes in mixed layer depth under climate change projections in two CGCMs. Clim. Dyn. 33, 199–213. doi: 10.1007/s00382-009-0530-y
Young, I. R., and Ribal, A. (2019). Multiplatform evaluation of global trends in wind speed and wave height. Science 364, 548–552. doi: 10.1126/science.aav9527
Zhang, L., Han, W., Karnauskas, K. B., Meehl, G. A., Hu, A., Rosenbloom, N., et al. (2019). Indian Ocean warming trend reduces Pacific warming response to anthropogenic greenhouse gases: an interbasin thermostat mechanism. Geophys. Res. Lett. 46, 10882–10890. doi: 10.1029/2019GL084088
Keywords: ocean mixed layer depth, Indian Ocean, global warming, CMIP6, ocean stratification, buoyancy forcing, wind forcing
Citation: Gao Z, Long S-M, Shi J-R, Cheng L, Li G and Ying J (2023) Indian Ocean mixed layer depth changes under global warming. Front. Clim. 5:1112713. doi: 10.3389/fclim.2023.1112713
Received: 30 November 2022; Accepted: 09 January 2023;
Published: 25 January 2023.
Edited by:
Yang Yang, Nanjing University of Information Science and Technology, ChinaReviewed by:
Jian Shi, Ocean University of China, ChinaXinghrong Chen, National Marine Environmental Forecasting Center, China
Copyright © 2023 Gao, Long, Shi, Cheng, Li and Ying. This is an open-access article distributed under the terms of the Creative Commons Attribution License (CC BY). The use, distribution or reproduction in other forums is permitted, provided the original author(s) and the copyright owner(s) are credited and that the original publication in this journal is cited, in accordance with accepted academic practice. No use, distribution or reproduction is permitted which does not comply with these terms.
*Correspondence: Shang-Min Long,  c21sb25nQGhodS5lZHUuY24=