 Terence J. O'Kane1*†
 Adam A. Scaife2,3†Yochanan Kushnir4‡Anca Brookshaw5‡
 Carlo Buontempo5‡David Carlin6‡Richenda K. Connell7‡
 Francisco Doblas-Reyes8,9‡Nick Dunstone2‡
 Kristian Förster10,11‡Antonio Graça12‡
 Alistair J. Hobday1‡
 Vassili Kitsios13‡
 Larissa van der Laan10‡Julia Lockwood2‡
 William J. Merryfield14‡
 Andreas Paxian15‡
 Mark R. Payne16‡
 M. Catherine Reader14‡Geoffrey R. Saville7,17‡
 Doug Smith2‡Balakrishnan Solaraju-Murali8‡Nico Caltabiano18‡Jessie Carman19‡
 Ed Hawkins20‡Noel Keenlyside21‡
 Arun Kumar22‡
 Daniela Matei23‡Holger Pohlmann15‡Scott Power24,25‡
 Marilyn Raphael26‡
 Michael Sparrow18‡
 Bo Wu27‡
- 1CSIRO Environment, Hobart, TAS, Australia
- 2Met Office Hadley Centre, Exeter, United Kingdom
- 3College of Engineering, Mathematics and Physical Sciences, Exeter University, Exeter, United Kingdom
- 4Lamont-Doherty Earth Observatory, Earth Institute, Columbia University, Palisades, NY, United States
- 5European Centre for Medium Range Weather Forecasting, Reading, United Kingdom
- 6United Nations, New York, NY, United States
- 7Willis Towers Watson, New York, NY, United States
- 8Barcelona Supercomputing Center, Barcelona, Spain
- 9Institució Catalana de Recerca i Estudis Avançats (ICREA), Barcelona, Spain
- 10Institute for Hydrology and Water Resources Management, Leibniz University Hannover, Hannover, Germany
- 11Institute of Ecology and Landscape, Weihenstephan-Triesdorf University of Applied Sciences, Freising, Germany
- 12Sogrape Vinhos, Avintes, Portugal
- 13CSIRO Environment, Aspendale, VIC, Australia
- 14Canadian Centre for Climate Modelling and Analysis, Environment and Climate Change Canada, Victoria, BC, Canada
- 15Deutscher Wetterdienst (DWD), Offenbach, Germany
- 16Danish Meteorological Institute, Copenhagen, Denmark
- 17Caniopus Group, London, United Kingdom
- 18WCRP Secretariat, WMO, Geneva, Switzerland
- 19NOAA/Office of Oceanic and Atmospheric Research/Weather Program Office, Silver Spring, MD, United States
- 20National Centre for Atmospheric Science, Department of Meteorology, University of Reading, Reading, United Kingdom
- 21Geophysical Institute, University of Bergen, and Bjerknes Centre for Climate Research, Bergen, Norway
- 22NOAA Climate Prediction Center, National Centers for Environmental Prediction (NCEP), College Park, MD, United States
- 23Max Planck Institute for Meteorology, Hamburg, Germany
- 24Centre for Applied Climate Sciences, University of Southern Queensland, Townsville, QLD, Australia
- 25Australian Research Council Centre of Excellence for Climate Extremes, School of Earth, Atmosphere and Environment, Monash University, Melbourne, VIC, Australia
- 26Department of Geography, University of California Los Angeles, Los Angeles, Los Angeles, CA, United States
- 27State Key Laboratory of Numerical Modeling for Atmospheric Sciences and Geophysical Fluid Dynamics (LASG), Institute of Atmospheric Physics, Chinese Academy of Sciences, Beijing, China
Following efforts from leading centres for climate forecasting, sustained routine operational near-term climate predictions (NTCP) are now produced that bridge the gap between seasonal forecasts and climate change projections offering the prospect of seamless climate services. Though NTCP is a new area of climate science and active research is taking place to increase understanding of the processes and mechanisms required to produce skillful predictions, this significant technical achievement combines advances in initialisation with ensemble prediction of future climate up to a decade ahead. With a growing NTCP database, the predictability of the evolving externally-forced and internally-generated components of the climate system can now be quantified. Decision-makers in key sectors of the economy can now begin to assess the utility of these products for informing climate risk and for planning adaptation and resilience strategies up to a decade into the future. Here, case studies are presented from finance and economics, water management, agriculture and fisheries management demonstrating the emerging utility and potential of operational NTCP to inform strategic planning across a broad range of applications in key sectors of the global economy.
1. Introduction
In climate prediction, the initial state of the climate system (including elements of the atmosphere, ocean, land, sea ice, and biogeochemistry) is constrained to closely represent a particular date via the introduction of observation-based data in the model initial conditions (Meehl et al., 2021). In common with weather or seasonal prediction, starting from observed conditions is a prerequisite for predicting their subsequent temporal and spatial evolution. Similar to long-term future climate projections, in Near-Term Climate Prediction (NTCP) natural and anthropogenic factors influencing the Earth system e.g., aerosols and changes in greenhouse gas (GHG) concentrations, are also introduced in the models. These models are then run forward over a period of typically about a decade to produce NTCPs. This process is carried out over the historical period from the 1960s through to present day with the resulting predictions of the historical record, known as hindcasts or retrospective forecasts, used to obtain estimates of model biases (Hermanson et al., 2017; Maraun et al., 2017), uncertainties for verification (Goddard et al., 2013) and to assess skill (Boer et al., 2016; Yeager et al., 2018; Volpi et al., 2021).
The field of NTCP is relatively new to climate science, with the first paper appearing only in 2007 (Smith et al., 2007). Consequently, NTCP is an area of active research aimed at identifying, studying, and understanding the processes and mechanisms in the climate system that can produce skillful predictions (Meehl et al., 2021). Even at this developmental stage of the science, early results showed that there was skill in some regions for annual to decadal predictions, thus suggesting there could be climate information of use to stakeholders. Consequently, operational NTCP has been in development for over a decade (Smith et al., 2013). While there is still much research to do, the potential for annual to decadal predictions to fill the existing gap between seasonal climate predictions and climate change projections is well recognised (Wei et al., 2009; Boer et al., 2016; Kushnir et al., 2019; Merryfield et al., 2020). Over 5 years ago, the World Climate Research Programme (WCRP), co-sponsored by the World Meteorological Organisation (WMO), the Intergovernmental Oceanographic Commission (IOC) of UNESCO, and the International Science Council (ISC), established the WCRP Grand Challenge on Near Term Climate Prediction (GC-NTCP). This challenge was led by a team charged with making the case for, and understanding of, the challenges to establishing routine operational NTCPs (Kushnir et al., 2019). The WMO has now established and defined the roles and designation criteria for centres to qualify as Global Producing Centres of Annual to Decadal Predictions (GPCs-ADCP) and has designated the UK Met Office as Lead Centre for Annual to Decadal Climate Prediction (LC-ADCP, www.wmolc-adcp.org), responsible for the collection, coordination and dissemination of annual to decadal predictions according to standards and protocols as defined in the 2021 Manual on the Global Data Processing and Forecasting System (https://community.wmo.int/en/activity-areas/global-data-processing-and-forecasting-system-gdpfs). The decadal forecast community has now established formal mechanisms and guidelines to produce NTCPs including minimum ensemble size and requirements on hindcast data for bias correction, core prediction products and delivery schedules. In 2021, the WMO issued the first synthesis of these predictions in a “Global Annual to Decadal Climate Update for 2021–2025” (Hermanson et al., 2022). Building on the results of pioneering studies such as Smith et al. (2018), this included the finding that the annual mean global average near-surface (land and sea) temperature is likely (>66%) to be at least 1°C warmer than preindustrial levels (defined as the 1850–1900 average) in each of the coming 5 years, and that there is a 40% chance of crossing the 1.5°C threshold in a single year.
With the requisite protocols for routine NTCP and data delivery in place, in order to identify where the available forecast skill intersects with the greatest economic and societal benefits (Dunstone et al., 2022), there is a need to inform and refine products based on analysis of carefully chosen case studies. In practise this requires improving the understanding of sectoral needs for prediction information, and to produce and tailor products and services to help meet those needs. The following sections report the findings of the GC-NTCP on current and emerging applications of decadal predictions to inform, plan and prepare for increasing risks of natural hazards due to climate change and variability, and to mitigate those impacts (Soares and Dessai, 2014).
We describe a series of cases where operational NTCPs have been shown to be of utility, in some cases even where the forecast skill might be marginal, and highlight other cases where NTCPs might have meaningful impact in the near future. The case studies presented here span a diverse range of important sectors: finance, including reinsurance in disaster-prone regions (2.1 & 2.2) and commodity returns (2.3); glacier mass loss and water management (3.1 & 3.2); agriculture for wheat (4.1) and wine-grape (4.2) production; fisheries management and exploitation (5.1 & 5.2).
2. Finance and economics
2.1. Current applications of, and challenges for, assessing climate-related financial risk
In recent years, the finance sector has made progress in understanding the different representative concentration pathways (RCPs) and shared socio-economic pathways (SSPs) used in Intergovernmental Panel on Climate Change (IPCC) reports. The range of different pathways allow for the consideration of a variety of warmer futures, each with different outcomes and impacts. Financial and macroeconomic modellers have sought to link these broad scenarios to financial and economic factors. This linkage comes from estimates of the overall levels of damage associated with each scenario and the resultant impact. The magnitude of physical hazards and their evolution over time can inform asset-level estimates of risk under a given scenario. Damage functions are a way to provide a probabilistic view of potential harms an asset may face from a physical hazard. Arriving at an overall damage function1 for an asset requires aggregation of multiple hazards and consideration of the relationship between them (Neumann et al., 2020).
As the impacts of climate change have become clearer (Pörtner et al., 2022), the relationship between climate risk and financial risk has grown more apparent. In 2017, the international Financial Stability Board (FSB)2 introduced the Task force on Climate-related Financial Disclosures (TCFD, 2017). The TCFD guidance aims to provide financial markets with the information they need to appropriately price climate risks and ensure the efficient allocation of capital. While many firms3 have endorsed the TCFDs recommendations for disclosure, the usefulness of these disclosures depends on the quality of the data and analyses they include.
In many regions, asset-level data is sparse or non-existent, making it particularly challenging to evaluate performance under changing conditions. Even in locations with good data, most models do not consider interaction effects between hazards or the second-order economic effects of an event (e.g., delinquency rates after hurricanes; Gromowski, 2018). For example, a model may provide the total damages to an asset from flooding but not account for the months of lost revenue post-flood. Another challenge relates to the time horizons under which physical risks materialise. While extreme events can occur at any time, major changes in the prevalence and severity of these events often require years of observational data to be identified, for example the prevalence, frequency, and intensity of hurricanes (Masson-Delmotte et al., 2021). As a result, financial actors can struggle to integrate the insights from their physical risk analyses into current and future strategy.
Nevertheless, there are some areas where NTCPs already offer potential to inform financial decisions. One example is where climate risk can affect lenders' credit risk exposure through its impact on the value of assets used as loan collateral, such as mortgaged properties (Bellrose et al., 2021). In one instance, a meta-analysis of studies on the effect of flood risk on house prices indicates that properties located in the 100-year floodplain have a price discount of −4.6% (Beltrán et al., 2018). Another study of the impacts of winter floods in 2013–14 in the UK indicated that properties affected by prolonged flooding saw decreases in sales prices of between −4.2 and −2.6% (Garbarino and Guin, 2020). The study also found that these decreases were not reflected in lenders' property valuations for mortgage refinancing, and that their valuations were therefore biassed upwards.
Climate risk can also increase financial stress on borrowers, by creating costs to repair damage or reducing the incomes which borrowers rely on to repay their loans (Figure 1). A before/after analysis of delinquency rates (i.e., the percentage of loans within a financial institution's loan portfolio whose payments are delinquent) for mortgages in areas affected by Hurricane Harvey showed that damage to properties caused by the hurricane affected the ability of homeowners to make their mortgage payments in the months following. Mortgages for properties estimated to have hurricane damage saw a 205% increase in 90+ day delinquency compared to delinquency rates 6 months prior to the hurricane (Gromowski, 2018). As we shall further examine in the following section, decadal predictions already offer skilful predictions of multiyear fluctuations in hurricane-related losses.
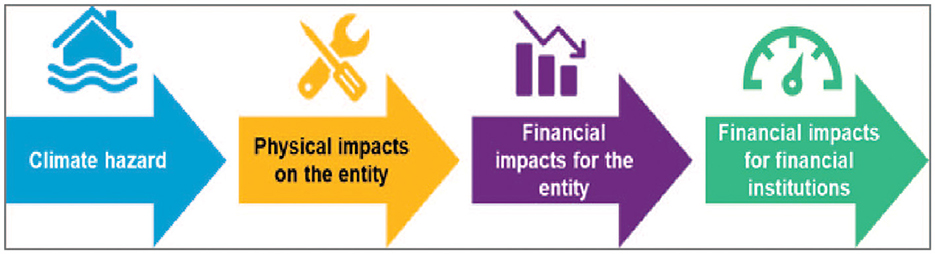
Figure 1. Schematic of the pathway through which climate hazards can affect the financial performance of financial institutions (Adapted from Gallo and Lepousez, 2020).
2.2. Decadal hurricane predictions for insurance
Hurricane damage in the United States (US) is rising as population and property in coastal regions increase with Atlantic hurricanes now accounting for most of the insured losses in the US. Hurricane activity also varies on decadal timescales (Landsea, 2007; Klotzbach and Gray, 2008) with hurricane damage in the US varying by up to a factor of 5 between recent decades. Skilful decadal predictions of hurricane activity offer the re-insurance sector an opportunity to better manage these varying risks (Lockwood et al., 2021).
Factors controlling hurricane formation include sea surface temperature (SST), temperatures in the upper troposphere, atmospheric stability and vertical wind shear in the upper troposphere (e.g., Emanuel, 2007; Latif et al., 2007; Saunders and Lea, 2008; Garner et al., 2009). On decadal timescales these factors are influenced by North Atlantic SST (Goldenberg et al., 2001; Dunstone et al., 2011) which is highly predictable (Doblas-Reyes et al., 2013; Yeager and Robson, 2017), enabling skilful long-range predictions of hurricane frequency (Smith et al., 2010; Caron et al., 2014, 2018; Hermanson et al., 2014).
With real-time decadal prediction now an operational WMO activity (Smith et al., 2013; Kushnir et al., 2019; Hermanson et al., 2022), forecasts of hurricane activity and total US economic losses for the coming 5 years were made in partnership with Willis Towers Watson to facilitate adjustments to extreme event occurrence rates, inform capital allocation strategies and influence premium pricing. These forecasts also provide opportunities to structure multi-year deals to take advantage of this predictability.
In Figure 2, linear regression of past observations onto an index based on predicted North Atlantic tropical ocean temperatures (Vecchi et al., 2011) is used to provide a probabilistic hurricane activity forecast. US damage forecasts (not shown) use a modified regression to account for the non-linear relationship with damage. Retrospective forecasts reveal skill (rank correlation ~0.7), outperforming persistence forecasts (using the last 5 years to predict the next five). Figure 2 shows that an active period is predicted for 2021–2025.
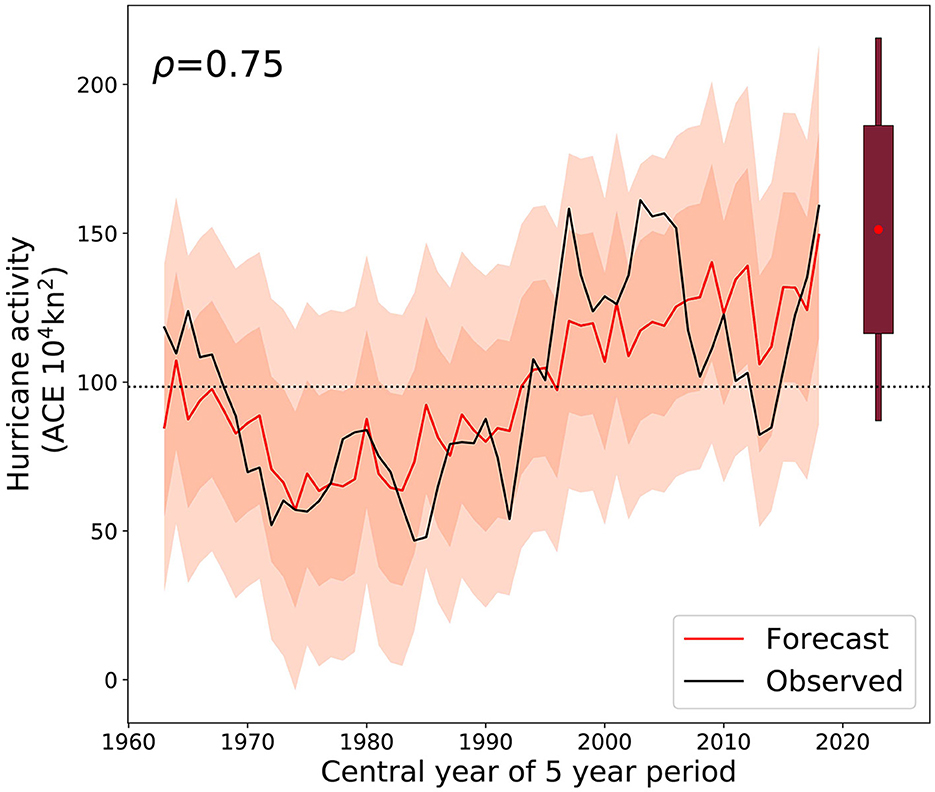
Figure 2. Multiyear North Atlantic hurricane forecasts. Observed and forecast 5-year mean hurricane activity (accumulated cyclone energy, ACE). Shading corresponds to the 75 and 95% prediction intervals. The box and whisker plot shows the 2021–2025 forecast. The rank correlation coefficient (ρ) is for the hindcast period.
2.3. Decadal predictions for commodity price forecasting
The El Niño Southern Oscillation (ENSO) has a significant impact on agriculture, water, and health (Zebiak et al., 2015). Some of the nations that experience profound ENSO impacts are geographically small, located in or near the tropics, and have economies dependent on a few climate-sensitive industries. In addition, there are documented relationships between ENSO and movements in commodity prices (Brunner, 2002; Ubilava and Holt, 2009), agricultural production (Gutierrez, 2017), and broader macroeconomic indicators (Cashin et al., 2017). In that regard, Kitsios et al. (2022), have demonstrated that econometric forecasts of certain commodity spot prices can be further improved with the inclusion of climate predictions of the relevant indices of climate variability i.e., exogenous factors. Here the highlighted commodity is coconut oil, and the exogenous factor is the Niño4 index (Rasmusson and Carpenter, 1982) provided by climate simulations. The Niño4 index is chosen as coconut oil is predominantly produced in the tropics where the physical influence of ENSO is most direct.
The commodity prices are accessed from the World Bank database4 with real commodity log-returns based on monthly inflation rates calculated using the G7 averaged consumer price index.5 ENSO forecast data was generated using the Climate re-Analysis and Forecast Ensemble (CAFE) system (O'Kane et al., 2019, 2020, 2021a,b). The model representation of the log-returns of the commodity price allows for additive seasonality, autoregressive processes, and lagged exogenous ENSO (Niño4) factors (for details see Kitsios et al., 2022). The autoregressive models are built using available data from January 1980 to December 2020, with all combinations of lags assessed up to a lag of 12 months. Combinations of lags that produce autocorrelated residuals or are shown to be heteroskedastic are excluded. Of the remaining combinations, the most parsimonious model was determined as that which minimises the Bayesian Information Criterion (BIC) (Schwarz, 1978) from within a class of models for which there are multiple lag combinations that have similar BIC values.
Out of sample correlations between the actual and forecast log returns produced by this econometric model are illustrated in Figure 3. Three variants are illustrated: one using perfect future ENSO information (perfect-ENSO, blue line) as an upper bound on skill; one with no ENSO information (no-ENSO, red line); and finally, the CAFE forecasts (GCM-ENSO, cyan line). Per start date the perfect-ENSO and GCM-ENSO cases have the same lag structure and the same values for the model coefficients, with the coefficients only learnt using data prior to the start date. In the no-ENSO case the same endogenous lags are adopted, but the model coefficients are re-calculated such that this model best fits the data. For the perfect-ENSO and GCM-ENSO cases, the hollow black circles indicate forecast times at which ENSO is found to be Granger or predictively causal, with a statistically significant reduction (to a 95% confidence) in their residual sum of squares (RSS) as compared to the no-ENSO case. This is after accounting for the increased number of parameters (i.e., F-test).
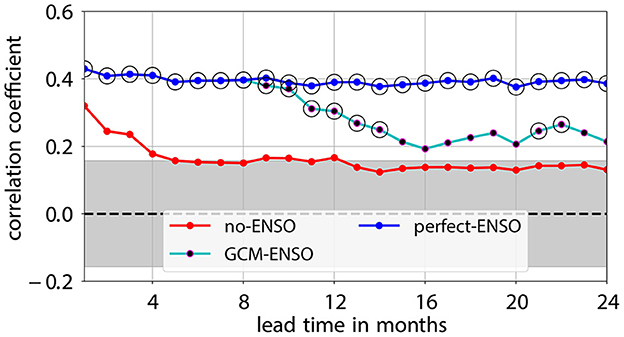
Figure 3. Interannual ENSO forecasts improve commodity price predictions. Out-of-sample correlation between forecast and actual log returns (i.e., approximate percentage change) in coconut oil price for autoregressive models using no exogenous ENSO information (no-ENSO, red), GCM ENSO forecasts (GCM-ENSO, cyan) and perfect future ENSO knowledge (perfect-ENSO, blue). The grey zone indicates correlations that are statistically no different from zero to a 95% confidence level. For the GCM-ENSO and perfect-ENSO models, the hollow black circles indicate forecast times at which ENSO is found to be Granger causal to a 95% confidence level.
The no-ENSO case has statistically significant positive correlations for only the first 4 months. The perfect-ENSO case has significant correlation and ENSO is found to be Granger causal for the entire 2-year period. This is, however, not a plausible forecast since one cannot know ENSO perfectly into the future. The GCM-ENSO case is a realistic and fair forecast, has significant correlations for the entire 2-year forecast window, and has a lower RSS than the no-ENSO case for most lead times. The associated significant RSS reductions at forecast months 21 and 22 should not be interpreted as a return of skill, but rather the RSS for the no-ENSO case increasing faster than that of the GCM-ENSO variant. This is consistent with the known forecast time dependent predictability of ENSO on inter-annual timescales (Luo et al., 2008; Knight et al., 2014; Dunstone et al., 2020). Over the first 8 months the GCM-ENSO and perfect-ENSO cases have identical statistics. This is because the coconut oil commodity has one exogenous lag of 8 months. This means that up to this point only historical ENSO information is used in all auto-regressive with external factor models, and it is not until a forecast time of 9 months that an actual ENSO forecast needs to be made. It is at this point that the forecast error measures begin to differ.
In summary, all commodity forecasts adopting exogenous ENSO factors out-perform those that did not. This indicates the importance and demonstrates the utility of incorporating NTCP information in a practical application of predicting commodity returns.
3. Water management and glacier loss
3.1. Decadal prediction in the Wupper river catchment
The Wupper catchment water board manages water level and quality of the Wupper River in Germany. To improve water management strategies multiyear predictions of the Standardised Precipitation Index (SPI, McKee et al., 1993) are required as this is correlated to dam water levels in the catchment. Multiyear annual and hydrological seasonal means are needed at high spatial resolution to manage 14 dams in an area of 800 km2.
Statistical downscaling from 200 km to ~11 km (Kreienkamp et al., 2018) was applied to all ensemble members of the global decadal prediction system MPI-ESM-LR (Mauritsen et al., 2019). Relationships between large-scale temperature, relative humidity, and geopotential height in Central Europe to local-scale temperature and precipitation in Germany have been considered using NCEP reanalyses (Kalnay et al., 1996) and high-resolution HYRAS observational data (Rauthe et al., 2013).
Downscaled precipitation has been recalibrated by applying the Decadal Climate Forecast Recalibration Strategy (DeFoRest, Pasternack et al., 2017) to correct bias, drift and conditional bias and adjust ensemble spread.
The skill of probabilistic decadal SPI predictions in reproducing past HYRAS observations has been evaluated using correlation and ranked probability skill score (RPSS, Ferro et al., 2008) in comparison to the reference prediction observed climatology over 1962–2020. The SPI drought index was assessed for multi-year annual and seasonal mean predictions for the coming 3 years. A significance level of 95% is applied using 1,000 non-parametric block bootstraps and considering autocorrelation.
Results showed that high-resolution statistical downscaling transfers the prediction skill of the global prediction system to higher spatial resolution and that the recalibration enhances SPI prediction skill. Additional skillful predictions were also found for three-year seasonal means, especially so for August to October in the Wupper river catchment. The study of Paxian et al. (2022) further reveals promising 3-year mean SPI skill for several additional regions in Germany.
The feedback of the Wupper catchment water board concluded that the product is understandable and well-structured and of utility during the daily decision-making work of water boards in Germany. A high probability of drought conditions is currently forecast for 2021–2023.
3.2. Decadal prediction for glacier mass balance
Glaciers are important indicators of climate change. They also store 75% of the earth's available freshwater (Jansson et al., 2003), also acting as buffers preventing precipitation from immediately turning into runoff. They are essential parts of mountain water storage and supply downstream communities and ecosystems, upon which 22% of the global population depends (Immerzeel et al., 2020). Quantifying changes in mass balance is challenging considering glacier response times (Raper and Braithwaite, 2009). In temperate maritime climates this is generally between 15 and 60 years but can exceed a century for high latitudes (Cuffey and Paterson, 2010). Decadal time scales are rarely considered in glacier modelling, even though they are critical for water resource management (Frans et al., 2016; Lane and Nienow, 2019). By predicting glacier mass balance on decadal timescales, it is possible to predict runoff, an important input for water resource decisions.
Here multi-decadal glacier discharge is examined using the Open Global Glacier Model (OGGM; Maussion et al., 2019) forced by monthly temperature and precipitation from the Decadal Climate Prediction Project (DCPP, Boer et al., 2016; Maussion et al., 2019). Results of a 10 member hindcast ensemble of the sixth version of the Model for Interdisciplinary Research on Climate (MIROC6) are analysed where all ensemble members, initialised each year for the period 1960–1999, are bias corrected for model drift as in Boer et al. (2016) and referenced to observations from the Climatic Research Unit gridded Time Series version 4 (Harris et al., 2020). OGGM is forced for 279 reference glaciers, from a global database of 216 000 glaciers, all of which have observational records exceeding 5 years (Van der Laan et al., 2022).
As a case study, we consider the Hintereisferner alpine glacier in Austria (Strasser et al., 2018). Based on the coupled model presented by Stoll et al. (2020), mass loss of Hintereisferner contributed 9.4% of discharge over 1991–2010. The remaining discharge is fed by the melting of other glaciers in the basin, snowmelt, and rain (Weber et al., 2010). The total catchment glaciation decreased from 44% in 1969 to 38% in 2009, leading to a decrease in contribution to annual streamflow (Müller et al., 2009). The glaciation of the catchment is expected to approach zero within the 21st century, significantly altering the hydrological balance in the catchment (Strasser et al., 2018). Decadal scale forecasts in this basin would allow insight into the deglaciation patterns, streamflow contribution and water resources for the downstream Inntal community.
Figure 4 compares observed and hindcast mass balance for the Hintereisferner. The temperature and precipitation amplitudes and trends correspond well to observations, showing the merit of using the decadal scale ensemble mean. The utility of this approach and skill of decadal hindcasts for glacier and runoff modelling is especially evident in the well-captured negative cumulative mass balance (Figure 4D) and in the overall Pearson correlation coefficient between the annual cumulative time series of 0.98, MME of 457.4 mm w.e.6 and MAE of 1,373 mm w.e.
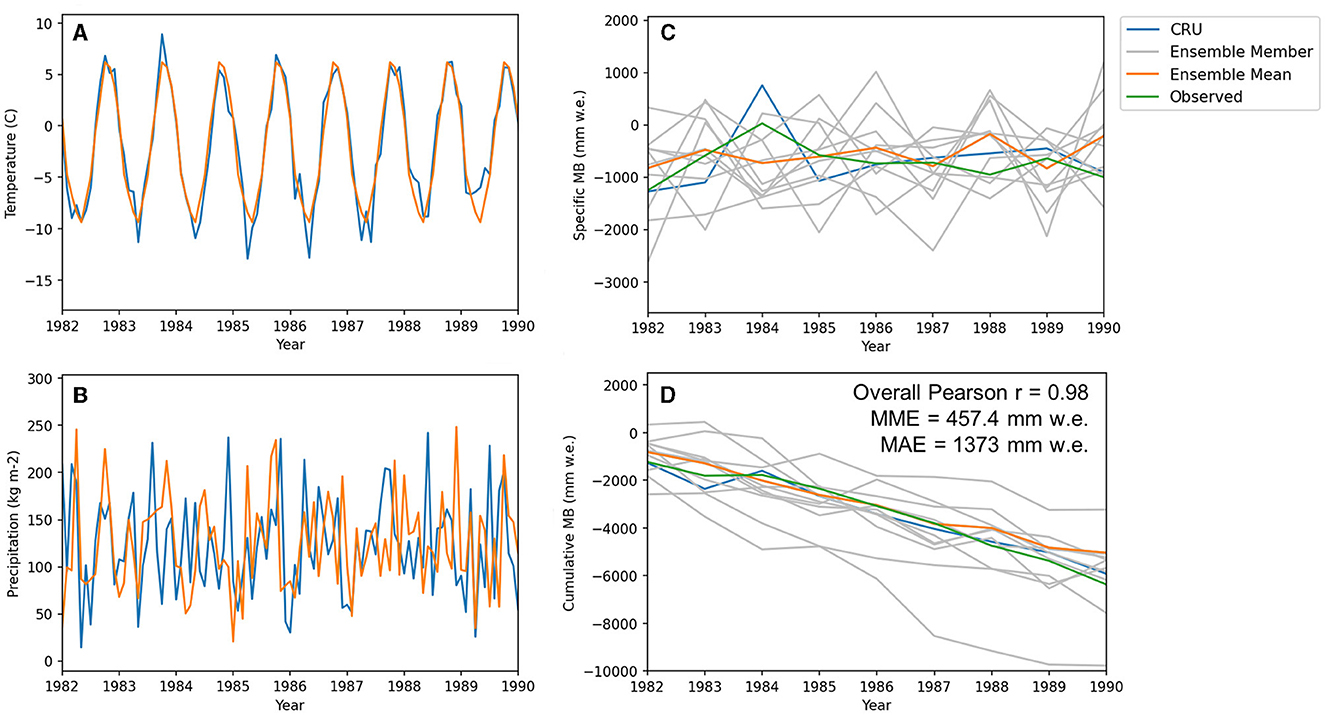
Figure 4. Decadal prediction of Glacier mass balance. Results for the Hintereisferner, an alpine glacier in Austria, for 1982–1990. Average temperature (A) and precipitation (B) over the time period for CRU and ensemble mean bias corrected hindcasts. (C) year to year mass balance of the glacier. “CRU” refers to results achieved with the CRU baseline climate, whereas “observed” results are glaciological measurements of mass balance on the Hintereisferner [World Glacier Monitoring Service (WGMS), 2021]. (D) shows the cumulative mass balance over the time period, MME is mean model error and MAE is mean absolute error. Cumulative mass balance is used as model skill is expected to be higher for integrated than instantaneous fluxes, and cumulative mass balance over the decade is most relevant for further hydrological modelling (Förster et al., 2018).
The current results are promising for skilful glacier mass balance decadal predictions. The method could also be expanded to all glaciers in an essential water tower region such as the Himalayan mountain range (Pfeffer et al., 2014; Immerzeel et al., 2020). This promises to provide necessary information for the planning of water resource allocation for hydropower, agriculture and drinking water on decadal timescales.
4. Agricultural policy
Recent studies have explored the ability of decadal climate forecast systems at predicting extreme climate events relevant to agriculture, such as drought and heat stress conditions, on a multiannual time scale (Paxian et al., 2019; Solaraju-Murali et al., 2019, 2021; Esit et al., 2021). Evaluating the quality of such predictions is considered a fundamental step because it assesses whether the prediction system can be trusted to reliably forecast multiannual climate events. The results presented in this section reveal significant skill for predicting climate events for temperature and, to a lesser extent, for precipitation that are already being usefully utilised to aid decision-making in the wheat sector with potential further applications to viticulture.
4.1. Decadal climate prediction for supporting decision-making in the wheat-sector
Wheat is the most harvested cereal crop in the world, contributing to the food security of many countries (Toreti et al., 2019). The usefulness of NTCPs for decision-making in the wheat-sector has recently been demonstrated (Solaraju-Murali et al., 2021). Unfavourable hot or dry conditions can induce water stress affecting both grain quality and yield, especially when occurring during sensitive development stages of the plant. NTCPs have been shown to skilfully anticipate multiannual drought and heat stress conditions in several areas with user-relevant agro-climatic indices such as the Standardised Precipitation Evapotranspiration Index (SPEI6) and Heat Magnitude Day Index (HMDI3) prior to wheat harvesting. Figure 5 presents the predicted likelihood of the most likely tercile category of multiannual averaged SPEI6 over global wheat harvesting regions for 2015–2019 from forecasts initialised in November 2014. The predictions show an increase in drought (below-normal category) events over most of the wheat-growing regions for the period (Figure 5A) and there is good agreement with observed SPEI6. This implies opportunities to help stakeholders in the wheat sector during their decision-making processes on multi-annual timescales.
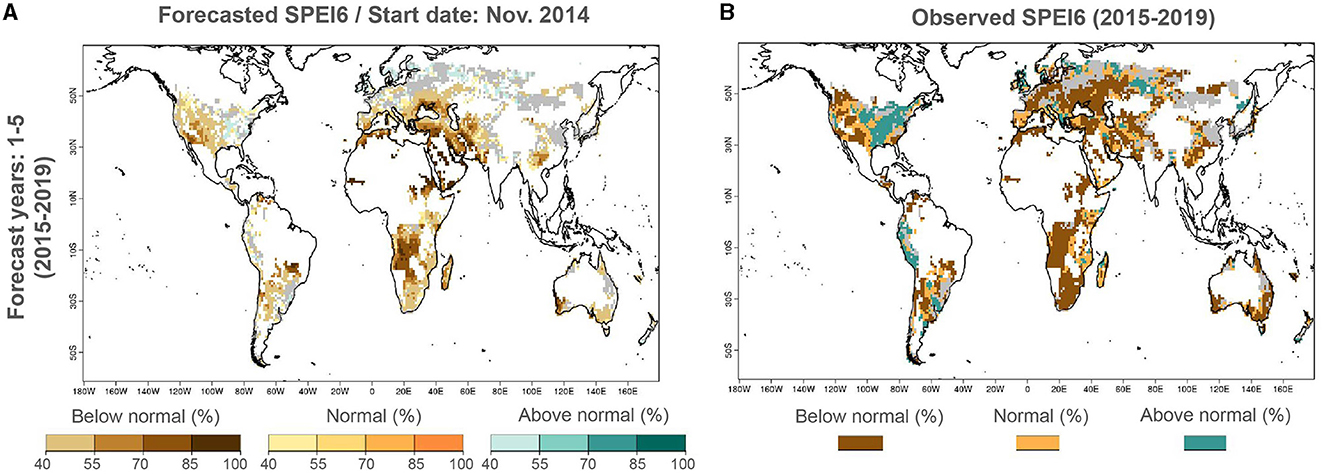
Figure 5. Multiannual prediction of Standardised Precipitation Evapotranspiration Index over 2015–2019. Most likely tercile for the categories “below normal (%)”, “normal (%)”, and “above normal (%)” of SPEI6 corresponding to the local wheat harvesting season for (A) decadal forecasts initialised near the end of 2014 and (B) observations. Non-growing wheat areas and regions with negative skill are displayed in white and grey, respectively.
These encouraging results have led to the development of tailored forecast products. A prototype product for multi-year drought forecasts for the coming 5 years over the global wheat harvesting regions has been made available for the agriculture user community (https://climate.copernicus.eu/decadal-predictions-agriculture). Such an initiative aims to establish transdisciplinary partnerships based on decadal predictions to help agricultural users during their decision-making process.
4.2. Potential use of decadal predictions for viticulture
Grapes are grown under open-field conditions in vineyards to supply fruit with characteristics for wine production with market-demanded sensory profiles (aroma, taste, and flavour). A vineyard is meant to last several decades but vineyard longevity is strongly conditioned by climate, making decadal predictions potentially very relevant. Thousands of vine varieties and landraces are used, each with its own climatic suitability, supporting viticulture's global spread. Products of the grapevine account for close to 4.5% of global food trade (Van Nieuwkoop, 2019; Fortune Business Insights, 2022) while international trade of wine in 2019 reached 31.8 bn € (OIV, 2020)7.
Choice of grape varieties is highly dependent on climate. Plants need 2–4 years until they become fully productive and climate in this period is critical for correct rooting and aerial development (Webb et al., 2011; Sgubin et al., 2019). Despite irrigation, depleted water reserves left vineyards vulnerable to water stress. Loss of leaves and arrest of secondary metabolism responsible for maturity is indicated by colourless berries. Grapevines close their stomata during daytime temperatures above 35°C, stopping photosynthesis, causing lower sugar accumulation in berries, malic acid breakdown from nocturnal respiration, and dehydration and desiccation, decreasing yields. These grapes are unfit for quality wine. An ability to predict temperature and rainfall would greatly enhance risk management for such investment. The capacity to estimate probabilities for the frequency of extreme events that cause, for example, water stress in grapes, would improve farm management and mitigate risks.
The ability to foresee the evolution of the climate for the impending 1–10 years is key to timely implementation of adaptation measures or change of viticulture business models (Gishen et al., 2016; Graça and Gishen, 2022). Grape and wine production would become more resilient, decreasing the use of plant pesticides and irrigation requirements. Other benefits include sizing of long-term facilities such as wineries and warehouses, managing wastewater and recycling and transport logistics (Graça, 2019).
Useful seasonal forecasts have already been demonstrated for wine production (Santos et al., 2020). Simulations of using seasonal forecasts to inform viticulture decisions have shown the need to consider the context of users and how they use forecasts, highlighting the high value of co-creating forecast services (Vigo et al., 2021). Demand for decadal predictions will be fostered by wider use of seasonal predictions with user-centric communication (Calmanti et al., 2021; Khosravi et al., 2021). Relevant temporal and spatial granularity will also be key for adoption of multi-year forecast information as well as the transparent disclosure of uncertainty to inform user-relevant decisions (Sgubin et al., 2019).
5. Fisheries management
5.1. Applications and opportunities for decadal forecasts in marine fisheries, aquaculture, and conservation
For more than a decade, physical information about the future ocean has been used to produce ecological forecasts at both short (Hobday and Hartmann, 2006; Hazen et al., 2017) and multidecadal timescales (Tommasi et al., 2017a). Ecological forecasts exploit relationships between physical variables and biological responses to predict ecologically relevant information. This includes species' spatial distribution, abundance, and phenology (Payne et al., 2017). In recent years, ecological forecasts at seasonal time scales have also been developed for fisheries (Hobday et al., 2011; Payne et al., 2017), aquaculture (Spillman and Hobday, 2014) and conservation (corals, Spillman, 2011; Liu et al., 2019; Spillman and Smith, 2021) applications. Decision-makers such as fishers/farmers, managers and policymakers in these sectors are now including forecast information in their planning (Hobday et al., 2016; Kaplan et al., 2016). These plans can be based on forecasts about a species':
1. Spatial distribution, where the decision might be where to fish or farm (Hobday et al., 2019).
2. Abundance and production of juveniles, where the decision might be how much to catch or grow (Kiaer et al., 2021).
3. Phenology, such as timing of migration, where the decision might be when to open or close fishing grounds (Champion et al., 2018).
4. Growth/condition - where the decision might be related to stock productivity.
While In theory decision-making can benefit from prior knowledge of all these factors, in practise most forecast systems to date have only focused on species spatial distributions (Payne et al., 2017).
The high skill of oceanic decadal-scale predictions has been apparent from early studies of climate prediction (IPCC AR5 WG1, Chapter 11, Kirtman et al., 2013). Oceanic predictability is typically higher than predictions for either the land surface or the atmosphere (Merryfield et al., 2020), and therefore represents one of the most promising areas for the application of decadal forecasts. Significant decadal-forecast skill is seen throughout much of the global ocean (Keenlyside et al., 2008; Power et al., 2021) and particularly in the North Atlantic (Figure 6). A majority of work has focussed on the open ocean rather than the coastal shelf-seas where the most of human interactions with the ocean take place. Nevertheless, studies that have examined the predictability of shelf seas and coastal marine ecosystems have shown potentially useful skill at interannual to multi-year timescales (Stock et al., 2015; Tommasi et al., 2017b; Koul et al., 2021, 2022; Miesner et al., 2022).
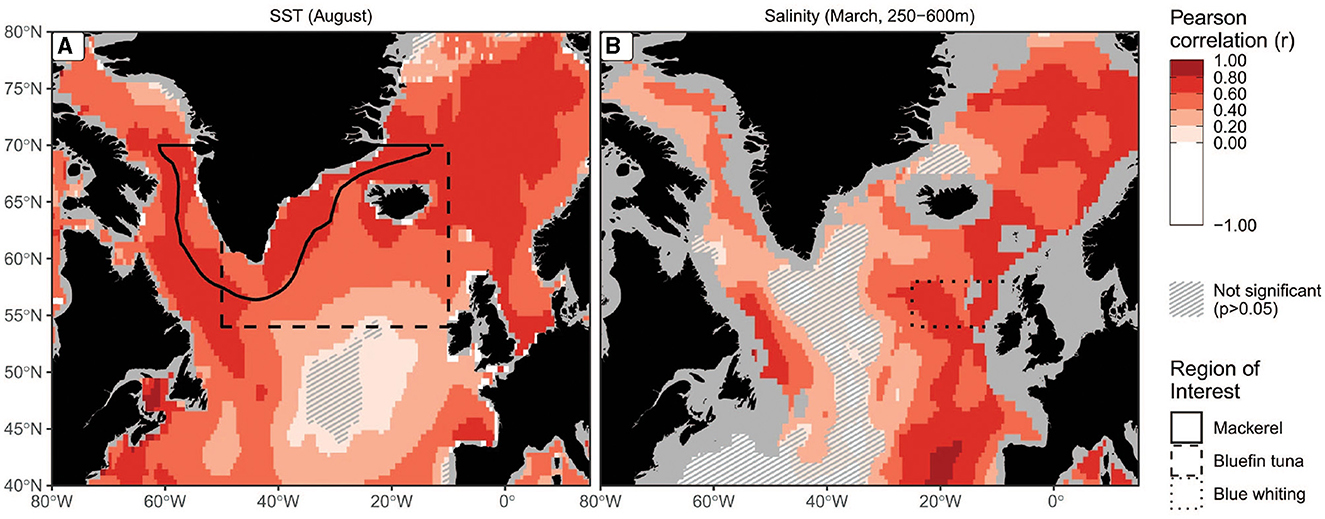
Figure 6. Skill of decadal predictions of the North Atlantic Ocean. Correlation skill of August surface temperature forecasts (A) and subsurface salinity in March (B) a forecast-time of 5 years. Predictive skill is expressed as the Pearson correlation coefficient (r) between the forecast and observed values of each variable, with each grid point coloured according to the local value, evaluated over the period 1960–2018 for SST and 1985–2018 for salinity. Regions where the correlation coefficient is not significantly >0 (at the 95% confidence level) are cross-hatched. The area over which suitable mackerel habitat is calculated is indicated by a solid line. Ocean regions not represented by all forecast models are shown in grey (Modified from Payne et al., 2022).
Due to the length of the available observational record and relatively high predictability, SST is one of the most utilised variables in models of marine ecological responses (Salinger et al., 2016; Merryfield et al., 2020). However, predictability is not limited to SST: multi-annual predictability is also seen in ocean heat content (Yeager et al., 2012) and salinity (Bethke et al., 2021; Figure 6) and large-scale indices such as Atlantic multidecadal overturning (Matei et al., 2012; Hermanson et al., 2014), the dynamics of the North Atlantic sub-polar gyre (Wouters et al., 2013), Atlantic multidecadal variability (Smith et al., 2020) and ENSO (Luo et al., 2008; Barnston et al., 2012, 2019; Knight et al., 2014; Dunstone et al., 2020). This physical predictability also extends into biogeochemical components including primary productivity and nutrient concentrations (Séférian et al., 2014; Gehlen et al., 2015; Park et al., 2019): indeed, most marine ecosystem drivers can potentially be predicted on at least the multi-year time-scale (Fransner et al., 2020; Frölicher et al., 2020).
The potential for operational marine ecological decadal forecast products builds on those already developed at seasonal time scales (Payne et al., 2017). Most of the operational products at seasonal timescales consider changes in the spatial distribution of fish species, with mounting evidence that such predictability could be extended to multi-year timescales (Payne et al., 2022) as shown in forecasts of Mackerel (Scomber scrombus) habitat around Greenland (Figure 7). Decadal predictability of the total catches of fish species at the large-marine ecosystem level has also been shown (Park et al., 2019) including some stock-specific cases (Årthun et al., 2018).
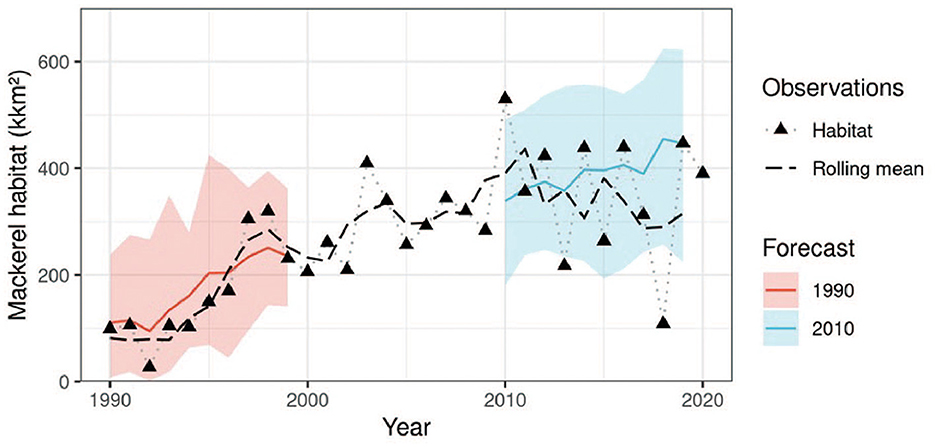
Figure 7. Example of a marine application of decadal forecasting. Mackerel (Scomber scrombus) habitat around Greenland forecast by the CESM-DPLE model system is shown for forecasts initialised in 1990 (red) and 2010 (blue), showing the median (solid line) and 90% range of realisations in the model (colour areas). Habitat estimates based on observation are shown (triangles) together with a three-year centred running mean (dashed black line) of these values. The decadal forecast system is clearly able to predict the expansion of mackerel habitat in this region that occurred in the early 1990s. When mackerel started utilising this habitat in the early 2010s and appeared around Greenland, decadal forecasts would have correctly predicted that the available habitat would persist for the coming decade. This example therefore shows how decadal forecasts can be used to foresee changes in the habitat, and therefore potentially distribution of marine species. Such information, if it had been available at the time, would have been valuable to managers trying to decide whether to invest in this potential new fishery. Modified from Payne et al. (2022).
Exploratory studies have also shown that the use of ecological forecasts can generate economic value for users. One such example examines the use of multi-annual forecasts in the management of Pacific sardine (Sardinops sagax) in the California Current system. Tommasi et al. (2017c) showed that the use of forecasts, in conjunction with established management systems, could improve both the long-term yield and sustainability of the fishery. Economic valuation tools have also shown a potential net-positive yield of annual productivity forecasts for sandeel (Ammodytes sp.) in the North Sea (Kiaer et al., 2021). However, there is currently only limited use of this information by decision makers of forecast products irrespective of timescale (Skern-Mauritzen et al., 2016; Payne et al., 2017), in contrast to other fields (e.g., agriculture, Asseng et al., 2012).
5.2. Prediction of Labrador Current temperatures in support of fishery management
The “northern” cod (Gadus morhua) inhabits northwest Atlantic waters off the coast of Canada's Newfoundland and Labrador (NL) province. These shelf and upper slope waters are dominated by the cold Labrador Current, which varies on interannual to decadal timescales (Han et al., 2019) and is linked to the North Atlantic subpolar gyre which is relatively predictable on multi-year timescales (e.g., Robson et al., 2018). Because Labrador Current temperatures influence cod populations (Lehodey et al., 2006), this species could be a promising candidate for the application of seasonal to decadal forecasts to living marine resource management (e.g., Tommasi et al., 2017b). Of particular note is that especially cold ocean temperatures in the region appear to have been a factor in the economically damaging collapse of the northern cod population in the 1990s (Mullowney et al., 2019), recovery from which is still incomplete (Rose and Walters, 2019).
The possible utility of multi-year climate forecasts for management of this species has been explored using hindcasts from the CanCM4 model (Merryfield et al., 2013). Seasonal forecasts from this model have previously been shown to be relatively skilful at ranges of up to 12 months in predicting SST anomalies in the Labrador-Newfoundland large marine ecosystem that is home to the northern cod habitat (Hervieux et al., 2019).8
Ocean potential temperatures are considered along a series of transects spaced approximately every two degrees in longitude from 56°N to 46°N, extending eastward from the NL coast and encompassing the southward component of upper ocean flow associated with the Labrador Current over the shelf and upper slope to a depth of 661 m. Northern cod populations generally winter on the upper slope beneath the cold sub-zero core of the Labrador Current, and migrate in late spring westward into cooler shelf waters to feed (Lilly et al., 2013). Because the extent of coldest Labrador Current waters influences both the available optimal habitat for growth and recruitment and the availability of prey (Rose and Rowe, 2015), predictions of the anomalous cross-sectional area at temperatures >0°C in each of the transects are examined.
Figure 8A shows annual time series from the ORAS4 ocean reanalysis, the CanCM4 analysis, and first-year (lead 0) forecast values for the 50°N transect, near the latitudinal centre of what had been the prime region for this fishery. The multi-year to decadal timescale variations of these three timeseries align reasonably well, particularly in the earlier decades, and a prolonged negative anomaly is evident in each of the time series during the early 1990s, indicative of generally colder temperatures and reduced favourable habitat above 0°C. Figure 8B shows anomaly correlation (AC) as a function of lead year for the decadal forecasts, as well as for persistence of both verification datasets and their lagged correlations with each other. Forecast anomaly correlations (AC) based on verification with the CanCM4 analysis (blue) remain statistically significant and generally higher than persistence of the analysis through lead times of 5 years, whereas skill based on verification with ORAS4 is significant only in the 1st year.
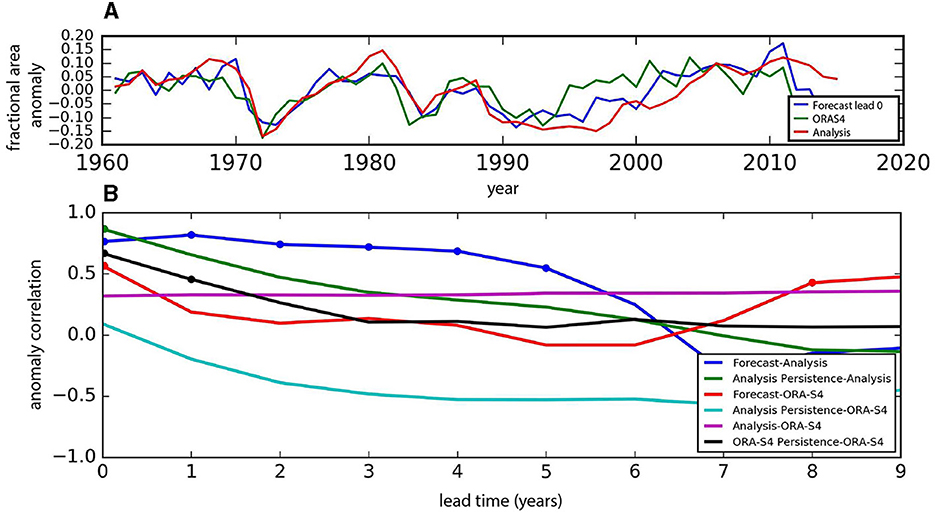
Figure 8. Subsurface ocean predictability relevant to northern cod populations. (A) Time series of the fractional area anomaly of temperatures >0°C in a longitudinal transect near 50°N extending from the Newfoundland coast to approximately 50°W and a depth of 661 m, for the 1st year of CanCM4 decadal forecasts (blue), the CanCM4 analysis used for their initialisation (red), and the ORAS4 reanalysis (green). (B) Anomaly correlations as a function of lead time for CanCM4 forecasts verified against the CanCM4 analysis (blue) and ORAS4 (red), with additional persistence and cross-correlation measures as indicated. Dots indicate statistical significance at 95% taking into account reduced degrees of freedom due to autocorrelation.
These results indicate the potential utility of decadal forecasts for predicting subsurface ocean conditions relevant to the management of the northern cod population out to at least 1 year ahead and possibly longer, although further studies are needed to understand the differences between skill measures based on ORAS4 and the CanCM4 analysis.
5.3. Future requirements
Realising the full potential of NTCP in the marine sector will require overcoming numerous barriers within, and external to, the field of climate prediction. The most important of these is a need to raise awareness in the user and marine science communities about the current and constantly improving skill of climate predictions, as is being done for seasonal forecasts (Hobday et al., 2016). Considerable investment is still needed to support decadal forecasting and integration of those forecasts into decision support tools.9 Overall, collaboration between forecast developers and the marine resource sector is needed to support forecast-based tactical and strategic decisions that reduce environmental risk over annual to decadal time scales.
6. Discussion
The studies described here demonstrate that climate forecasts are already being successfully applied across a number of sectors, including hurricane re-insurance, in the marine and agricultural sectors and for water management including glacier loss. For example, it is apparent that NTCPs of the frequency and intensity of hurricane activity are providing important information to enable the re-insurance sector to manage risk and to estimate total losses years in advance. It is further observed that relationships in the physical climate system can be utilised to better predict commodity prices and broader macroeconomic indicators such that forecasts of certain commodity spot prices can be improved with the inclusion of predicted climate variability in econometric models. Finally, oceanic predictability is relatively high on these timescales and is shown to yield useful predictions of various habitats across a range of economically important fish species in the North Atlantic.
While climate-model predictions have shown potential to deliver useful information to society (Dunstone et al., 2022), the interpretation of model output to extract the relevant and “skilful” information is key to realising this potential. It is the large-scale processes in the climate system that are potentially highly predictable on timescales from months to years and statistical downscaling of decadal forecasts to regional scales can often be more skilful than naïve use of gridpoint information. However, the signal to noise ratio in some regions is anomalously low, such that extremely large ensembles of climate forecasts are often required to capture skill (Smith et al., 2019). For these and other technical reasons (see, e.g., Power et al., 2021), predicting the near-term climate remains a challenge which will necessitate careful development of products.
Information about the future offers a range of benefits, not all of which will be equally distributed. As with seasonal forecasts, there may be groups disadvantaged by such information, and so forecast providers should consider the ethical aspects of forecast delivery (Hobday et al., 2019). For example, multi-year drought prediction may increase insurance costs to individual farmers (disadvantage) while reducing losses to insurance providers (advantage). Similarly, not all users can act freely in response to the information provided, particularly in situations where economic, cultural or traditional constraints are important (Soares et al., 2018). A note of caution, in common with weather prediction NTCP skill assessments based on past performance are only indicative of whether a given real-time forecast exhibits a degree of skill and therefore can provide useful guidance. A non-trivial task is how to effectively communicate the utility of NTCP and the associated challenges and uncertainties in an appropriate form to meet the needs of the end user and manage expectations.
7. Summary
We have presented a small fraction of the full range of case studies in which NTCPs have been shown to be useful or have the potential to be useful. NTCP will underpin a crucial component of the Global Framework for Climate Services (GFCS)10 as the annual to decadal timescale is a key planning horizon in decision-making. However, the utility of NTCPs will only grow where user feedback is actively sought and products are co-developed specifically to fit user demand for information. As described in Kushnir et al. (2019), an enormous community effort has been required to deliver operational climate prediction systems. The generation of ensembles of bias-corrected and post-processed predictions is now routinely carried out across multiple centres. This significant community effort is now providing prediction information that can underpin future climate services for end-users.
With the evolution of operational centres around the globe and continued advances in climate modelling, a more expansive and homogeneous observing network for the oceans, advances from artificial intelligence and machine learning to analyse and extract signal from the noise, in combination with user demand for climate services, the capability in near term climate prediction is expected to grow from its current status building on these early demonstrations.
Author contributions
All authors listed have made a substantial, direct, and intellectual contribution to the work and approved it for publication.
Funding
HP received funding by DWD's Innovation Programme for Applied Researches and Developments (IAFE VH3.5). LL and KF were supported by the Deutsche Forschungsgemeinschaft (DFG, German Research Foundation) Grant No. 416069075 (FO1269/1-1). AS, DS, JL, and ND were supported by the Met Office Hadley Centre Climate Programme funded by BEIS. AS and DS were also supported by the H2020 EUCP (Grant No. GA 776613) project. Funding for the activities of the GC-NTCP was provided by World Climate Research Programme, noting that this group took the initiative to meet online in order to minimise its carbon footprint. Funding for MCR was provided by the Marine Environmental Observation, Prediction and Response Network (MEOPAR). DM and NK were supported by the EU Horizon Project Impetus4Change (Grant Agreement Nr. 101081555), the German Federal Ministry for Education and Research through the JPI Climate/JPI Oceans NextG-Climate Science ROADMAP (FKZ: 01LP2002A, RCN #316618) (DM and NK), and the Research Council of Norway SFI Climate Futures (#309562) (NK).
Conflict of interest
GS and RC were employed by Willis Towers Watson. GS is employed by Caniopus Group.
The remaining authors declare that the research was conducted in the absence of any commercial or financial relationships that could be construed as a potential conflict of interest.
Publisher's note
All claims expressed in this article are solely those of the authors and do not necessarily represent those of their affiliated organizations, or those of the publisher, the editors and the reviewers. Any product that may be evaluated in this article, or claim that may be made by its manufacturer, is not guaranteed or endorsed by the publisher.
Footnotes
1. ^A climate damage function is a simplified expression of economic damages as a function of climate inputs e.g., changes in temperature.
2. ^Available online at: https://www.fsb-tcfd.org/about.
3. ^3,400 as of August 2022 Available online at: https://www.fsb-tcfd.org/support-tcfd/.
4. ^Available online at: https://www.worldbank.org/en/research/commodity-markets.
5. ^Available online at: https://data.oecd.org.
6. ^Units are water equivalent (w.e.).
7. ^Available online at: https://www.oiv.int/en/oiv-life/current-situation-of-the-vitivinicultural-sector-at-a-global-level.
8. ^The decadal hindcasts considered here consist of 10 ensemble members initialized at the start of each January from 1961 to 2015. Both the ORAS4 reanalysis (Balmaseda et al., 2013) and the analysis used in initializing CanCM4 (consisting of the CanCM4 ocean component forced by the reanalysis-nudged atmospheric component) are referenced for verification.
9. ^Available online at: https://www.foo.org.au/forum/foo-2021.
10. ^GFCS (2014). Implementation Plan of the Global Framework for Climate Services. https://gfcs.wmo.int/implementation-plan.
References
Årthun, M., Bogstad, B., Daewel, U., Keenlyside, N. S., Sand,ø, A. B., Schrum, C., et al. (2018). Climate based multi-year predictions of the Barents Sea cod stock. PLoS ONE 13, 1–13. doi: 10.1371/journal.pone.0206319
Asseng, S., McIntosh, P. C., Wang, G., and Khimashia, N. (2012). Optimal N fertiliser management based on a seasonal forecast. Euro. J. Agronom. 38, 66–73. doi: 10.1016/j.eja.2011.12.005
Balmaseda, M. A., Mogensen, K., and Weaver, A. T. (2013). Evaluation of the ECMWF ocean reanalysis system ORAS4. Quart. J. Roy. Meteor. Soc. 139, 1132–1161. doi: 10.1002/qj.2063
Barnston, A. G., Tippett, M. K., L'Heureux, M. L., Li, S., and DeWitt, D. G. (2012). Skill of real-time seasonal ENSO model predictions during 2001–11. Is our capacity increasing? Bull. Amer. Meteor. Soc. 93, 631–651. doi: 10.1175/BAMS-D-11-00111.1
Barnston, A. G., Tippett, M. K., Ranganathan, M., and L'Heureux, M. L. (2019). Deterministic skill of ENSO predictions from the North American multimodel ensemble. Clim. Dyn. 53, 7215–7234. doi: 10.1007/s00382-017-3603-3
Bellrose, K., Norman, D., and Royters, M. (2021). Climate Change Risks to Australian Banks, Reserve Bank of Australia Bulletin. Available online at: https://www.rba.gov.au/publications/bulletin/2021/sep/climate-change-risks-to-australian-banks.html (accessed December 16, 2021).
Beltrán, A., Maddison, D., and Elliott, R. J. (2018). Is flood risk capitalised into property values? Ecol. Econ. 146, 668–685. doi: 10.1016/j.ecolecon.2017.12.015
Bethke, I., Wang, Y., Counillon, F., Keenlyside, N., Kimmritz, M., Fransner, F., et al. (2021). NorCPM1 and its contribution to CMIP6 DCPP. Geosci. Model Dev. Discuss. 14, 7073–7116. doi: 10.5194/gmd-14-7073-2021
Boer, G. J., Smith, D. M., Cassou, C., Doblas-Reyes, F., Danabasoglu, G., Kirtman, B., et al. (2016). and Eade, R. The decadal climate prediction project (DCPP) contribution to CMIP6. Geoscient. Model Develop. 9, 3751–3777. doi: 10.5194/gmd-9-3751-2016
Brunner, A. (2002). El Niño and world primary commodity prices: warm water or hot air? Rev. Econ. Stat. 84, 176–183. doi: 10.1162/003465302317332008
Calmanti, S., Soares, M. B., Dell'Aquila, A., Ponti, L., De Felice, M., Gonzalez-Reviriego, N., et al. (2021). “Overcoming conflicting notions of climate forecasts reliability and skill in the agricultural sector: lessons from the MED-GOLD project,” in EGU General Assembly Conference Abstracts. p. EGU21-16350. doi: 10.5194/egusphere-egu21-16350
Caron, L. P., Hermonson, L., Dobbin, A., Imbers, J., Lledó, L., Vecchi, G. A., et al. (2018). How skillful are the multiannual forecasts of Atlantic hurricane activity? Bull. Amer. Meteor. Soc. 99, 403–413. doi: 10.1175/BAMS-D-17-0025.1
Caron, L. P., Jones, C. G., and Doblas-Reyes, F. (2014). Multi-year prediction skill of Atlantic hurricane activity in CMIP5 decadal hindcasts. Clim. Dyn. 42, 2675–2690. doi: 10.1007/s00382-013-1773-1
Cashin, P., Mohaddes, K., and Raissi, M. (2017). Fair weather or foul? The macroeconomic effects of El Niño. J. Int. Econ. 106, 37–54. doi: 10.1016/j.jinteco.2017.01.010
Champion, C., Hobday, A. J., Tracey, S. R., and Pecl, G. T. (2018). Rapid shifts in distribution and high-latitude persistence of oceanographic habitat revealed using citizen science data from a climate change hotspot. Global Change Biol. 24, 5440–5453. doi: 10.1111/gcb.14398
Doblas-Reyes, F. J., Andreu-Burillo, I., Chikamoto, Y., García-Serrano, J., Guemas, V., Kimoto, M., et al. (2013). Initialized near-term regional climate change prediction. Nat. Commun. 4, 1715. doi: 10.1038/ncomms2704
Dunstone, N., Lockwood, J., Solaraju-Murali, B., Reinhardt, K., Tsartsali, E. E., Athanasiadis, P. J., et al. (2022). Towards useful decadal predictions. Bull. Am. Meteorol. Soc. 103, E1705–E1719. doi: 10.1175/BAMS-D-21-0190.1
Dunstone, N., Smith, D., Yeager, S., Danabasoglu, G., Monerie, P. A., and Hermanson, L. (2020). Skilful interannual climate prediction from two large initialised model ensembles. Env. Res. Lett. 15, 094083. doi: 10.1088/1748-9326/ab9f7d
Dunstone, N. J., Smith, D. M., and Eade, R. (2011). Multi-year predictability of the tropical Atlantic atmosphere driven by the high latitude north Atlantic Ocean. Geophys. Res. Lett. 38, L14701. doi: 10.1029/2011GL047949
Emanuel, K. (2007). Environmental factors affecting tropical cyclone power dissipation. J. Clim. 20, 5497–5509. doi: 10.1175/2007JCLI1571.1
Esit, M., Kumar, S., Pandey, A., Lawrence, D. M., Rangwala, I., Yeager, S., et al. (2021). Seasonal to multi-year soil moisture drought forecasting. NPJ Clim. Atmosph. Sci. 4, 1–8. doi: 10.1038/s41612-021-00172-z
Ferro, C. A. T., Richardson, D. S., and Weigel, A. P. (2008). On the effect of ensemble size on the discrete and continuous ranked probability scores. Meteor. Appl. 15, 19–24. doi: 10.1002/met.45
Förster, K., Hanzer, F., Stoll, E., Scaife, A. A., MacLachlan, C., Schöber, J., et al. (2018). Retrospective forecasts of the upcoming winter season snow accumulation in the Inn headwaters (European Alps). Hydrol. Earth Syst. Sci. 22, 1157–1173. doi: 10.5194/hess-22-1157-2018
Fortune Business Insights (2022). The global wine market is projected to grow from $340, 23 billion in 2021 to $456.76 billion in 2028 at a CAGR of 4.30% in forecast period, 2021-2028. Pune, Maharashtra, India. Available online at: https://www.fortunebusinessinsights.com/wine-market-102836 (accessed March 29, 2022).
Frans, C., Istanbulluoglu, E., Lettenmaier, D. P., Clarke, G., Bohn, T. J., Stumbaugh, M., et al. (2016). Implications of decadal to century scale glacio-hydrological change for water resources of the Hood River basin, OR, USA. Hydrol. Proces. 30, 4314–4329. doi: 10.1002/hyp.10872
Fransner, F., Counillon, F., Bethke, I., Tjiputra, J., Samuelsen, A., Nummelin, A., et al. (2020). Ocean biogeochemical predictions—initialization and limits of predictability. Front. Marine Sci. 7, 386. doi: 10.3389/fmars.2020.00386
Frölicher, T. L., Ramseyer, L., Raible, C. C., Rodgers, K. B., and Dunne, J. (2020). Potential predictability of marine ecosystem drivers. Biogeosciences 17, 2061–2083. doi: 10.5194/bg-17-2061-2020
Gallo, F., and Lepousez, V. (2020). Assessing physical climate risks for financial decision makers: common methodologies, challenges and case studies. Carbone 4. ClimINVEST project report. Available online at: https://www.carbone4.com/files/wp-content/uploads/2020/06/ClimINVEST_AssessingPhysicalClimateRisks_Carbone4-2020.pdf (accessed December 16, 2021).
Garbarino, N., and Guin, B. (2020). High water, no marks? Biased lending after extreme weather. Staff Working Paper No. 856. Bank of England. doi: 10.2139/ssrn.3564226
Garner, S. T., Held, I. M., Knutson, T., and Sirutis, J. (2009). The roles of wind shear and thermal stratification in past and projected changes of Atlantic tropical cyclone activity. J. Clim. 22, 4723–4734. doi: 10.1175/2009JCLI2930.1
Gehlen, M., Barciela, R., Bertino, L., Brasseur, P., Butenschön, M., Chai, F., et al. (2015). Building the capacity for forecasting marine biogeochemistry and ecosystems: Recent advances and future developments. J. Oper. Oceanogr. 8, s168–s187. doi: 10.1080/1755876X.2015.1022350
Gishen, M., Graça, A., and Jones, G. (2016). “Proposal for the Development of a Framework for a Globally Relevant Wine Sector Climate Change Adaptation Strategy,” in Proceedings of the 11th International Terroir Congress (McMinnville, Oregon, USA 2016).
Goddard, L., Kumar, A., Solomon, A., Smith, D., Boer, G., Gonzalez, P., et al. (2013). A verification framework for interannual-to-decadal predictions experiments. Clim. Dyn. 40, 245–272. doi: 10.1007/s00382-012-1481-2
Goldenberg, S. B., Landsea, C. W., Mestas-Nunez, A. M., and Gray, W. M. (2001). The recent increase in Atlantic hurricane activity: Causes and implications. Science 293, 474–479. doi: 10.1126/science.1060040
Graça, A. (2019). “The MED-GOLD project: advanced user-centric climate services for higher resilience and profitability in the grape and wine sector,” in BIO Web of Conferences (EDP Sciences). doi: 10.1051/bioconf/20191201005
Graça, A., and Gishen, M. (2022). “Making sense of available information for climate change adaptation and building resilience into wine production systems across the world,” in IVES Conference Series.
Gromowski, A. (2018). “The Impact of Natural Catastrophe on Mortgage Delinquency,” in 2018's Hurricanes and Wildfires Expected to Increase Serious Delinquency Rates (CoreLogic).
Gutierrez, L. (2017). Impacts of El Niño Southern Oscillation on the wheat market: A global dynamic analysis. PLoS ONE 12, e0179086. doi: 10.1371/journal.pone.0179086
Han, G. Q., Ma, Z. M., and Chen, N. (2019). Ocean climate variability off Newfoundland and Labrador over 1979-2010: A modelling approach. Ocean Modell. 144, 101505. doi: 10.1016/j.ocemod.2019.101505
Harris, I., Osborn, T. J., Jones, P., and Lister, D. (2020). Version 4 of the CRU TS monthly high-resolution gridded multivariate climate dataset. Scient. Data 7, 1–18. doi: 10.1038/s41597-020-0453-3
Hazen, E. L., Palacios, D. M., Forney, K. A., Howell, E. A., Becker, E., Hoover, A. L., et al. (2017). WhaleWatch: a dynamic management tool for predicting blue whale density in the California Current. J. Appl. Ecol. 54, 1415–1428. doi: 10.1111/1365-2664.12820
Hermanson, L., Eade, R., Robinson, N. H., Dunstone, N. J., Andrews, M. B., Knight, J. R., et al. (2014). Forecast cooling of the Atlantic subpolar gyre and associated impacts. Geophys. Res. Lett. 41, 5167–5174. doi: 10.1002/2014GL060420
Hermanson, L., Ren, H. L., Vellinga, M., Dunstone, N. D., Hyder, P., Ineson, S., et al. (2017). Different types of drifts in two seasonal forecast systems and dependence on ENSO. Clim. Dyn. 51, 1411–1426 doi: 10.1007/s00382-017-3962-9
Hermanson, L., Smith, D., Seabrook, M., Bilbao, R., Doblas-Reyes, F., Tourigny, E., et al. (2022). WMO global annual to decadal climate update: a prediction for 2021-2025. Bull. Amer. Met. Soc. 103, E1117–E1129. doi: 10.1175/BAMS-D-20-0311.1
Hervieux, G., Alexander, M. A., Stock, C. A., Jacox, M. G., Pegion, K., Becker, E., et al. (2019). More reliable coastal SST forecasts from the North American multimodel ensemble. Clim. Dyn. 53, 7153–7168. doi: 10.1007/s00382-017-3652-7
Hobday, A. J., and Hartmann, K. (2006). Near real-time spatial management based on habitat predictions for a longline bycatch species. Fisher. Manag. Ecol. 13, 365–380. doi: 10.1111/j.1365-2400.2006.00515.x
Hobday, A. J., Hartog, J., Spillman, C., and Alves, O. (2011). Seasonal forecasting of tuna habitat for dynamic spatial management. Canad. J. Fisher. Aquat. Sci. 68, 898–911. doi: 10.1139/f2011-031
Hobday, A. J., Hartog, J. R., Manderson, J. P., Mills, K. E., Oliver, M. J., Pershing, A. J., et al. (2019). Ethical considerations and unanticipated consequences associated with ecological forecasting for marine resources. ICES J. Marine Sci. 76, 1244–1256. doi: 10.1093/icesjms/fsy210
Hobday, A. J., Spillman, C. M., Eveson, J. P., and Hartog, J. R. (2016). Seasonal forecasting for decision support in marine fisheries and aquaculture. Fisher. Oceanogr. 25, 45–56. doi: 10.1111/fog.12083
Immerzeel, W. W., Lutz, A. F., Andrade, M., Bahl, A., Biemans, H., Bolch, T., et al. (2020). Importance and vulnerability of the world's water towers. Nature 577, 364–369. doi: 10.1038/s41586-019-1822-y
Jansson, P., Hock, R., and Schneider, T. (2003). The concept of glacier storage: a review. J. Hydrol. 282, 116–129. doi: 10.1016/S0022-1694(03)00258-0
Kalnay, E., Kanamitsu, M., Kistler, R., Collins, W., Deaven, D., Gandin, L., et al. (1996). The NCEP/NCAR 40-year reanalysis project. Bull. Am. Meteorol. Soc. 77, 437–472. doi: 10.1175/1520-0477(1996)077<0437:TNYRP>2.0.CO;2
Kaplan, I. C., Williams, G. D., Bond, N. A., Hermann, A. J., and Siedlecki, S. (2016). Cloudy with a chance of sardines: forecasting sardine distributions using regional climate models. Fisher. Oceanogr. 25, 15–27. doi: 10.1111/fog.12131
Keenlyside, N. S., Latif, M., Jungclaus, J., Kornblueh, L., and Roeckner, E. (2008). Advancing decadal-scale climate prediction in the North Atlantic sector. Nature 453, 84–88. doi: 10.1038/nature06921
Khosravi, M., Soares, M. B., Graça, A., Fontes, N., and Teixeira, M. (2021). “Assessing the value of climate services for the wine sector (No. EMS2021-463),” in Copernicus Meetings. doi: 10.5194/ems2021-463
Kiaer, C., Neuenfeldt, S., and Payne, M. R. (2021). A framework for assessing the skill and value of operational recruitment forecasts. ICES J. Marine Sci. 78, 3581–3591. doi: 10.1093/icesjms/fsab202
Kirtman, B., Power, S. B., Adedoyin, J. A., Boer, G. J., Bojariu, R., Camilloni, I., et al. (2013). “Near-term Climate Change: Projections and Predictability” in Climate Change 2013: The Physical Science Basis. Contribution of Working Group I to the Fifth Assessment Report of the Intergovernmental Panel on Climate Change, eds. T. F., Stocker, D. Qin, G.-K. Plattner, M. Tignor, S.K. Allen, J. Boschung, et al. (Cambridge, United Kingdom and New York, NY, USA: Cambridge University Press).
Kitsios, V., De Mello, L., and Matear, R. (2022). Forecasting commodity returns by exploiting climate model forecasts of the El Niño Southern Oscillation. Environ. Data Sci. 1, 1–16. doi: 10.1017/eds.2022.6
Klotzbach, P. J., and Gray, W. M. (2008). Multidecadal variability in North Atlantic tropical cyclone activity. J. Clim. 21, 3929–3935. doi: 10.1175/2008JCLI2162.1
Knight, J. R., Andrews, M. B., Smith, D. M., Arribas, A., Colman, A. W., Dunstone, N. J., et al. (2014). Predictions of climate several years ahead using an improved decadal prediction system. J. Clim., 27, 7550–7567. doi: 10.1175/JCLI-D-14-00069.1
Koul, V., Brune, S., Baehr, J., and Schrum, C. (2022). Impact of decadal trends in the surface climate of the North Atlantic subpolar gyre on the marine environment of the Barents Sea. Front. Mar. Sci. 8, 778335. doi: 10.3389/fmars.2021.778335
Koul, V., Sguotti, C., Årthun, M., Brune, S., Düsterhus, A., Bogstad, B., et al. (2021). Skilful prediction of cod stocks in the North and Barents Sea a decade in advance. Commun. Earth Environ. 2, 140. doi: 10.1038/s43247-021-00207-6
Kreienkamp, F., Paxian, A., Früh, B., Lorenz, P., and Matulla, C. (2018). Evaluation of the Empirical-Statistical Downscaling method EPISODES. Clim. Dyn. 52, 991–1026. doi: 10.1007/s00382-018-4276-2
Kushnir, Y., Scaife, A. A., Arritt, R., Balsamo, G., Boer, G., Doblas-Reyes, F., et al. (2019). Towards operational predictions of the near-term climate. Nat. Clim. Change 9, 94–101. doi: 10.1038/s41558-018-0359-7
Landsea, C. W. (2007). Counting Atlantic tropical cyclones back to 1900. Eos. Trans. Am. Geophys. Union 88, 197–208. doi: 10.1029/2007EO180001
Lane, S. N., and Nienow, P. W. (2019). Decadal-scale climate forcing of Alpine glacial hydrological systems. Water Resour. Res. 55, 2478–2492. doi: 10.1029/2018WR024206
Latif, M., Keenlyside, N., and Bader, J. (2007). Tropical sea surface temperature, vertical wind shear, and hurricane development. Geophys. Res. Lett. 34, L01710. doi: 10.1029/2006GL027969
Lehodey, P., Alheit, J., Barange, M., Baumgartner, T., Beaugrand, G., Drinkwater, K., et al. (2006). Climate variability, fish and fisheries. J. Clim. 19, 5009–5030. doi: 10.1175/JCLI3898.1
Lilly, G. R., Nakken, O., and Brattey, J. (2013). A review of the contributions of fisheries and climate variability to contrasting dynamics in two Arcto-boreal Atlantic cod (Gadus morhua) stocks: persistent high productivity in the Barents Sea and collapse on the Newfoundland and Labrador Shelf. Progr. Oceanogr. 114, 106–125. doi: 10.1016/j.pocean.2013.05.008
Liu, G., Eakin, C. M., Chen, M., Kumar, A., De La Cour, J. L., Heron, S. F., et al. (2019). Predicting coral bleaching heat stress to inform reef management: NOAA coral reef watch's four-month outlook. Frontiers Mar. Sci. 5, 57. doi: 10.3389/fmars.2018.00057
Lockwood, J. F., Dunstone, N., Hermanson, L., Scaife, A. A., Smith, D., Thornton, H. E., et al. (2021). “Skilful predictions of multi-year US hurricane insured losses by decadal prediction systems,” in EGU General Assembly Conference Abstracts EGU21–2719. doi: 10.5194/egusphere-egu21-2719
Luo, J.-J., Masson, S., Behera, S. K., and Yamagata, T. (2008). Extended ENSO predictions using a fully coupled ocean–atmosphere model, J. Clim. 21, 84–93. doi: 10.1175/2007JCLI1412.1
Maraun, D., Shepherd, T. G., Widmann, M., Zappa, G., Walton, D., Gutiérrez, J. M., et al. (2017). Towards process-informed bias correction of climate change simulations. Nat. Clim. Change 7, 764–773. doi: 10.1038/nclimate3418
Masson-Delmotte, V., Zhai, P., Pirani, A., Connors, S. L., Péan, C., Berger, S., et al. (2021). “IPCC, 2021: Climate Change 2021: The Physical Science Basis,” in Contribution of Working Group I to the Sixth Assessment Report of the Intergovernmental Panel on Climate Change (Cambridge, United Kingdom and New York, NY, USA: Cambridge University Press) In press.
Matei, D., Baehr, J., Jungclaus, J. H., Haak, H., Müller, W. A., and Marotzke, J. (2012). Multiyear prediction of monthly mean atlantic meridional overturning circulation at 26.5 N. Science 335, 76–79. doi: 10.1126/science.1210299
Mauritsen, T., Bader, J., Becker, T., Behrens, J., Bittner, M., Brokopf, R., et al. (2019). Developments in the MPI-M Earth System Model version 1.2 (MPI-ESM1.2) and its response to increasing CO2. J. Adv. Model. Earth Syst. 11, 998–1038. doi: 10.1029/2018MS001400
Maussion, F., Butenko, A., Champollion, N., Dusch, M., Eis, J., Fourteau, K., et al. (2019). The open global glacier model (OGGM) v1. 1. Geoscient. Model Develop. 12, 909–931. doi: 10.5194/gmd-12-909-2019
McKee, T. B., Doesken, N. J., and Kliest, J. (1993). “The relationship of drought frequency and duration to time scales,” in Proceedings of the 8th Conference of Applied Climatology (Boston: American Meteorological Society) 179–184.
Meehl, G. A., Richter, J. H., Teng, H., Capotondi, A., Cobb, K., Doblas-Reyes, F., et al. (2021). Initialized Earth System prediction from subseasonal to decadal timescales. Nat. Rev. Earth Environ. 2, 340–357. doi: 10.1038/s43017-021-00155-x
Merryfield, W. J., Baehr, J., Batt,é, L., Becker, E. J., Butler, A. H., Coelho, C. A., et al. (2020). Subseasonal to decadal prediction: filling the weather–climate gap. Bull. Am. Meteorol. Soc. 90, 767–770. doi: 10.1175/BAMS-D-19-0037.A
Merryfield, W. J., Lee, W. S., Boer, G. J., Kharin, V. V., Scinocca, J. F., Flato, G. M., et al. (2013). The Canadian seasonal to interannual prediction system. Part I: Models and initialization. Mon. Wea. Rev. 141, 2910–2945. doi: 10.1175/MWR-D-12-00216.1
Miesner, A. K., Brune, S., Pieper, P., Koul, V., Baehr, J., and Schrum, C. (2022). Exploring the potential of forecasting fish distributions in the North East Atlantic with a dynamic earth system model, exemplified by the suitable spawning habitats of the blue whiting. Front. Mar. Sci. 8, 777427. doi: 10.3389/fmars.2021.777427
Müller, G., Godina, R., and Gattermayer, W. (2009). Der Pegel Vent/Rofenache – Herausforderungen für eine hydrographische Messstelle in einem vergletscherten Einzugsgebiet. Mitt. Hydr. Dienst Österr. 86, 131–135.
Mullowney, D. R., Rose, G. A., Dawe, E. G., Rowe, S., Maillet, G. L., and Pedersen, E. J. (2019). Temperature influences on growth of unfished juvenile Northern cod (Gadus morhua) during stock collapse. Fisher. Oceanogr. 28, 612–627. doi: 10.1111/fog.12447
Neumann, J. E., Willwerth, J., Martinich, J., McFarland, J., Sarofim, M. C., Yohe, G., et al. (2020). Climate damage functions for estimating economic impacts of climate change in the United States. Rev. Environ. Econ. Policy 14, 25–43. doi: 10.1093/reep/rez021
OIV (2020). Current situation of the vitivinicultural sector at a global level. International Organization of Vine and Wine, Paris. Available online at: https://www.oiv.int/en/oiv-life/current-situation-of-the-vitivinicultural-sector-at-a-global-level (accessed March 29, 2022).
O'Kane, T. J., Sandery, P. A., Kitsios, V., Sakov, P., Chamberlain, M. A., Collier, M. A., et al. (2021a). CAFE60v1: A 60-year large ensemble climate reanalysis. Part I: System design, model configuration and data assimilation. J. Clim. 34, 5153–5169. doi: 10.1175/JCLI-D-20-0974.1
O'Kane, T. J., Sandery, P. A., Kitsios, V., Sakov, P., Chamberlain, M. A., Squire, D. T., et al. (2021b). CAFE60v1: A 60-year large ensemble climate reanalysis. Part II: Evaluation, J. Clim. 34, 5171–5194.
O'Kane, T. J., Sandery, P. A., Monselesan, D. P., Sakov, P., Chamberlain, M., Matear, R., et al. (2019). Coupled data assimilation and ensemble initialisation with application to multi-year enso prediction. J. Climate 32, 997–1024. doi: 10.1175/JCLI-D-18-0189.1
O'Kane, T. J., Squire, D., Sandery, P., Kitsios, V., Matear, R., Moore, T., et al. (2020). Enhanced enso prediction via augmentation of multi-model ensembles with initial thermocline perturbations. J. Climate 33, 2281–2293. doi: 10.1175/JCLI-D-19-0444.1
Park, J., Stock, C. A., Dunne, J. P., Yang, X., and Rosati, A. (2019). Seasonal to multiannual marine ecosystem prediction with a global Earth system model. Science 365, 284–288. doi: 10.1126/science.aav6634
Pasternack, A., Bhend, J., Liniger, M. A., Rust, H. W., Müller, W. A., and Ulbrich, U. (2017). Parametric Decadal Climate Forecast Recalibration (DeFoReSt 1.0). Geosci. Model Dev. 11, 351–368. doi: 10.5194/gmd-11-351-2018
Paxian, A., Reinhardt, K., Pankatz, K., Pasternack, A., Lorza-Villegas, M. P., Scheibel, M., et al. (2022). High-resolution decadal drought predictions for German water boards: a case study for the Wupper catchment. Front. Clim. 4, 867814. doi: 10.3389/fclim.2022.867814
Paxian, A., Ziese, M., Kreienkamp, F., Pankatz, K., Brand, S., Pasternack, A., et al. (2019). User-oriented global predictions of the GPCC drought index for the next decade. Meteorol. Zeitschrift 28, 3–21. doi: 10.1127/metz/2018/0912
Payne, M. R., Danabasoglu, G., Keenlyside, N., Matei, D., Miesner, A. K., Yang, S., et al. (2022). Skilful decadal-scale prediction of fish habitat and distribution shifts. Nat. Commun. 13, 2660. doi: 10.1038/s41467-022-30280-0
Payne, M. R., Hobday, A. J., MacKenzie, B. R., Tommasi, D., Dempsey, D. P., Fässler, S. M., et al. (2017). Lessons from the first generation of marine ecological forecasts. Front. Marine Sci. 4, 289. doi: 10.3389/fmars.2017.00289
Pfeffer, W. T., Arendt, A. A., Bliss, A., Bolch, T., Cogley, J. G., Gardner, A. S., et al. (2014). and Randolph Consortium. The Randolph Glacier Inventory: a globally complete inventory of glaciers. J. Glaciol. 60, 537–552. doi: 10.3189/2014JoG13J176
Pörtner, H.-O., Roberts, D. C., Tignor, M., Poloczanska, E. S., Mintenbeck, K., et al. (2022). “IPCC, 2022: Climate Change 2022: Impacts, Adaptation, and Vulnerability,” in Contribution of Working Group II to the Sixth Assessment Report of the Intergovernmental Panel on Climate Change (Cambridge, UK and New York, NY, USA: Cambridge University Press) 3056.
Power, S., Lengaigne, M., Capotondi, A., Khodri, M., Vialard, J., Jebri, B., et al. (2021). A review of decadal climate variability in the tropical Pacific: characteristics, causes, predictability and prospects. Science 374, 1099. doi: 10.1126/science.aay9165
Raper, S. C., and Braithwaite, R. J. (2009). Glacier volume response time and its links to climate and topography based on a conceptual model of glacier hypsometry. The Cryosphere 3, 183–194. doi: 10.5194/tc-3-183-2009
Rasmusson, E. M., and Carpenter, T. H. (1982). Variations in Tropical See Surface Temperature and Surface Wind Fields Associated with the Southern Oscillation/El Niño. Monthly Weather Rev. 110, 354–384. doi: 10.1175/1520-0493(1982)110<0354:VITSST>2.0.CO;2
Rauthe, M., Steiner, H., Riediger, U., Mazurkiewicz, A., and Gratzki, A. A. (2013). Central European precipitation climatology – Part I: Generation and validation of a high-resolution gridded daily dataset (HYRAS). Met. Z. 22, 235–256. doi: 10.1127/0941-2948/2013/0436
Robson, J., Polo, I., Hodson, D. L., Stevens, D. P., and Shaffrey, L. C. (2018). Decadal prediction of the North Atlantic subpolar gyre in the HiGEM high-resolution climate model. Clim. Dyn. 50, 921–937. doi: 10.1007/s00382-017-3649-2
Rose, G. A., and Rowe, S. (2015). Northern cod comeback. Can. J. Fish. Aquat. Sci. 72, 1789–1798. doi: 10.1139/cjfas-2015-0346
Rose, G. A., and Walters, C. J. (2019). The state of Canada's iconic Northern cod: a second opinion. Fish. Res. 219, 105314. doi: 10.1016/j.fishres.2019.105314
Salinger, J., Hobday, A. J., Matear, R. J., O'Kane, T. J., Risbey, J. S., Dunstan, P. K., et al. (2016). Decadal-scale forecasting of climate drivers for marine applications. Adv. Marine Biol. 74, 1–68. doi: 10.1016/bs.amb.2016.04.002
Santos, J. A., Ceglar, A., Toreti, A., and Prodhomme, C. (2020). Performance of seasonal forecasts of Douro and Port wine production. Agric. Forest Meteorol. 291, 108095. doi: 10.1016/j.agrformet.2020.108095
Saunders, M. A., and Lea, A. S. (2008). Large contribution of sea surface warming to recent increase in Atlantic hurricane activity. Nature 451, 557–561. doi: 10.1038/nature06422
Schwarz, G. E. (1978). Estimating the dimension of a model. Ann. Stat. 6, 461–464. doi: 10.1214/aos/1176344136
Séférian, R., Bopp, L., Gehlen, M., Swingedouw, D., Mignot, J., Guilyardi, E., et al. (2014). Multiyear predictability of tropical marine productivity. Proc. Natl. Acad. Sci. U. S. A. 111, 11646–11651. doi: 10.1073/pnas.1315855111
Sgubin, G., Swingedouw, D., García de Cortázar-Atauri, I., Ollat, N., and van Leeuwen, C. (2019). The impact of possible decadal-scale cold waves on viticulture over europe in a context of global warming. Agronomy. 9, 397. doi: 10.3390/agronomy9070397
Skern-Mauritzen, M., Ottersen, G., Handegard, N. O., Huse, G., Dingsør, G. E., Stenseth, N. C., et al. (2016). Ecosystem processes are rarely included in tactical fisheries management. Metroeconomica 67, 165–175. doi: 10.1111/faf.12111
Smith, D. M., Cusack, S., Colman, A. W., Folland, C. K., Harris, G. R., and Murphy, J. M. (2007). Improved surface temperature prediction for the coming decade from a global climate model. Science 317, 796–799. doi: 10.1126/science.1139540
Smith, D. M., Eade, R., Dunstone, N. J., Fereday, D., Murphy, J. M., Pohlmann, H., et al. (2010). Skilful climate model predictions of multi-year north Atlantic hurricane frequency. Nat. Geosci. 3, 846–849. doi: 10.1038/ngeo1004
Smith, D. M., Eade, R., Scaife, A. A., Caron, L. P., Danabasoglu, G., DelSole, T. M., et al. (2019). Robust skill of decadal climate predictions. NPJ Clim. Atmos. Sci. 2, 13. doi: 10.1038/s41612-019-0071-y
Smith, D. M., Scaife, A. A., Boer, G. J., Caian, M., Doblas-Reyes, F. J., Guemas, V., et al. (2013). Real-time multi-model decadal climate predictions. Clim. Dyn. 41, 2875–2888. doi: 10.1007/s00382-012-1600-0
Smith, D. M., Scaife, A. A., Eade, R., Athanasiadis, P., Bellucci, A., Bethke, I., et al. (2020). North Atlantic climate far more predictable than models imply. Nature 583, 796–800. doi: 10.1038/s41586-020-2525-0
Smith, D. M., Scaife, A. A., Hawkins, E., Bilbao, R., Boer, G. J., Caian, M., et al. (2018). Predicted chance that global warming will temporarily exceed 15°C. Geophys. Res. Lett. 45, 11895–11903. doi: 10.1029/2018GL079362
Soares, M. B., Daly, M., and Dessai, S. (2018). Assessing the value of seasonal climate forecasts for decision-making. Wiley Interdisc. Rev. Clim. Change 9, 1–19. doi: 10.1002/wcc.523
Soares, M. B., and Dessai, S. (2014). On the use of seasonal to decadal climate predictions for decision-making in Europe. SRI PAPERS (Online) ISSN 1753-1330, Available online at: http://www.see.leeds.ac.uk/fileadmin/Documents/research/sri/workingpapers/SRIPs-62.pdf
Solaraju-Murali, B., Caron, L. P., Gonzalez-Reviriego, N., and Doblas-Reyes, F. J. (2019). Multi-year prediction of European summer drought conditions for the agricultural sector. Environ. Res. Lett. 14, 124014. doi: 10.1088/1748-9326/ab5043
Solaraju-Murali, B., Gonzalez-Reviriego, N., Caron, L. P., Ceglar, A., Toreti, A., Zampieri, M., et al. (2021). Multi-annual prediction of drought and heat stress to support decision making in the wheat sector. NPJ Clim. Atmos. Sci. 4, 34. doi: 10.1038/s41612-021-00189-4
Spillman, C. (2011). Operational real-time seasonal forecasts for coral reef management. J. Oper. Oceanogr. 4, 13–22. doi: 10.1080/1755876X.2011.11020119
Spillman, C. M., and Hobday, A. J. (2014). Dynamical seasonal forecasts aid salmon farm management in an ocean warming hotspot. Clim. Risk Manag. 1, 25–38. doi: 10.1016/j.crm.2013.12.001
Spillman, C. M., and Smith, G. A. (2021). A new operational seasonal thermal stress prediction tool for coral reefs around Australia. Front. Marine Sci. 8, 687833. doi: 10.3389/fmars.2021.687833
Stock, C. A., Pegion, K., Vecchi, G. A., Alexander, M. A., Tommasi, D., Bond, N. A., et al. (2015). Seasonal sea surface temperature anomaly prediction for coastal ecosystems. Prog. Oceanogr. 137, 219–236. doi: 10.1016/j.pocean.2015.06.007
Stoll, E., Hanzer, F., Oesterle, F., Nemec, J., Schöber, J., Huttenlau, M., et al. (2020). What can we learn from comparing glacio-hydrological models? Atmosphere 11, 981. doi: 10.3390/atmos11090981
Strasser, U., Marke, T., Braun, L., Escher-Vetter, H., Juen, I., Kuhn, M., et al. (2018). The Rofental: a high Alpine research basin (1890–3770 m asl) in the Ötztal Alps (Austria) with over 150 years of hydrometeorological and glaciological observations. Earth Syst. Sci. Data 10, 151–171. doi: 10.5194/essd-10-151-2018
TCFD (2017). Final Report: Recommendations of the Task Force on Climate-related Financial Disclosures. Available online at: https://www.fsb-tcfd.org/recommendations/ (accessed December 16, 2021).
Tommasi, D., Stock, C., Hobday, A. J., Methot, R., Kaplan, I., Eveson, P., et al. (2017a). Managing living marine resources in a dynamic environment: the role of seasonal to decadal climate forecasts. Prog. Oceanogr. 152, 15–49. doi: 10.1016/j.pocean.2016.12.011
Tommasi, D., Stock, C. A., Alexander, M. A., Yang, X., Rosati, A., and Vecchi, G. A. (2017b). Multi-annual climate predictions for fisheries: an assessment of skill of sea surface temperature forecasts for large marine ecosystems. Front. Mar. Sci. 4, 1–13. doi: 10.3389/fmars.2017.00201
Tommasi, D., Stock, C. A., Pegion, K., Vecchi, G. A., Methot, R. D., Alexander, M. A., et al. (2017c). Improved management of small pelagic fisheries through seasonal climate prediction. Ecol. Appl. 27, 378–388. doi: 10.1002/eap.1458
Toreti, A., Cronie, O., and Zampieri, M. (2019). Concurrent climate extremes in the key wheat producing regions of the world. Scient. Rep. 9, 1–8. doi: 10.1038/s41598-019-41932-5
Ubilava, D., and Holt, M. (2009). “Nonlinearities in the world vegetable oil price system: El Niño effects,” in Annual Meeting (Milwaukee, WI: Agricultural and Applied Economics Association) 1–27.
Van der Laan, L., Foerster, K., Scaife, A., Vlug, A., and Maussion, F. (2022). “Assessing skill and use of CMIP6 decadal re-forecasts in global glacier mass balance modelling,” in EGU General Assembly Conference Abstracts EGU22–11942. doi: 10.5194/egusphere-egu22-11942
Van Nieuwkoop, M. (2019). Do the costs of the global food system outweigh its monetary value? World Bank Blogs, Washington, DC. Available online at: https://blogs.worldbank.org/voices/do-costs-global-food-system-outweigh-its-monetary-value (accessed March 29, 2022).
Vecchi, G. A., Zhao, M., Wang, H., Villarini, G., Rosati, A., Kumar, A., et al. (2011). Statistical–dynamical predictions of seasonal north atlantic hurricane activity. Monthly Weather Rev. 139, 1070–1082. doi: 10.1175/2010MWR3499.1
Vigo, I., Marcos, R., Graça, A., Terrado, M., González-Reviriego, N., Christel, I., et al. (2021). “Understanding climate and non-climate decision triggers to minimize Spring rainfall risks in vineyards,” in EMS Annual Meeting 2021, EMS2021–489. doi: 10.5194/ems2021-489
Volpi, D., Meccia, V. L., Guemas, V., Ortega, P., Bilbao, R., Doblas-Reyes, F. J., et al. (2021). A novel initialization technique for decadal climate predictions. Front. Clim. 3, 681127. doi: 10.3389/fclim.2021.681127
Webb, L. B., Whetton, P. H., and Barlow, E. W. R. (2011). Observed trends in winegrape maturity in Australia. Global Change Biol. 17, 2707–2719. doi: 10.1111/j.1365-2486.2011.02434.x
Weber, M., Braun, L., Mauser, W., and Prasch, M. (2010). Contribution of rain, snow-and icemelt in the Upper Danube discharge today and in the future. Geogr. Fis. Dinam. Quat. 33, 221–230.
Wei, M., Li, Q., Xin, X., Zhou, W., Han, Z., Luo, Y., et al. (2009). Decadal prediction: can it be skillful? Bull. Am. Meteorol. Soc. 90, 1467–1485. doi: 10.1175/2009BAMS2778.1
World Glacier Monitoring Service (WGMS) (2021). Available online at: https://wgms.ch/products_ref_glaciers/hintereisferner-alps/
Wouters, B., Hazeleger, W., Drijfhout, S., and van Oldenborgh, G. J. J. (2013). Multiyear predictability of the North Atlantic subpolar gyre. Geophys. Res. Lett. 40, 3080–3084. doi: 10.1002/grl.50585
Yeager, S. G., Danabasoglu, G., Rosenbloom, N. A., Strand, W., Bates, S. C., Meehl, G. A., et al. (2018). Predicting near-term changes in the Earth System: A large ensemble of initialized decadal prediction simulations using the Community Earth System Model. Bull. Am. Meteorol. Soc. 99, 1867–1886. doi: 10.1175/BAMS-D-17-0098.1
Yeager, S. G., Karspeck, A., Danabasoglu, G., Tribbia, J., and Teng, H. (2012). A decadal prediction case study: late twentieth-century north atlantic ocean heat content. J. Clim. 25, 5173–5189. doi: 10.1175/JCLI-D-11-00595.1
Yeager, S. G., and Robson, J. I. (2017). Recent progress in understanding and predicting Atlantic decadal climate variability. Curr. Clim. Change Rep. 3, 112–127. doi: 10.1007/s40641-017-0064-z
Keywords: decadal predictions, climate risk, climate forecast application, climate forecast information, operational climate prediction
Citation: O'Kane TJ, Scaife AA, Kushnir Y, Brookshaw A, Buontempo C, Carlin D, Connell RK, Doblas-Reyes F, Dunstone N, Förster K, Graça A, Hobday AJ, Kitsios V, van der Laan L, Lockwood J, Merryfield WJ, Paxian A, Payne MR, Reader MC, Saville GR, Smith D, Solaraju-Murali B, Caltabiano N, Carman J, Hawkins E, Keenlyside N, Kumar A, Matei D, Pohlmann H, Power S, Raphael M, Sparrow M and Wu B (2023) Recent applications and potential of near-term (interannual to decadal) climate predictions. Front. Clim. 5:1121626. doi: 10.3389/fclim.2023.1121626
Received: 12 December 2022; Accepted: 15 May 2023;
Published: 22 June 2023.
Edited by:
Julie Arblaster, Monash University, AustraliaReviewed by:
Jong-Seong Kug, Pohang University of Science and Technology, Republic of KoreaYong-Yub Kim, Institute for Basic Science Center for Climate Physics (ICCP), Republic of Korea
Gerald Meehl, National Center for Atmospheric Research (UCAR), United States
Copyright © 2023 O'Kane, Scaife, Kushnir, Brookshaw, Buontempo, Carlin, Connell, Doblas-Reyes, Dunstone, Förster, Graça, Hobday, Kitsios, van der Laan, Lockwood, Merryfield, Paxian, Payne, Reader, Saville, Smith, Solaraju-Murali, Caltabiano, Carman, Hawkins, Keenlyside, Kumar, Matei, Pohlmann, Power, Raphael, Sparrow and Wu. This is an open-access article distributed under the terms of the Creative Commons Attribution License (CC BY). The use, distribution or reproduction in other forums is permitted, provided the original author(s) and the copyright owner(s) are credited and that the original publication in this journal is cited, in accordance with accepted academic practice. No use, distribution or reproduction is permitted which does not comply with these terms.
*Correspondence: Terence J. O'Kane, dGVyZW5jZS5va2FuZUBjc2lyby5hdQ==
†These authors share first authorship
‡These authors share senior authorship