 Adrian Felipe dos Santos1*
 Flávio Rafael Trindade Moura1
 Marcos César da Rocha Seruffo1
 Waldeir Pereira dos Santos2
 Gabriel Brito Costa2
 Fernando Augusto Ribeiro Costa3
- 1Laboratório de Pesquisa Operacional, Universidade Federal do Pará, Instituto de Tecnologia (ITEC), Belém, Pará, Brazil
- 2Instituto de Biodiversidade e Florestas, Universidade Federal do Oeste do Pará, Santarém, Pará, Brazil
- 3Núcleo de Altos Estudos Amazônicos, Universidade Federal do Pará, Belém, Pará, Brazil
The meteorological imbalances in Brazil have a strong impact on the lives of the population across the country, especially in the Amazon region. These impacts extend to meteorological phenomena, such as extreme rainfall, droughts, and an increase in temperature in several regions, as well as impacts on health, the economy, and, as the object of this study, the quality of life. This study presents the impact of meteorological changes on the quality of life in the Amazon region, based on (i) the thermal discomfort index (TDI), (ii) the temperature and humidity index (THI), and (iii) the effective temperature index as a function of the wind (TEFW). For this, meteorological data from the years 2003–2021 were used, in which the variables include total precipitation, global radiation, air-dry bulb temperature, the maximum temperature in the previous hour, the minimum temperature in the previous hour, relative humidity, and wind speed. This analysis indicates that for this tropical region, the sensation of mild discomfort was predominant in about 70% of the measurements, indicating a certain level of impact on the population's quality of life, in addition to the fluctuation of levels of discomfort during periods of winter in that there are high rates of precipitation. The data control was performed with the removal of null data and calculation of monthly and annual averages, by using the compression (average) empty data frames in order to receive the values without losing the indexing of dates. At first, it was considered to use the kriging process to fill in the missing data; however, due to the existence of microclimates in the regions, the data could characterize remote regions in a generalized way, which would make it difficult to understand these data in comparison with the data from the National Institute of Meteorology (INMET, in Portuguese).
1. Introduction
The climate influences the daily actions of humans, just as humans also play an important role in climate dynamics through their activities. The relationship between anthropogenic actions and climate on a global scale is still the subject of much discussion among many scientists; however, it seems to be unanimous that humans can alter the climate on a local scale by changing, for example, the soil surface. The Amazon has essential ecosystem services that contribute to human wellbeing across the planet, such as climate regulation and the maintenance of carbon stocks by forests (Edwards et al., 2019).
High demand from the international market for Brazilian agriculture and livestock products has led to an increase in this sector, which is commonly accompanied by the expansion of the agricultural frontier and the simultaneous clearing of forest along with burning for pasture clearing in areas of the Cerrado and the Brazilian Amazon (Morton et al., 2006, 2016; Nepstad et al., 2014; Silveira et al., 2022).
The Amazon region is seen as being at great risk due to climate variability and change. The risk is not only due to projected climate change but also through synergistic interactions with other threats, such as deforestation, forest fragmentation, and detected fires (Marengo et al., 2018).
These land cover changes, as well as urban development and forest devastation, have their percentage of importance in microclimatic changes in the Amazon due to the reduction of green areas, changing vegetation land cover, and heat produced by numerous human activities in the urban environment (Silva et al., 2018; Marçal et al., 2019; de Souza e Silva et al., 2022). The risk of forest fires in the northern region of Brazil is high during certain periods of the year; based on the seasonality of climatic aspects, factors such as low precipitation and dry periods can influence the incidence of fires (Lima et al., 2021).
Nóbrega and Lemos (2011), da Costa1 João et al. (2013), Silva Júnior et al. (2013), and Coutinho et al. (2014) highlighted the “microclimatic” variations as the main consequence of urbanization and classified the thermal sensation in tropical cities, from comfort indices through meteorological variables such as temperature and relative humidity.
In regions with a predominance of high temperatures most of the year, shading can be favorable, making the place more comfortable and providing the feeling of lower temperatures (Souza and Nery, 2012). Therefore, among the most important climatic information for the characterization of the environment, it can be highlighted that the synergism between temperature, relative humidity, and wind speed can impact both negatively and positively on thermal comfort (Da Silva et al., 2013).
Earth and climate interact in complex ways through changes in the frequency of events in multiple biophysical and biogeochemical processes at different spatial and temporal scales. The constant changes in land handling and land use within the Amazon alter noticeable aspects in the quality of life of the region's population with regard to the Fundamentals of Wellbeing by addressing the sustainability of ecosystems and the health and wellbeing of the population. The climate and its changes impact the daily life of humans since changes resulting from anthropic actions can influence the climate change of a local region, accelerating climate change. The misfit in variables that define the climate such as precipitation and temperature negatively impacts the comfort and convenience conditions of a society affecting aspects of health and nutrition.
Therefore, knowing the classification of biometeorological indices for humans is paramount because thermal sensation is strongly correlated with respiratory and cardiovascular problems. It is worth highlighting that the human being is homeothermic and has a body temperature between 36 and 37°C. Climatic conditions that contribute to values below this temperature also contribute to hypothermia, and control mechanisms are triggered, such as vasoconstriction, shivering, chills, and increased metabolic rate, in an attempt to raise body temperature and in the reverse process, when it influences values above 37°C, both sweating and vasodilation are triggered (Sette and Ribeiro, 2011).
The importance of knowing the classification of bioclimatic indices is, among other factors, to assist with preventive measures to minimize the influence of climatic conditions on human health. Thus, studies of this nature, such as the one proposed in this work, are of fundamental importance.
According to the Institute of Man and Environment of the Amazon (IMAZON, 2022), the total deforested area reached about 4,915 km2 within federal territories, i.e., areas set aside for environmental reserve and protection by the Union, and in the year 2021, the accumulated devastation from January to December reached the worst level in a decade reaching the value of 10,362 km2, equivalent to almost half the territorial area of the state of Sergipe.
According to BBC Brazil (Rossi, 2017), a large part of the deaths from land conflicts converge in the deforested areas of the Amazon rainforest. In large part, areas of the Amazon region are devastated by the acquisition of land for the expansion of the agricultural frontier and agribusiness, in addition to the practice of illegal logging in the region and the creation of illegal mines. These practices make environmental preservation arduous due to the difficult access to the region and insufficient contingent for inspection due to the vast territorial area, resulting in numerous conflicts between indigenous peoples from the region, miners, and loggers.
Thermal comfort is the term used to describe a satisfactory, stress-free thermal environment in buildings and, therefore, is a socially determined notion defined by norms and expectations (Nicol and Roaf, 2017). The Amazon has a hot and humid climate, situated in a mostly tropical area, the region has a high temperature, and this variable is an important factor for the development of daily activities. Mazzone (2020) evaluated fuel poverty in tropical environments highlighting that the increase in ambient cooling is an important factor for the execution of daily and work activities in tropical regions because the excessive heat and the lack of electricity in remote regions make the daily lives of the residents of these regions difficult. Heat storage and the consequent elevation of core body temperature to critical levels lead to the incidence of thermal diseases, especially heat exhaustion and Exercise Heat Stroke (EHS), two forms of heat stroke that affect both athletes and workers exposed to heat stress situations (Gambrell, 2002).
According to part 2 of the 6th report from The Working Group II of the Intergovernmental Panel on Climate Change (IPCC), created by the United Nations (UN) in 1998, climate change in the Amazon predicts a reduction in rainfall and an increase in heat waves and extreme droughts, due to the impact of human and natural actions such as deforestation and fires (IPCC, 2022).
Humans and the climate often interact in natural ways, such as the human body's process of seeking thermal equilibrium which expends energy and is a way of adapting to the environment, or in preset ways, such as the interference of water cycles to regulate rainfall in dry regions with low rainfall.
Because humans interact with the climate in several ways, the aspects related to thermal comfort are essential to establish metrics to measure how human activities under the intervention of climate and environmental changes are affected and how this impacts the wellbeing of the population.
Considering that the psychological and physiological aspects are different for each person due to the way and environment they live, their height, weight, and age, meteorological variables are essential for the calculation of thermal comfort indexes because they quantify the climatic factors, such as precipitation, relative humidity, and temperature, that act directly on the environment.
Understanding the relationship between land use changes and their impacts on the climate is essential to establish sustainable public policies with a social purpose based on the measurement of thermal comfort indexes and quality of life (de Aguiar, 2003). It can estimate which regions have undergone more drastic changes and generate prediction models for possible climate changes, such as rainfall frequencies, floods, and drought cycles, in order to provide a better direction for resources and investments, which is the central focus of this research. In this way, this work presents an analysis of thermal comfort in the Amazon region based on a time series that ranges between the years 2003 and 2021 of the thermal comfort indexes directed to cities where there are meteorological stations in the states of Pará and Tocantins.
Understanding the relationship between thermal comfort indexes and how aspects arising from temperature have their degree of importance in the daily functioning of society makes it possible to measure to what extent environmental impacts and climate change affect individual or collective performance in various fields and areas of study.
Thermal comfort indices show how uncomfortable the environment is for human beings and how the body responds in specific ways to thermally different environments, the wellbeing of the population, and productivity can suffer impacts that affect the quality of life in the region.
Evaluating thermal comfort indices and wellbeing demands a certain complexity, since, besides environmental aspects, there are physical and personal aspects that add a subjective character to the analysis of thermal comfort. Lamberts et al. (2011) described how the human body and its thermoregulation mechanisms act in different ways for hot and cold environments and obtained the relationship through the analysis of personal variables such as clothing and activity performed, along with meteorological variables such as air temperature and average radiant temperature.
On January 22, 1998, the World Health Organization (WHO) defined health as a dynamic state of complete physical, mental, spiritual, and social wellbeing and not merely the absence of disease or infirmity. Wellbeing is also related to the environment and thermal sensation. Studies on productivity and performance at work considering thermal comfort present results with a tendency to classify that discomfort provided by heat or cold impacts the productivity of intellectual, manual, and visual activities due to the activation of thermoregulatory mechanisms of the human body to establish thermal balance with the environment.
ACL da Costa1 João et al. (2013) conducted a study on the heat index to measure thermal discomfort and its seasonal variation in 4 cities of different sizes in the Brazilian Amazon. The data used were obtained indirectly through Campbell Scientific automatic weather stations equipped with a CR1000 data logger, and the collection stations were installed in intensely urbanized areas for a better representation of the urban environment. In this analysis, it was found that the heat index (CI) showed greater variation during the dry period due to the loss of strength of meteorological systems, such as the intertropical convergence zone, and a slight variation during the winter, where larger precipitation volumes occur, causing a reduction in air temperature in the region.
Fialho and de Alvarez (2017) conducted a study on the thermal comfort indices for the city of Vitória, the capital of the State of Espírito Santo, Brazil, and evaluated the thermal comfort in the urban perimeter using the Thermal Discomfort Index (TDI), Temperature and Humidity Index (THI), and Effective Temperature in Function of Wind (TEFW).
The authors carried out an analysis using comfort indexes applied to the urban context, data collection was done from the website of the National Institute of Meteorology (INMET, in Portuguese), and the results indicated that climatic factors can influence the thermal sensation beyond the finding of partial discomfort in summer and little incidence of discomfort during winter in Vitória. Furthermore, the TEFW index was the one that best suited the characteristics of the city, while TDI and THI presented many ranges of discomfort and extreme discomfort.
Bracarense et al. (2018) addressed the variations and limitations of the thermal comfort indices for a total of 11 indices, aiming to quantify the difference in the classification of the indices and choose indices that best suited the period and environment of analysis.
The indices adopted in this analysis were chosen in pairs for comparison, TDI and THI, with respect to air temperature and relative humidity, TEFW and the Equivalent Perceived Temperature (EPT), which use the same temperature and humidity data cited above only as a function of wind speed. The results found similar measurements between THI and TDI and a greater dispersion between TEFW and EPT, with the analysis done considering shade and vegetation, during a period of about 6 h with measurements every 5 min, at the end of the dry season and beginning of the rainy season.
The objective of this study was to analyze the feeling of thermal discomfort associated with climatic conditions of tropical regions and how this impacts the quality of life in this region, by using analysis factors such as TDI, THI, and TEFW, along with data on precipitation, fires, and urban infrastructure.
Thus, the analysis of possible climate changes in the study region was carried out by comparing the seasonal behavior of meteorological variables and thermal comfort indexes with urbanization and deforestation factors. The contribution of this work that differs from other studies is the analysis of the thermal comfort indices seasonally during the period of meteorological data collection from conventional automatic stations and comparing the result of the indices monthly over the years with precipitation data, fires, and urban infrastructure in order to quantify climate changes in these cities analyzed.
1.1. Comparative study
During the bibliographical survey to establish the metrics and indexes for this study, the indexes were chosen due to their applications for coastal cities, being easier to implement, and being most widely used in the literature. Most of the studies on this subject permeate daily or annual analyses for single cities, i.e., only one city is analyzed, given the complexity when addressing hourly data and the climatic behavior of a region.
One of the main problems faced lies in the disparity of regions where the existence of microclimates requires attention during the analysis and the high volume of data. Previously analyzed to cover the entire northern region of Brazil, during data collection, given the dispersion of stations across the northern region of the country, a better spatial distribution of meteorological stations was found in the territories of Pará and Tocantins, this area was thus selected for avoid generalizing data to geographically distant and dispersed regions.
By analyzing a seasonal time series, it was possible to detect slight changes in the climatic behavior, its alternation, and maximum and minimum measurements for several cities.
There is also the possibility of applying prediction models to help and improve this type of analysis, making it more robust and concrete, in addition to assisting in mapping changes in each city and can perform a data crossing comparing meteorological variables, i.e., comfort indices with deforestation and fires in the Amazon. Monteiro and Alucci (2010) verified the differences in laboratory analysis and field surveys by comparing the results based on predictive models, thus obtaining good correlation rates, i.e., calibration factors for the indices.
2. Methodology
The methodology applied in this work is based on the comparative method. Figure 1 shows the scope of the formulation of this research, from the definition of the problem to the results found. This method consists of the following 6 stages:
A. identification of the problem or event
B. bibliographic review of the theme
C. delimitation of the study area
D. data acquisition
E. data treatment
F. method application.
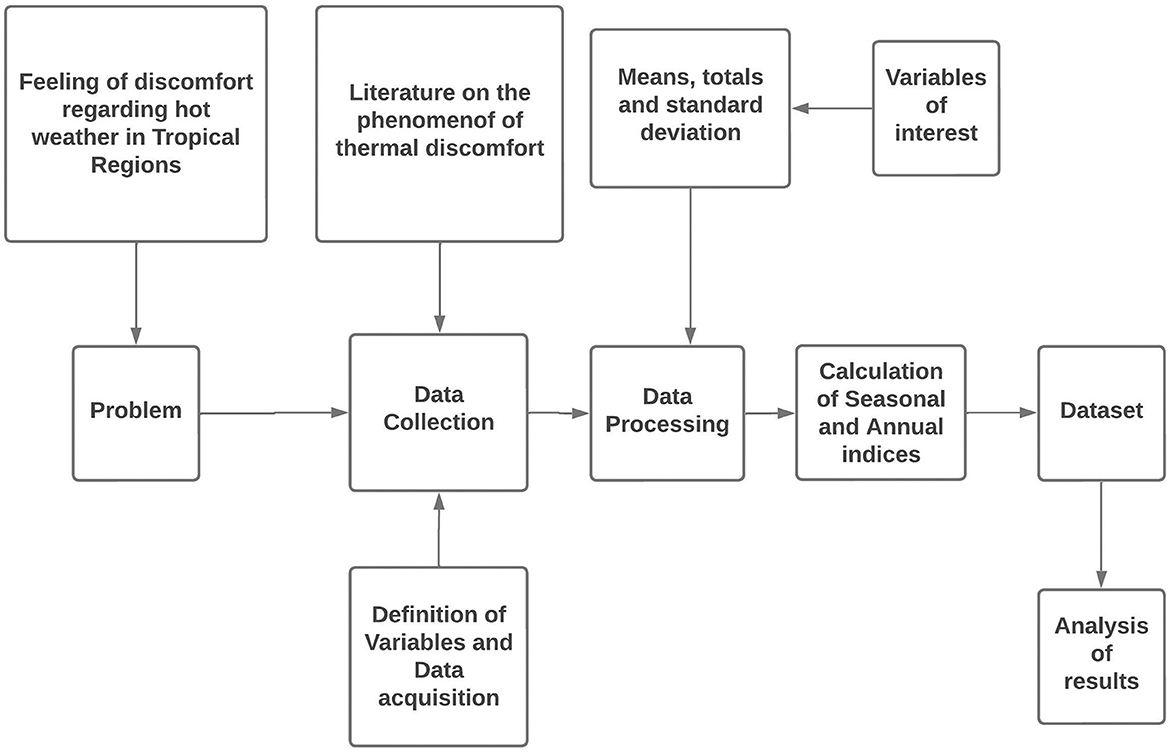
Figure 1. Logical model for structuring research.
2.1. Study area
The initial approach of this work was executed on the premise of thermal discomfort in the northern region of Brazil; subsequently, it was necessary to understand how meteorological factors impact the climate of a region and the quality of life of the population.
The geographical object of study comprises the expansion of research on thermal comfort indices from Western Pará to the territories of Brazil's Northern Region, specifically Pará and Tocantins represented in Figure 2. This is through ascertaining the TDI, THI, and TEFW by evaluating the behavior of climatic factors and the most recent urbanization process in the region from meteorological data regarding relative air humidity, air temperature (dry bulb), total precipitation, average radiant temperature, and wind speed.
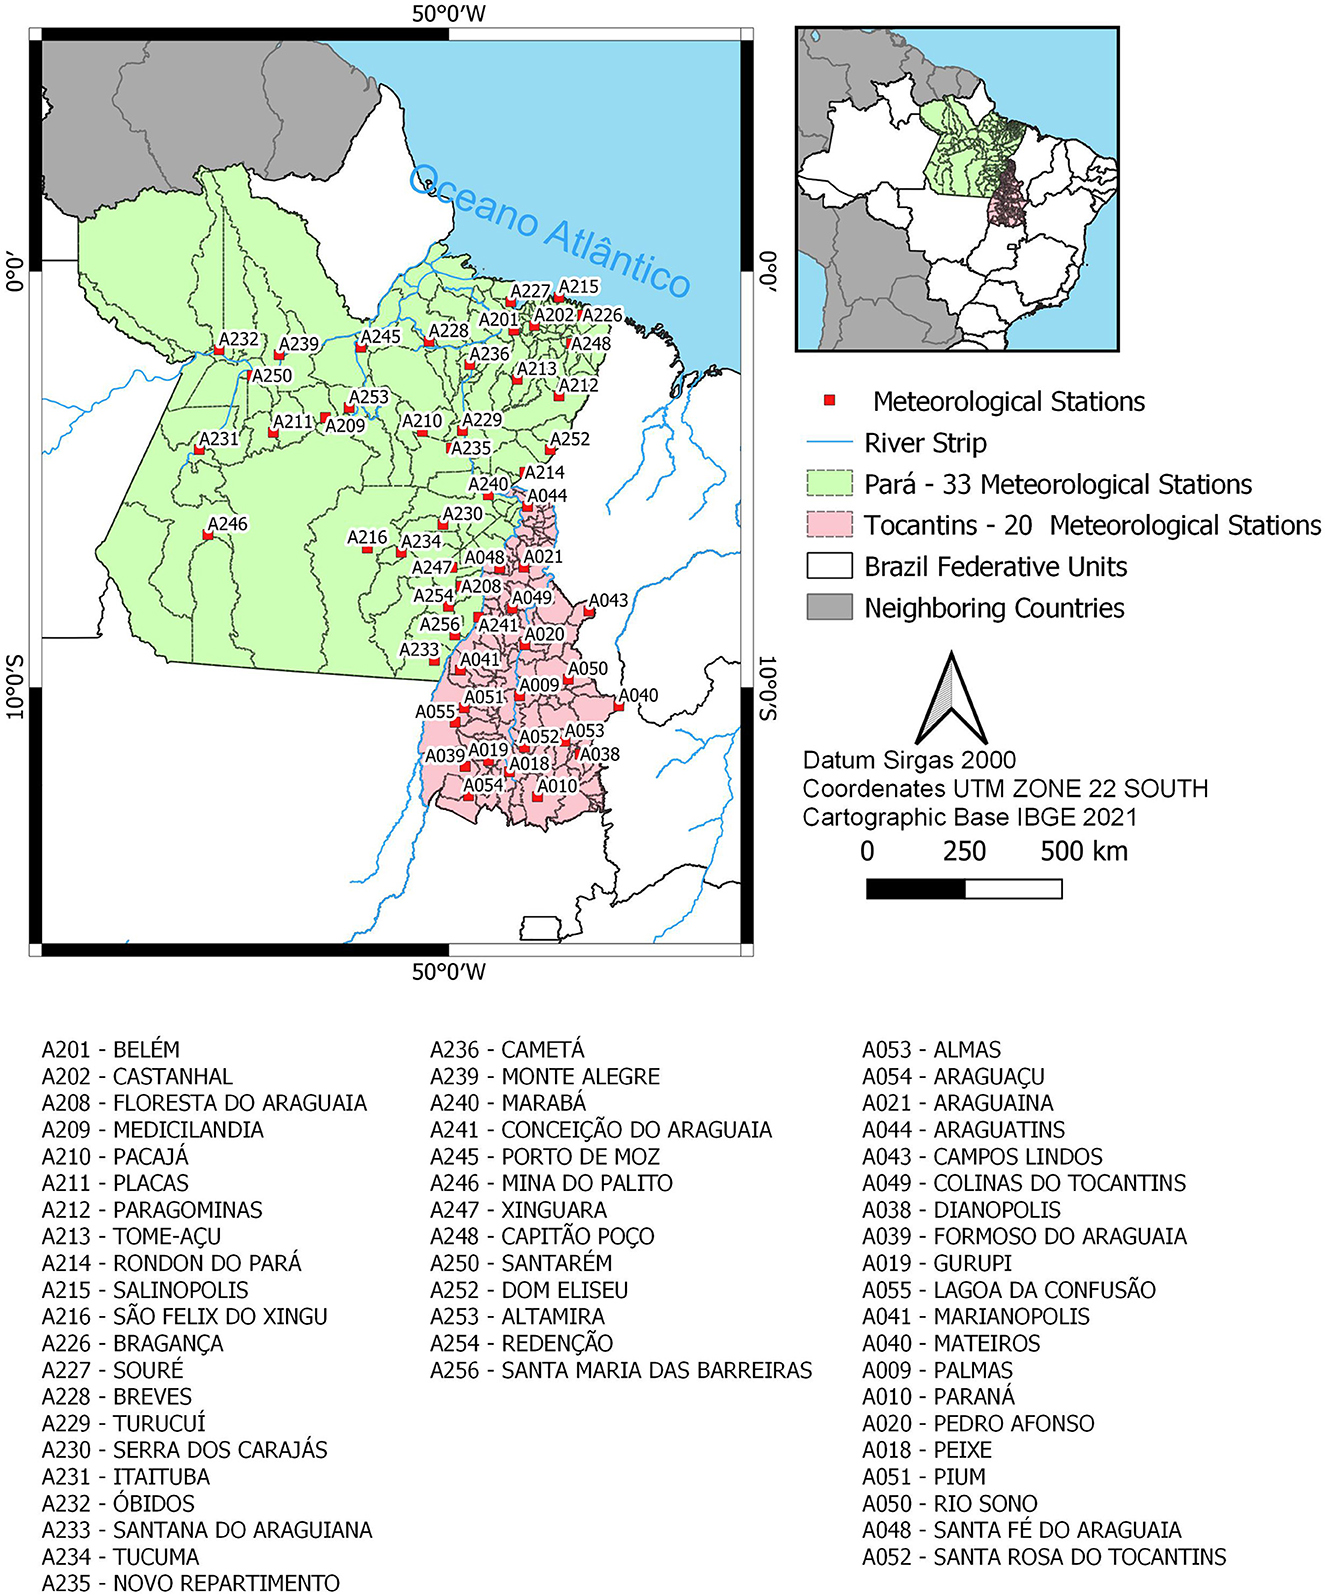
Figure 2. Location map of study site—Pará and Tocantins meteorological stations—Brazil.
Furthermore, these regions were selected for the study due to the better spatial distribution of their meteorological stations. The state of Pará, according to Instituto Brasileiro de Geografia e Estatística (IBGE, 2021a), has a population of 8,777.124 inhabitants, with a territorial area of 1,245,870.700 km2 distributed in 144 municipalities, located in a region with a predominantly tropical climate. The characteristic climate of the northern region of the state is the humid equatorial, given mainly by the fact that it is located near the northwest coast of Brazil, having high rates of temperature, precipitation, and humidity during the year, while the southernmost region of the state has the tropical climate defined by the alternation between dry and rainy seasons during the year.
Regarding the climatic factors of this region, the average annual compensated temperature oscillates between 26 and 27.6°C, the maximum annual temperature is between 31.2 and 33.8°C, and the minimum temperature is between 21.9 and 24.8°C (INMET, 2022). The state of Pará has 34 automatic weather stations, of which 20 are operational, 13 are in a state of breakdown, and 1 is deactivated; thus, this work used the data from these stations to create the database (INMET, 2022).
The state of Tocantins, the second region selected for this study, has a population of 1,607,363 inhabitants, with a territorial area of 277,423.627 km2 distributed in 134 municipalities, located in a region with a predominantly tropical climate (IBGE, 2021b), with two well-defined seasons, a dry and a rainy one. As for the climatic factors of the Tocantins region, the average annual compensated temperature ranges between 25.4 and 27°C, the maximum annual temperature between 32.4 and 33.8°C, and the minimum temperature between 20.4 and 22°C (INMET, 2022). There are 20 automatic weather stations in the state, 4 of which are in a state of disrepair and 16 in an Operating state (INMET, 2022).
2.1.1. Climatic aspects of the study area
The climate classification aims to identify, in a large area or region, zones with relatively homogeneous climatic and biogeographical characteristics providing valuable indications about the ecological conditions, agricultural potential, and the environment of the region (Junior et al., 2012).
The Köppen-Geiger classification (Köppen and Geiger, 1928) uses seasonal data of temperature and precipitation, commonly using the averages of these values, for the analysis of long periods of time. The classification is given by a code that characterizes the region according to the predominant climate: the first letter defines the climatic type, the second the type of seasonal precipitation, and the third the temperature or heat index.
According to Barros et al. (2012), the Köppen-Geiger classification is the most widely used system in geography, climatology, and ecology. However, the Köppen-Geiger classification in some cases does not distinguish climate types between regions with very distinct biomes (Köppen and Geiger, 1928). In this classification, the state of Pará, which has high relative humidity and large volumes of rainfall during the year, is classified mostly as tropical monsoon. It has three different climates, such as tropical monsoon, tropical savannah, and rainforest represented, respectively, by the acronyms Am, Aw, and Af. The state of Tocantins, which has a relative humidity in the range of 60% during the year, has two different climates, such as tropical monsoon and the predominant in Tocantins such as tropical savannah represented by the acronyms Am and Aw, respectively (Clima Pará, 2023; Clima Tocantins, 2023).
2.2. Data treatment
The data used for the development of this article were taken from the Meteorological Database (INMET, 2022), for the data series between the years 2000 and 2021, for the northern region, from automatic stations, with hourly data. However, when delimiting the study area with the best distribution of stations, part of the available stations was not yet operational in the year 2000, so the representations display data from the 2003 to 2021 series, taking into account the start of operation of the stations since the beginning of the analysis. The data come from 33 meteorological stations of Para and 20 of Tocantins. In addition, wildfire and urban infrastructure data taken from the data collections of Mapbiomas, were used to analyze the indices. The data used are from the Mapbiomas collection; for fires, the fires collection (Mapbiomas, 2022a) was used with the field areas level 1 (forest, non-forest natural formation, farming, non-vegetated area, and water); for urban areas, data from the collection 7 (Mapbiomas, 2022b) areas type level 2 (urban infrastructure) were used, filtering out any other layer that was not related to urban infrastructure. Supplementary Figure 11 present cartographic representations of the fire data for the states of Pará and Tocantins, while Supplementary Figure 12 present the urbanization data for these states.
For this, the variables of hourly total precipitation (mm), global radiation (kJ/m2), hourly air temperature—dry bulb (°C), maximum air temperature in the previous hour (°C), minimum air temperature in the previous hour (°C), hourly relative humidity (%), and hourly wind speed (m/s) were used.
The hourly total precipitation is the total precipitation (rainfall), which occurred in the last hour before each data delivery. At conventional stations, it is the measure of total precipitation (rain) that occurred within 24 h.
The hourly relative humidity is a measure determined indirectly from the psychrometer (equipment with a dry bulb thermometer and a wet bulb thermometer) and the use of tabular values. In automatic stations, it is the measurement of relative humidity, which takes place in the last hour before each data message.
Finally, the hourly wind speed is the wind speed measurement of the average of the last 10 min before each hour of sending the data message. At conventional stations, it is the wind speed measurement determined from the average of the last 10 min before the full hour (09:00, ..., 12:00 UTC) of each observation.
The data acquired in hourly format, measurements every hour of the day, in the interval of 24 h, were treated through a script executed in Google Colaboratory in Python with the Pandas library used for manipulation of Data Frames and execution of the calculation of averages, daily, monthly, and, finally, annual and the Csv library for manipulation of CSV files.
The files were separated based on the Brazilian states of the Northern Region of Brazil, including Amazonas, Acre, Amapá, Pará, Rondônia, Roraima, and Tocantins, and the data from the Stations were organized based on the Municipality of Origin, Station Code (INMET), and Year of Measurement; and the files used to calculate TDI, THI, and TEFW were selected based on the best regional distribution of meteorological stations to avoid generalization of very distant regions. Due to this, the data started in the year 2003, the first operational year of the meteorological station of Belém. To avoid indexing errors, empty data frames were used and the method of inserting the calculated columns kept the index according to the date. From the data of precipitation, relative humidity, solar radiation, air temperature, wind speed, and calculated indices such as TDI, THI, and TEFW, there were a total of 4,775 null data entries out of 53,920 data entries counting only numerical variables, which represents 8.855% of all data. Supplementary Figures 1, 2 present a yearly graphical representation of the data gaps for the states of Pará and Tocantins.
The indexes were calculated seasonally according to the initial date of operation of the station and annually taking into account the period of data. With the help of the Rstudio tool using the ggplot2 library, the graphs for the annual variables and seasonal indexes were plotted for the analysis. This tool was chosen because of the range of data science tools such as libraries for graphical representations and data manipulation.
2.3. Calculated indices
In this study, we used TDI, THI, and TEFW taking into account only environmental aspects as the object of analysis, since they consider the main measurements related to the climate of a given region. The choice of these indexes was motivated by the fact that the study area is characterized as a tropical climate, using data that influence the local temperature, besides being easier to implement and present in several studies in the area.
The indices use different combinations of variables to perform the calculations and measurements of thermal comfort. The TDI and THI are based on air temperature and relative humidity and are easier to evaluate and implement, while the TEFW is calculated based on the same variables using wind speed in m/s.
According to Lamberts et al. (2011), the metric of analysis on thermal comfort lies between three factors, namely, satisfaction, human performance, and energy conservation. Satisfaction assesses the wellbeing of the human being in feeling thermally comfortable, i.e., human performance. Although the results of numerous investigations are inconclusive in this regard, and despite this inconclusiveness, studies show a clear trend that discomfort caused by heat or cold reduces human performance.
Intellectual, manual, and perceptive activities generally present a better performance when performed in thermal comfort, and energy conservation analyzes how much the work environments have been modified by technological advances, i.e., a large part of human life related to work in an artificially conditioned environment. By knowing the conditions and parameters related to the thermal comfort of the occupants in their environments, waste with heating and cooling, often unnecessary, is avoided.
To calculate TDI, THI, and TEFW, we used the following equations adopted by Nóbrega and Lemos (2011) and França (2015):
where Ta is the air temperature (°C); RH is the relative humidity (%); and v is the wind speed (m/s).
The TDI, proposed by Thom (1959), was very versatile for the approach of studies in urban areas with tropical climate regions. It takes into account the surrounding atmospheric conditions to estimate the feeling of comfort of human beings in a given region. In addition, the proposed index detects discomfort from the range of 24°C. Table 1 presents the ranges and classification intervals for the TDI.
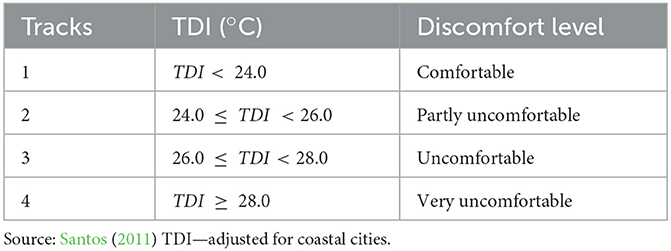
Table 1. Thermal comfort index, classification, and range used to measure thermal discomfort.
The THI is used for open environments to quantify the stress in the urban environment (Querino, 2017). This index is easy to implement and shares similarities with the TDI, having small variations between its results, considering the discomfort from the range above 24°C. Table 2 presents the ranges and classification intervals for the THI.
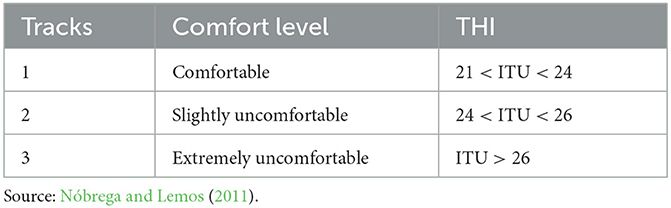
Table 2. Temperature and humidity index, range, and classification of thermal discomfort.
The TEFW determines the relationship between wind and temperature and relative humidity. It describes the feeling of discomfort in 11 tracks that relate the thermal sensation with physiological stress. Table 3 presents the index ranges, classification intervals, and degree of stress for TEFW.
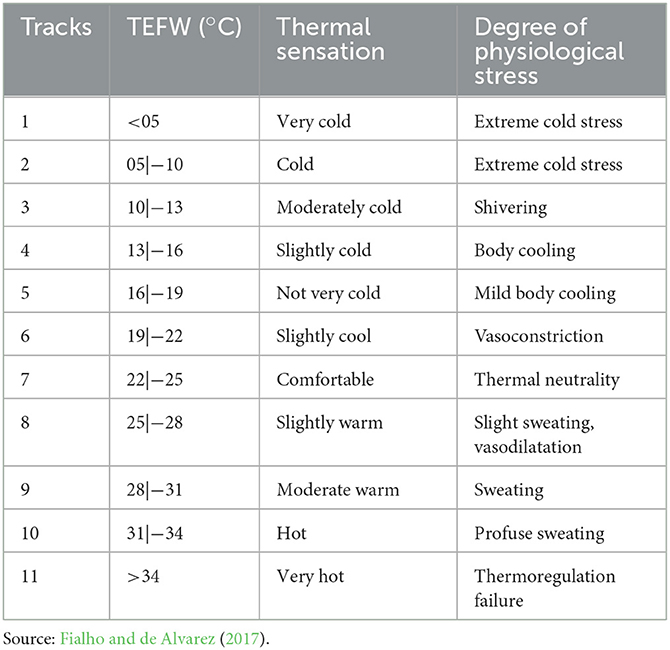
Table 3. Effective temperature in the function of wind index, range, classification, and body physiological sensation.
3. Results
The regions Pará and Tocantins present slight disparity between their measurements of meteorological elements due to the difference in biomes. As both are characterized by a tropical climate, there is a transition from the Amazon biome to the Cerrado.
When analyzing the data set, using Pearson's coefficient of variation, a better homogeneity was detected for air temperature and relative humidity data, indicating mild dispersion. In contrast, precipitation and wind speed showed high dispersion, due to the frequency of these phenomena, while air temperature and relative humidity are present daily in a certain recurring range due to the tropical climate. The precipitation rates occur more frequently during the winter seasons, wind speed can get values very close to zero, while in summer, the days are with little or no rain. Table 4 presents the data range variation monthly for the states of Pará (PA) and Tocantins (TO), addressing each variable and index calculated. Figures 3–11 are generated using the RStudio (2022) software with the data obtained from the weather stations, as a way to represent the variables and the indices of thermal comfort.
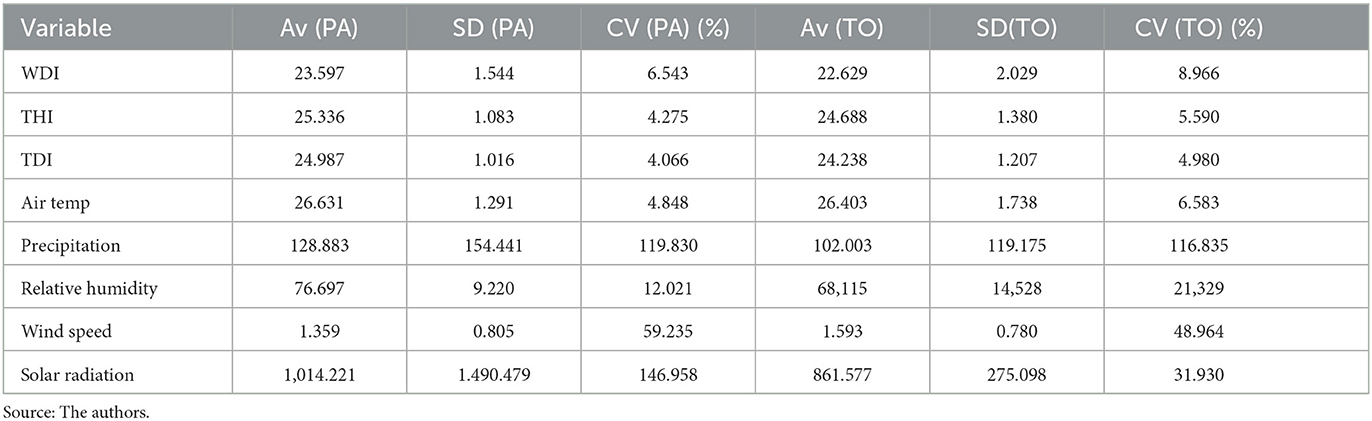
Table 4. Average, standard deviation, and coefficient of variation of monthly data.
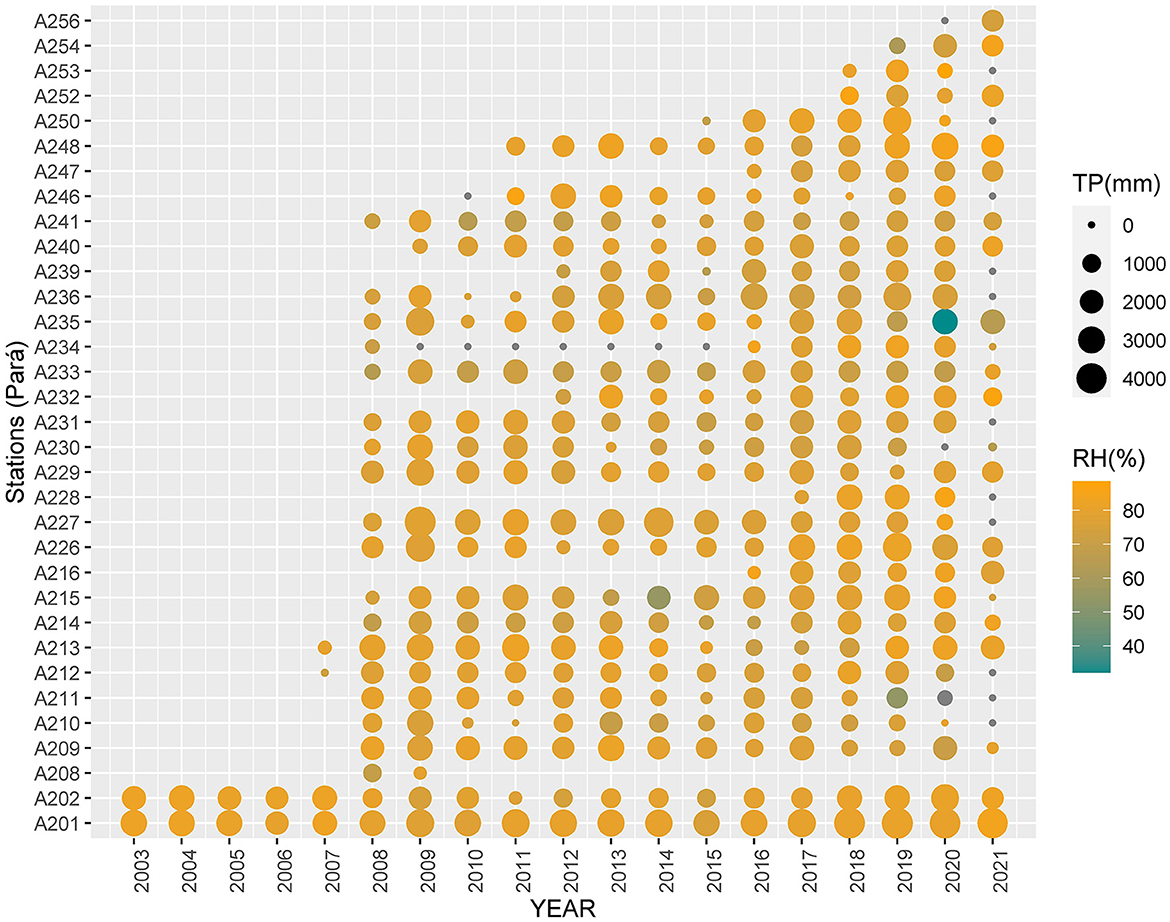
Figure 3. Precipitation and relative humidity in Pará state.
Figures 3, 4 present the data for Total Precipitation and Relative Humidity, denoted by TP (mm) and RH (%), respectively.
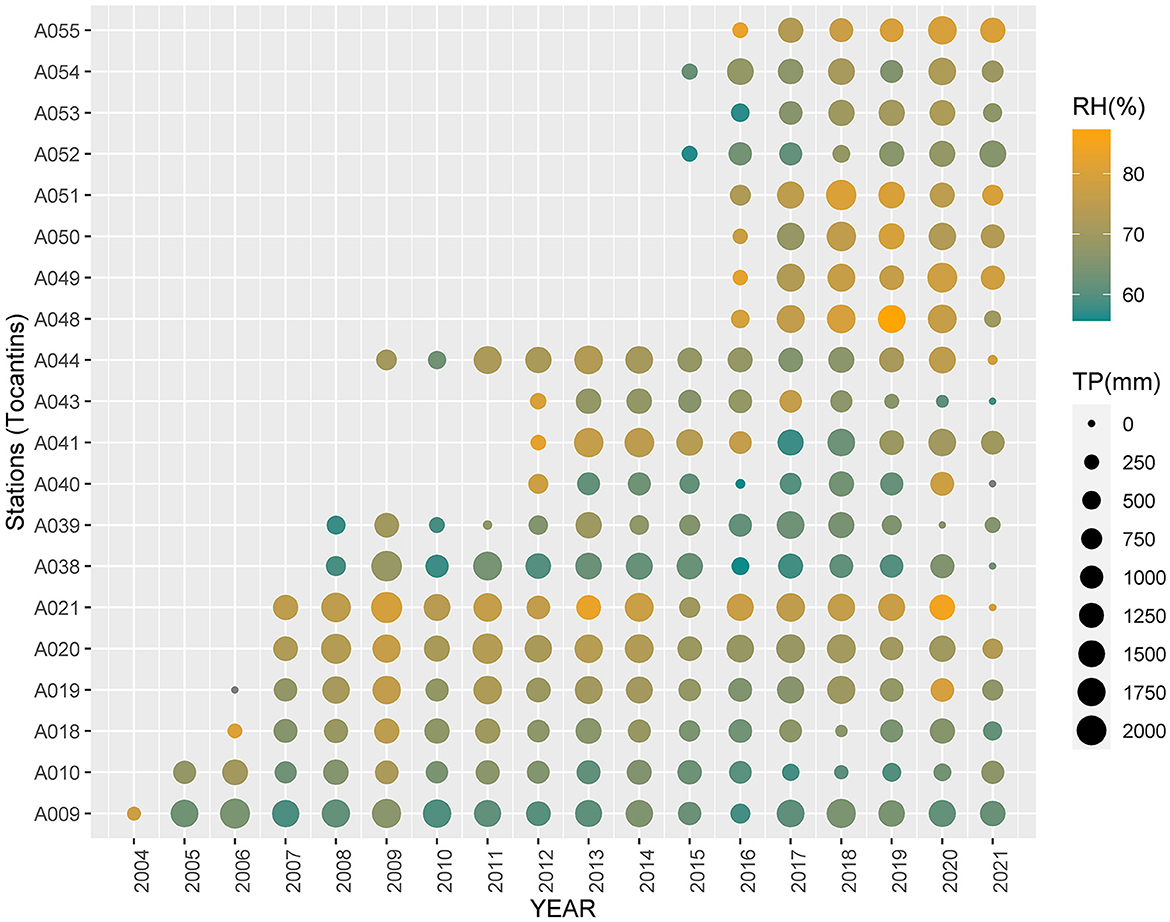
Figure 4. Precipitation and relative humidity in the state of Tocantins.
It can be seen in Figure 3 that Pará has high levels of precipitation and humidity. These factors can ease the feeling of discomfort by reducing the temperature in the region. Due to the presence of the Amazon rainforest, there are high incidences of rainfall in this region, and the relative humidity of the air fits in the pleasant range, being above 30%, and was not causing possible harm to health such as respiratory problems and skin irritations. The municipalities of Soure and Bragança had the highest values of precipitation in the series between 825 and 1,058.80 mm occurred in the months of March and May 2013 with relative humidity rates above 80%, while Salinópolis Serra dos Carajás had relative humidity below 40% and precipitation in the range of 0.40 mm during the months of August 2012 and September 2014.
Figure 4 shows the state of Tocantins with lower levels of humidity and precipitation. Even though a neighboring state to Pará, it presents two seasons defined by a dry season that occurs in the winter from May to October and a rainy season that occurs in the summer from November to April. The relative humidity of the air remains in the range of 60–70%, which did not negatively affect the health of the local population. The municipalities of Palmas, Pedro Afonso, Pium, and Araguaçu had the highest precipitation values during the months of January and February with values between 570 and 610 mm and relative humidity above 80%. The lowest precipitation and humidity values were observed in the municipalities of Palmas, Peixe, and Paraná with no rainfall and humidity below 40% with the highest incidence in September.
The incidence of solar radiation on the ground surface influences the air temperature and other meteorological factors, such as precipitation, since the energy exchange between each atmospheric layer and the amount of energy absorbed, reflected, and transmitted is different for living beings and different media such as gases and suspended particles, which affect the air temperature balance in different regions. Solar radiation can be harmful to human health depending on the intensity of the Ultraviolet A (UVA) and Ultraviolet B (UVB) rays and can cause injuries, skin burns, and even skin cancer. Figures 5, 6 represent solar radiation and air temperature in the state of Pará and Tocantins, respectively.

Figure 5. Solar radiation (SR) and air temperature (AIR Temp) in Pará state.
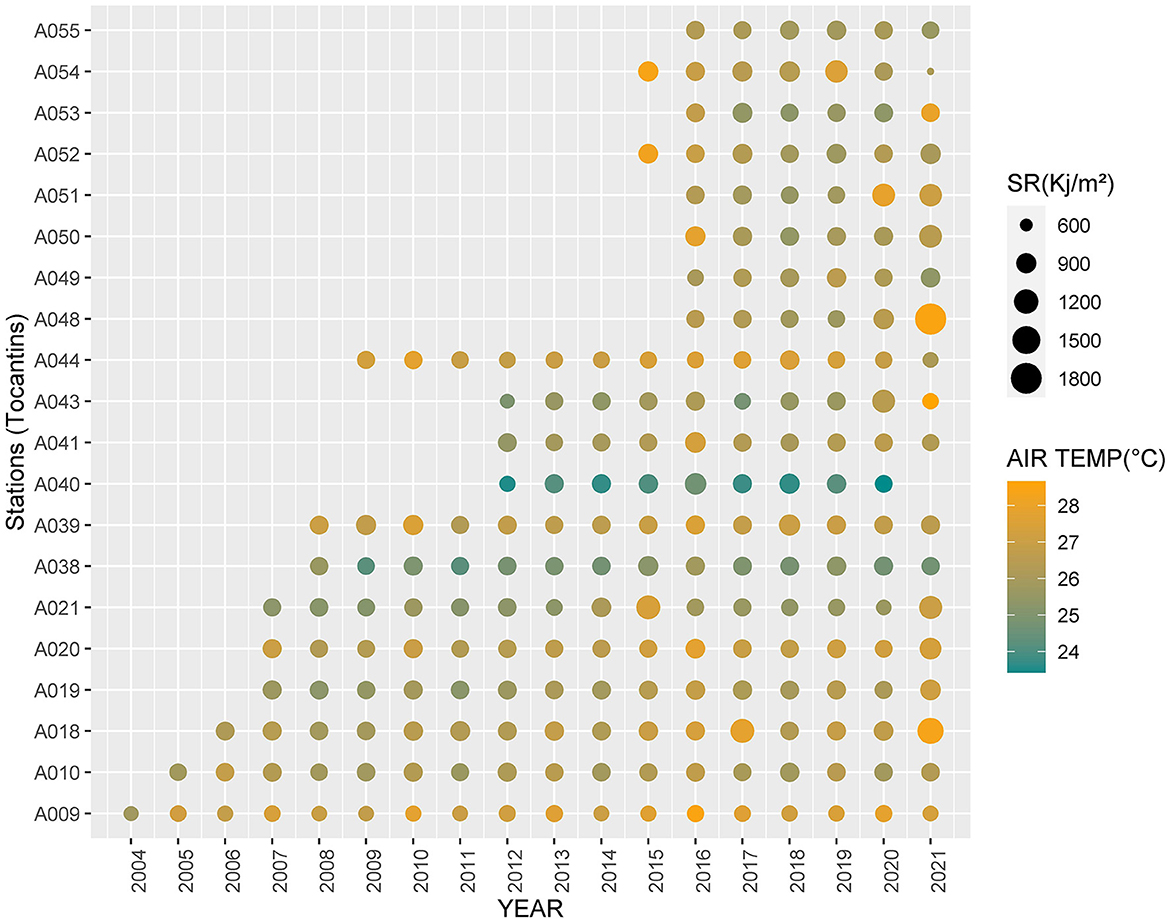
Figure 6. Solar radiation (SR) and air temperature (AIR Temp) in the state of Tocantins.
Wind speed plays an important part in precipitation since it moves different masses of air in various regions, and its intensity can ease the thermal sensation of the environment for humans. However, some wind and environmental conditions can be dangerous as storms can interfere with the landing and takeoff of aircraft and damage tree species, which can lead to accidents. The change in wind direction causes changes in landing and takeoff operations (Gusts of Wind, 2017). Figures 7, 8 show the wind speed data in meters per second. The cities with higher wind speed values tended to present a better thermal sensation due to the comfort factor provided by the wind intensity in these regions. From the TEFW index, most of the cities investigated presented a degree of thermal neutrality more often during this series.
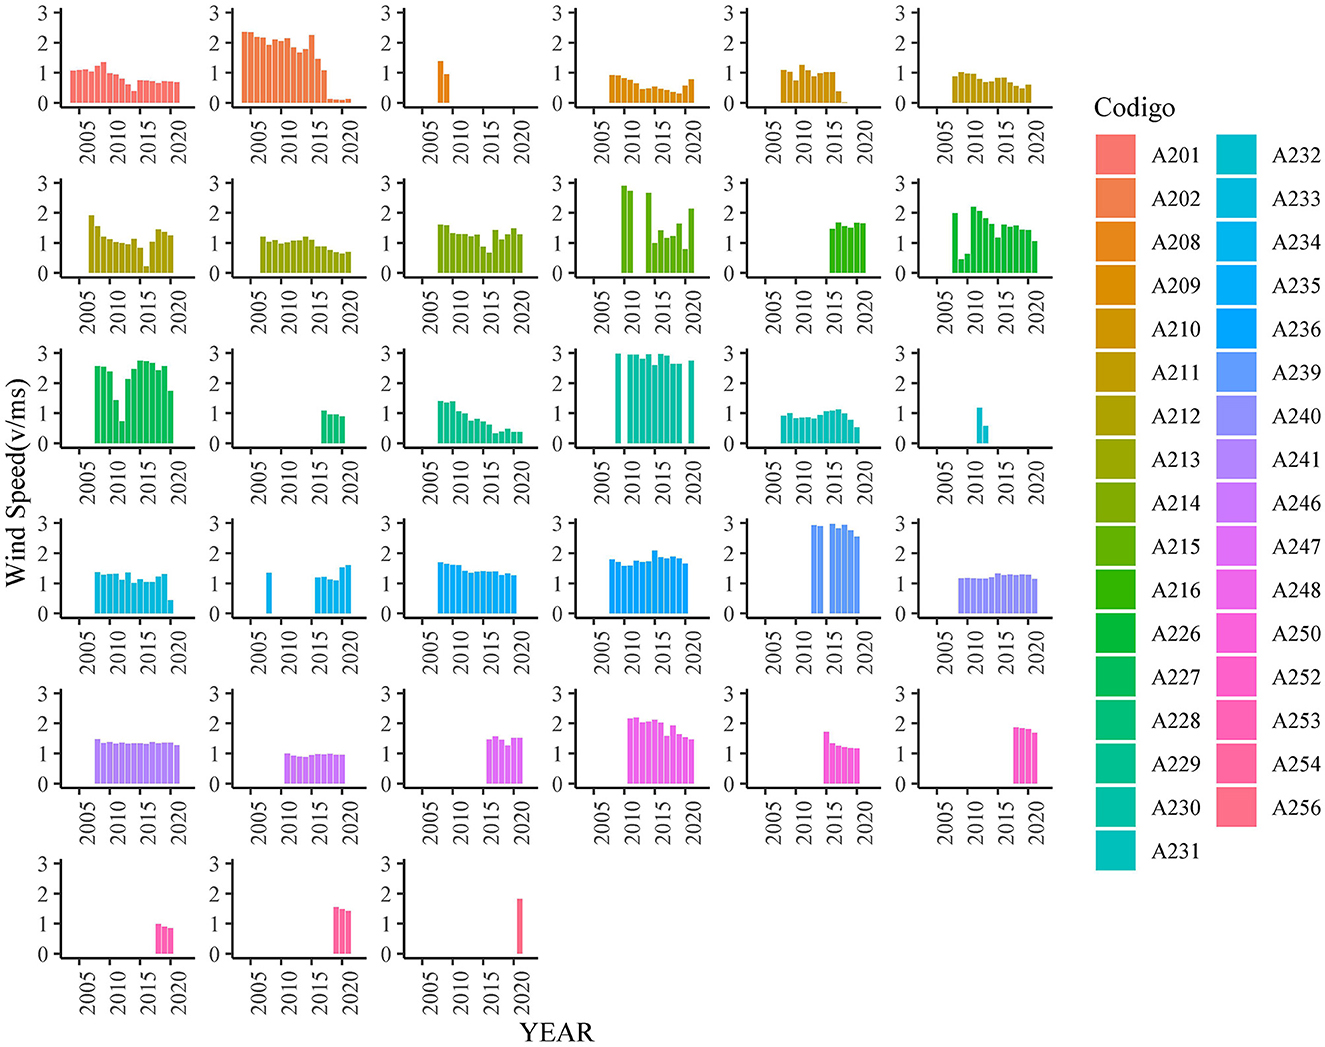
Figure 7. Wind speed, Pará.
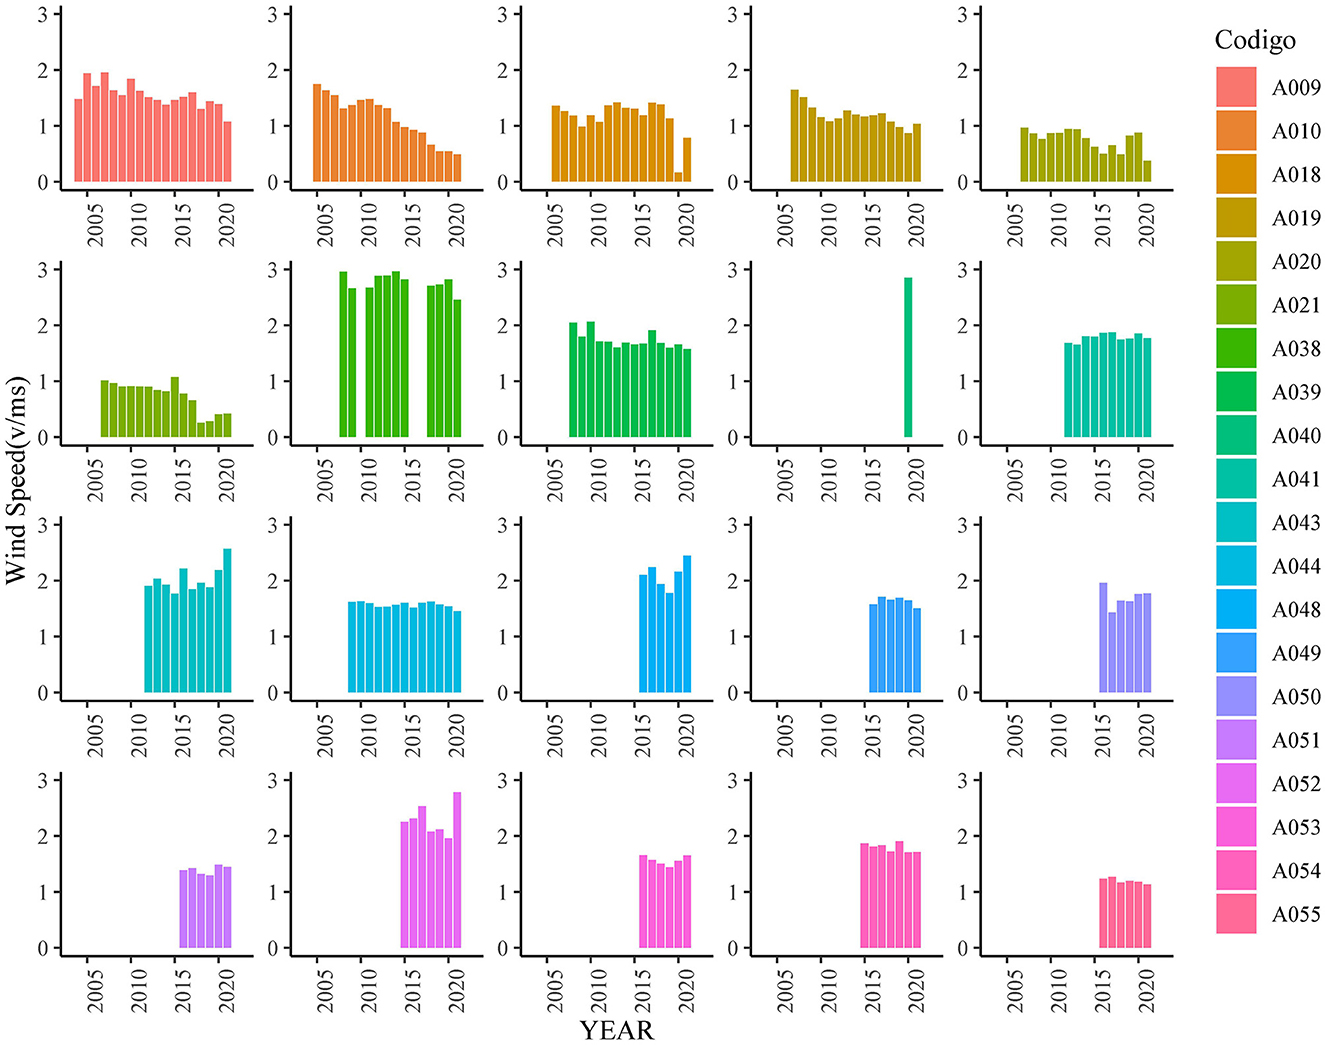
Figure 8. Wind speed in the state of Tocantins.
The change in variables between seasons is crucial for evaluating the thermal comfort indexes, due to the alternation between seasons such as summer and winter that alter precipitation levels, temperature, humidity, and wind speed. Figure 9 shows the indices for 2003 and 2020 for Belém, the capital city of Para, where its seasons are given by a dry season from June to October and the so-called Amazonian winter from November to May. Due to the cycle of seasons, measuring the indices in a gradual way can obtain different values each year, so TDI and THI were used to compare the results by analyzing the classification ranges of these indices. In Figures 9–11, TDI, THI, and TEFW are identified as IDT, ITU, and TEV.
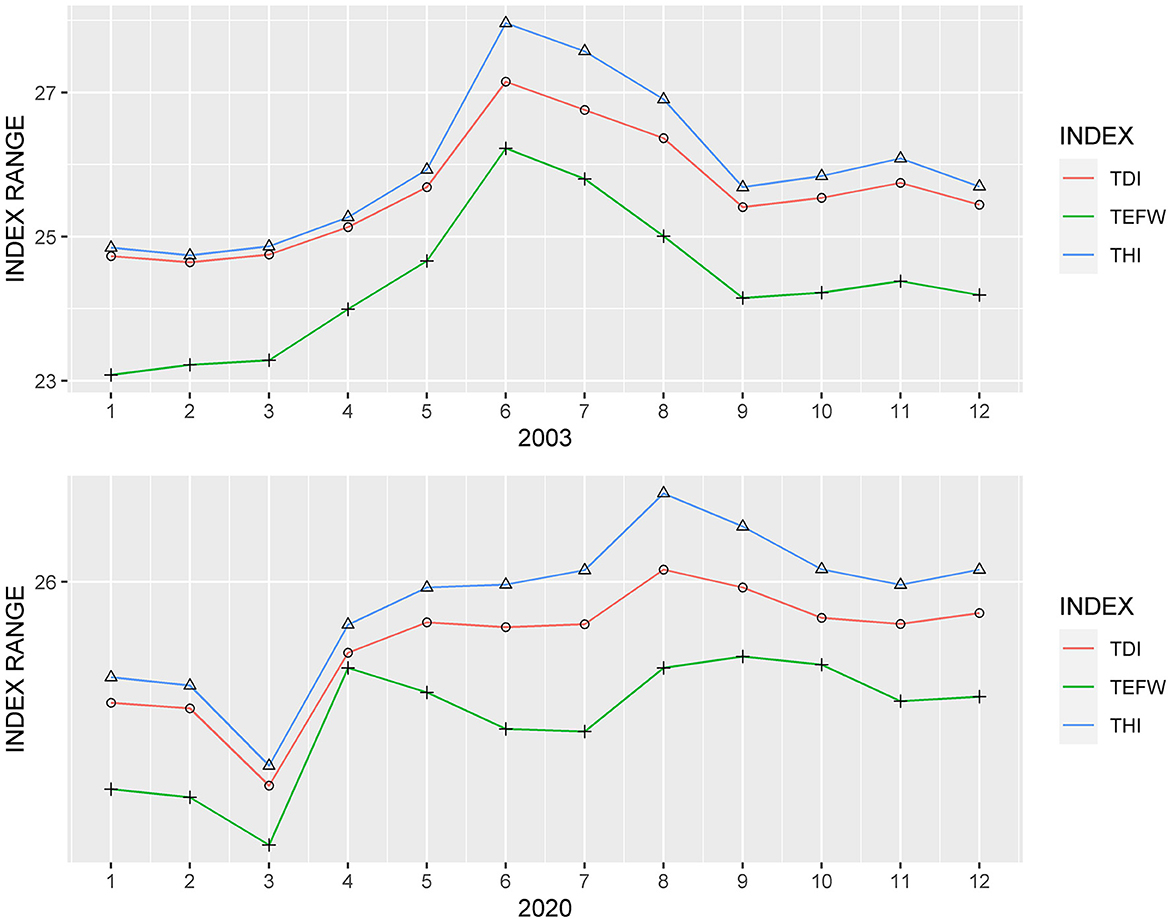
Figure 9. Indices for Station A201—Belém, PA.
When analyzing the results of all variables, in Figures 3, 4, there were changes in the behavior of variables such as precipitation, observed from the increase in rainfall volume annually, as well as periods with reduced rainfall volume in certain cities. Because of this, some regions present slight modifications in the climatic conditions in such a way as to cause slight changes in the indices.
In Belém, the 2003 measurements indicated that in the dry season a degree of discomfort in the months of June to August (TDI), THI was classified as extremely uncomfortable, and TEFW as a slightly hot thermal sensation. In 2020, this behavior occurred for the months of August to December. TDI maintained the same classification of slightly uncomfortable for this period; however, THI reached the extreme discomfort range during the Amazon winter, which did not occur previously in this period of the year, implying a slight change in the climatic cycle of the region.
Because this study treats data from a relatively large time series in seasonal form, in which the beginning and end periods of the data may be different for each weather station, Figures 10, 11 are generated, which represent the indices addressed in this study and their respective ranges for each month per year. With this, it can be seen that the number of measurements for the indices was high in the mild discomfort range, medium in the discomfort range, and low measurements of comfort and extreme discomfort for TDI and THI, and their measurements did not present so much disparity due to the ways of calculating them are based on the same variables, but with different classifications due to small adjustments in the equations. In addition, the TEFW presented data in the range of thermal neutrality with higher incidence for both states, with the second highest value being range 8 in Pará and range 6 in Tocantins.
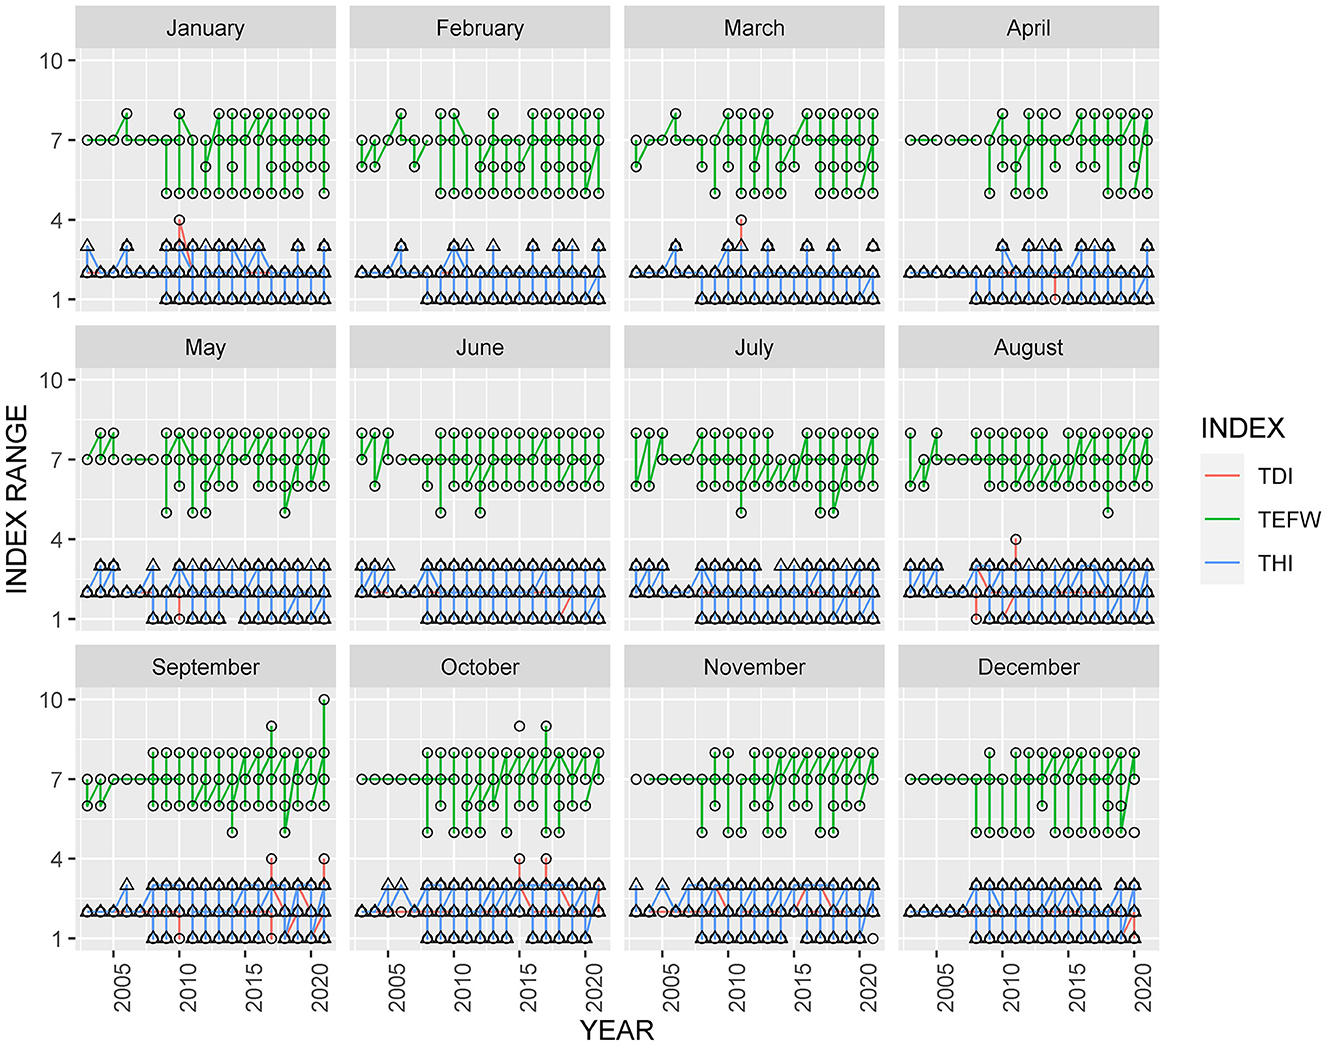
Figure 10. Seasonality index tracks in the state of Pará.
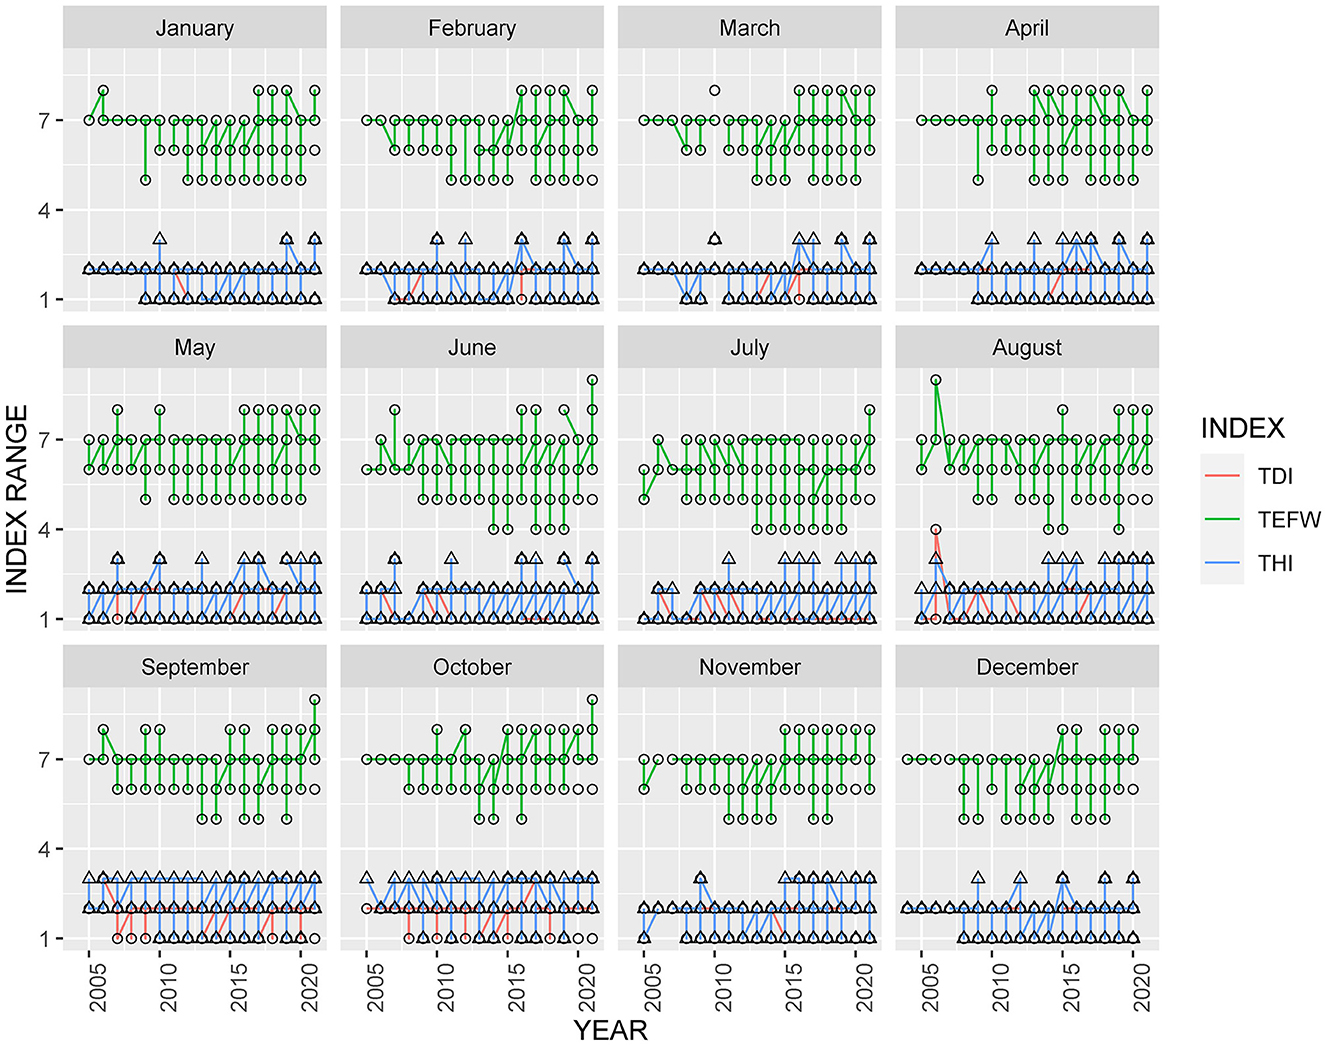
Figure 11. Seasonality index tracks in the state of Tocantins.
The monthly and annual precipitation measurements compared to the thermal comfort indices show that for monthly precipitation values below 150 mm, both TDI and THI reached a rating range of 3 with higher incidence, and TEFW reached a range of 7–8 more frequently. This indicates that rainfall rates in tropical regions are important to reduce the thermal discomfort of the population. Supplementary Figures 3, 4 are graphical representations of the precipitation variable for the states of Pará and Tocantins, and Supplementary Figures 5–10 are the representation of TDI, THI, and TEFW for better visualization of these results.
For the municipalities of Pará, in analyzing this time series, we found some gaps in measurement either due to the failure to capture data from the station or due to the absence of data, 141 months without temperature, humidity, or precipitation data, and 268 months without wind data, of which oscillate from January to December without measurements. These months are scattered in this series of 3,888 total months and divided in different ways among the weather stations.
In analyzing this series, it was found that Medicilândia and Serra dos Carajás were the municipalities with the best degree of thermal comfort during this study of measurements for Pará. Approximately 79.31% of the TDI measurements characterized slight thermal discomfort with a higher incidence in the months of December to May, 10.11% as comfortable with a higher incidence from June to August, 10.38% as uncomfortable from September to December, and 0.18% as extremely uncomfortable with only 7 measurements. The THI presented in 68.74% of the measurements as mildly uncomfortable with higher frequency from January to July, 23.51% as frequently extremely uncomfortable from September to November, and 7.73% as comfortable between the months of January, February, June, and July. The aforementioned TEFW showed measurements in about 77.34% of the samples in the thermally neutral range and 14.03% in the slightly warm track.
The analysis of the Tocantins measurements found no data for 45 months of precipitation, humidity, or air temperature and 63 months without wind data. It was found in the analysis of the indices that the TDI obtained measurements with 61.30% in the range of mild discomfort with higher incidence from March to April and October to November, 34.81% of comfort with higher frequency from July to August, and 3.84% of discomfort from September to November, with a single measurement of extreme discomfort in August. The THI showed 60.83% of the measurements in the mild discomfort range with incidence from November to April, 23.10% in the comfort range in June and July, and 13.05% in the extreme discomfort range most frequently in September and October. The TEFW obtained 62.10% in the thermal neutrality range from September to May and 23.20% in the slightly cool range from June to August.
After analysis, it was found that slight changes occurred in the interannual variability of these regions. Based on seasonality, there were indications of thermal discomfort for periods in which the previously presented measurements of mild discomfort were felt more often during the dry season and occurrences of discomfort began during the rainy season even with high rates of rainfall.
4. Discussion
When analyzing the thermal comfort indices for the cities in the states of Pará and Tocantins, the most comfortable cities in Pará were Medicilândia, Serra dos Carajás, Novo Repartimento, and Redenção on a seasonal scale from January to December. It is worth noting that Serra dos Carajás obtained a comfort rating from 2009 to 2021. The municipalities of Belém, Castanhal, Floresta do Araguaia, Medicilândia, Pacajá, Placas, Paragominas, Tomé-açu, Rondon do Pará, Salinópolis, São Félix do Xingu, Bragança, Breves, Soure, Tucuruí, Itaituba, Óbidos, Santana do Araguaia, Novo Repartimento, Tucumã, Cametá, Monte Alegre, Marabá, Mina do Palito, Conceição do Araguaia, Xinguara, Capitão Poço, Santarém, Dom Eliseu, Altamira, and Redenção mostly presented indices of mild discomfort (TDI), extreme discomfort (THI), and thermal neutrality (TEFW) during the annual analysis.
In the Tocantins analysis, we highlighted the seasonal comfort conditions in Palmas, Paraná, Gurupi, Araguaína, Formoso do Araguaia, Mateiros, Campos Lindos, and Almas from January to September. On an annual basis, the measurements found mild discomfort and thermal neutrality in Palmas, Paraná, Peixe, Gurupi, Pedro Afonso, Araguaia, Formoso do Araguaia, Marianópolis, Campos Lindos, Araguatins, Santa Fé do Araguaia, Colina do Tocantins, Rio Sono, Pium, Santa Rosa do Tocantins, Almas, Araguaçu, and Lagoa da Confusão.
In comparison to the result of these indices, Fialho and de Alvarez (2017) highlighted that during the analysis of these indices for the city of Vitória, TDI and THI showed very high values, categorizing this city in the range of very and extremely uncomfortable; thus, it does not portray the current situation of the city of Vitória, denoting that these do not represent a credible analysis of reality; while the TEFW index showed thermal neutrality, which more closely resembles the aspect of the region. Because of this, during the analysis and classification of these indexes for Pará and Tocantins, it was noted that there were no extreme and continuous peaks of the TDI and THI, which in the city of Vitória reached levels above 26 and 28°C. For the analysis of these two states, the indexes reached values in the range of mild discomfort during most of the series for each city, consistent with the region, and thermal neutrality in the TEFW denoting a slight variation of thermal comfort with respect to the wind most of the time.
International studies such as Yousif and Tahir (2013) and Talukdar et al. (2017) have used the thermal discomfort index, also known as Thom's discomfort index (TDI), to analyze thermal discomfort in the regions of Bangladesh and Sudan, respectively. They denoted the application of this index to different regions based only on climatic variables. The results indicate that there was mild discomfort and thermal discomfort in these regions and that it was possible to use the theoretical rating ranges for regions with different characteristics. Thus, the application of the TDI for Pará and Tocantins and its comparison with THI allow a better analysis, since they have similar classifications but with different intervals.
The most extreme values of discomfort for the indices in the series were found for cities that had the occurrence of high values of burning or urbanization. Deforestation and forest fires are two of the biggest environmental issues facing Brazil today. Although distinct, they are traditionally associated practices, because following the cutting of vegetation, there is almost always a burning of plant material (Gonçalves et al., 2012).
The urbanization of regions leads to the reduction of green areas and changes in the use and land cover of a region. According to Labaki et al. (2011), the phenomenon of urbanization is growing and cities have presented, in recent decades, large growth in population, space, and activities, dramatically transforming both the natural and the built environment. This newly built environment has been undergoing significant climate change, affecting the quality of life of the population.
In the state of Pará, the cities with the worst discomfort values were Conceição do Araguaia which had ~1,494.4658 km2 of burned area in 2010, Castanhal with 1.15741 km2 of urban infrastructure in 2011, Tomé-Açu with 19.1138 km2 of burned area, Santana do Araguaia with ~1,137.6133 km2 of burned area, Itaituba with 632.8068 km2 of burned area, and Bragança with 12.5180 km2 of urban infrastructure. From Tocantins, the most extreme value was stipulated for the city of Paraná, which had 209.386 km2 of burned area in 2006 with the highest value of burned area occurring in 2019 with 2,091.0015 km2 of burned area. In addition, these cities had almost zero precipitation measurements during the period that obtained these discomfort values.
In Junior et al. (2012), analyzing the spatial distribution of thermal comfort indices in Belém do Pará using the heat index IC, found that the difference from the most thermally comfortable region to the observation point with the highest measurement was due to the presence of vegetation and less ground cover by asphalt and concrete. The analysis of this time series for the TDI and THI oscillated increasingly along with the degree of urbanization of the city, due to the fact that the annual precipitation rates increased over the years, indicating some disturbance in the rainfall intensity in some regions.
For the states of Pará and Tocantins, analyzed in this study, the incidence of thermal discomfort levels reflects on the quality of life of the population, due to the fact that the climate of these regions is tropical, indicating high-temperature indexes during the year. The discomfort provided by hot environments triggers thermoregulation mechanisms to stabilize body temperature as a way to circumvent the thermal imbalance.
According to Fikru and Gautier (2015), the increase in the consumption of electricity and fuels used to regulate the temperature of a given hot or cold environment, respectively, must take into account the local and temporal differences and the methodology employed. In Brazil, hydroelectric energy is the most widely used, due to the fact that Brazil has a high potential for hydraulic energy. Approximately 56.8% of the Brazilian electricity matrix is composed of hydraulic energy (EPE, 2022).
Different sources of energy are used for different purposes during different seasons of the year. Electricity is used more for household appliances and refrigeration if there is an increase in energy consumption during the summer. As such, an increase in the average annual temperature should be associated with higher energy demand (Roson et al., 2007).
The population tends to seek ways of trying to regulate the temperature of the environment, that is, artificially acclimatizing the area with the help of household appliances to ease the discomfort and thus have a more airy environment, using appliances that impact in different ways on the energy expenses of several families due to the high energy consumption of these appliances in addition to the cost of energy being higher during periods of water shortage.
4.1. Comfort and vegetation
Some studies on afforestation and climate describe how important vegetation is for regulating temperature and thermal discomfort (Niachou et al., 2001; Loyde Vieira de Abreu-Harbich, 2008). Deforestation caused by burning and logging in the Amazon has a long-term impact on the wellbeing of the region's population. In addition to the propagation of greenhouse gases, the imbalance in the hydrological cycle is also affected, causing changes in the region's climate cycles such as prolonged periods of drought and days with excess precipitation volume.
Due to the various characteristics that vegetation in the urban environment can provide, some of them contribute significantly to improving the lives of the population (Montoya Vilcahuaman and Baggio, 2000). Cities with less forestation tend to have a higher thermal sensation, since vegetation is an important factor in reducing the level of thermal discomfort, creating shaded regions, providing cooler and airier environments, and doing thermal regulation through evapotranspiration that releases moisture into the air.
The changes in land use, accelerated by technological advances, allow changes in the environment on a large scale, affecting the handling of the soil. The expansion of the agricultural frontier promotes, in most cases, illegal deforestation and an increase in land conflicts in Brazil, turning areas belonging to the Union into pastures and crop areas after the forest is cut down.
According to Macedo et al. (2013), the dynamics of deforestation in the area, when at its peak, had as main utilitarian actors focused on extensive cattle ranching and were characterized as business oriented since the advance into the forest was mostly carried out by large agricultural companies. And that, nowadays, the difficulty of reducing deforestation, especially by small farmers, constitutes a complex problem to be faced, insofar as the reduction to zero deforestation, without any other alternative income, can have a direct impact on the exclusion of part of these actors from the rural area, a fact that would cause an imbalance in the social dimension of local development.
5. Conclusion
The main limitation of the study was to rely exclusively on data from meteorological stations, given that the start date was not homogeneous for all regions with automatic stations, so the initial date of acquisition covered data since 2000; however, when delimiting the study region with a greater number of stations, the first station for which data were available started in 2003, because of this the images started from 2003. In addition, there was the limitation of not examining the numerous air masses and convection zones present in the region.
It was found that the measurements for the cities analyzed in Pará and Tocantins presented slight thermal discomfort during the period of analysis, with few cities presenting comfort and extreme discomfort, and thermal neutrality with respect to the wind in these regions. Furthermore, the verification of the classification of different indices to analyze the region allowed the verification that for a better synergy of analysis it is important to have at least more than one index that uses the same variables for comparison of results.
The results show that the feeling of mild discomfort was predominant during this time series, for both TDI and THI, which implies the need for indoor air conditioning to ensure greater thermal comfort and minimize the energy expenditure of the body in heat exchange with the environment, enabling good conditions for work, study, and leisure practices. One way to improve the accuracy of these results would be to analyze these data for the entire time series with the addition of the various air masses that circulate in Brazil.
Data availability statement
The raw data supporting the conclusions of this article will be made available by the authors, without undue reservation.
Author contributions
AS is the main author responsible for the research, data collection, data analysis, the initial draft of the research and was in charge of graphics and index calculation. FM was responsible for auxiliary data review and text format. WS was responsible for the conceptualization and delimitation of the initial proposal and assistance in the implementation of the methodology. MS and GC were responsible for the theoretical review, the manuscript review, the delimitation of the research, and suggestions for modification. FC was responsible for the last review and manuscript translation. AS and FM are responsible for the first review.
Funding
This study was funded by the Coordination of Improvement of Higher Education Personnel - Brazil (CAPES) - Financial Code 001, Academic Master's and Doctoral Program for Innovation MAI/DAI 2020, National Council for Technological and Scientific Development (CNPq), and Federal University of Pará (UFPA).
Conflict of interest
The authors declare that the research was conducted in the absence of any commercial or financial relationships that could be construed as a potential conflict of interest.
Publisher's note
All claims expressed in this article are solely those of the authors and do not necessarily represent those of their affiliated organizations, or those of the publisher, the editors and the reviewers. Any product that may be evaluated in this article, or claim that may be made by its manufacturer, is not guaranteed or endorsed by the publisher.
Supplementary material
The Supplementary Material for this article can be found online at: https://www.frontiersin.org/articles/10.3389/fclim.2023.1126042/full#supplementary-material
Supplementary Figure 1. Data gaps of variables in Pará.
Supplementary Figure 2. Data gaps of variables in Tocantins.
Supplementary Figure 3. Total precipitation (mm) in Pará, data view in columns.
Supplementary Figure 4. Total Precipitation (mm) in Tocantins, data view in columns.
Supplementary Figure 5. Ranges of TDI classification in Pará, separate to each meteorological station.
Supplementary Figure 6. Ranges of THI classification in Pará, separate to each meteorological station.
Supplementary Figure 7. Ranges of TEFW classification in Pará, separate to each meteorological station.
Supplementary Figure 8. Ranges of TDI classification in Tocantins, separate to each meteorological station.
Supplementary Figure 9. Ranges of THI classification in Tocantins, separate to each meteorological station.
Supplementary Figure 10. Ranges of TEFW classification in Tocantins, separate to each meteorological station.
Supplementary Figure 11. Location map of fires in Pará and Tocantins from years 2003–2021.
Supplementary Figure 12. Location map of urban infrastructure in Pará and Tocantins from years 2003–2020.
References
Barros, A. H. C., de Araújo Filho, J. C., Da Silva, A. B., and Santiago, G. A. C. (2012). Climatologia do estado de Alagoas. Embrapa Solos-Boletim de Pesquisa e Desenvolvimento (INFOTECA-E). (2012). Available online at: https://www.infoteca.cnptia.embrapa.br/infoteca/handle/doc/950797
Bracarense, L., Cruz, B., Monteiro, A., Santos, A., Venâncio, S. L. A., and Pereira, E. (2018). “Índices de Conforto Térmico: Limitações e Variações de Classificação,” in Congresso Luso-Brasileiro para o Planejamento Urbano, Regional, Integrado e Sustentável, Vol. 8.
Clima Pará (2023). Available online at: https://pt.climate-data.org/america-do-sul/brasil/para-189/ (accessed January 31, 2023).
Clima Tocantins (2023). Available online at: https://pt.climate-data.org/america-do-sul/brasil/tocantins-205/ (accessed January 31, 2023).
Coutinho, M. D. L., dos Santos, T. S., dos Santos, A. C., Silva, A. R., da Silva Costa, M., and da Morais, M. D. C. (2014). O microclima e o (des) conforto térmico em ambientes abertos na cidade de Natal. Hygeia Revista Brasileira de Geografia Médica e da Saúde 10, 65. doi: 10.14393/Hygeia1028195
da Costa1 João, A. C. L., de Athaydes Silva Junior, A. C., da Cunha, J., Feitosa, R. P., Portela, B. T. T., da Costa1 João, A. C. L., et al. (2013). Índices de conforto térmico e suas variações sazonais em cidades de diferentes dimensões na Região Amazônica. Revista Brasileira de Geografia Física 6, 478–487.
da Costa1 João, A. C. L., de Athaydes Silva Junior, A. C., da Cunha, J., Feitosa, R. P., Portela, B. T. T., da Silva, G. G. C., et al. (2013). índices de conforto térmico e suas variações sazonais em cidades de diferentes dimensões na Região Amazônica. Revista Brasileira de Geografia Física. 6, 478–487.
Da Silva, I. A., Vieira, M. D. L. S., Santos, J. D. S., and Araújo, L. E. D. (2013). Clima Urbano: uma avaliação do Campo térmico urbano o Campus IV da UFPBRio Tinto-PB (Urban Climate: An Assessment Of The Field Of Urban Heat Of Campus IV UFPB Rio Tinto-PB). Revista Brasileira de Geografia Física. 6, 1384–1399. Available online at: https://periodicos.ufpe.br/revistas/rbgfe/article/view/233111
de Aguiar, A. P. D. (2003). Modelagem de mudanças de uso e cobertura do solo na Amazônia: Questões Gerais.
de Souza e Silva, R., da Silva, R. M., de Freitas, A. F., Dos Santos, J. S., Santos, C. A. G., and de Lima, E. R. V. (2022). Thermal comfort conditions at microclimate scale and surface urban heat island in a tropical city: A study on João Pessoa city, Brazil. Int. J. Biometeorol. 66, 1079–1093. doi: 10.1007/s00484-022-02260-y
Edwards, D. P., Socolar, J. B., Mills, S. C., Burivalova, Z., Koh, L. P., and Wilcove, D. S. (2019). Conservation of tropical forests in the anthropocene. Curr. Biol. 29, R1008–R1020. doi: 10.1016/j.cub.2019.08.026
EPE (2022). Matriz energética e elétrica. Available online at: https://www.epe.gov.br/pt/abcdenergia/matriz-energetica-e-eletrica (accessed November 13, 2022).
Fialho, E. S., and de Alvarez, C. E. (2017). Análise de Índices de Conforto Térmico Urbano associados às Condições Sinóticas de Vitória (ES), Brasil.
Fikru, M. G., and Gautier, L. (2015). The impact of weather variation on energy consumption in residential houses. Appl. Energy 144, 19–30. doi: 10.1016/j.apenergy.2015.01.040
França, M. S. (2015). Estimativa de índices de conforto térmico na cidade de Cuiabá/MT. Caminhos de Geografia. 10, 141–151.
Gambrell, R. C. (2002). “Doenças térmicas e exercício,” in Manual de medicina desportiva: uma abordagem orientada aos sistemas, eds W. A. Lillegard, J. D. Butcher, and K. S. Rucker (São Paulo: Manole), 457–64.
Gonçalves, K. D. S., Castro, H. A. D., and Hacon, S. D. S. (2012). As queimadas na região amazônica e o adoecimento respiratório. Ciência Saúde Coletiva 17, 1523–1532. doi: 10.1590/S1413-81232012000600016
Gusts of Wind, National Civil Aviation Agencyl (ANAC). (2017). Available online at: https://www.gov.br/anac/pt-br/assuntos/seguranca-operacional/meteorologia-aeronautica/condicoes-meteorologicas-adversas-para-o-voo/rajadas-de-vento#vento (accessed February 6, 2023).
IBGE (2021a). Portal Cidades e Estados. Available online at: https://www.ibge.gov.br/cidades-e-estados/pa.html (accessed November 04, 2022).
IBGE (2021b). Portal Cidades e Estados. Available online at: https://www.ibge.gov.br/cidades-e-estados/to.html (accessed November 04, 2022).
IMAZON (2022). Desmatamento na Amazônia cresce 29% em 2021 e é o maior dos últimos 10 anos. Available online at: https://imazon.org.br/imprensa/desmatamento-na-amazonia-cresce-29-em-2021-e-e-o-maior-dos-ultimos-10-anos/#:$\sim$:text=Destruição%20da%20floresta%20chegou%20a,equivale%20a%20metade%20de%20Sergipe&text$=$A%20floresta%20amazônica%20viveu%20em,equivale%20a%20metade%20de%20Sergipe (accessed November 08, 2022).
INMET (2022). Catálogo de Estações Automáticas do Instituto Nacional de Meteorologia. Available online at: https://portal.inmet.gov.br/paginas/catalogoau (accessed October 06, 2022)
IPCC (2022). Climate Change 2022: Impacts, Adaptation and Vulnerability, the Working Group II Contribution. Available online at: https://www.ipcc.ch/report/sixth-assessment-report-working-group-ii/ (accessed November 20, 2022).
Junior, J. D. A. S., Costa, A. C. L., Pezzuti, J. C. B., Costa, R. F., and Galbraith, D. (2012). Análise da distribuição espacial do conforto térmico da cidade de Belém, PA no período menos chuvoso. Revista Brasileira de Geografia Física 5, 218–232. doi: 10.26848/rbgf.v5i2.232777
Labaki, L. C., Santos, R. D., Bueno-Bartholomei, C. L., and Abreu, L. D. (2011). Vegetação e conforto térmico em espaços urbanos abertos. Fórum Patrimônio Belo Horizonte 4, 23–42. Available online at: https://www.researchgate.net/publication/260591709_Vegetacao_e_conforto_termico_em_espacos_urbanos_abertos
Lamberts, R., Xavier, A. D. P., Goulart, S., and Vecchi, R. D. (2011). Conforto e stress térmico. LabEEE, UFSC.
Lima, M. B., Costa, G. B., Pereira, W. D. S., da Silva, D. T. C., Matias, L. V. D. S., Macambira, A. C. D. S., et al. (2021). Aspectos Sazonais de um Índice de Risco de Incêndios Florestais na Região Norte do Brasil por Meio de Dados Meteorológicos. Biodiversidade Brasileira BioBrasil 11, 46–59. doi: 10.37002/biobrasil.v11i4.1781
Loyde Vieira de Abreu-Harbich (2008). Avaliação da escala de influência da vegetação no microclima por diferentes espécies arbóreas. Campinas, SP, 154.
Macedo, M. R. A., Darnet, L. A. F., Thalâs, M. C., and Poccard-Chapuis, R. (2013). Configuração Espacial Do Desflorestamento Em Fronteira Agrícola Na Amazônia: Um Estudo De Caso Na Região De São Félix Do Xingu, Estado Do Pará (Spatial configuration of deforestation in agricultural frontier: A case study in region of São Félix...). Revista Nera. 22, 96–110. doi: 10.47946/rnera.v0i22.2073
Mapbiomas (2022a). Estatistica Cicatrizes de fogo (Coleção 1 - Mapbiomas fogo) Available online at: https://brasil.mapbiomas.org/estatisticas (acessed February 05, 2023).
Mapbiomas (2022b). Estatísticas Cobertura e transições municípios (Coleção 7). Available online at: https://brasil.mapbiomas.org/estatisticas (acessed February 05, 2023).
Marçal, N. A., da Silva, R. M., Santos, C. A. G., and dos Santos, J. S. (2019). Analysis of the environmental thermal comfort conditions in public squares in the semiarid region of northeastern Brazil. Build. Environ. 152, 145–159. doi: 10.1016/j.buildenv.2019.02.016
Marengo, J. A., Souza, C. M., Thonicke, K., Burton, C., Halladay, K., Betts, R. A., et al. (2018). Changes in climate and land use over the Amazon region: current and future variability and trends. Front. Earth Sci. 6, 228. doi: 10.3389/feart.2018.00228
Mazzone, A. (2020). Thermal comfort and cooling strategies in the Brazilian Amazon. An assessment of the concept of fuel poverty in tropical climates. Ener. Policy. 139, 111256.
Monteiro, L. M., and Alucci, M. P. (2010). Comparação cruzada entre pesquisas laboratoriais e de campo em conforto térmico em espaços abertos urbanos. Ambiente Construído 10, 79–101. doi: 10.1590/S1678-86212010000400007
Morton, D. C., DeFries, R. S., Shimabukuro, Y. E., Anderson, L. O., Arai, E., del Bon Espirito-Santo, F., et al. (2006). Cropland expansion changes deforestation dynamics in the southern Brazilian Amazon. Proc. Natl. Acad. Sci. 103, 14637–14641. doi: 10.1073/pnas.0606377103
Morton, D. C., Noojipady, P., Macedo, M. M., Gibbs, H., Victoria, D. C., and Bolfe, E. L. (2016). Reevaluating suitability estimates based on dynamics of cropland expansion in the Brazilian Amazon. Global Environ. Change 37, 92–101. doi: 10.1016/j.gloenvcha.2016.02.001
Nepstad, D., McGrath, D., Stickler, C., Alencar, A., Azevedo, A., Swette, B., et al. (2014). Slowing Amazon deforestation through public policy and interventions in beef and soy supply chains. Science 344, 1118–1123. doi: 10.1126/science.1248525
Niachou, A., Papakonstantinou, K., Santamouris, M., Tsangrassoulis, A., and Mihalakakou, G. (2001). Analysis of the green roof thermal properties and investigation of its energy performance. Energy Buil. 33, 719–729. doi: 10.1016/S0378-7788(01)00062-7
Nicol, J. F., and Roaf, S. (2017). Rethinking thermal comfort. Buil. Res. Inform. 45, 711–716. doi: 10.1080/09613218.2017.1301698
Nóbrega, R. S., and Lemos, T. V. S. (2011). O microclima e o (des)conforto térmico em ambientes abertos na cidade do recife. Revista de Geografia Recife 28, 93–109.
Querino, J. S. (2017). Avaliação do conforto térmico nas imediações urbanas em torno do Parque Mãe Bonifácia - Cuiabá /MT. Trabalho de Conclusão de Curso (Monografia) do Curso de Tecnologia em Gestão Ambiental - IFMT Campus Cuiabá - Bela Vista - Cuiabá.
Roson, R., De Cian, E., and Lanzi, E. (2007). The Impact of Temperature Change on Energy Demand a Dynamic Panel Analysis (No. 2007_06).
Rossi, A. (2017). Amazônia desmatada concentra 9 em cada 10 mortes de ativistas por conflito no campo. BBC Brasil, São Paulo. Available online at: https://www.bbc.com/portuguese/brasil-40615688 (accessed July 26, 2017).
RStudio (2022). RStudio: software livre para desenvolvimento em linguagem R. R version 4.2.1 (2022-06-23 ucrt) – “Funny-Looking Kid”, Copyright (C) 2022 The R Foundation for Statistical Computing, Platform: x86_64-w64-mingw32/x64 (64-bit). Available online at: https://posit.co/download/rstudio-desktop/ (accessed November 14, 2022).
Santos, J. S. D. (2011). Campo térmico urbano e a sua relação com o uso e cobertura do solo em uma cidade tropical úmida.
Sette, D. M., and Ribeiro, H. (2011). Interações entre o clima, o tempo e a saúde humana. InterfacEHS Revista de Saúde Meio Ambiente e Sustentabilidade 6, 37–51.
Silva Júnior, J. D. A., Costa, A. C. L. D., Pezzuti, J. C. B., and Costa, R. F. D. (2013). Variabilidade espacial do conforto térmico e a segregação social do espaço urbano na cidade de Belém, PA. Revista Brasileira de Meteorologia. 28, 419–428.
Silva, J. S., da Silva, R. M., and Santos, C. A. G. (2018). Spatiotemporal impact of land use/land cover changes on urban heat islands: a case study of Paço do Lumiar, Brazil. Buil. Environ. 136, 279–292. doi: 10.1016/j.buildenv.2018.03.041
Silveira, J., Oliveira Neto, S., Canto, A., Leite, F. F. G. D., Cordeiro, F. R., Assad, L. T., et al. (2022). Land use, land cover change and sustainable intensification of agriculture and livestock in the Amazon and the Atlantic forest in Brazil. Sustainability 14, 2563. doi: 10.3390/su14052563
Souza, D. M. D., and Nery, J. T. (2012). O conforto térmico na perspectiva da climatologia geográfica. Geografia (Londrina). 21, 65–83.
Talukdar, M. S. J., Hossen, M. S., and Baten, M. A. (2017). Trends of outdoor thermal discomfort in mymensingh: An application of Thoms' discomfort index. J. Environ. Sci. Nat. Resour. 10, 151–156. doi: 10.3329/jesnr.v10i2.39028
Thom, E. C. (1959). The discomfort index. Weatherwise. 12, 57–61. doi: 10.1080/00431672.1959.9926960
Keywords: quality of life, Amazon, thermal comfort, meteorologic, climatic factors
Citation: Santos AF, Moura FRT, Seruffo MCR, Santos WP, Costa GB and Costa FAR (2023) The impact of meteorological changes on the quality of life regarding thermal comfort in the Amazon region. Front. Clim. 5:1126042. doi: 10.3389/fclim.2023.1126042
Received: 17 December 2022; Accepted: 06 February 2023;
Published: 13 March 2023.
Edited by:
Ayyoob Sharifi, Hiroshima University, JapanReviewed by:
José Francisco Oliveira Júnior, Federal University of Alagoas, BrazilMaría Cleofé Valverde, Federal University of ABC, Brazil
Copyright © 2023 Santos, Moura, Seruffo, Santos, Costa and Costa. This is an open-access article distributed under the terms of the Creative Commons Attribution License (CC BY). The use, distribution or reproduction in other forums is permitted, provided the original author(s) and the copyright owner(s) are credited and that the original publication in this journal is cited, in accordance with accepted academic practice. No use, distribution or reproduction is permitted which does not comply with these terms.
*Correspondence: Adrian Felipe dos Santos, YWRyaWFuZmVsaXBlLjIwMTBAZ21haWwuY29t