 María Cleofé Valverde1*
 Bianca Nunes Calado2
 Gabrielle Gomes Calado3
 Larissa Yumi Kuroki3
 Ricardo Brambila4
 Aline Ramos de Sousa3
- 1Centro de Engenharia, Modelagem e Ciências Sociais Aplicadas, Curso de Engenharia Ambiental e Urbana, Universidade Federal do ABC (UFABC), Santo André, São Paulo, Brazil
- 2Programa de Pós-Graduação em Ciência do Sistema Terrestre (CST), Instituto Nacional de Pesquisas Espaciais (INPE), São José dos Campos, São Paulo, Brazil
- 3Programa de Pós-graduação em Ciências e Tecnologia Ambiental, Universidade Federal do ABC (UFABC), Santo André, São Paulo, Brazil
- 4Programa de Pós-Graduação em Desastres Naturais, Centro Nacional de Monitoramento e Alertas de Desastres Naturais (Cemaden) e o Instituto de Ciência e Tecnologia de São José dos Campos, da Universidade Estadual Paulista “Júlio de Mesquita Filho” (ICT-Unesp), São Paulo, Brazil
Cities are increasingly vulnerable to climate change's impacts and poorly adapted to extreme variability. This study aimed to evaluate climate projections of air temperature and precipitation in seven cities in the Metropolitan Region of São Paulo that correspond to the Greater ABC Paulista. We used high-resolution models Eta-HADGEM2_ES (CMIP5), CNRM-CM6-1-HR (CMIP6), and the TerraClimate database to analyze future projections and the specific warming levels (SWLs), respectively. Model data were validated with observed data and bias was removed. A bias correction factor was generated and used in the climate projections for the different emission scenarios. The results show a consensus between the models and the SWLs (2 and 4°C) for the increase in maximum (Tmax) and minimum (Tmin) temperatures for all municipalities in ABC Paulista in different emission scenarios until the end of the 21st century. For the nearest future (2020–2040), the city of São Caetano do Sul (SCS) shows the highest positive annual anomalies of Tmax concerning the climatological period (1985–2015), for the scenario RCP4.5 (2.8°C) and the RCP8.5 (7.4°C), according to projections from the Eta-HADGEM2_ES, highlighting summer and autumn as the hottest. For precipitation, there was a consensus between the Eta-HADGEM2_ES and the CNRM-CM6-1-HR for a reduction in all scenarios and time-slices 2020–2040 and 2041–2070. The municipalities of Diadema (−78.4%) and SCS (−78%) showed the most significant reductions in December for the RCP8.5, and for SSP5-8.5, SCS shows −30.9% in December for the 2020–2040 time-slice. On the other hand, TerraClimate presents excess rain for Ribeirão Pires (+24.8%) and Santo André (+23.7%) in winter for SWL4°C. These results suggest that an increase in Tmax and Tmin, as projected, should influence the intensity of extreme heat events. Furthermore, a reduction in annual and seasonal rainfall does not mean a decrease in the region's extreme daily events that cause floods and landslides. However, it leaves an alert of water scarcity for the supply and demand of the population. ABC Paulista does not have adaptation plans to face extreme climate change. The results can contribute to the first phase of creating an adaptation plan, giving a first view of the climate threat that should intensify until the end of the twentieth century affecting the most vulnerable municipalities.
1. Introduction
Cities are one of the most vulnerable spaces to climate change, especially to extreme variability in precipitation and temperature. The impacts are already a threat all over the planet and the most affected population are those living in vulnerable housing, with lack of sanitation infrastructure, in addition to social and economic vulnerability.
With the recent release of the sixth report of the Intergovernmental Panel on Climate Change—AR6/IPCC (IPCC, 2021), it is unequivocal corroboration that human-induced climate change is already generating many climatic extremes in all regions of the globe. In the period between the publication of the fifth IPCC report (AR5) and the sixth (AR6), evidence regarding the intensification of weather and climate extremes—such as heat waves (HW), intense precipitation, tropical cyclones, extreme droughts, among others—has strengthened (IPCC, 2021).
In 2021, many extreme weather events occurred simultaneously (WMO—World Meteorological Organization, 2022), including severe floods in the Asian continent and in parts of Europe, such as HW in the northwest of the United States and Canada, that raised temperatures to almost 50°C in a village in British Columbia and 54.5°C in California (Death Valley). On the other hand, South America experienced a high rainfall deficit, extreme drought in the Paraná water basin, and intense cold waves, which affected agriculture, transport, and energy production sectors (WMO—World Meteorological Organization, 2022). Although the attribution of these extremes to anthropogenic climate change still has uncertainties, the fact is that climate variability and its extremes are increasingly intense, and its impacts are undeniable.
The extreme HW between late June and early July 2021 in western Canada and the US Pacific Northwest caused more than 1,400 deaths and led to several wildfires (Benfield, 2021; ECCC—Environment and Climate Change Canada, 2021). This heat episode was extremely rare, occurring approximately one every 1,000 years in the current climate scenario. According to recent studies, such an event would have been unlikely to happen without anthropic climate change drivers (Philip et al., 2021; World Weather Attribution, 2021).
Currently, HWs are among the most damaging climate extremes for human society. Several climate models consistently project that the frequency, severity, and duration of HWs will increase sharply over the next century. The occurrence of these events can further intensify heat islands in cities and, consequently, increase the thermal discomfort and the mortality rate of the population (Zhao et al., 2018; Tewari et al., 2019; Valverde, 2021), especially among the elderly and socioeconomically vulnerable ones (Gouveia et al., 2003; Son et al., 2016).
The sixth IPCC report highlights significant regional climate changes in southeastern South America. The observed series identified mean and extreme precipitation increases since the 1960s (high confidence). Drivers of this change include internal variability and external forcing, like increases in greenhouse gases and aerosols and ozone depletion. On the other hand, the intensity and frequency of extreme precipitation and pluvial floods are projected to increase (medium confidence) for 2°C of global warming level and above (IPCC, 2021).
Conversely, in northeastern South America, there is high confidence in a dominant increase in drought duration. However, the intensity and frequency of extreme precipitation and pluvial floods are projected to increase (medium confidence) for 2°C of global warming level and above (IPCC, 2021).
Another concern of cities related to temperature increase, extreme variability of rainfall and population growth in urbanized areas is the occupation of floodplain close to urban rivers. Many cities have expanded over floodplain areas, channeling rivers and occupying its springs. Consequently, these areas became potentially dangerous spaces, especially in the rainy season, and the existing drainage network is insufficient to drain rainwater during more intense precipitation events in short periods of time, causing severe landslides and flooding disasters.
The occupation of low-income population, in general, occurs in high slope floodplains at river spring areas. This situation worsens the problem, compromising water resources preservation due to lack of sanitation infrastructure and untreated sewage discharges into the rivers, in addition to the degradation of native vegetation. In rain events, even not necessarily characterized as intense events, the risks of landslides in these areas are still high.
Several national and international studies focus on the problem of vulnerability in large metropolitan regions and their municipalities, such as the metropolitan regions of São Paulo (Nobre et al., 2011; Valverde, 2017; Marengo et al., 2020), Rio de Janeiro (Prosdocimi and Klima, 2020) and Campinas (Cavalcanti et al., 2017). Urban floods are one of the main climate-related disasters that cause numerous fatalities every year around the world, with high costs associated to its damages (Han and Sharif, 2021).
Studies on climate projections have been carried out by different authors to assess changes in precipitation and temperature intensities over different regions and states in Brazil (Marengo et al., 2013; Cavalcanti et al., 2017; de Godoy et al., 2021). For the state of São Paulo/Brazil, de Godoy et al. (2021) used the Regional RegCM4 model and the RCP8.5 emissions scenario for the period 2080–2100, in order to evaluate three indexes of climatic extremes (consecutive dry days—CDD, rainy extremes—R95p and heat wave duration—HWD). The authors identified São Paulo inland area as the most susceptible region to consecutive dry days and extreme rainfall, while heat waves show a more relevant sign of increase in the south and east of the state, during the winter.
In Rio de Janeiro/Brazil, a study to analyze the projection of precipitation and temperature using the regional model EtaHadCM3/INPE was carried out by Dereczynski et al. (2013). The authors identified an increase in the frequency of occurrence and the amount of rainfall associated with heavy rainfall until the end of the 21st century, as well as longer dry periods and shorter rainy seasons. Regarding temperature, the average change in annual maximum and minimum air temperatures may vary, respectively, between 2, 5, 2, and 4°C above current climate values until the end of the 21st century.
A recent study carried out for the Metropolitan Region of Vale do Paraíba, in the state of São Paulo, used high resolution models of CMIP6 for two emission scenarios (SSP2-4.5 and SSP5-8.5). The results showed a consensus for all models used, with significant increase trends in temperature over the period 2015–2100. Sub-region 3—Guaratinguetá is expected to present the highest warming of 4.8°C for the most extreme scenario (SSP5-8.5). Regarding precipitation, there was no consensus by the models, only the MPI-ESM1-HR for the SSP2-4.5 scenario showed a significant upward trend in the period 2041–2070 in Sub-regions 1—São José dos Campos and 4—Cruzeiro (Bosco and Valverde, 2022).
Adaptation or mitigation measures against climate change are still modest in the municipalities in Brazil or even absent at the local level, as they include policies to be implemented through the city's master plans, requiring investment and commitment from the government and the population. However, each municipality needs to be aware of the impacts of its vulnerabilities and extreme climate threats to develop strategies to build its adaptation and resilience plans in the face of climate change.
This study aims to evaluate the climate projections of precipitation and air temperature for seven cities in the Metropolitan Region of São Paulo (RMSP), which make up the ABC Region, based on high-resolution climate models. The study also investigates the existence of an adaptation plan for climate change in the cities of ABC Paulista.
2. Methods
2.1. Study area
São Paulo's ABC Region (ABC Paulista), a southeastern sub-region of São Paulo Metropolitan Region (RMSP), is considered one of the largest industrial centers in the area, consisting of seven municipalities: Mauá (MA), São Bernardo do Campo (SBC), Santo André (SA), São Caetano do Sul (SCS), Diadema (DIA), Ribeirão Pires (RP) and Rio Grande da Serra (RGS). The region has a population of 2,825,048 inhabitants, according to the Brazilian Institute of Geography and Statistics (IBGE, 2021). Part of its territory has a high urban density, and a high population growth rate (56%), and another part consists of environmental protection areas (Moro Junior, 2007). Table 1 summarizes the demographic characteristics of the municipalities of ABC Paulista.
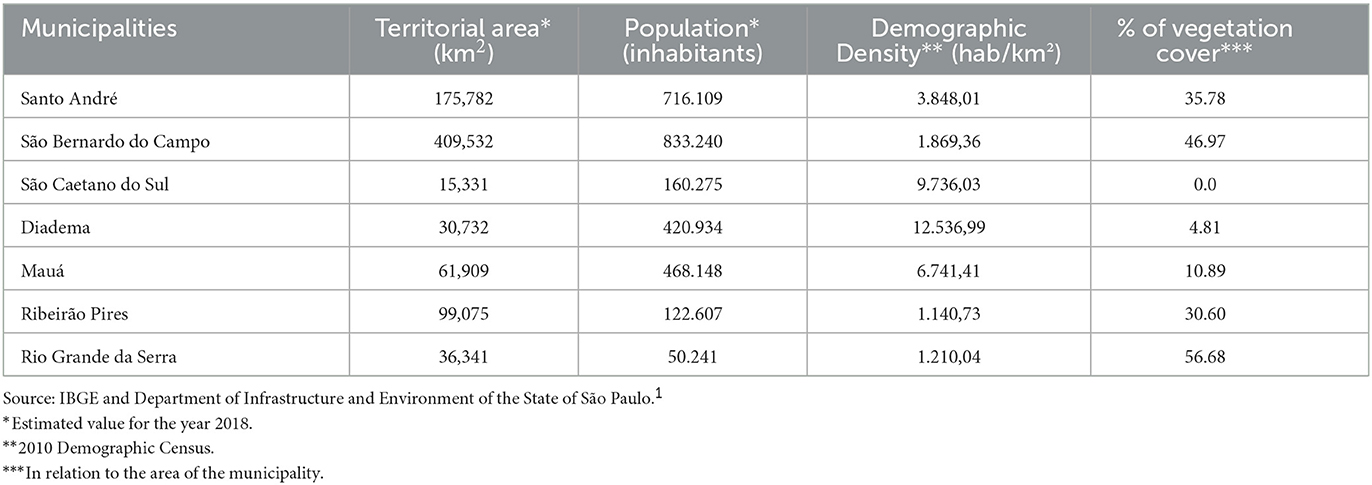
Table 1. Demographic and territorial characteristics of ABC Paulista's municipalities.
ABC Paulista (Figure 1) is historically marked as a highly industrialized area and the first center of the Brazilian automobile industry. In addition, the region is home to several automobilist manufacturers, such as Mercedes-Benz, Ford, Volkswagen, General Motors and others, also to the Capuava Petrochemical Complex and 14 more oil refining industries at the boundary between Santo André and Mauá. However, the service sector in ABC currently has grown significantly in comparison to the industrial sector. The number of companies in the service sector exceeds the industrial sector and, therefore, the same trend is seen regarding the number of employees. According to Sampaio (2015), although the industry in the ABC region has lost relative significance, it remains the most dynamic sector of the local economy, emphasizing the transport industry chain.
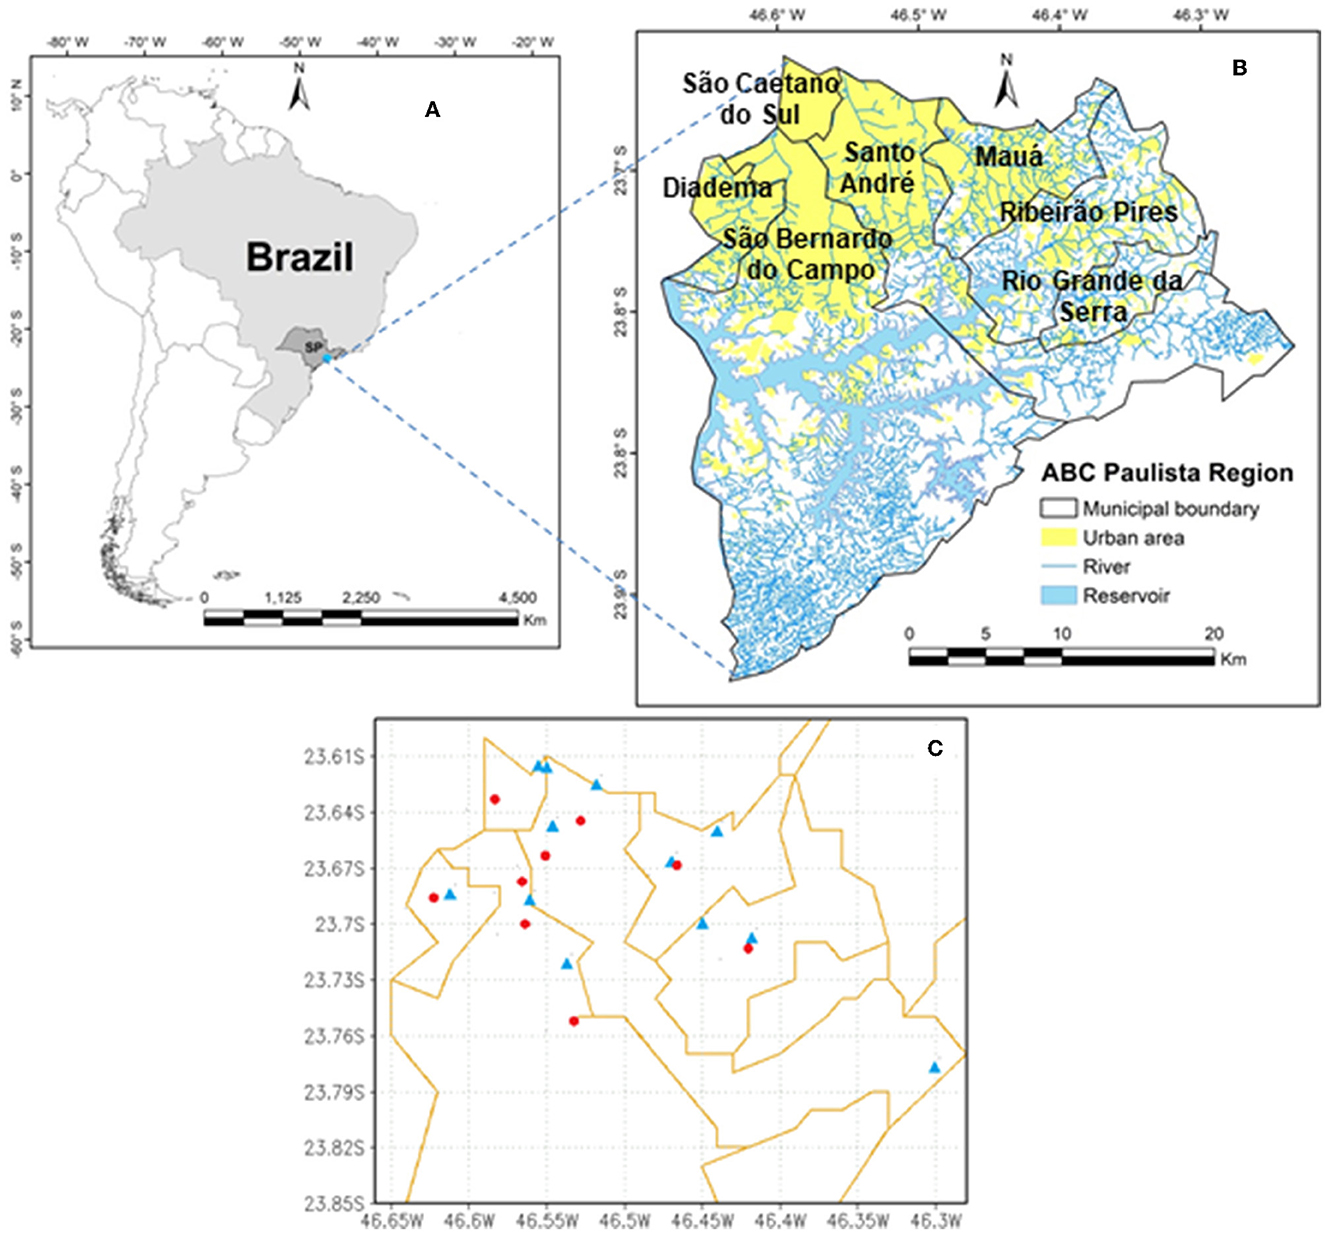
Figure 1. Map of Brazil (A) and the location of the ABC Paulista region (B). Map with the location of measuring points (C) used: in blue the rain gauges and in red the weather stations.
Regarding hydrography, the Tamanduateí River, an affluent of the Tietê River, is the main waterbody in the urban region of ABC Paulista and drains an area of ~43 km2. This area is largely urbanized, with high population density and industrial concentration, with few spaces for natural water soil infiltration. As a result, practically all precipitation converges to Tamanduateí River channel and tributaries that, in the rainy season, do not support rainwater flow, causing frequent flooding (Valverde et al., 2020).
ABC Paulista municipalities also have houses in areas with environmental constraints, such as precarious settlements (for example, slums and irregular settlements). Denaldi et al. (2016) observed that 56% of these settlements occupy Permanent Preservation Areas (APP), and 27% are located in areas of springs, in addition to having households in risk areas in the seven municipalities of ABC Paulista. Its risks include landslides, undermining stream banks, and urban flooding.
2.2. Data
Daily data of air temperature data from 13 automatic meteorological stations (AMS) were used, managed by the São Paulo Flood Alert System—SAISP (2014–2021 period), Santo André Municipal Environmental Sanitation Service—SEMASA (period 2011–2021) and the Federal University of ABC (2018–2021) were used. Also, daily data from 11 rain gauges were used, preferably distributed in urban areas of the study region (Figure 1C), for the period 1999–2021 (23 years) and provided by the Department of Water and Electricity (DAEE) and by the Center for Monitoring and Alert of Natural Disasters (CEMADEN).
For the assessment of warming scenarios and climate projections, this study selected TerraClimate database and two climate models with high spatial resolution, suitable for capturing spatial variability of atmospheric variables at regional and municipal scales.
TerraClimate is a monthly-scale climate and water balance dataset which comprises the data period of 1958–2021 for the historical series. TerraClimate combines high spatial resolution climatological normals from the WorldClim dataset, CRU Ts4.0 data, and the Japanese 55-Year Reanalysis (JRA55) (Abatzoglou et al., 2018). These data have a spatial resolution of 4 km and provide vital information for ecological, hydrological, and climatic studies that require high spatial resolution data. They also provide 2 °C and 4 °C warming scenarios levels (SWL2.0 and SWL4.0) (Qin et al., 2020).
Specific Warming Level (SWL) represents the anomaly variation of global mean surface temperature concerning the pre-industrial period. In this regard, the acronyms SWL2.0 and SWL4.0 represent the period in which the average global temperature increases by 2 and 4°C, respectively, above pre-industrial levels (Bärring and Strandberg, 2018).
Terra Climate warming-level scenarios were constructed based on climate projections from 23 CMIP5 climate models for two 30-year periods, the pre-industrial period (1850–1879), using the historical forcing experiment, and the period that represents the end of the 21st century (2070–2099), using the emissions scenario RCP8.5. More details on the construction of the warming scenarios can be found in Qin et al. (2020).
Two models were used in this study: (a) the high-resolution regional climate model Eta-HADGEM2_ES, which considers the CMIP5 global model (HADGEM2_ES) as a boundary condition, and (b) the high-resolution global model CNRM-CM6-1-HR of CMIP6.
The Eta-HADGEM2_ES model (Chou et al., 2014a) is derived from the ETA regional climate model, with boundary conditions from the Met Office Hadley Center's global model, called Hadley Center Global Environmental Model version 2 (HADGEM2-ES) (Collins et al., 2011).
The simulation of the regional climate model was generated by the Center for Weather Forecasting and Climate Studies/National Institute for Space Research (CPTEC/INPE) and published on the Platform for Climate Change Projections for South America regionalized by the ETA model (PROJETA) (Chou et al., 2014a,b; Lyra et al., 2017). The Eta-HADGEM2_ES model has a spatial resolution of 5 km, a historical period of 1961–2005, and future projections for the 2006–2099 periods in the emission scenarios RCP 4.5 and RCP 8.5.
The Radiative Forcing or Representative Concentration Pathways (RCP) is expressed in the unit of watts per square meter (W/m2) and represents a net change in the energy balance of the Earth system due to disturbances, known as a good measure of change in the Earth's surface temperature (Van Vuuren et al., 2011).
The European climate model CNRM-CM6-1-HR from the National Center for Meteorological Research and the European Center for Research and Advanced Training in Scientific Calculus (CNRM-CERFACS) has high spatial resolution of 50 km. For this model, the Shared Socioeconomic Pathways (SSP) 4.5 W/m2 and 8.5 W/m2 (SSP2-4.5 and SSP5-8.5) emission scenarios were used, which are part of a new scenario framework created to facilitate the integrated analysis of future climate impacts, vulnerabilities, adaptation and mitigation (Riahi et al., 2017).
The SSP2 scenario describes a path where social, economic, and technological trends do not change markedly from historical patterns. However, development and income growth proceed unevenly and must face medium challenges to mitigation and adaptation. SSP5 is based on a high dependence on fossil fuels, which results in higher CO2 emissions, rapid technological progress, and human capital development. As a result, it must face high challenges for mitigation and common challenges for adaptation due to economic development (Riahi et al., 2017).
2.3. Methods
Quality control for observed temperature and precipitation data series from the seven municipalities of ABC Paulista was carried out, verifying gaps or doubtful daily data through a consistency analysis. Then, gaps and inconsistent data were filled using the Tabony (1983), which uses a minimum of 3 neighboring stations to calculate missing data (Valero et al., 1996).
To evaluate the historical simulations of the ETA_HadCM3, CNRM-CM6-1-HR models, and the TerraClimate dataset, observed monthly data of atmospheric variables were used to verify the annual cycle of the variables and their seasonal distribution, considering the urban area of ABC Paulista.
Observed data available for a series of 23 years (1999–2021) were used to validate precipitation. The database corresponding to 2011–2021 was used for the air temperature.
Subsequently, the mean BIAS, the agreement index d and a weighted version of the coefficient of determination (wr2) were calculated.
The BIAS (Mean Error), which quantifies the systemic error of the model:
where Pi represents the model output, Oi is the observation for a given time scale (i), and Mtotal is the number of years (or months) analyzed. BIAS gives an idea of the average deviation from the model results to observed data, either positive or negative. When positive or negative, the model tends to overestimate or underestimate the variable, respectively.
The agreement index d was proposed by Willmot (1981), and it represents the ratio of the mean square error and the potential error (Willmot, 1984), defined as:
Pi represents the model output and Oi is the observation for a given time scale (i). O is the average value of the observations for the analyzed period.
The potential error in the denominator of equation 2 represents the highest value that the squared difference of each pair can achieve. The range of d is similar to r2 and lies between 0 (no correlation) and 1 (perfect fit) (Krause et al., 2005).
The study used the weighted coefficient of determination because using only the coefficient r2 would not be an adequate measure of performance, as a poorly performing model could still achieve a high value of r2 (Legates and McCabe, 1999; Krause et al., 2005).
To overcome this limitation, the methodology used included the slope parameter (b) of the linear regression equation between the observations and the simulations of the models to weight r2, with the value of wr2 varying from 1 (optimal value) to zero (Krause et al., 2005; Alghamdi, 2020) (Eq 3).
The evaluated points from the climate models (ETA_HadCM3/CNRM-CM6-1-HR) and TerraClimate correspond to the central location points of each municipality in the urban area, which made it possible to compare with the data from the meteorological stations also located in the urban area.
After validating the climate models and TerraClimate, the BIAS was corrected to remove the average systematic error using the Direct Approach method.
Several studies used this method to verify its effectiveness (Lenderink et al., 2007; Oliveira et al., 2015; Silva and Valverde, 2017; Calado and Valverde, 2020). In this method, the adjusted climate variable is obtained directly from the climate model simulation, promoting variations in magnitude according to the differences verified in the past between the simulated/estimated climate variable and the observed climate variable. This technique can be expressed mathematically, on a monthly scale, according to Eq 4:
where K is the corrected value of the climate variable in the evaluation period (t); K corresponds to the uncorrected value of the climate variable in the evaluation period (t); represents the monthly average of the model's climate variable in the control period; and is the average monthly value of climate variable observed for the control period.
After verifying the monthly error (BIAS) removal from the climate simulations, the correction factor obtained through the Direct Approach was applied to fit future projections.
The correction of future projections and the SWLs aims to minimize the uncertainties of the systematic errors found in the model's current climate simulation and the projections to eliminate the error associated with climate modeling (Oliveira et al., 2015). However, corrections in precipitation and temperature imply considerable simplifications, since the same BIAS recorded in the past is assumed to be observed in the future, when the seasonal average variations of the observed data series are considered (Lenderink et al., 2007). However, it is essential to emphasize that the systematic errors are not related to the uncertainties derived from the concentrations of greenhouse gases that the emission scenarios (RCP4.5, RCP8.5, SSP2-4.5, and SSP5-8.5) project for the future.
3. Results and discussion
3.1. Precipitation and temperature observed in the municipalities of ABC Paulista
Table 2 shows the monthly average values of maximum (Tmax) and minimum (Tmin) temperature and precipitation (PPP) for the seven municipalities of ABC Paulista.
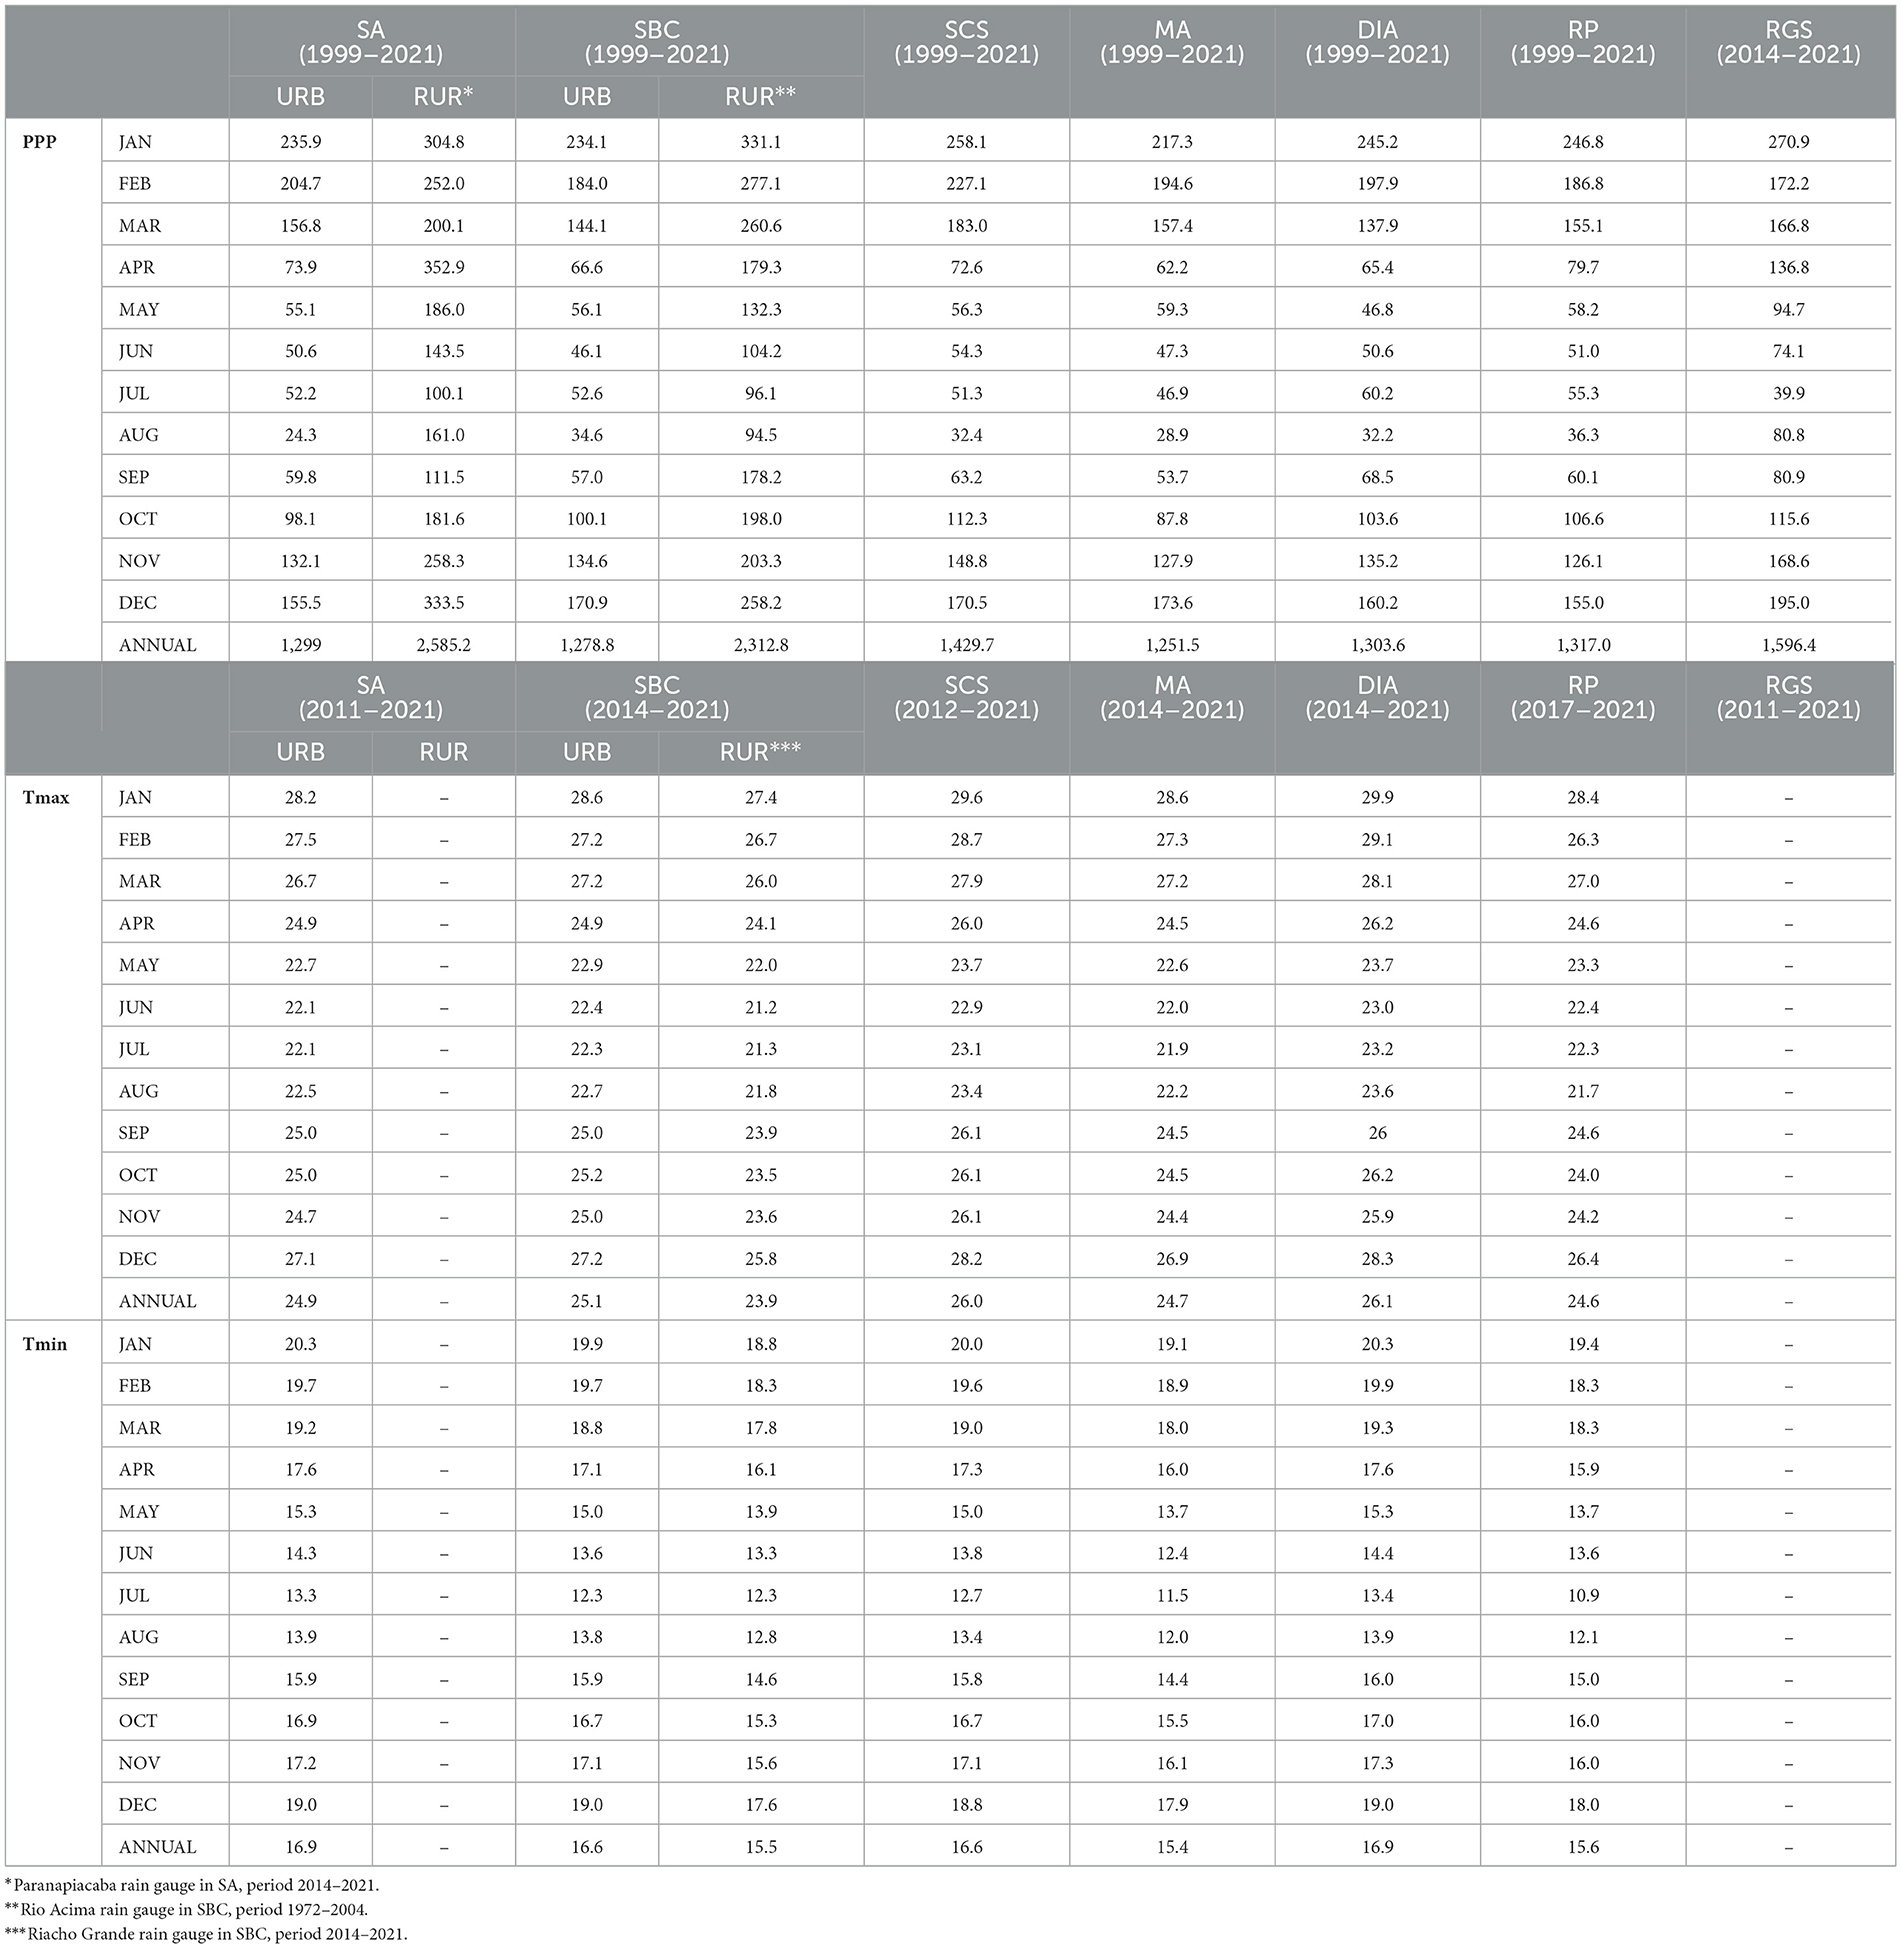
Table 2. Mean monthly precipitation and temperature values for the municipalities of ABC Paulista.
For precipitation, the most recent period of the data series, 1999–2021 (23 years), was considered for almost all municipalities except for Rio Grande da Serra (2014–2021). The monthly rainfall for each municipality was represented based on the average value of two rain gauges in the municipalities' urban area, except Diadema (Figure 1), which only has one rain gauge with available data.
For temperature, data from a meteorological station were obtained to represent the average conditions of the municipalities with different periods (Table 2). The municipality of Santo André (2011–2021) shows the most extended time series, and Ribeirão Pires is the shortest (2017–2021).
Santo André and São Bernardo do Campo must be highlighted because their territorial limits have ~50% of environmental preservation areas (Figure 1), which characterizes different climatic conditions. Also, Ribeirão Pires and Rio Grande da Serra have most of their territorial limits in protected areas of water springs.
A standard period was selected to compare the municipalities' monthly average temperature and rainfall. For the Tmax and Tmin, the period 2014–2021 was selected and the seasonality was verified for all municipalities, identifying the hottest (January and February) and coldest months (July and August).
Diadema and São Caetano do Sul show the highest average Tmax values in January and February. For Tmin, the municipalities of Ribeirão Pires and Mauá show the coldest values in July (Table 2).
The Tmax boxplot diagram (Figure 2) shows a large dispersion (Inter-quartile range) between the values, mainly in January, February, and October, which stands out on Diadema, and São Caetano do Sul with the highest upper whiskers. November shows little dispersion, and outliers were observed only in the autumn and winter.
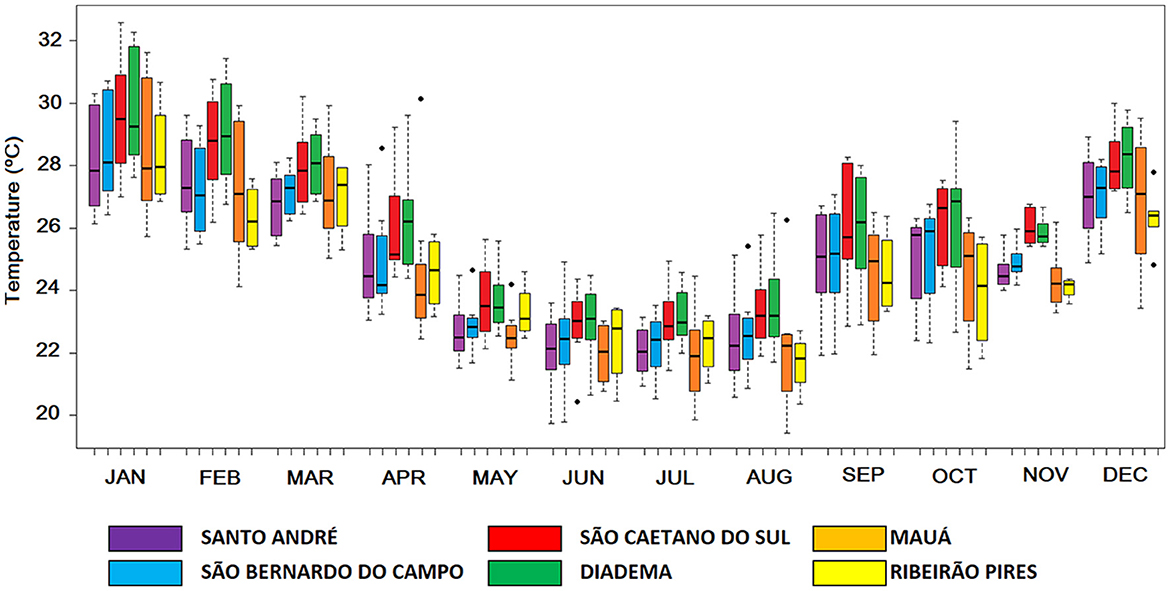
Figure 2. Seasonal boxplot diagram of maximum temperature for the average period 2014-2021 at the municipalities of ABC Paulista. The horizontal lines of the box express the values of the 25th (lower quartile), 50th (median), and 75th (upper quartile) percentiles. The Upper Whiskers (lesser than the 75th percentile) and Lower Whiskers (greater than the 25th percentile) represent the maximum and minimum values, respectively. • correspond to outliers or extreme values in a data set.
The lowest interquartile interval in November may be associated with low average TMAX variability throughout the series analyzed for this month. Unlike the other months of spring (September and October), which tend to be less rainy and warmer, they also have a higher frequency of heat waves. In 2020 and 2015, heat wave events reached the state of SP (Valverde and Rosa, 2023), and the municipalities of ABC Paulista were hit (Valverde, 2021), resulting in higher TMAX averages compared to the other years. These variations influenced the highest interquartile Tmax range, as observed in Figure 2.
The Tmin boxplot diagram (Figure 3) showed less value dispersion in the summer than the Tmax. However, higher dispersion occurred in the winter months, in addition to outliers in December in all municipalities.
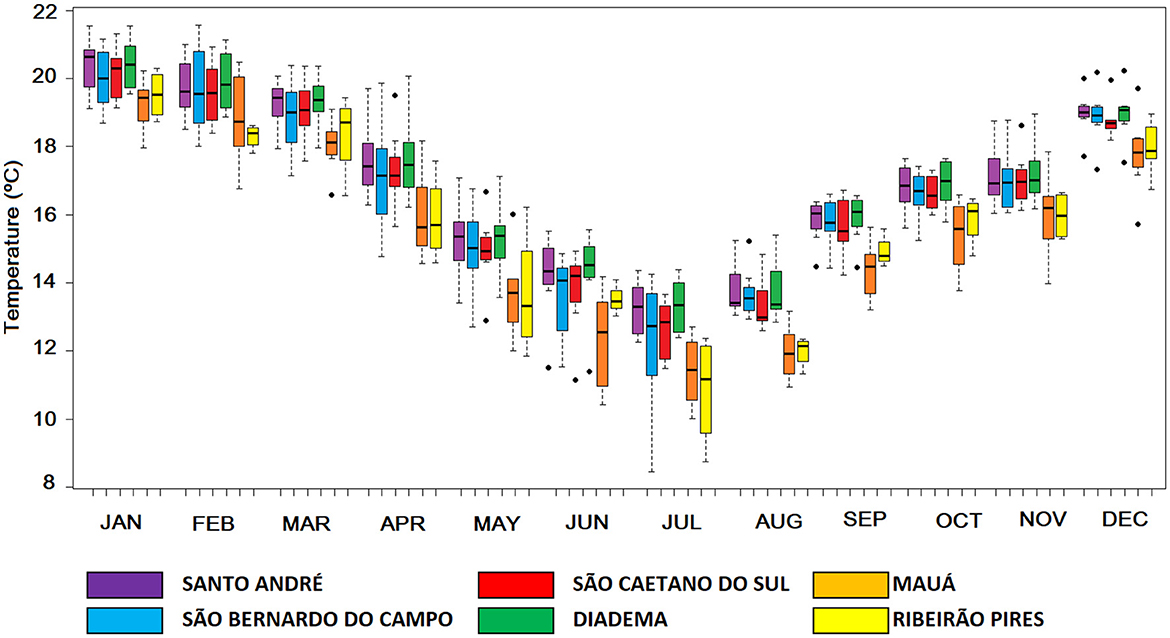
Figure 3. Seasonal boxplot diagram of minimum temperature for the average period 2014–2021 at the municipalities of ABC Paulista. The horizontal lines of the box express the values of the 25th (lower quartile), 50th (median), and 75th (upper quartile) percentiles. The Upper Whiskers (lesser than the 75th percentile) and Lower Whiskers (greater than the 25th percentile) represent the maximum and minimum values, respectively. • correspond to outliers or extreme values in a data set.
The average monthly rainfall for 1999–2021 in the urban area of ABC municipalities is shown in Figure 4. The boxplot diagram identifies the seasonal pattern, with the wet season on hottest months (December to March). January is the month of maximum rainfall, and the month of minimum rainfall (May to August) is August. São Caetano do Sul stands out with the highest monthly values for accumulated rainfall in the summer (January, February and March) and spring (October and November). The highest average monthly values were found in SCS (258.1 mm), RP (246.8 mm), and DIA (245.2 mm). Santo André (24.3 mm) and Mauá (46.1 mm) had the lowest average monthly values in August (Table 2).
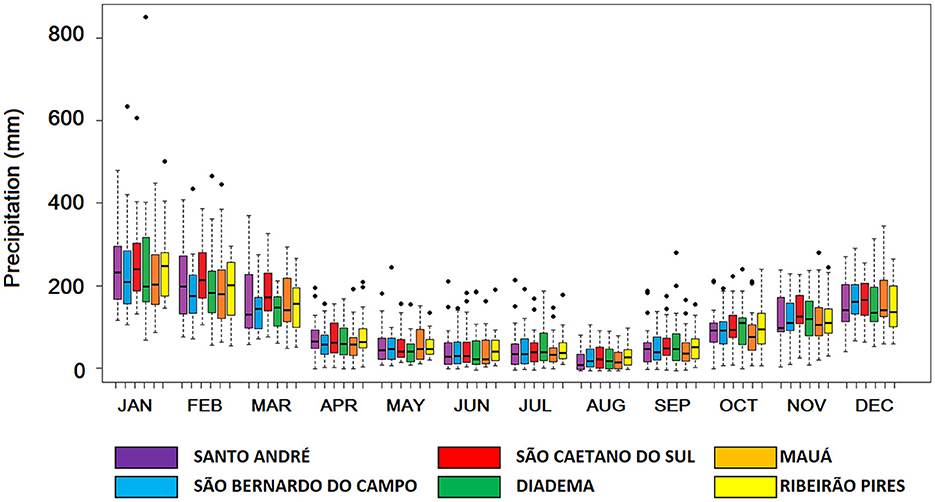
Figure 4. Seasonal boxplot diagram of average monthly rainfall in the period 1999–2021 for the municipalities of ABC Paulista. The horizontal lines of the box express the values of the 25th (lower quartile), 50th (median), and 75th (upper quartile) percentiles. The Upper Whiskers (lesser than the 75th percentile) and Lower Whiskers (greater than the 25th percentile) represent the maximum and minimum values, respectively. • correspond to outliers or extreme values in a data set.
The annual averages in São Caetano do Sul (1,429.7 mm) and Ribeirão Pires (1,317.0 mm) showed the highest values for the analyzed period (1999–2021).
The rains are more abundant in the environmental preservation areas of SA, SBC, and Rio Grande da Serra (Table 2) than in urban areas. Therefore, they follow a different dynamic due to the extensive vegetation and water reservoir areas of the Billings dam, which contributes moisture to the atmosphere through evapotranspiration and evaporation, which influences the formation of rain clouds.
São Caetano do Sul and Diadema showed the highest accumulated precipitation in summer and spring. These municipalities also have the highest average, maximum and minimum temperatures with slight differences.
The boxplot diagram for precipitation (Figure 4) shows a high dispersion of monthly rainfall, mainly in January and February. Diadema, São Bernardo do Campo, and São Caetano do Sul had the highest outliers in January. The months from April to July and September to October show outliers in almost all municipalities.
São Caetano do Sul had the highest accumulated rainfall in autumn, followed by Ribeirão Pires. Diadema shows the highest monthly rainfall in winter, with a minimal difference compared to Ribeirão Pires. The lowest minimum temperatures were recorded in Ribeirão Pires in winter, specifically in July (10.9°C).
Due to the short series availability for precipitation and temperature data, it was impossible to evaluate trends, but the annual variability was analyzed. For precipitation, considering the period 1999–2021, 2010, and 2009 were the ones with the highest rainfall accumulation, in almost all municipalities (urban areas), mainly in the summer and the annual accumulated. The outliers identified in the boxplot diagram in all cities occurred in 2010. That year, there was a high frequency of flooding and landslide events in the municipalities of ABC Paulista (Fernandes and Valverde, 2017; Valverde, 2017; Damasceno et al., 2021). The most significant outlier occurred in 2010 (Figure 3).
In 2014 was recorded the lowest accumulated rainfall in all municipalities. São Paulo suffered one of the most severe droughts in 2014, causing an unprecedented water crisis (Coelho et al., 2015; Milano et al., 2018). The region where is located the Cantareira Water Production System, which supplies the Metropolitan region of São Paulo (MRSP) with treated water, experienced a rainfall deficit with extreme values (below the 10th percentile for a data series from 1948 to 2015), which had not been detected since 1968 and 1969 (Calado et al., 2019).
For the urban area of the municipalities, 2014, 2015, and 2019 recorded the highest values of Tmax. For Tmin, 2015 and 2019 showed the highest values. In the Riacho Grande region in São Bernardo do Campo, an environmental preservation area, 2019 had the highest Tmax and Tmin values.
Other studies have analyzed rainfall in the municipalities of ABC Paulista, considering longer time series (Fernandes and Valverde, 2017; Valverde, 2017; Valverde et al., 2018) and grouping data series from nearby rain gauges for analysis of trends and variabilities. Valverde et al. (2018), analyzing two series of data from 1968–1998 to 1999–2014, identified an increase in rainfall in January in Diadema, São Caetano do Sul, São Bernardo do Campo, and Santo André, accompanied by a reduction of annual rainfall from one period to another.
Valverde (2017) analyzed climate indices from the Commission for Climatology World Climate Research Program—Climate Variability and Predictability (CCl/CLIVAR/JCOMM) CCI CLIVAR using daily data from the municipalities of ABC Paulista for the period (1972–2014). The results showed positive trends with an increase in the number of days with rain higher than 50 mm (R50 mm), in all municipalities, with Mauá and Diadema showing the highest number of days with rainfall of these intensities. The PRCPTOT index, representing the annual accumulated rainfall, showed decreasing trends in almost all municipalities (except Santo André). The author highlighted that the decrease in the annual rainfall should not necessarily be related to a reduction in the R80 mm, R50 mm, and RX1day indexes since extreme events of daily rain or consecutive days can also happen in years when annual precipitation is lower than average. In this situation, rainfall can be concentrated in a few short periods and, thus, be so intense that it can cause disasters.
In this context, for a more recent period of years, as analyzed in this study (1999–2021), Diadema continues to present the highest monthly and annual accumulated precipitation, with significant outliers, mainly for the summer months. São Caetano do Sul is the second municipality with the highest accumulated rainfall.
Many studies have already verified the direct relationship between the extremes of heavy rain and the occurrence of flooding and landslide events in the most vulnerable areas in the municipalities of ABC Paulista (Molina et al., 2015; Fernandes and Valverde, 2017; Valverde, 2017; Valverde et al., 2018; Damasceno et al., 2021).
Concerning temperatures in ABC Paulista's urban area of the municipalities, a study on the urban climate in this region identified medium-intensity heat islands with more extreme values in spring and summer in cities with a greater demographic and urban density (São Caetano do Sul and Diadema) (Valverde et al., 2020). This study is aligned with the results found in Valverde et al. (2020), as these same municipalities had the highest average and maximum temperatures compared to the other municipalities.
3.2. Warming scenarios and future climate projections for ABC Paulista
The changes in precipitation and temperature in the context of climate change were identified through: (a) TerraClimate simulations for two levels of warming (SWL2°C and SWL°4C), (b) a high-resolution regional climate model Eta-HADGEM2_ES, which consider the CMIP5 global model (HADGEM2_ES) as a boundary condition, and (c) a high-resolution global model of CMIP6, CNRM-CM6-1-HR.
All simulations were validated with observed data and later adjusted by removing the BIAS, as explained in the methodology. Observed data available for a series of 23 years (1999–2021) were used to validate precipitation. The database corresponding to 2011–2021 was used for the air temperature.
3.2.1. TerraClimate—warming levels
The TerraClimate database was validated for the historical period of the observed data series, applying the validation metrics: BIAS, coefficient of determination, weighted coefficient of determination and index of agreement d.
The results showed that TerraClimate correctly simulates precipitation seasonality, identifying the wettest and driest months but overestimating precipitation as demonstrated by the BIAS for the monthly scale (Table 3). Ribeirão Pires had the highest BIAS (1.81 mm/day) and SCS the lowest (0.39 mm/day). The coefficient of determination (r2) and the index of agreement (d) showed the highest values in SCS.
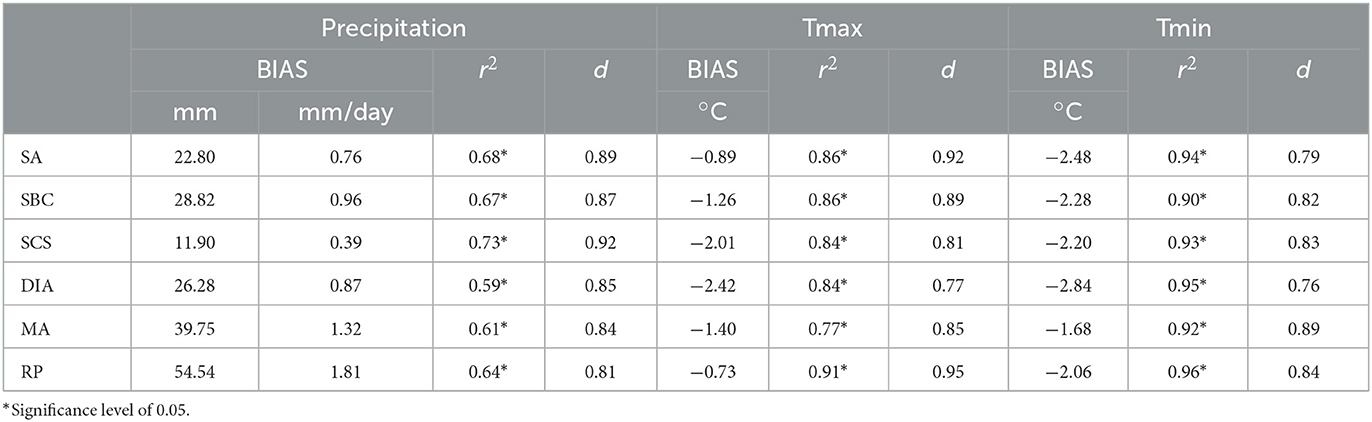
Table 3. Validation metrics for TerraClimate precipitation and temperature data series on a monthly scale, for the period 1999–2021 and 2011–2021, respectively.
In opposition, the temperature was underestimated, where Tmin shows the highest values of BIAS when compared to the Tmax. Diadema showed the most negative BIAS value for Tmax (−2.42°C) and a low value of d (Table 3). For Tmin, the municipalities of SA and DIA had the most negative values of BIAS and d (Table 3). Mauá showed a minor underestimation (−1.68°C).
The simulations of climate models and databases derived from Reanalyses, such as TerraClimate, always have limitations. These so-called systematic errors depend on how the processes that define the atmospheric systems are represented, involving issues related to spatial resolution and model complexity, parameterizations, choice of the model domain, application of boundary conditions, and even the uncertainty of the observed data (Flato et al., 2013).
For this reason, models must be validated. The most straightforward way to evaluate the model is to compare its output with observed data and analyze the resulting difference—the metrics used in this study help identify these errors.
Flato et al. (2013) analyzed the average annual surface air temperature (at 2 m) for the average of all available CMIP5 models, and the error related to a reanalysis of the ERA-Interim was around 2°C. However, it has also been found that the biases are much more significant in several locations, particularly at high elevations over the Himalayas and parts of Greenland and Antarctica, near the ice edge in the North Atlantic and regions of oceanic upwelling. Giorgi and Mearns (1999) reported that for precipitation, an acceptable error should be in the range of 5–30% concerning its climatological value.
A recent study analyzed the performance and calibration of climate variables derived from the TerraClimate dataset using automatic weather stations (AWS) for Brazil. The results showed that TerraClimate underestimated the air temperature and evapotranspiration data while overestimating the precipitation data. For this reason, the calibration was executed and reduced the bias for under or overestimating the AWS data (Filgueiras et al., 2022).
The results of TerraClimate obtained in this study, considering a more regional scale, also overestimated precipitation and underestimated temperature. However, the resulting error values will depend on the database used to validate the model simulations and the analyzed region.
In any case, the estimates of these errors must be removed or corrected because of the model imperfections and the resulting systematic errors. The Direct Approach method was applied to remove the BIAS to minimize uncertainties (overestimates and underestimates) in TerraCimate simulations. After applying the Direct Approach, the correction factor was used in the data series for each warming level evaluated.
Figure 5 shows the Tmax anomaly concerning the historical period 1985–2015, for the 2 and 4°C warming levels for a seasonal scale, according to TerraClimate simulations, after removing the BIAS.
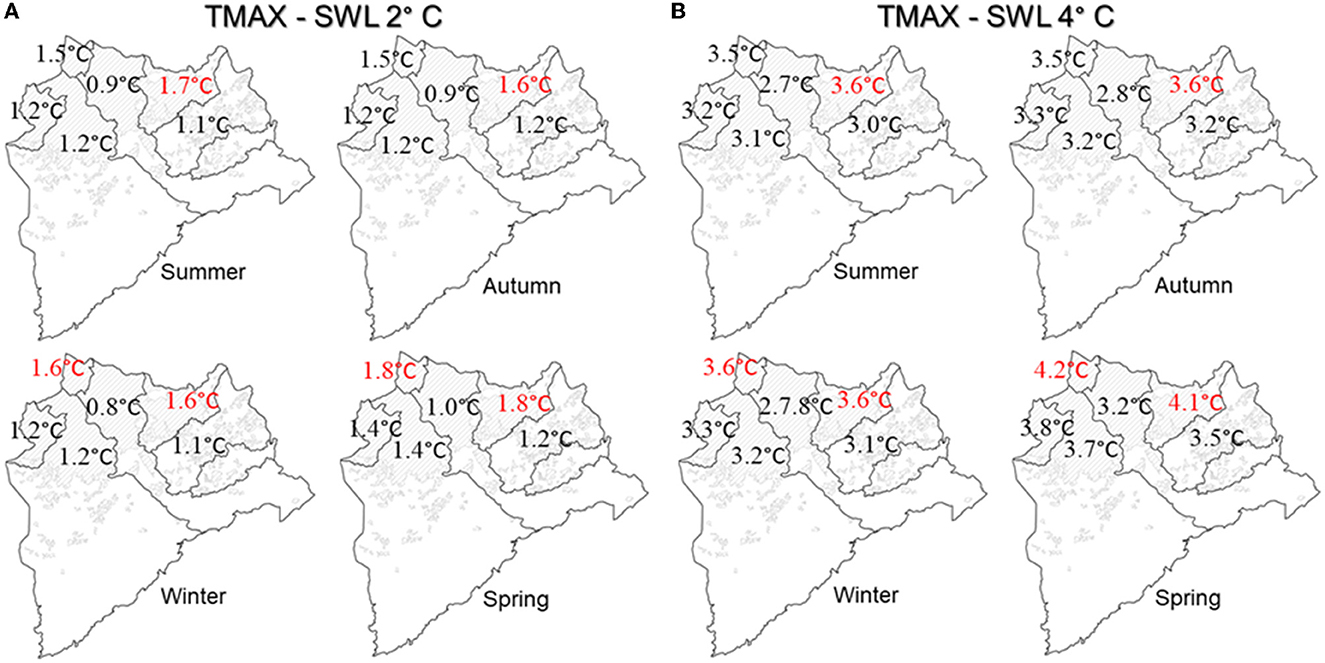
Figure 5. Specific warming levels for Tmax in the municipalities of ABC Paulista. SWL2°C (A) and SWL4°C (B).
Tmax anomalies are positive in all municipalities, and for the SWL2°C, no significant differences exist between municipalities and seasons. Mauá has the highest anomalies in all seasons, oscillating between 1.6°C (autumn) and 1.8°C (spring). SCS also stands out in winter and spring, with the highest anomalies. Santo André presents minor anomalies (Figure 5A).
The scenario is more critical for the SWL4°C (Figure 5B), and the positive anomalies reach values up to 4.2°C (in the spring in SCS). Mauá presents the highest positive anomalies in all year seasons, with the highest value in spring (4.1°C). São Caetano do Sul also stands out in winter and spring with anomaly values close to Mauá.
The Tmin at the SWL2°C (Figure 6A) shows positive anomalies close to the Tmax, and Mauá also stands out with the highest values followed by SCS. However, for the winter in Mauá, the positive anomaly reaches the value of 2°C.
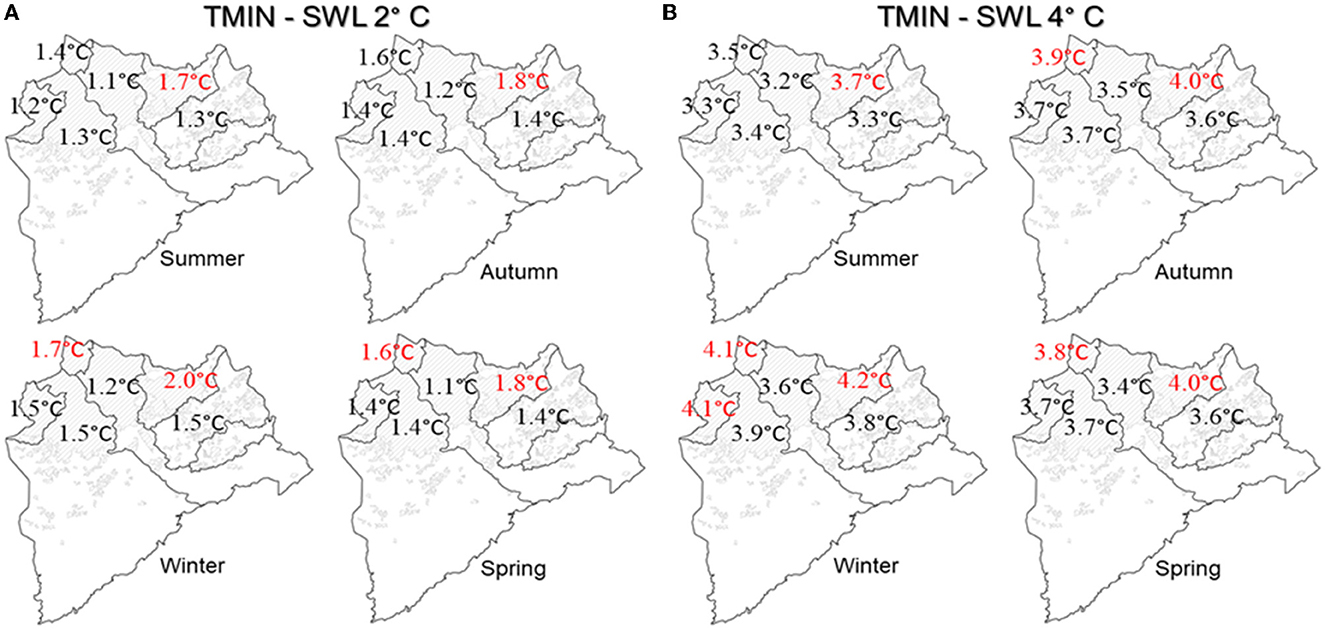
Figure 6. Specific warming levels for Tmin in the municipalities of ABC Paulista. SWL2°C (A) and SWL4°C (B).
For the SWL4°C, the positive anomalies for Tmin are more significant than Tmax's in all municipalities. Mauá continues to present the highest values among other municipalities, while in Santo André, the anomaly values are higher than Tmax. In winter, the MA, SCS, and DIA anomalies reach values of 4.1 and 4.2°C, respectively (Figure 6B).
Observed data showed that DIA and SCS had the highest temperatures (Tmax and Tmin). However, in the warming scenarios, only SCS stands out as one of the hottest municipalities. Mauá, one of the coldest municipalities, results as the hottest municipality for heating scenarios; that is, it will undergo the most remarkable changes in temperature compared to the other municipalities.
Figure 7 shows the precipitation anomaly in percentage, considering the historical period 1985–2015 according to the TerraClimate database. The results differed for each municipality, unlike the temperature, which always showed an increase.
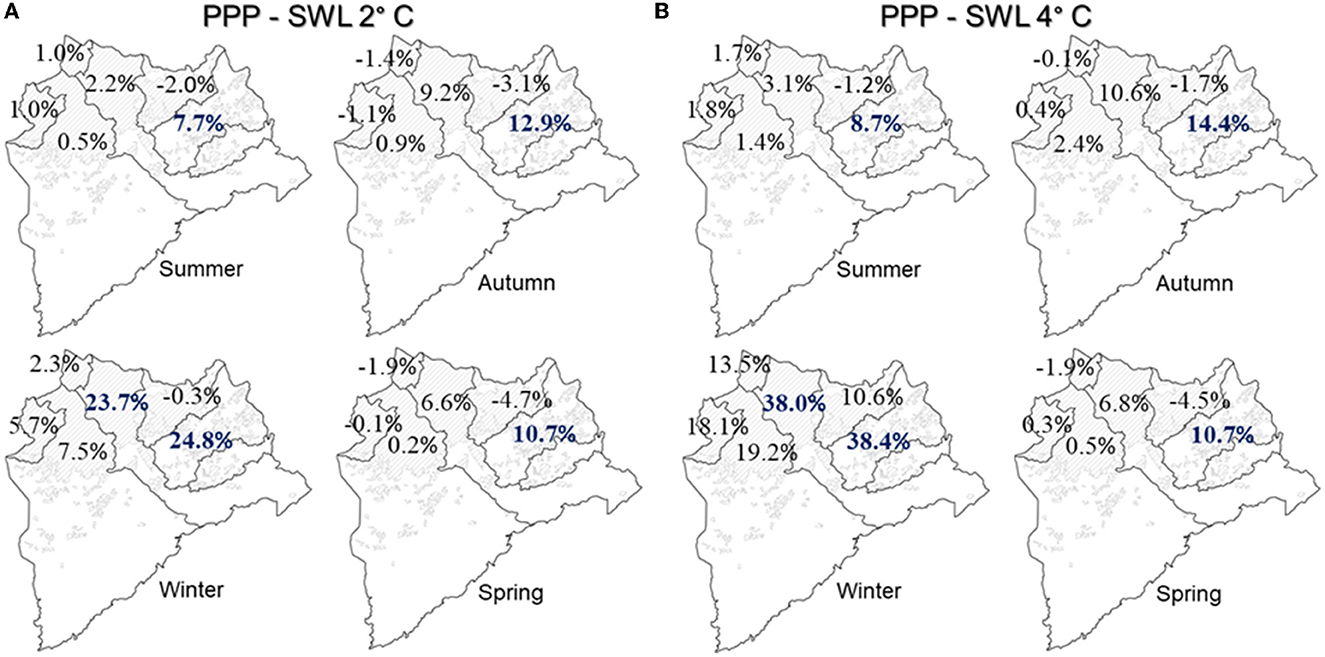
Figure 7. Specific warming levels for precipitation in the municipalities of ABC Paulista. SWL2°C (A) and SWL4°C (B).
Ribeirão Pires and Santo André show the highest percentages for precipitation increase (24.8 and 23.7%, respectively) in winter for SWL2°C (Figure 7A). Mauá showed a slight reduction in rainfall in all seasons of the year, and in the spring, it had the most considerable reduction (Figure 7B). Mauá also had the highest positive temperature anomaly in both SWLs (Figure 6).
In SWL4°C, Ribeirão Pires and Santo André continued with the highest positive values of precipitation increase, mainly in winter. In Mauá, there were precipitation reductions even with low percentages.
3.2.3. Future projections of precipitation and temperature
The regional climate model Eta-HADGEM2_ES and the global climate model CNRM-CM6-1-HR were used for future projections. The time slices analyzed were 2020–2040, 2041–2070, and 2071–2100.
3.2.4. Model Eta- HADGEM2_ES
The Eta-HADGEM2_ES model simulates the seasonal rainfall cycle with some shortcomings. The model identifies January and February as the rainiest, similar to what was observed. However, the lowest rainfall is simulated to occur in April, May, and June, unlike in June, July, and August. Thus, in these months, rainfall is overestimated by the Eta-HADGEM2_ES model, and each municipality has differences in these overestimates; in DIA and SCS, they are much higher.
Table 4 shows the precipitation BIAS on the monthly scale with positive values, except for the municipality of RP. The parameters d and wr2 in SCS have the highest value, indicating better performance in its simulation, despite presenting the highest overestimation; however, it captures the seasonal cycle better concerning the simulations for the other municipalities. On the other hand, RP had a negative BIAS.
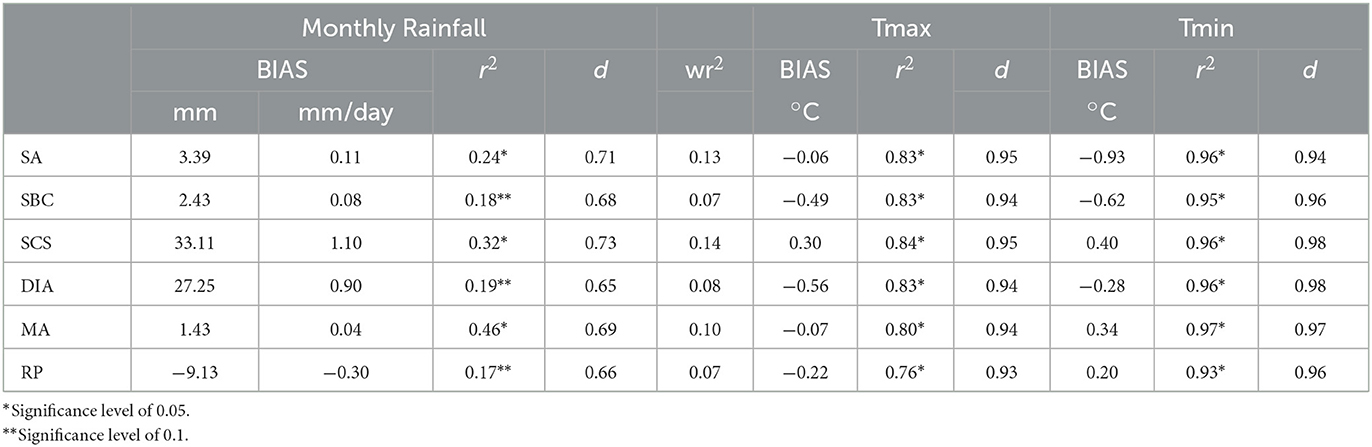
Table 4. Monthly average-validation metrics for Eta-HADGEM2_ES simulations of precipitation and temperature on monthly and annual scales, respectively, for the period 1999–2021 and 2011–2021, respectively.
The maximum and minimum temperatures were best simulated by the Eta-HADGEM2_ES model capturing the hottest and coldest months as observed. All municipalities show the parameters d and r2 with values above 0.8. In most municipalities, the BIAS of Tmax was low and negative, indicating slight underestimations (Table 4). In Tmin, SA, SBC, and DIA showed underestimates.
TerraClimate and Eta-HADGEM2_ES simulations show different results concerning the observations. For Tmax, both captured the seasonality of observed data and underestimated the values. However, TerraClimate had the highest negative BIAS (−2.42°C / Diadema). For Tmin, Eta-HADGEM2_ES showed low BIAS values, positive and negative, unlike TerraClimate, which in all municipalities showed negative BIAS, with values up to −2.84°C (Santo André). On the other hand, both had difficulty capturing the seasonal cycle for precipitation, and TerraClimate shows higher positive BIAS, indicating overestimates.
After validation, the Direct Approach method was applied to remove the BIAS of Eta-HADGEM2_ES model simulations, and the correction factor was applied for future projections in the RCP4.5 and RCP8.5 emission scenarios.
Figure 8 shows the average monthly temperature and precipitation anomalies for three-time slices and two emission scenarios. For Tmax, under the RCP4.5 scenario (Figure 8A), the temperature anomalies exceed 2°C for the nearest future (2020–2040), reaching up to 4°C (SCS) in 2071–2099. The difference among the municipalities is minimal, but SCS shows the most significant anomaly (up to 7.4°C) for 2071–2099 under the RCP8.5 scenario.
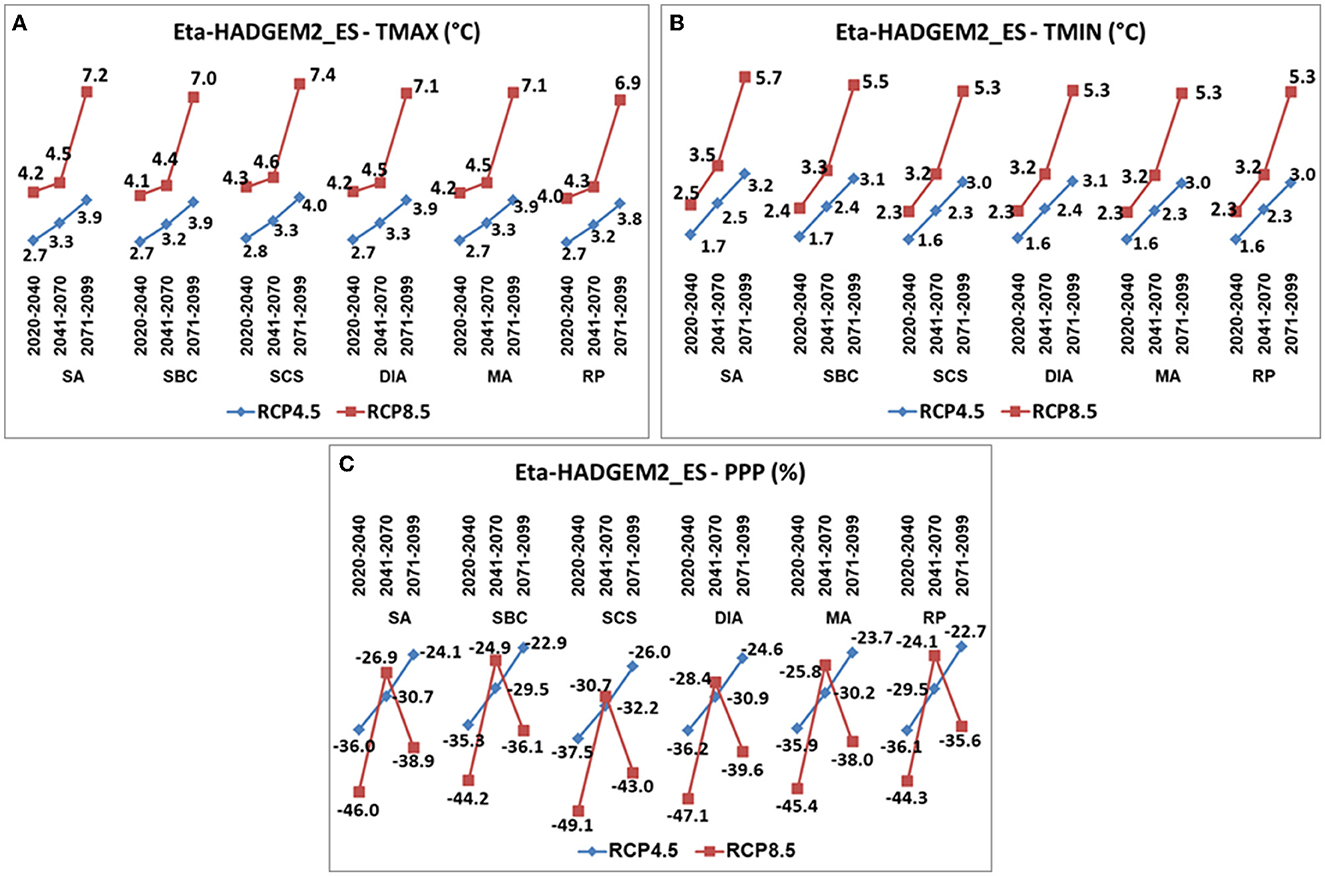
Figure 8. Maximum (A) and minimum (B) temperature and precipitation (C) anomalies on the annual scale for the three-time slices, two emission scenarios, in the six municipalities of ABC Paulista.
Tmin anomalies are minor when compared to Tmax. For the near future (2020–2040), the positive anomalies oscillate between 1.6 and 1.7°C (SA and SBC) in the RCP4.5 scenario. Under RCP8.5, the highest positive anomaly reaches 2.5°C in Santo André (Figure 8B).
For precipitation, the percentage anomalies are all negative, indicating a reduction in the annual rainfall average. The most negative percentages for the RCP4.5 scenario are for the nearest future (2020–2040), and SCS has the most considerable reduction with a value of −37.5% below its annual climatological value (Figure 8C). The minor reduction is SBC (35.3%). For the RCP8.5 scenario, these reductions intensify, reaching −49.1 % in SCS in 2020–2040. Minor reductions are projected for SBC (−44.2%) and RP (−44.3%).
Tmax anomaly's highest values occur in summer and autumn in most municipalities. Ribeirão Pires and Santo André register the highest values in summer and spring. SCS reached the highest value of 8.2°C in January under the RCP8.5 scenario.
For Tmin, autumn and spring show the highest positive anomalies for both emissions scenarios. Only in Diadema were the anomalies higher in autumn and winter for the RCP8.5 scenario.
On the other hand, the reduction in precipitation was more significant in summer and autumn in all municipalities, emission scenarios, and time slices. December is the one with the most significant reductions. For the near future (2020–2040), the municipalities of Diadema (−78.4%) and São Caetano do Sul (−78%) showed the highest values for RCP8.5. In RP, there was the lowest reduction (−58.2%) for the 2071–2099 time slice and the RCP4.5 scenario.
Several studies that have used the future precipitation projections of the Eta-HADGEM2_ES model for the southeastern region of Brazil have indicated a tendency of the model to project a drier climate compared to the projections of other regional climate models (Reboita et al., 2022). For example, for the Atlantic forest region in Brazil (Reboita et al., 2021), the metropolitan region of São Paulo (Lyra et al., 2017), and the Ribeira de Iguape basin in São Paulo (Ferreira and Valverde, 2022), the projections of the Eta-HADGEM2_ES model also observed a decrease in rainfall. In this way, the results found for the municipalities of ABC Paulista are in line with previous results regarding the reduction of precipitation, although worrying, as it projects reductions of 78% in São Caetano do Sul and Diadema for December, to the most extreme emissions scenario (RCP8.5).
3.2.5. High-resolution global climate model CNRM-CM6-1-HR—CMIP6
CNRM-CM6-1-HR global climate model simulates the seasonality of Tmax and Tmin but underestimates the values, as demonstrated in the BIAS (Table 5). Diadema (−3.2°C) and São Caetano do Sul (−3.16°C) show the highest underestimates for Tmax. For Tmin, the most considerable underestimates were for Diadema (−3.12°C) and Santo André (−3.0°C), in addition to the fact that for these municipalities, the coldest month simulated is June, unlike the observed in July.
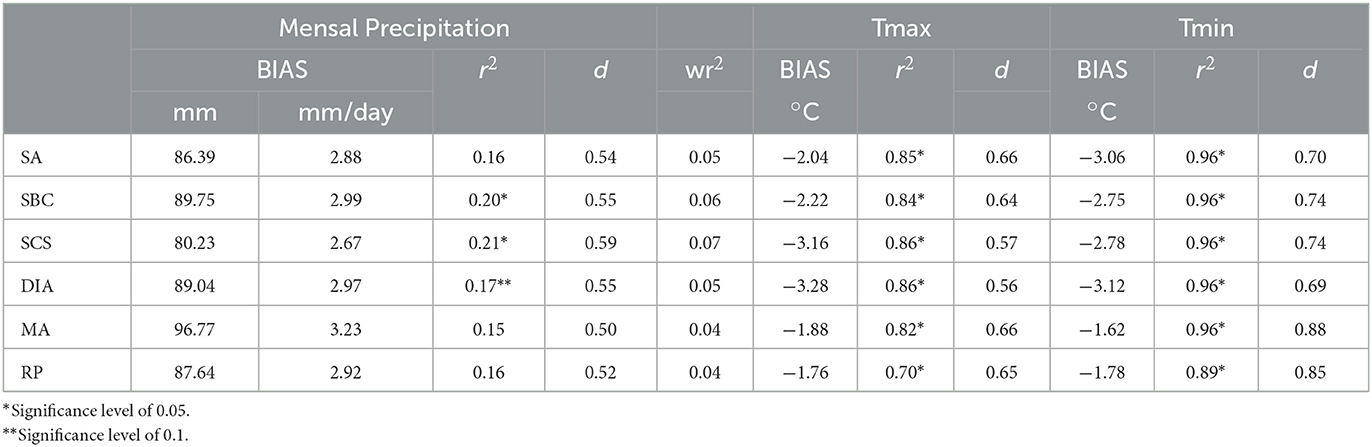
Table 5. Monthly average–validation metrics of the CNRM-CM6-1-HR simulations of precipitation and temperature on the monthly and annual scale, for the period 1999–2021 and 2011–2021, respectively.
The r2 of Tmax and Tmin shows very similar values for all municipalities. Only RP reached the lowest value for Tmax (0.70). Mauá (0.88) and Ribeirão Pires (0.85) had higher parameters d for Tmin, with the lowest BIAS.
The precipitation simulated by the CNMR model also captured the observed seasonal cycle, identifying the rainy and dry months. However, the model simulated December with the highest rainfall and June as the month with the lowest rainfall. Differently, it occurred for the observed data, which has January as the rainiest and August as the driest.
In addition, it overestimated rainfall, as verified by the positive BIAS (Table 5) in all analyzed municipalities. All BIAS values were high, especially Mauá (3.23 mm/day), which also show the lowest r2, wr2, and d.
Comparing the CNRM-CM6-1-HR simulations with the results from Eta-HADGEM2_ES and TerraClimate, it is observed that the model also underestimates temperatures and overestimates precipitation. In temperature, the BIAS is close to those of TerraClimate, but the BIAS is higher for precipitation.
The Direct Approach method was applied to remove the BIAS in the CNRM-CM6-1-HR model simulations. The correction factor was used for future projections in the SSP4.5 and SSP8.5 emission scenarios.
Figure 9 shows the positive anomalies for Tmax and Tmin concerning the climatological period, continually increasing along the three-time slices analyzed. No significant differences are shown for Tmax in 2020–2040 between the two scenarios, SSP2-4.5 and SSP5-8.5 (Figure 9A). It varies between 1.2 and 1.4°C. For Tmin, this difference is slightly more significant in SBC, SCS, SA, and MA municipalities (Figure 9B). For the other time slices under the SSP5-8.5 scenario, the anomalies are higher, reaching 5.1°C (SCS and DIA) for Tmax and 5.7°C (SA and DIA) for Tmin in the period 2071–2100. It is also observed that the anomalies for Tmin are slightly larger than for Tmax.
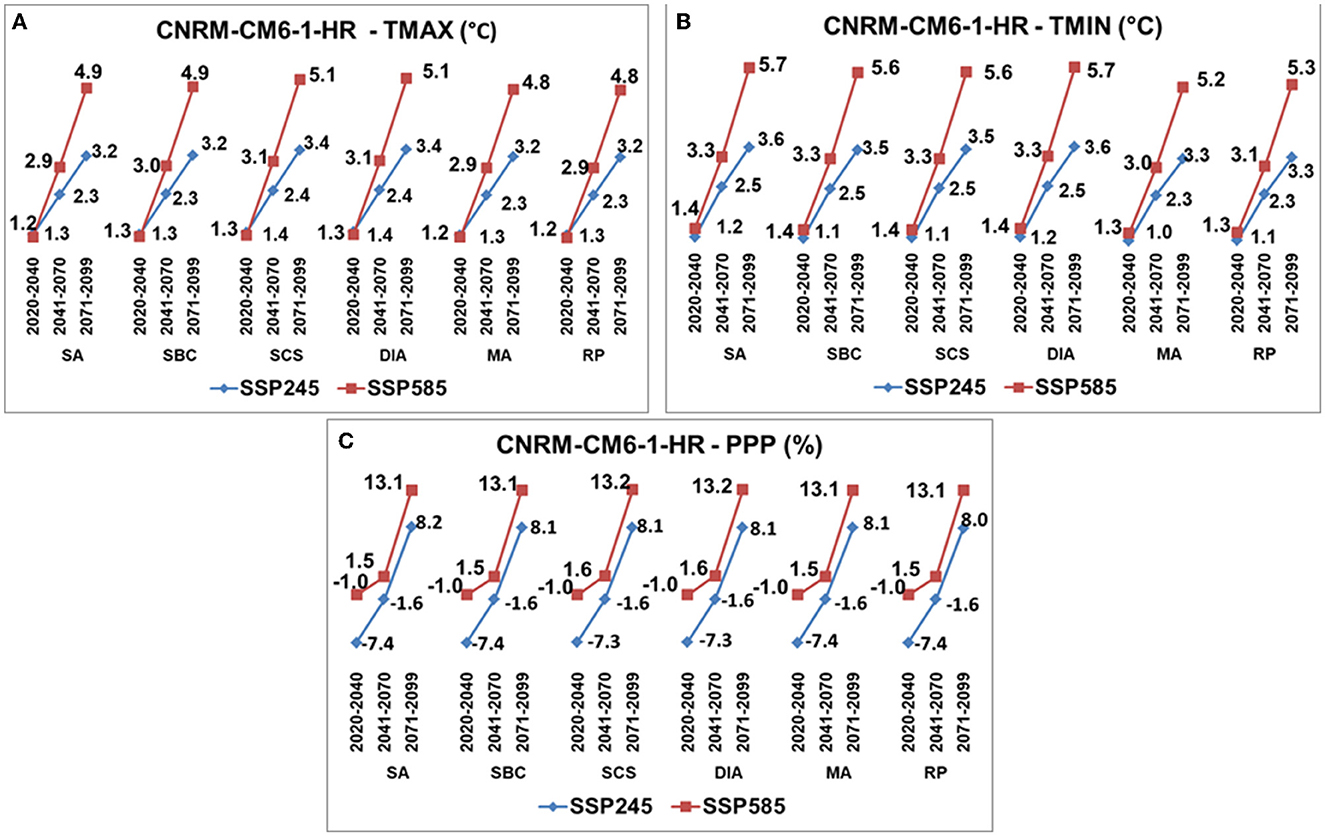
Figure 9. Maximum (A) and minimum (B) temperature and precipitation (C) anomalies on the annual scale for the three-time slices, two emission scenarios, in the six municipalities of ABC Paulista.
Regarding precipitation, the percentage values are very close in all municipalities, for all time slices, and in both scenarios (Figure 9C). A slight deficit (−7.3 to −7.4%) is projected compared to the climatological values, decreasing for 2041–2070. In the last period (2071–2100), the model projected a positive percentage increase in all municipalities, with higher values for the SSP5-8.5 scenario (13.2%).
Analysis on a seasonal scale for the Tmax showed that the most significant positive temperature anomalies occur in the summer in December (5.8°C) and January (6.1°C) for the SSP5-8.5 scenario and the period 2071–2100. In the case of Tmin, for the near future and in the SSP2-4.5 and SSP5-8.5 scenarios, the positive anomalies are more significant in winter. Diadema and Mauá reached the highest anomaly of Tmin (2.1°C) in June for SSP2-4.5 and 2.7°C in Diadema for the SSP5-8.5 scenario.
For precipitation, summer and autumn are the months with the highest deficit percentages for the near future in the SSP2-4.5 scenario. SCS shows the highest rainfall deficit in December (−30.9%) for the 2020–2040 time slice compared to the climatological values. For the SSP5-8.5 scenario, spring presents enormous deficits but is smaller than the SSP2-4.5 scenario in the near future. SA had the most significant deficit of −28% in November.
The projections of the Eta-HADGEM2_ES (Figure 8) and CNRM-CM6-1-HR (Figure 9) models show consistency in temperature projections, simulating significant increases in all time slices under different emission scenarios (RCP and SSP, respectively). The anomalies, as expected, do not necessarily show the same values in the projections of the two models. Eta-HADGEM2_ES shows higher Tmax anomalies (in the order of 1°C) for the RCP4.5 scenario in the near future (2020–2040) compared to those of CNRM-CM6-1-HR. The differences between the models are minimal for Tmin.
The temperature projections show the highest values of Tmax anomalies for the municipality of Diadema (Eta-HADGEM2_ES and CNRM-CM6-1-HR) and SCS (Eta-HADGEM2_ES) in all emission scenarios. For Tmin, the models project more significant anomalies for the municipality of Santo André (Eta-HADGEM2_ES and CNRM-CM6-1-HR), São Bernardo do Campo (Eta-HADGEM2_ES) and Diadema (CNRM-CM6-1-HR) under scenarios RCP8.5 and SSP5-8.5.
It is important to emphasize that SSP-based scenarios relate to RCPs. The SSPs expand into the RCPs to allow a standardized comparison of society's choices and their resulting levels of climate change. The format, such as “SSP5-8.5” represents “SSP5” that reflects the shared socio-economic path representing a fossil fuel-intensive world—in this case, a world dominated by mitigation challenges. Meanwhile, the “8.5” describes 8.5 watts per square meter of radiative forcing resulting from greenhouse gas emissions in this fossil fuel-intensive scenario (Meinshausen et al., 2020).
Regarding precipitation, there is the only agreement between the models for decreasing precipitation in the 2020–2041 and 2041–2070 time slices and in the SSP4-4.5 and RCP4.5 scenarios. The Eta-HADGEM2_ES model shows for SCS (−37.5%) and DIA (−36.2) the most significant decrease in annual precipitation. The CNRM-CM6-1-HR, on the other hand, shows a decrease in precipitation in the order of 7% in annual precipitation, with no significant differences between municipalities. This same model projects for the time slice 2041–2070 and 2071–2099 an increase in precipitation, while the Eta-HADGEM2_ES simulates a decrease in the percentages of rainfall reduction. These differences may be related to spatial resolution and precipitation parameterizations in the models.
The results of temperature projections and warming scenarios, especially for Tmax, warn about what can happen in the intensities of heat wave (HW) events in the municipalities of ABC Paulista.
Valverde (2022) identified the average intensities of heat waves (35.3°C) and cold (4.6°C) from the observed data for the urban area of ABC Paulista based in the percentile methods (Valverde and Rosa, 2023). Maximum HW intensities ranging between 37 and 38°C in Diadema and São Caetano do Sul were observed in 2015 and 2020, considered extremely hot in the region.
The average Tmax anomaly projected by Eta-HADGEM2_ES for the near future (2020–2040) in ABC Paulista is 2.7°C (RCP4.5) and 4.1°C (RCP8.5). If the monthly average Tmax for SCS is 29°C in January (Table 1), in scenario RCP8.5, it will be 33.4°C.
The positive anomalies of the CNRM-CM6-1-HR were smaller than those projected by the Eta-HADGEM2_ES model. Still, the average month Tmax for SCS in January would reach a value of 31.3 °C in the near future with few differences between the SSP2-4.5 and SSP5-8.5 scenarios.
As projected by the models, warming is imminent in the ABC Paulista, so studies should be carried out to evaluate the intensity and frequency of heat waves.
3.3. Adaptation to climate change in ABC Paulista
Adaptation to climate change must be part of public policies in every country that aim to minimize extreme climate variability's impact on socio-environmental systems and the most vulnerable populations. In this way, governments have spent efforts to insert these policies into urban, economic, social, and territorial planning as a priority component. However, the results have been too modest for the global temperature limit not to exceed 1.5°C above pre-industrial levels, as discussed at the last COP27 at Sharm el-Sheik.
Addressing this problem at the municipal scale can be an excellent strategy for closely understanding the most urgent issues from the population, businesses, and local services (Secretaria de Infraestrutura e Meio Ambiente do Estado de São Paulo [SIMA], 2021). At the local and regional levels, planning for adaptation and resilience to climate change can occur in different ways—either through elaborating specific plans or integrating them with other existing programs, public policies, and projects.
The idea of each municipality developing its adaptation and resilience plan aims to prepare the municipality to face the ongoing climate change, contemplating equal opportunities for all people (Secretaria de Infraestrutura e Meio Ambiente do Estado de São Paulo [SIMA], 2021).
The Organization for Economic Co-operation and Development—OECD (OECD (Organization for Economic Cooperation and Development), 2009) created a method in 2009 for building the adaptation plan that originates from the guide “Integrating Climate Change Adaptation into Development Co-operation: Policy Guidance”, later adapted by GIZ (Deutsche Gesellschaft für Internationale Zusammenarbeit GmbH) (2011, 2016). In this guide, the proposed methodology consists of a cycle structured in seven basic steps: (a) application of the climate lens, (b) assessment of climate risk, (c) identification of adaptation and resilience measures, (d) selection and prioritization of measures, (e) implementation, (f) monitoring and evaluation and (g) communication of the plan and its results.
Based on this guide, structuring measures requires knowledge of the various stages for a greater understanding of the problem by public managers and decision-makers.
The municipalities of ABC Paulista do not have a climate change adaptation plan. However, the impacts of climate change have been a significant concern discussed at the ABC Paulista Intermunicipal Consortium, which integrates the management of the seven municipalities, once the region is highly vulnerable to extreme rainfall (Valverde, 2017; Valverde et al., 2018; Brambila et al., 2019; Ferreira et al., 2019; Santos et al., 2019; Damasceno et al., 2021).
As a result, the Consortium's main initiatives were the first “Regional Inventory on Greenhouse Gas Emissions—GHG” and the “Action Plan to Combat Climate Change in the ABC Paulista” published in 2014. The document shows the outcomings of the GHG emission (CIGA - Consórcio Intermunicipal Grande ABC, 2016a,b)
Based on the Consortium's first GHG emissions inventory results, the discussions and workshops held with local stakeholders, and the analysis of existing regional plans, four sectors were identified as priorities in ABC Paulista: energy, urban mobility, waste, and sanitation. In the action plan based on these results, the goal was to reduce GHG emissions by 20% in ABC Paulista, considering the Reference Scenario (CIGA - Consórcio Intermunicipal Grande ABC, 2016a). However, the focus of the initiatives was on mitigation and needed more discussion about the adaptation process in the face of a new climate change reality and its impacts.
Furthermore, the measures had yet to be implemented through municipal legislation by the member cities. However, after the 2016 elections, the transposition of the plan's measures to the municipal level was halted, and the plan's implementation slowed down significantly (Bideux, 2019).
Therefore, it is necessary to adapt to the changes that have already occurred and prepare for plausible scenarios of future climate change. The building of the Adaptation Plan for the ABC municipalities is necessary and should follow the outlined by the OECD (Organization for Economic Cooperation and Development) (2009).
The first stage of the Adaptation Plan is the “Climate Lens”, which consists of interpreting existing climate data to identify how climate change may affect the municipality or region and its development objectives (OECD (Organization for Economic Cooperation and Development), 2009). This phase needs to initially analyze existing data on historical/current patterns and future trends for the climate in the municipality or region, to define priority themes for adaptation and building resilience in the territory and the scope of planning (OECD (Organization for Economic Cooperation and Development), 2009).
At this stage, the climatology analysis and future trends must be carried out for the municipalities, considering their regional and territorial reality. For this reason, it is essential to have a network of meteorological stations and rain gauges in operation for each municipality to gather information about the region and municipalities' climate and help validate studies on future projections generated by climate models.
The results found should contribute to the first phase of the construction of the adaptation plan in the context of the climate lens. The conclusions provide a first glimpse of the climate hazard expected to intensify by the end of the 20th century, impacting the ABC region's most affected and vulnerable areas.
The results found based on climate models and TerraClimate makes the warming that the municipalities will have unequivocal until the end of the 21st century. The climate projections indicate that the municipalities of São Caetano do Sul and Diadema will be the warmest. The highest Tmax anomalies can reach up to 7.5°C (RCP8.5) and 5.1°C (SSP5-8.5) for the time slice 2071–2099. However, for the nearest future (2020–2040) and the RCP4.5 scenario, the positive anomalies oscillate between 2.7 and 2.8°C in the municipalities of ABC Paulista. If it occurs as the scenarios present, the intensities of heat islands and heat waves should worsen in municipalities. This situation can exacerbate drought, dry conditions, the thermal discomfort of the population, the health of the most vulnerable, and atmospheric pollution in cities, among others.
Mauá showed more significant positive anomalies (up to 4.1°C) concerning the other municipalities in the TerraClimate warming scenarios, which leaves an alert of what can happen. Unlike SCS and DIA, this municipality is experiencing an accelerated growth of urban sprawl without adequate planning and presents a high social vulnerability. In 2018, Mauá was the champion of deforestation in the Atlantic Forest. The city deforested 14 hectares, according to Fundação SOS Mata Atlântica. The loss compromises the local environment, destroys biodiversity, and impacts the protection of springs and the generation and production of water for human consumption. In a warming scenario, these conditions worsen people's quality of life and wellbeing.
Concerning precipitation, despite the differences in the results of the projections, for the near future, all the models indicate a decrease in the annual and monthly accumulated rainfall, and Diadema and São Caetano do Sul stand out with the most significant decreases, as simulated by the model Eta-HADGEM2_ES, for the most extreme emissions scenario. TerraClimate also shows a slight decrease in rainfall for SCS and Mauá in autumn and spring. In the other municipalities, the simulations show increases in precipitation, just like the CNRM-CM6-1-HR model, for scenarios SSP2-4.5 and SSP5-8.5 in the time slice 2071–2099.
Due to the lack of agreement on the increase or decrease in precipitation, but with a greater tendency to decrease in the annual and monthly scale, in the 2021–2040 time slice, which should not rule out the occurrence of extreme events in short periods, the municipalities must prepare to ensure access to safe drinking water and access to adequate and equitable sanitation and hygiene for all people.
Thus, as simulated by the models, São Caetano, Diadema, and Mauá are more susceptible to climate change. According to simulations and scenarios, the hazard is current and tends to increase until the end of the century.
It should be noted that each model presents its uncertainties and limitations, but a scenario portrays different directions and should guide the planner in his decision-making.
Still, in line with the climate lens, a second action is identifying which neighborhoods should be more susceptible to climate hazards. Although this is not the objective of this study, it is already known that the frequency of floods and landslides in the ABC Paulista is very high, especially in the rainy season.
The ABC region has already mapped the risk areas of each municipality, which are most susceptible to flooding and landslides. This mapping is continually updated, identifying the continuous expansion of risk areas (Instituto de Pesquisas Técnicas, 2014; Canil and Nogueira, 2018; Instituto Geológico, 2020). The causes include heavy rains, unplanned urban occupation, or insufficient rainwater drainage network.
However, despite knowing the most susceptible areas and alert measures by the Civil Defense, the impacts are still severe, which confirms the gaps in preparation or adaptation in response to extreme events.
Every year in the rainy season, each municipality in ABC Paulista experiences different impacts during extreme rain events. The most extreme events recorded so far happened on April 6/7, 2017 (2 h, 90 mm), November 23, 2018 (1h30–84.7 mm), March 10, 2019 (10h: 95.6 mm), and December 28, 2021.
On March 10–11, 2019, the municipalities of SA, SBC and SCS were the most affected by the extreme rainfall event. In Santo André and São Bernardo do Campo was recorded 95.6 mm and 110 mm, respectively, in 10 h. ABC region municipalities reported many affected streets and neighborhoods and two drowning deaths in SA. Across the ABC region, 12 deaths were reported, the vast majority due to drowning and a house collapse in Ribeirão Pires. In addition to the deaths, many people were left homeless (Ferreira et al., 2019; Santos et al., 2019).
Given this reality, adaptation plans must be constructed to minimize the impacts of extreme variability, especially rainfall, which already negatively affects the most vulnerable population.
For this reason, the methodology proposed by the OECD (Organization for Economic Cooperation and Development) (2009) must be followed, improving the study of the climate threat by evaluating the extremes following the line of the climate lens and then moving on to the other phases, which are: (b) assessment of climate risk, (c) identification of adaptation and resilience measures, (d) selection and prioritization of measures, (e) implementation, (f) monitoring and evaluation and (g) communication of the plan and its results.
4. Conclusion
National and international efforts to mitigate climate change do not have shown any tangible effect on global greenhouse gas (GHG) emissions or the practices that cause them.
The fight against climate change must be conducted mainly at the local level, that is, as close as possible to the origin of the problem and where its effects are felt (Bulkeley and Newell, 2015).
Thus, public policies in councils must advance to reduce vulnerabilities and, consequently, risks, for which the applicability of these policies requires urgency and commitment that involves society and the region's population. Thus, adaptation plans must be an urgent priority in cities. ABC Paulista can become a pioneer in this regard.
This study was intended to assist in preparing these plans in its first phase, called “climate lens”. The projections of temperatures (Tmax and Tmin) and precipitation of the Eta-HADGEM2_ES and CNRM-CM6-1-HR models showed a consensus for increasing maximum and minimum temperatures until the 21st century in all municipalities and emission scenarios. The anomalies projected by Eta-HADGEM2_ES are the largest, projecting an increase of up to 7.4°C in São Caetano do Sul for the RCP8.5 scenario. The high spatial resolution of this model (5 × 5 km) should influence the accuracy of the projections. The CNRM-CM6-1-HR model is one of the highest-resolution models of the CMIP6. However, it is still coarse compared to the Eta-HADGEM2_ES, and the temperature increase (5.1°C) was more expressive in the counties of SCS and DIA for the SSP5-8.5 scenario for the period 2071–2100.
However, for precipitation, there was a consensus for reduction by climatic models in all scenarios and time-slices 2020–2040 and 2041–2070. The municipalities of Diadema (−78.4%) and SCS (−78%) had the most significant reductions in December for the RCP8.5 scenario. The CNRM-CM6-1-HR, on the other hand, projected the highest rainfall deficit in December (-30.9%) in SCS for the SSP5-8.5 scenario in the 2020–2040 time period.
The TerraClimate database validated with observed data showed overestimations for precipitation and underestimations for temperature. The validation is essential because these data are widely used as terrestrial truths in regions without observed data. Hence the importance of data validation, as was also done for climate model simulations. TerraClimate's warming scenarios showed a consensus for temperature increase (Tmax and Tmin). As for precipitation, it showed a reduction for some municipalities (Mauá −4.7% in spring) and excess for others (Ribeirão Pires: 24.8% and Santo André: 23.7%) for SWL4°C.
Thus, as simulated and projected, the increase in Tmax and Tmin should influence the intensity of extreme heat events in the ABC Paulista region. On the other hand, the reduction of rainfall in the monthly and annual scale should not mean a decrease in extreme daily events that cause floods and landslides. However, it leaves an alert of water scarcity for the supply and demand of the population.
It is important to emphasize the uncertainties of models and emission scenarios. Climate models are invaluable tools, but we must know their limits. Thus, the projected climate scenarios are directions. They are not predictions of future events but show the future in different directions based on driving forces. If it happens, the decision maker must understand and be prepared to make the best decisions.
Adaptation plans for ABC Paulista are necessary since each municipality identifies the hazard in different proportions and intensities. These results should contribute to the first phase of the construction of an adaptation plan, giving a first vision of the climate threat that should intensify by the end of the 20th century. Municipalities with socioeconomic vulnerability, exposure to extreme variability, and climate risks will be the most affected, as already verified in several studies about ABC Paulista (Nogueira et al., 2014; Valverde, 2017).
Future studies being developed for the ABC Paulista advance in the other phases of the adaptation plan together with practical mitigation actions at the local level.
Data availability statement
The raw data supporting the conclusions of this article will be made available by the authors without undue reservation. Further inquiries can be directed to the corresponding author.
Author contributions
MV: study conception and design, analysis and interpretation of results, and wrote the paper with input from all authors. BC and AS: data collection, reading, and correcting the article content. GC: data collection, reading, and translating the article content. LK: reading and correcting and translating the article content. RB: data collection and reading and translating the article content. All authors contributed to the article and approved the submitted version.
Funding
Payment will be requested from Universidade Federal do ABC after acceptance of the article.
Conflict of interest
The authors declare that the research was conducted in the absence of any commercial or financial relationships that could be construed as a potential conflict of interest.
Publisher's note
All claims expressed in this article are solely those of the authors and do not necessarily represent those of their affiliated organizations, or those of the publisher, the editors and the reviewers. Any product that may be evaluated in this article, or claim that may be made by its manufacturer, is not guaranteed or endorsed by the publisher.
Footnotes
References
Abatzoglou, J. T., Dobrowski, S. Z., Parks, S. A., and Hegewisch, K. C. (2018). TerraClimate, a high-resolution global dataset of monthly climate and climatic water balance from 1958–2015. Sci Data. 5, 1–12. doi: 10.1038/sdata.2017.191
Alghamdi, A. S. (2020). Evaluation of four reanalysis datasets against radiosonde over southwest Asia. Atmosphere. 11, 402. doi: 10.3390/atmos11040402
Bärring, L., and Strandberg, G. (2018). Does the projected pathway to global warming targets matter? Environ. Res. Lett. 13, 024029. doi: 10.1088/1748-9326/aa9f72
Benfield, A. (2021). Global catastrophe recap september 2021 (PDF). (Report). p. 13. Available online at: https://www.aon.com/reinsurance/thoughtleadership/default/global-catastrophe-recap-september-2021 (accessed October 15, 2022).
Bideux, J. (2019). Implementar uma política de combate às mudanças climáticas em uma região metropolitana: o caso da região do Grande ABC no Brasil, Confins [En ligne], Traductions, mis en ligne le 29 mars 2022. Available online at: http://journals.openedition.org/confins/45103 (accessed November 15, 2022). doi: 10.4000/confins.45103
Bosco, R. B., and Valverde, M. C. (2022). Climate projections of precipitation and temperature in the Metropolitan Region of Vale do Paraíba- SP simulated by climate models from CMIP6. Revista Brasileira de Geografia Física 15, 1621–1638. doi: 10.26848/rbgf.v15.3.p1621-1638
Brambila, R., Valverde, M. C., Santos, D. F. F., and Ferreira, M. C. A. (2019). “Identificação de eventos de extremos chuvosos através do método dos percentis em Santo André, Região do ABC,” in XXIII Simpósio Brasileiro de Recursos Hídricos, Foz de Iguaçu. Available onlin at: https://s3-sa-east-1.amazonaws.com/abrh/Eventos/Trabalhos/107/XXIII-SBRH0337-1-20190430-152221.pdf (accessed October 20, 2022).
Bulkeley, H., and Newell, P. (2015). Governing Climate Change. Milton Park: Routledge, p. 166. doi: 10.4324/9781315758237
Calado, G. G., and Valverde, M. C. (2020). Assessing future scenarios of water availability using CMIP5 high resolution climate models–Case study of the Alto Tietê Basin. Brazilian J. Environ. Sci. (Online). 55, 401–419. doi: 10.5327/Z2176-947820200658
Calado, G. G., Valverde, M. C., and Baigorria, G. A. (2019). Use of teleconnection indices for water management in the cantareira system—São Paulo—Brazil. Environ. Processes. 6, 413–431. doi: 10.1007/s40710-019-00368-9
Canil, K., and Nogueira, F. R. (2018). “São Bernardo do Campo: Uso das cartas geotécnicas para prevenção,” in Sulaiman„ N. S., Jacobi, P. R., eds Melhor Prevenir: Olhares e saberes para a redução de risco de desastre, 1 edn (São Paulo: IEE-USP), p. 111–115.
Cavalcanti, I. F. A., Nunes, L. H., Marengo, J. A., Gomes, J. L., Silveira, V. A. P., Castellano, M. S., et al. (2017). Projections of precipitation changes in two vulnerable regions of São Paulo State, Brazil. Am. J. Climate Change 6, 268–293. doi: 10.4236/ajcc.2017.62014
Chou, S. C., Lyra, A., Mourão, C., Dereczynski, C., Pilotto, I., Gomes, J., et al. (2014a). Assessment of climate change over South America under RCP 4.5 and 8.5 downscaling scenarios. Am. J. Climate Change 3, 512–527. doi: 10.4236/ajcc.2014.35043
Chou, S. C., Lyra, A., Mourão, C., Dereczynski, C., Pilotto, I., Gomes, J., et al. (2014b). Evaluation of the eta simulations nested in three global climate models. Am. J. Climate Change 03, 438–454. doi: 10.4236/ajcc.2014.35039
CIGA - Consórcio Intermunicipal Grande ABC (2016a). 1° nventario Regional de Emissões de Gases de Efeito Estufa do Grande ABC. Available online at: https://e-lib.iclei.org/wp-content/uploads/2017/04/INVENTARIO_ABC-1.pdf (accessed November 15, 2022).
CIGA - Consórcio Intermunicipal Grande ABC (2016b). Plano de ação de enfrentamento às mudanças climáticas do Grande ABC. Available online at: https://www.researchgate.net/publication/316583821_PLANO_DE_ACAO_DE_ENFRENTAMENTO_AS_MUDANCAS_CLIMATICAS_DO_GRANDE_ABC. (accessed November 15, 2022).
Coelho, C., Cardoso, D., and Firpo, M. (2015). Precipitation diagnostics of an exceptionally dry event in São Paulo, Brazil. São José dos Campos. Theor. Appl. Climatol. 125, 1–16. doi: 10.1007/s00704-015-1540-9
Collins, W. J., Bellouin, N., Doutriaux-Boucher, M., Gedney, N., Halloran, P., Hinton, T., et al. (2011). Development and evaluation of an earth-system model–HadGEM2. Geosci. Model Develop. 4, 1051–1075. doi: 10.5194/gmd-4-1051-2011
Damasceno, A. D. O., Cardoso, A. O., and Paiva, C. F. E. (2021). Investigation of the relationship between rain and landslide in the municipality of Mauá - SP to obtain critical thresholds that trigger landslides. Ciência e Natura, 43, e50. doi: 10.5902/2179460X43119
de Godoy, R. M. P., Gozzo, L. F., Llopart, M., Peron, B. L., Reboita, M. S., Repinaldo, H. F. B., et al. (2021). Projeções Climáticas de Temperatura do Ar e Precipitação para o Estado de São Paulo Utilizando o Modelo Regional RegCM4. Anuário do Instituto de Geociências UFRJ, 44, 39850. doi: 10.11137/1982-3908_2021_44_39850
Denaldi, R., Moretti, R. S. P. A. I. V. A., Nogueira, C. F. E., and Petrarolli, F. R. J. (2016). Urbanização de favelas na Região do ABC no âmbito do Programa de Aceleração do Crescimento-Urbanização de Assentamentos Precários. Cadernos Metrópole, 18, 101–118. doi: 10.1590/2236-9996.2016-3505
Dereczynski, C. P., Luiz Silva, W., and Marengo, J. A. (2013). Detection and projections of climate change in Rio de Janeiro, Brazil. Am. J. Climate Change 2, 25–33. doi: 10.4236/ajcc.2013.21003
ECCC—Environment and Climate Change Canada (2021). Canada′s top 10 weather stories of 2021. Available online at: https://www.canada.ca/en/environment-climate-change/services/top-ten-weather-stories/2021.html (accessed November 15, 2022).
Fernandes, R. A., and Valverde, M. C. (2017). Análise da Resiliência aos extremos climáticos de chuva: estudo preliminar na região de Mauá no ABC Paulista—São Paulo. Revista Brasileira de Ciências Ambientais 44, 1–17. doi: 10.5327/Z2176-947820170183
Ferreira, B. C. C., and Valverde, M. C. (2022). Análise dos Índices de Extremos de Precipitação em Cenários Futuros na Bacia do Rio Ribeira de Iguape-SP. Revista Brasileira de Meteorologia, 37, 1–15. doi: 10.1590/0102-7786370067
Ferreira, M. C. A., Valverde, M. C., Santos, D. F. F., and Brambila, R. (2019). “A sub-bacia do Ribeirão dos Meninos SP e as inundações urbanas,” in XXIII Simpósio Brasileiro de Recursos Hídricos, Foz de Iguaçu. Available online at: https://anais.abrhidro.org.br/job.php?Job=5173
Filgueiras, R., Venancio, L. P., Aleman, C. C., and Cunha, F. F. (2022). Comparison and calibration of terraclimate climatological variables over the Brazilian territory. J. South Am. Earth Sci. 117, 103882. doi: 10.1016/j.jsames.2022.103882
Flato, G., Marotzke, J., Abiodun, B., Braconnot, P., Chou, S. C., and Collins, W., et al. (2013). “Evaluation of climate models,” in Stocker, T.F., D. Qin, G.-K. Plattner, M. Tignor, S.K. Allen, J. Boschung, A. Nauels, Y. Xia, V. Bex and P.M. Midgley, eds Climate Change 2013: The Physical Science Basis. Contribution of Working Group I to the Fifth Assessment Report of the Intergovernmental Panel on Climate Change (Cambridge University Press, Cambridge, United Kingdom and New York, NY, USA).
Giorgi, F., and Mearns, L. O. (1999). Introduction to special section: regional climate modeling revisited. J. Geophys. Res. 104, 6335–6352. doi: 10.1029/98JD02072
GIZ (Deutsche Gesellschaft für Internationale Zusammenarbeit GmbH) (2011). Integrating climate change adaptation into development planning: a practice-oriented training based on an OECD policy guidance. Eschborn: GIZ. Available online at: https://www.oecd.org/dac/environment-development/45856020.pdf. (accessed November 15, 2022).
GIZ (Deutsche Gesellschaft für Internationale Zusammenarbeit GmbH) (2016). Curso de capacitación: Transversalización de la Adaptación basada en Ecosistemas (AbE) em la planificación del desarrollo. Proyecto global: Transversalización de la AbE, implementado por la GIZ por encargo de BMUB-IKI. (accessed November 15, 2022).
Gouveia, N., Hajat, S., and Armstrong, B. G. (2003). Socioeconomic differentials in the temperature-mortality relationship in São Paulo, Brazil. Int. J. Epidemiol. Inglaterra, 32, 390–397. doi: 10.1093/ije/dyg077
Han, Z., and Sharif, H. O. (2021). Analysis of flood fatalities in the United States, 1959–2019. Water 13, 1871. doi: 10.3390/w13131871
IBGE (2021). Instituto Brasileiro de Geografia e Estatística (Brazilian Institute of Geographymand Statistics). Estimativa da população residente no Brasil. Diretoria de Pesquisas - DPE. 2010. Available online at: http://www.ibge.gov.br (accessed November 15, 2022).
Instituto de Pesquisas Técnicas. (2014). Gestão de Áreas de Risco na Região do Grande ABC - Município de Santo André. RELATÓRIO TÉCNICO N° 136, 154–205. Available online at: https://www3.santoandre.sp.gov.br/defesacivil/wp-content/uploads/2018/06/SA-Vol_3.pdf (accessed October 20, 2022).
Instituto Geológico. (2020). Mapeamento de Riscos de Movimentos de Massa e Inundações do Município de Santo André. Relatório Técnico Executivo. Available online at: http://www.sidec.sp.gov.br/map_risco/uploads/doc1606414690.pdf (accessed October 20, 2022).
IPCC (2021). “Climate Change 2021: The Physical Science Basis,” in Masson-Delmotte, V., Zhai, P., Pirani, A., Connors, S. L., Péan, C., Berger, S., et al., eds Contribution of Working Group I to the Sixth Assessment Report of the Intergovernmental Panel on Climate Change (Cambridge University Press, Cambridge, United Kingdom and New York, NY, USA).
Krause, P., Boyle, D. P., and Bäse, F. (2005). Comparison of different efficiency criteria for hydrological model assessment. Adv. Geosci. 5, 89–97. doi: 10.5194/adgeo-5-89-2005
Legates, D. R., and McCabe, G. J. (1999). Evaluating the use of “goodness-of-fit” measures in hydrologic and hydroclimatic model validation. Water Resour. Res. 35, 233–241. doi: 10.1029/1998WR900018
Lenderink, G., Buishand, A., and Deursen, W. (2007). Estimates of future discharges of the river Rhine using two scenario methodologies: direct versus delta approach. Hydrol. Earth Syst. Sci. 11, 1145–1159. doi: 10.5194/hess-11-1145-2007
Lyra, A., Tavares, P., Chou, S. C., Sueiro, G., Dereczynski, C., Sondermann, M., et al. (2017). Climate change projections over three metropolitan regions in Southeast Brazil using the non-hydrostatic Eta regional climate model at 5-km resolution. Theor. Appl. Climatol. 132, 683–683. doi: 10.1007/s00704-017-2110-0
Marengo, J., Valverde, M. C., and Obregón, G. (2013). Observed and projected changes in rainfall extremes in the Metropolitan Area of São Paulo. Climate Res. 57, 61–72. doi: 10.3354/cr01160
Marengo, J. A., Alves, L. M., Ambrizzi, T., Young, A., Barreto, N. J. C., Ramos, A. M., et al. (2020). Trends in extreme rainfall and hydrogeometeorological disasters in the Metropolitan Area of São Paulo: a review. Ann. New York Acad. Sci. 20, nyas.14307. doi: 10.1111/nyas.14307
Meinshausen, M., Nicholls, Z. R., Lewis, J., Gidden, M. J., Vogel, E., Freund, M., et al. (2020). The shared socio-economic pathway (SSP) greenhouse gas concentrations and their extensions to 2500. Geosci. Model Develop. 13, 3571–3605. doi: 10.5194/gmd-13-3571-2020
Milano, M., Reynard, E., Muniz-Miranda, G., and Guerrin, J. (2018). Water supply basins of são paulo metropolitan region: hydro-climatic characteristics of the 2013–2015 water crisis. Water 10, 1517. doi: 10.3390/w10111517
Molina, E. A. N., Cardoso, A. O., and Nogueira, F. R. (2015). Relação precipitação-deslizamento no município de São Bernardo do Campo—SP. Ciência e Natura 37, 2015. doi: 10.5902/2179460X16214
Moro Junior, E. (2007). A redenção inexistente nos planos urbanísticos municipais: o caso do Projeto Eixo Tamanduatehy. Annablume, São Paulo, p. 114.
Nobre, C., Young, A. F., Marengo, J. A., Saldiva, P., Nobre, A., Ougura, A., et al. (2011). “Vulnerabilidades das Megacidades Brasileiras as Mudanças Climáticas: Região Metropolitana de São Paulo” in R. S. da Motta, Hargrave, J., Luedemann, G., Gutierrez Mudança, M. B. S., eds do Clima no Brasil: Aspectos econômicos, sociais e regulatórios - IPEA (Brasilia), p. 110–140.
Nogueira, F. R., Oliveira, V. E., and Canil, K. (2014). Políticas públicas regionais para gestão de riscos: o processo de implementação no ABC, SP. Ambiente and Sociedade 17, 177–194. doi: 10.1590/1809-4422ASOC1100V1742014
OECD (Organization for Economic Cooperation and Development) (2009). Integrating Climate Change Adaptation into Development Co-operation: Policy Guidance. Paris, p. 195.
Oliveira, G. G., Pedrollo, O. C., and Castro, N. M. (2015). Uncertainties associated to climate scenarios obtained by Eta CPTEC/HadCM3 model: comparative evaluation between simulated and observed data of precipitation, evapotranspiration and river flow in Ijuí River Basin, Brazil. Rev. Bras. Meteorol. 30, 101–121. doi: 10.1590/0102-778620140041
Philip, S. Y., Kew, S. F., van Oldenborgh, G. J., Anslow, F. S., Seneviratne, S. I., Vautard, R., et al. (2021). Rapid attribution analysis of the extraordinary heatwave on the Pacific Coast of the US and Canada. Earth Syst. Dynam. Discuss. [preprint]
Prosdocimi, D., and Klima, K. (2020). Health effects of heat vulnerability in Rio de Janeiro: a validation model for policy applications. SN Appl. Sci. 2, 1948. doi: 10.1007/s42452-020-03750-7
Qin, Y., Abatzoglou, J. T., Siebert, S., Huning, L. S., AghaKouchak, A., Mankin, J. S., et al. (2020). Agricultural risks from changing snowmelt. Nat. Clim. Chang. 10, 459–465. doi: 10.1038/s41558-020-0746-8
Reboita, M. S., da Rocha, R. P., Souza, C. A. D., Baldoni, T. C., Silva, P. L. L. D. S., Ferreira, G. W. S., et al. (2022). Future projections of extreme precipitation climate indices over South America based on CORDEX-CORE multimodel ensemble. Atmosphere. 13, 1462. doi: 10.3390/atmos13091463
Reboita, M. S., Kuki, C. A. C., Marrafon, V. H. A., Souza, C. A., Ferreira, G. W. S., Teodoro, T. A., et al. (2021). South America climate change revealed through climate indices projected by GCMs and Eta-RCM ensembles. Climate Dyn. 58, 459–485. doi: 10.1007/s00382-021-05918-2
Riahi, K., van Vuuren, D. P., Kriegler, E., Edmonds, J. O'neill, B. C., Fujimori, S., et al. (2017). The Shared Socioeconomic Pathways and their energy, land use, and greenhouse gas emissions implications: an overview. Global Environ. Change 42, 153–168. doi: 10.1016/j.gloenvcha.2016.05.009
Sampaio, L. M. (2015). Tendências recentes da espacialização das indústrias e serviços em São Paulo/SP e no ABC paulista. Economía, Sociedad y Território XV, 483–515. doi: 10.22136/est012015599
Santos, D. F. F., Valverde, M. C., Brambila, R., and Ferreira, M. C. A. (2019). “Inundações na Bacia do Rio Tamanduateí. Santo André: Estudo de caso dos dias 10 e 11/03/2019,” in XXI Simpósio Brasileiro de Recursos Hídricos, Foz de Iguaçu. Available online at: https://files.abrhidro.org.br/Eventos/Trabalhos/107/XXIII-SBRH0674-1-20190504-223533.pdf
Secretaria de Infraestrutura e Meio Ambiente do Estado de São Paulo [SIMA] (2021). Guia de adaptação e resiliência climática para municípios e regiões. 1ª ed. São Paulo. Available online at: https://smastr16.blob.core.windows.net/municipiosresilientes/sites/257/2021/09/guia_-adaptacao-e-resiliencia-climatica-para-municipios-e-regioes_final.pdf (accessed March 15, 2022).
Silva, M. O., and Valverde, M. C. (2017). Cenário futuro da disponibilidade hídrica na Bacia do Alto Tietê. Revista Brasileira de Ciências Ambientais. 43, 114–130. doi: 10.5327/Z2176-947820170185
Son, J., Gouveia, N., Bravo, M. A., Freitas, C. U., and Bell, M. L. (2016). The impact of temperature on mortality in a subtropical city: effects of cold, heat, and heat waves in São Paulo, Brazil. Int. J. Biometeorol. 60, 113–121. doi: 10.1007/s00484-015-1009-7
Tabony, R. C. (1983). The estimation of missing climatological data. Int. J. Climatol. 3, 297–314. doi: 10.1002/joc.3370030308
Tewari, M., Yang, J., Kusaka, H., and Salamanca, F. (2019). Interaction of urban heat islands and heat waves under current and future climate conditions and their mitigation using green and cool roofs in New York City and Phoenix, Arizona. Environ. Res. Lett. 14, 034002. doi: 10.1088/1748-9326/aaf431
Valero, F., Gonzalez, F. J. D., and García-Miguel, J. A. (1996). A method for the reconstruction and temporal extension of climatological time series. Int. J. Climatol. 16, 213–227. doi: 10.1002/(SICI)1097-0088(199602)16:2<213::AID-JOC996>3.0.CO;2-7
Valverde, M. C. (2017). The interdependence of climate and socioeconomic vulnerability in the ABC Paulista region. Ambiente and Sociedade 20, 39–60. doi: 10.1590/1809-4422asoc66r2v2032017
Valverde, M. C. (2021). Efeito das ondas de calor na intensidade das ilhas de calor: estudo de caso para a RMSP, setembro de 2020. XIV Simpósio Brasileiro de Climatologia Geográfica, 2021, João Pessoa. Saberes acadêmicos, populares e institucionais em Climatologia: contextos para uma agenda socioambiental 1, 1–10.
Valverde, M. C. (2022). Variabilidade Climática e Projeções de cenários futuros para o ABC Paulista: impactos. Projeto Adapta ABC Paulista, da teoria a prática. Projeto de extensão EV009-2022 Universidade Federal do ABC. Available online at: https://www.youtube.com/watch?v=rEt8RR6h6ZI&t=7199s (accessed October 20, 2022).
Valverde, M. C., Cardoso, A., and Brambila, R. (2018). O padrão de chuvas na região do ABC Paulista: os extremos e seus impactos. Rev. Bras. de Climatologia. 22, 165–187. doi: 10.5380/abclima.v22i0.45929
Valverde, M. C., Coelho, L. H., Cardoso, A., Paiva Junior, H., Brambila, R., Boian, C., et al. (2020). Urban climate assessment in the ABC Paulista Region of São Paulo, Brazil. Sci. Total Environ. 15, 735.139303. doi: 10.1016/j.scitotenv.2020.139303
Valverde, M. C., and Rosa, M. B. (2023). Heat Waves in São Paulo State (2000–2020), Brazil: Intensity, duration, spatial scope, and atmospheric characteristics. Int. J. Climatol. 1–17. doi: 10.1002/joc.8058
Van Vuuren, D. P., Edmonds, J., Kainuma, M., Riahi, K., Thomson, A., Hibbard, K., et al. (2011). The representative concentration pathways: an overview. Clim. Change 109, 5. doi: 10.1007/s10584-011-0148-z
Willmot, C. J. (1981). On the validation of models. Phys. Geogr. 2, 184–194. doi: 10.1080/02723646.1981.10642213
Willmot, C. J. (1984). “On the evaluation of model performance in physical geography”, in Gaile, G. L., Willmot, C. J., eds Reidel Spatial Statistics and Models (Dordrecht), p. 443–460. doi: 10.1007/978-94-017-3048-8_23
WMO—World Meteorological Organization (2022). State of Climate in 2021: Extreme events and major impacts. State of the Global Climate 2021 (WMO-No. 1290). Available online at: https://library.wmo.int/doc_num.php?explnum_id=10859 (accessed March 15, 2022).
World Weather Attribution (2021). Western North American Extreme Heat Virtually Impossible Without Human-Caused Climate Change. Available online at: https://www.worldweatherattribution.org/western-north-american-extreme-heat-virtually-impossible-without-human-caused-climate-change (accessed March 15, 2022).
Keywords: ABC Paulista region, future projections, adaptation, CNRM-CM6-1-HR model, TerraClimate, Eta-HADGEM2_ES model
Citation: Valverde MC, Calado BN, Calado GG, Kuroki LY, Brambila R and Sousa ARd (2023) Climate projections of precipitation and temperature in cities from ABC Paulista, in the Metropolitan Region of São Paulo—Brazil. Front. Clim. 5:1127026. doi: 10.3389/fclim.2023.1127026
Received: 19 December 2022; Accepted: 25 April 2023;
Published: 17 May 2023.
Edited by:
Matthew Collins, University of Exeter, United KingdomReviewed by:
Soledad Collazo, University of Buenos Aires, ArgentinaRenata Goncalves Tedeschi, Vale Technological Institute (ITV), Brazil
Copyright © 2023 Valverde, Calado, Calado, Kuroki, Brambila and Sousa. This is an open-access article distributed under the terms of the Creative Commons Attribution License (CC BY). The use, distribution or reproduction in other forums is permitted, provided the original author(s) and the copyright owner(s) are credited and that the original publication in this journal is cited, in accordance with accepted academic practice. No use, distribution or reproduction is permitted which does not comply with these terms.
*Correspondence: María Cleofé Valverde, bWFyaWEuYnJhbWJpbGFAdWZhYmMuZWR1LmJy