Abstract
The Clouds and the Earth's Radiant Energy System (CERES) project has now produced over two decades of observed data on the Earth's Energy Imbalance (EEI) and has revealed substantive trends in both the reflected shortwave and outgoing longwave top-of-atmosphere radiation components. Available climate model simulations suggest that these trends are incompatible with purely internal variability, but that the full magnitude and breakdown of the trends are outside of the model ranges. Unfortunately, the Coupled Model Intercomparison Project (Phase 6) (CMIP6) protocol only uses observed forcings to 2014 (and Shared Socioeconomic Pathways (SSP) projections thereafter), and furthermore, many of the ‘observed' drivers have been updated substantially since the CMIP6 inputs were defined. Most notably, the sea surface temperature (SST) estimates have been revised and now show up to 50% greater trends since 1979, particularly in the southern hemisphere. Additionally, estimates of short-lived aerosol and gas-phase emissions have been substantially updated. These revisions will likely have material impacts on the model-simulated EEI. We therefore propose a new, relatively low-cost, model intercomparison, CERESMIP, that would target the CERES period (2000-present), with updated forcings to at least the end of 2021. The focus will be on atmosphere-only simulations, using updated SST, forcings and emissions from 1990 to 2021. The key metrics of interest will be the EEI and atmospheric feedbacks, and so the analysis will benefit from output from satellite cloud observation simulators. The Tier 1 request would consist only of an ensemble of AMIP-style simulations, while the Tier 2 request would encompass uncertainties in the applied forcing, atmospheric composition, single and all-but-one forcing responses. We present some preliminary results and invite participation from a wide group of models.
1. Introduction
The Earth's Energy Imbalance (EEI) refers to an imbalance between how much solar radiant energy is absorbed by Earth and how much thermal infrared radiation is emitted to space (Stephens et al., 2012; Trenberth and Cheng, 2022; von Schuckmann et al., 2023). Assuming constant atmospheric composition, a positive EEI would imply increasing global mean temperature, sea level rise, further heating within the ocean and land, and melting of snow and sea ice (Masson-Delmotte et al., 2021). As such, EEI is a key metric for detecting ongoing anthropogenic climate change and assessing the causes (e.g., Hansen et al., 1988, 2005). Climate models have long predicted that the increases in well-mixed greenhouse gases would cause an increasing net energy imbalance for the planet, a prediction that was borne out with the observed increases in ocean heat content (e.g., Levitus et al., 2001; Meehl et al., 2005; Donohoe et al., 2014; von Schuckmann et al., 2016; Hakuba et al., 2021; Cheng et al., 2022). Over the period 1970-2020, the EEI is estimated to have been 0.48 ± 0.1W m−2 (von Schuckmann et al., 2023), with a clear acceleration seen over the last two decades (Figure 1).
Figure 1
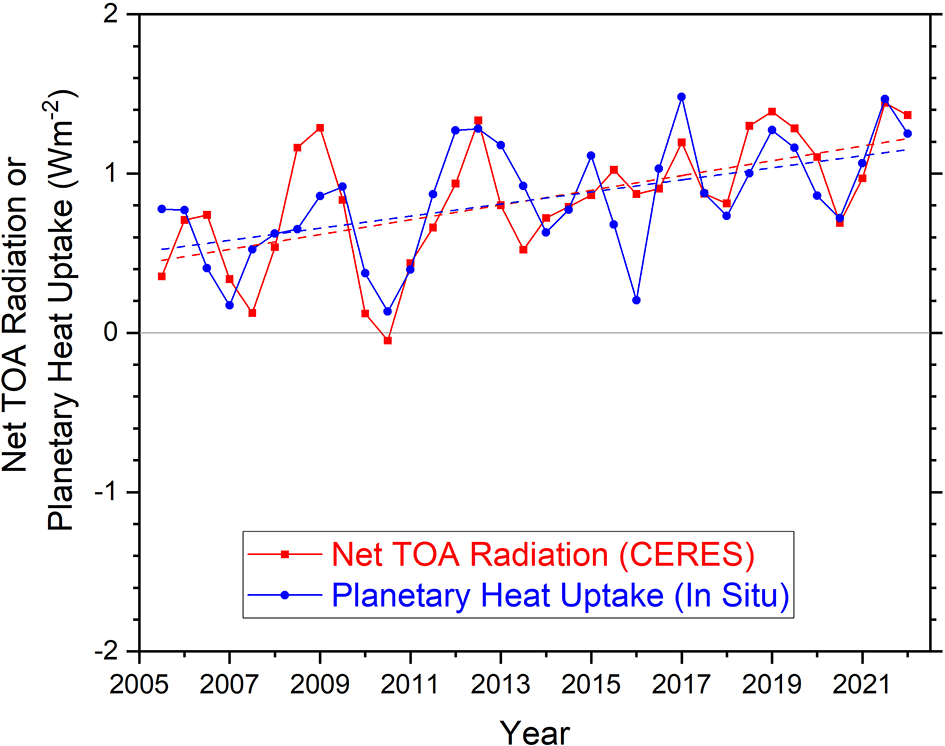
Comparison of overlapping one-year estimates at 6-month intervals of net top-of-the-atmosphere annual energy flux from the CERES Energy Balanced and Filled (EBAF) Ed4.2 product (solid red line) and an in situ observational estimate of uptake of energy by Earth climate system (solid blue line). Dashed lines correspond to least squares linear regression fits to the data (updated from Loeb et al., 2021 to the end of 2022).
In effect, EEI represents the net heating acting on the climate system—it is the difference between total climate forcing and the climate system's response to the forcing (Hansen et al., 2011). The EEI is driven by increasing CO2 and other GHGs as well as changes in aerosols and feedbacks associated with temperature, water vapor, cloud, and surface albedo changes. Continued increases in greenhouse gases and a reversal in recent aerosol forcing trends has led to an acceleration of the forcing of climate change (Quaas et al., 2022). In principle, accelerated climate forcing should increase EEI, but over decadal and shorter timescales appreciable internal climatic variations potentially offset or augment the anthropogenic forcing impacts. Given the societal implications of climate system changes associated with a positive EEI, it is imperative that we accurately monitor and understand EEI along with the components of the climate system that influence it.
The most direct way of observing EEI is through satellite measurements, which provide excellent spatial and temporal coverage and therefore are a useful means of tracking variations in EEI over a range of time–space scales. However, the absolute accuracy of satellite radiometers is insufficient to quantify the annual EEI to 0.1 Wm−2 accuracy (Barkstrom and Louis Smith, 1986). The Clouds and the Earth's Radiant Energy System (CERES) team adjusts the satellite shortwave (SW) and longwave (LW) TOA fluxes within uncertainty so that the EEI is consistent with a 10-year in-situ EEI value derived from climate system heat content changes (Johnson et al., 2016) and then applies the same adjustments to the entire satellite record (Loeb et al., 2009, 2018). Temporal changes in satellite EEI are thus independent of changes in the in-situ EEI estimates, allowing direct comparisons between satellite and in-situ interannual and multidecadal EEI changes since 2000. Recent studies have found a doubling in the EEI between 2005 and 2019 in both satellite and in situ data records (Figure 1) (Loeb et al., 2021). Climate simulations involving a limited subset of models suggest that these trends cannot be explained by internal variability alone, but also require the contribution from anthropogenic forcing (Raghuraman et al., 2021). However, the climate models examined so far seem to underestimate the trends by half–particularly in the short-wave. Unfortunately, the Coupled Model Intercomparison Project (Phase 6) (CMIP6) protocol only uses observed forcings to 2014 (for AMIP runs, and Shared Socioeconomic Pathways (SSP) projections thereafter for the coupled simulations), so a broader model investigation into recent EEI trends with a larger set of models that use up-to-date drivers is not currently possible. Furthermore, many of the forcings and observations used to drive the model simulations have been substantially updated since the CMIP6 inputs were defined.
In this paper, we propose a new model intercomparison, CERESMIP, that focuses on atmosphere-only simulations using updated SSTs, forcings and emissions from 1990 to 2021. The prime focus will be on comparing model and CERES-observed EEI and atmospheric feedbacks to assess our understanding of the processes driving observed EEI changes and evaluating model performance. The Tier 1 request will consist only of an ensemble of AMIP-style simulations, while the Tier 2 request will encompass uncertainties in the applied forcing, atmospheric composition, single forcings and leave-one-out responses. Since clouds play such a critical role in explaining recent observed EEI changes, output from satellite cloud observation simulators will be critical along with TOA and surface radiative fluxes.
1.1. CERES data
Since March 2000, data from the Clouds and the Earth's Radiant Energy System (CERES) project has provided time series of TOA and surface radiative fluxes along with the associated cloud, aerosol, surface, and meteorological properties for a range of time and space scales (Wielicki et al., 1996; Loeb et al., 2016a,b). Here we use TOA fluxes from the CERES Energy Balanced and Filled (EBAF) Ed4.2 product, which provides monthly mean TOA and surface SW, LW and net radiative fluxes on a 1° × 1° grid along with imager-derived cloud properties. The EBAF product is generated using CERES and imager instruments on the Terra, Aqua and NOAA-20 satellites. CERES EBAF data have been used to quantify recent changes in EEI (Loeb et al., 2021) and to infer contributions from forcings and feedbacks to the observed trends/changes in SW and LW radiation through combined use of CERES and radiative transfer model calculations and atmospheric and climate model simulations (Kramer et al., 2021; Raghuraman et al., 2021).
Uncertainties in TOA flux trends for a given period are due to internal variability in the climate system, which depends upon the length of the record, and systematic error in the data record itself. The latter depends upon the calibration stability of the instruments used as well as how consistently the data product is generated throughout the record (i.e., algorithms, ancillary input data, sampling, etc.). Following the methodology described in Loeb et al. (2022), we estimate the 95% trend uncertainty due to internal variability for global monthly mean anomalies between 2001 and 2021 to be 0.24, 0.22, and 0.21 Wm−2 dec−1 for SW, LW and NET, respectively (Table 1). Systematic errors are determined by comparing the individual time series from the CERES Terra and Aqua instruments, as provided in the CERES SSF1deg Ed4.1 product, which provides gridded monthly mean TOA fluxes. As shown in Table 1, the absolute value of the Terra-Aqua trend bias is <0.05 Wm−2 dec−1, and the 95% confidence interval (CI) in the trend difference is <0.2 Wm−2 dec−1. Thus, for the 20-year period considered, the trend uncertainty due to internal variability dominates the overall trend uncertainty (though more so for SW than for LW trends). We expect the trend uncertainty due to internal variability to decrease as the CERES record gets longer.
Table 1
| Internal variability | Systematic error (Terra–Aqua trend difference Wm−2dec−1) | All | |||
|---|---|---|---|---|---|
| CI | Bias | CI | Total | ||
| SW | 0.24 | 0.011 | 0.057 | 0.058 | 0.25 |
| LW | 0.22 | 0.032 | 0.17 | 0.17 | 0.28 |
| NET | 0.21 | −0.043 | 0.13 | 0.14 | 0.25 |
Estimated TOA flux trend uncertainties for 2001–2021 due to internal variability in the data and systematic error.
Uncertainties correspond to a 95% confidence interval (CI). “Total” systematic error and “All” are determined by summing individual error terms in quadrature.
EBAF Edition 4.2 is the latest version of the product. For TOA fluxes, the main difference with Edition 4.1 is the introduction of CERES Flight Model 6 (FM6) instrument on NOAA-20 starting in March 2022. Prior to this date, CERES instruments on Terra and Aqua are used in all EBAF product versions. Since the equatorial crossing times for Terra and Aqua are no longer held fixed, CERES FM6 is continuing the EBAF record to mitigate against any possible spurious trends associated with the drifting Terra and Aqua orbits. Note the analyses in this paper only use data through the end of 2021 and are unaffected by this change.
1.2. Existing CMIP6 simulations
The most recent round of coordinated climate model simulations come from the CMIP6 (Eyring et al., 2016; Durack et al., 2018). Within the suite of specified experiments of relevance, there are the historical coupled simulations (from 1850 to 2014) (e.g. Miller et al., 2021), projected coupled simulations (2015 onwards) using various Shared Socioeconomic Pathways (SSPs) (e.g., Nazarenko et al., 2022), and “AMIP” simulations (from 1979 to 2014) which use the observed sea surface temperature (SST) and sea ice concentration (SIC) to drive the atmospheric components of the coupled models. These have been used recently to compare to the CERES data (Raghuraman et al., 2021; Stephens et al., 2022).
Unfortunately, the crossover date between historically-informed simulations and storyline-based scenarios (1/1/2015) falls in the middle of the CERES timeseries. In particular, the AMIP-style simulations, which allow the models to follow the prescribed El Niño/Southern Oscillation (ENSO) patterns, do not go past 2014. The coupled simulations are continuous across this point (going smoothly from historical to SSP-related projections), but in the coupled historical or future simulations, modeled ENSO behavior is not tied to the observed time history of ENSO. Given the relative shortness of the CERES trends (~2 decades), the specific time-history of ENSO will impact both the interannual and long term trends in TOA radiation fluxes, particularly the regional patterns. Furthermore, the single forcing experiments used in DAMIP are for coupled models only, and have not been performed for the AMIP simulations, limiting the analysis that can be done to breakdown the individual drivers. Additionally, many key input forcing datasets have been revised since they were developed for CMIP6, and these have yet to be used with most state-of-the-art models.
We note that the comparisons of CERES data with any of the CMIP models are slightly compromised by the incomplete energy budgets in the models. This includes missing changes in mountain glaciers, ice sheets and ice shelves, which in the real world have been melting (Slater et al., 2021) and thus have contributed to the EEI, while in the models these are generally assumed fixed. Similarly, there has been a heat flux into the land surface (below the modeled soil layers) that is also not included in most models (Cuesta-Valero et al., 2021). Smaller magnitude issues include missing accounting for non-renewable waste heat input, or potential non-conservation errors. We estimate that this could lead to a systematic difference of a couple of hundredths Wm−2dec−1 in the EEI trends, which while small, are not totally negligible (von Schuckmann et al., 2023).
1.3. Updates to input data sets
Since the CMIP6 input data sets (covering 1850–2014) were finalized around 2017 (Durack et al., 2018), there has been significant progress on improving the historical record through the removal of inhomogeneities, improvements in process modeling, and implementing corrections. Additionally, there are new observations available that cover the period 2015 to the present. The key dataset updates that are relevant are the ocean forcings (SST and SIC) (used for the AMIP-style simulations), and the emissions of short-lived climate forcers (notably reactive gases and aerosols). There are also updates to the GHG, solar, volcanic and land use/land cover data sets which however are not likely to be significantly different from the scenario extensions. Post-2014 observations will include the impacts of the 2015/2016 El Niño event (and subsequent La Niña events), the 2017/2021 Canadian wildfires, the 2019/20 Australian wildfires, the 2020 Californian wildfires, volcanic events through 2021 (GlosSac v2.2, Kovilakam et al., 2023), and the 2020–2021 impacts of COVID-related restrictions (Jones et al., 2021). Updates to the source data for solar variability and the associated inputs like irradiance, particle fluxes etc. are available from LASP (Coddington et al., 2019) and are being prepared for CMIP use (for instance, they have already been updated to 2019 for the CCMI effort https://solarisheppa.geomar.de/solarisheppa/ccmi2022).
Improvements in the SST datasets have been documented in the transition from HadSST2 (the basis for the SST fields in HadISST1, which were used to drive AMIP simulations in CMIP6) to HadSST4 (Kennedy et al., 2019), the source of SSTs in the HadISST2 dataset (Titchner and Rayner, 2014). This has led to up to 50% higher trends, particularly in the Southern Hemisphere over the period 1990–2019 as the inhomogeneities between buoy data and engine intake data have been mitigated. Preliminary updates to HadISST2.x are underway, and we anticipate that data through to the end of 2021 will be fully available soon.
Anthropogenic emissions of short-lived climate forcings are collated through the Community Emission Data System (CEDS) (Hoesly et al., 2018). Updates to these data through 2019 (v_2021_04_21, released in April 2022), using updated energy data, country inventories, technology factors etc. have resulted in lower black carbon and organic carbon emissions from 1990 onwards, lower non-methane hydrocarbon emissions, and lower NOx and SO2 from Asian sources after 2010 (see https://github.com/JGCRI/CEDS/blob/master/documentation/Version_comparison_figures_v_2021_04_21_vs_v_2016_07_16(CMIP6)pdf). Further updates to the end of 2021 are anticipated by mid-2023 which will encompass the regional responses to COVID restrictions and the Australian wildfires of 2019/2020, and mandated shifts in marine shipping emissions. Another known issue with the CMIP6 forcings was the change in frequency of biomass burning data in 1990s which in some models with a high sensitivity to aerosols, caused a spurious warming (Fasullo et al., 2022; Heyblom et al., 2022).
The CMIP working group have recently set up a Forcing Task Team, who plan to deliver up-dated historical forcings (through to 2021) in 2024, and thereafter update them annually (https://wcrp-cmip.org/cmip7-task-teams/forcings/) using the revised inputs described here.
2. Proposed CERESMIP experimental protocol
The CERESMIP activity is proposed to remedy the issues discussed above efficiently and with minimal computational overhead (Table 2). The Tier 1 request is particularly simple, while the optional Tier 2 simulations allow for a deeper exploration of the specific attribution to particular forcings, the impact of internal variability and radiative feedbacks, and an exploration of the impact of uncertain forcing. For models that cannot use, or prefer not to use, interactive atmospheric composition we will supply aerosol mass and ozone concentration fields, initially derived from the GISS models, to the community, consistent with the CEDS emissions and the other forcings (including solar and volcanic ozone effects), though this will necessarily lag the release of the emission data. These fields will inevitably be biased or deficient in some way, and so we will solicit additional estimates from other groups that run with interactive emissions that could be used as an alternative forcing.
Table 2
| Experiment name | Description | Tier | Start year | End year | Ensemble size | Notes |
|---|---|---|---|---|---|---|
| 1. Combined forcings atmospheric simulations | ||||||
| 1.1 amip | All forcings (single run) with observed SST/SIC | 1 | 1990 | 2021 | 3+ | As C‘MIP6 AMIP but with updated forcings. |
| 1.2 amip-nudge | All forcings (single run, nudged winds) with observed SST/SIC | 2 | 1990 | 2021 | 1 | |
| 1.3 amip-nat | Natural forcings (solar + volcanic + orbital) with observed SST/SIC | 2 | 1990 | 2021 | 3+ | AMIP SST/SIC and natural forcings only. All other boundary conditions set to 1850. |
| 2. Single forcing atmospheric simulations | ||||||
| 2.1 amip-ghg | Well-mixed greenhouse-gas-only simulations with observed SST/SIC | 2 | 1990 | 2021 | 3+ | AMIP SST/SIC and WM-GHG forcings only. All other boundary conditions set to 1850. |
| 2.2 amip-aer | Anthropogenic-aerosol-only simulations with observed SST/SIC | 2 | 1990 | 2021 | 3+ | AMIP SST/SIC and aerosol forcings only. All other boundary conditions set to 1850. |
| 2.3 amip-slcf | Anthropogenic changes in short-lived climate forcings (for use with models including interactive composition) with observed SST/SIC | 2 | 1990 | 2021 | 3+ | AMIP SST/SIC and SLCF only (by emission). All other boundary conditions set to 1850. |
| 2.4 amip-sst | Observed SST/SIC change only | 2 | 1990 | 2021 | 3+ | AMIP SST/SIC only. All other boundary conditions set to 1850. |
| 3. All-but-one atmospheric simulations | ||||||
| 3.1 amip-noghg | As with amip, but no changes in well-mixed GHGs | 2 | 1990 | 2021 | 3+ | All AMIP forcings except with WM-GHGs set to 1850 levels. |
| 3.2 amip-noaer | As with amip, but no changes in aerosols | 2 | 1990 | 2021 | 3+ | All AMIP forcings except with aerosols set to 1850 levels. |
| 3.3 piclim-histall | As with amip, but using fixed pre-industrial SST/SIC | 2 | 1990 | 2021 | 3+ | All historical forcings with SST/SIC fixed at PI (~1850) conditions. |
CERESMIP coordinated model experiments.
Forcings are those defined by CMIP6 (Eyring et al., 2016; Durack et al., 2018; Miller et al., 2021) with updates as described in the text. Variations and uncertainties in historical forcings may be explored by submitting additional atmospheric simulations identified with a different f-tag to the database and documenting the forcings used. Note that there is no requirement for groups to complete all, or indeed any, of the tier 2 experiments in order to participate.
As proposed, the CERESMIP activity will be an “in-between” CMIP project, since it will use the atmospheric components of models that were submitted to CMIP6, with only updated forcings for the CERES period, thus avoiding the overhead of additional DECK or historical coupled runs. This relatively low cost activity can therefore happen prior to the next full round of CMIP which is not slated to start until ~2026. Given the importance of the science questions raised by the recent divergence of models and observations, we think that this should be tackled as early as possible by groups that have an interest.
2.1. Tier 1 experiment
We propose that model groups perform, at minimum, a three-member AMIP-style experiment (Exp. 1.1) with existing models and updated forcings for the period 1990–2021. We propose starting the experiments in 1990 to allow for a decade of spin-up from the initial conditions taken from existing AMIP-style simulations within the CMIP6 protocol, to reduce the impact of drifts in upper-stratospheric or land surface properties over the target period of 2001–2021. Internal tropospheric variability in AMIP-style simulations is a little lower than in coupled simulations since the sequence of ENSO variations is fixed, but can have a significant impact on the global mean TOA fluxes since the mid-to-high latitude circulation is not tightly coupled to the SST forcing. For instance, in the GISS-E2.1 model, the standard deviation of EEI across the AMIP-style ensemble for a single year is 0.12 Wm−2 (compared to 0.35 Wm−2 in the coupled model). A three-member ensemble reduces the uncertainty in the estimate of the forced trend significantly, and with a higher number of ensemble members, the estimate would be tighter still. We note that this experiment is also feasible for higher resolution weather or seasonal forecast models that were used in HighResMIP (similar to highres-present) or did not contribute to CMIP6 at all.
2.2. Tier 2 experiments
For modeling groups that would like to help deepen the understanding of the radiative flux trends, the Tier 2 experiments allow for an exploration of dynamical and forcing uncertainties. Exp. 1.2 uses nudged winds (from a reanalysis project such as MERRA-2 [Gelaro et al., 2017] or ERA5 [Hersbach et al., 2020]) to see the impacts of having the atmospheric circulation more closely pinned to observations. Exp 1.3 is focused on providing a contrast between the all-forcing simulations and the natural-only drivers (these will include solar forcing, volcanic activity and possibly orbital changes, if they are standard for the corresponding historical simulations). Any of these experiments can be redone using alternative forcing sets to explore, for instance, aerosol uncertainty, using the ‘f' designation in the #ripf simulation descriptor [see Taylor et al. (2018) for details].
The remaining sets of experiments (Exp. 2.x and 3.x) will be used for the attribution of changes by forcings. We propose a small number of single and all-but-one forcing AMIP-style experiments that disentangle the major roles of greenhouse gases, aerosols, and feedbacks (Andrews, 2014; Marvel et al., 2016). Note that we anticipate that there will be interactions among the different forcings, and therefore we do not necessarily anticipate the results of the, for example, GHG-only experiments, will be equal to the amip minus the noGHG runs (Lunt et al., 2021). Further subsets of forcings can also be considered by modeling groups that are so inclined. The inclusion of single-forcing and all-but-one forcing experiments will allow the extent of the non-linearity of responses to forcings to be assessed.
The key experiments are atmospheric simulations with changing SST/SIC; changes in well-mixed greenhouse gases (Exp. 2.1); changes in tropospheric aerosols (Exp 2.2); changes in land use/land cover (Exp 2.3); and, for models that have interactive composition, runs with changes in all short-lived climate forcing emissions (Exp. 2.4) (all other forcings kept constant at pre-industrial levels). An additional Tier 2 experiment is proposed (Exp. 2.5) where we force the model only with SST/SIC which is an excellent way to diagnose the climate feedback contribution to the EEI (Andrews et al., 2022). The complementary experiments (amip with all-forcings-but-one) (i.e. Exp. 3.1 and 3.2) will help diagnose interactions between the forcings. Finally, Exp. 3.3 is a standard simulation that will allow the effective radiative forcing of the updated inputs to be calculated if there are existing piclim simulations from previous CMIP6 efforts. Uncertainties in the drivers (or in the atmospheric composition more generally) can be explored using “forcing”-variants in the CMIP database.
2.3. Diagnostic requests
The requested diagnostics are a subset of the basic CMIP6 historical output. Notably, we request only the monthly atmospheric diagnostics (the Amon table), relevant parts of the sea ice diagnostics (SImon) and, due to the interest in cloud feedback responses, the CFmon table. For models with interactive composition, key diagnostics from the AERmon table will be useful (including aerosol optical depth). Ideally, we would like to be able to compare cloud responses in a uniform way across models and against satellite observations and so we strongly recommend the use of the CFMIP Observation Simulation Package (COSP) (Bodas-Salcedo et al., 2011) and/or COSP2 (Swales et al., 2018) for groups that are able to provide this. Details of the specific tables can be found at https://github.com/PCMDI/cmip6-cmor-tables/tree/master/Tables.
2.4. Timeline and diagnostic availability
Many updated inputs should be available in 2023, and we anticipate preliminary results should be available by the end of 2023. Pointers to relevant input data sets and progress reports will be available at https://data.giss.nasa.gov/CERESMIP. We plan to convene an AGU session in December 2023 and a workshop in conjunction with the CERES Science Team meeting in 2024 (date TBD). Public data availability will be through the CMIP6plus effort (as described in https://www.wcrp-climate.org/images/modelling/WGCM/WGCM25/Day2_10_Durack_CMIP6_Update.pdf).
3. Preliminary results
Following on from recent papers using existing simulations (Raghuraman et al., 2021; Loeb et al., 2022; Stephens et al., 2022), we have analyzed a wider range of existing GISS ModelE simulations using the GISS-E2.1-G and GISS-E2.2-G coupled models and AMIP-style simulations with GISS-E2.1 atmospheric component (Kelley et al., 2020; Rind et al., 2020). Additionally, we have used GISS-E2.1 with updated SST/SIC (HadISST 2.3, through to 2019) to redo an AMIP-style simulation (as per Exp. 1.1) (with updated GHGs, but with constant aerosols from 2015 on). Figure 2A shows that, consistent with previously reported results, existing GISS CMIP6 coupled configurations have a trend in EEI that is consistently about half what is inferred from CERES (~0.2 Wm−2 dec−1), though the spread across ensemble members is large (±0.06 to ±0.18 Wm−2 dec−1, 95% envelope, depending on the configuration) as a function of the internal variability. The EEI trends in the AMIP-style simulations (red) have a large uncertainty due to the real world variations in ENSO and the shorter time period. The updated AMIP-style run (green) with new SST/SIC files shows a bigger discrepancy with the net observations (unsurprising since outgoing longwave radiation will increase with the more rapidly warming SST in the updated SST/SIC files), but we note that this is a single run.
Figure 2
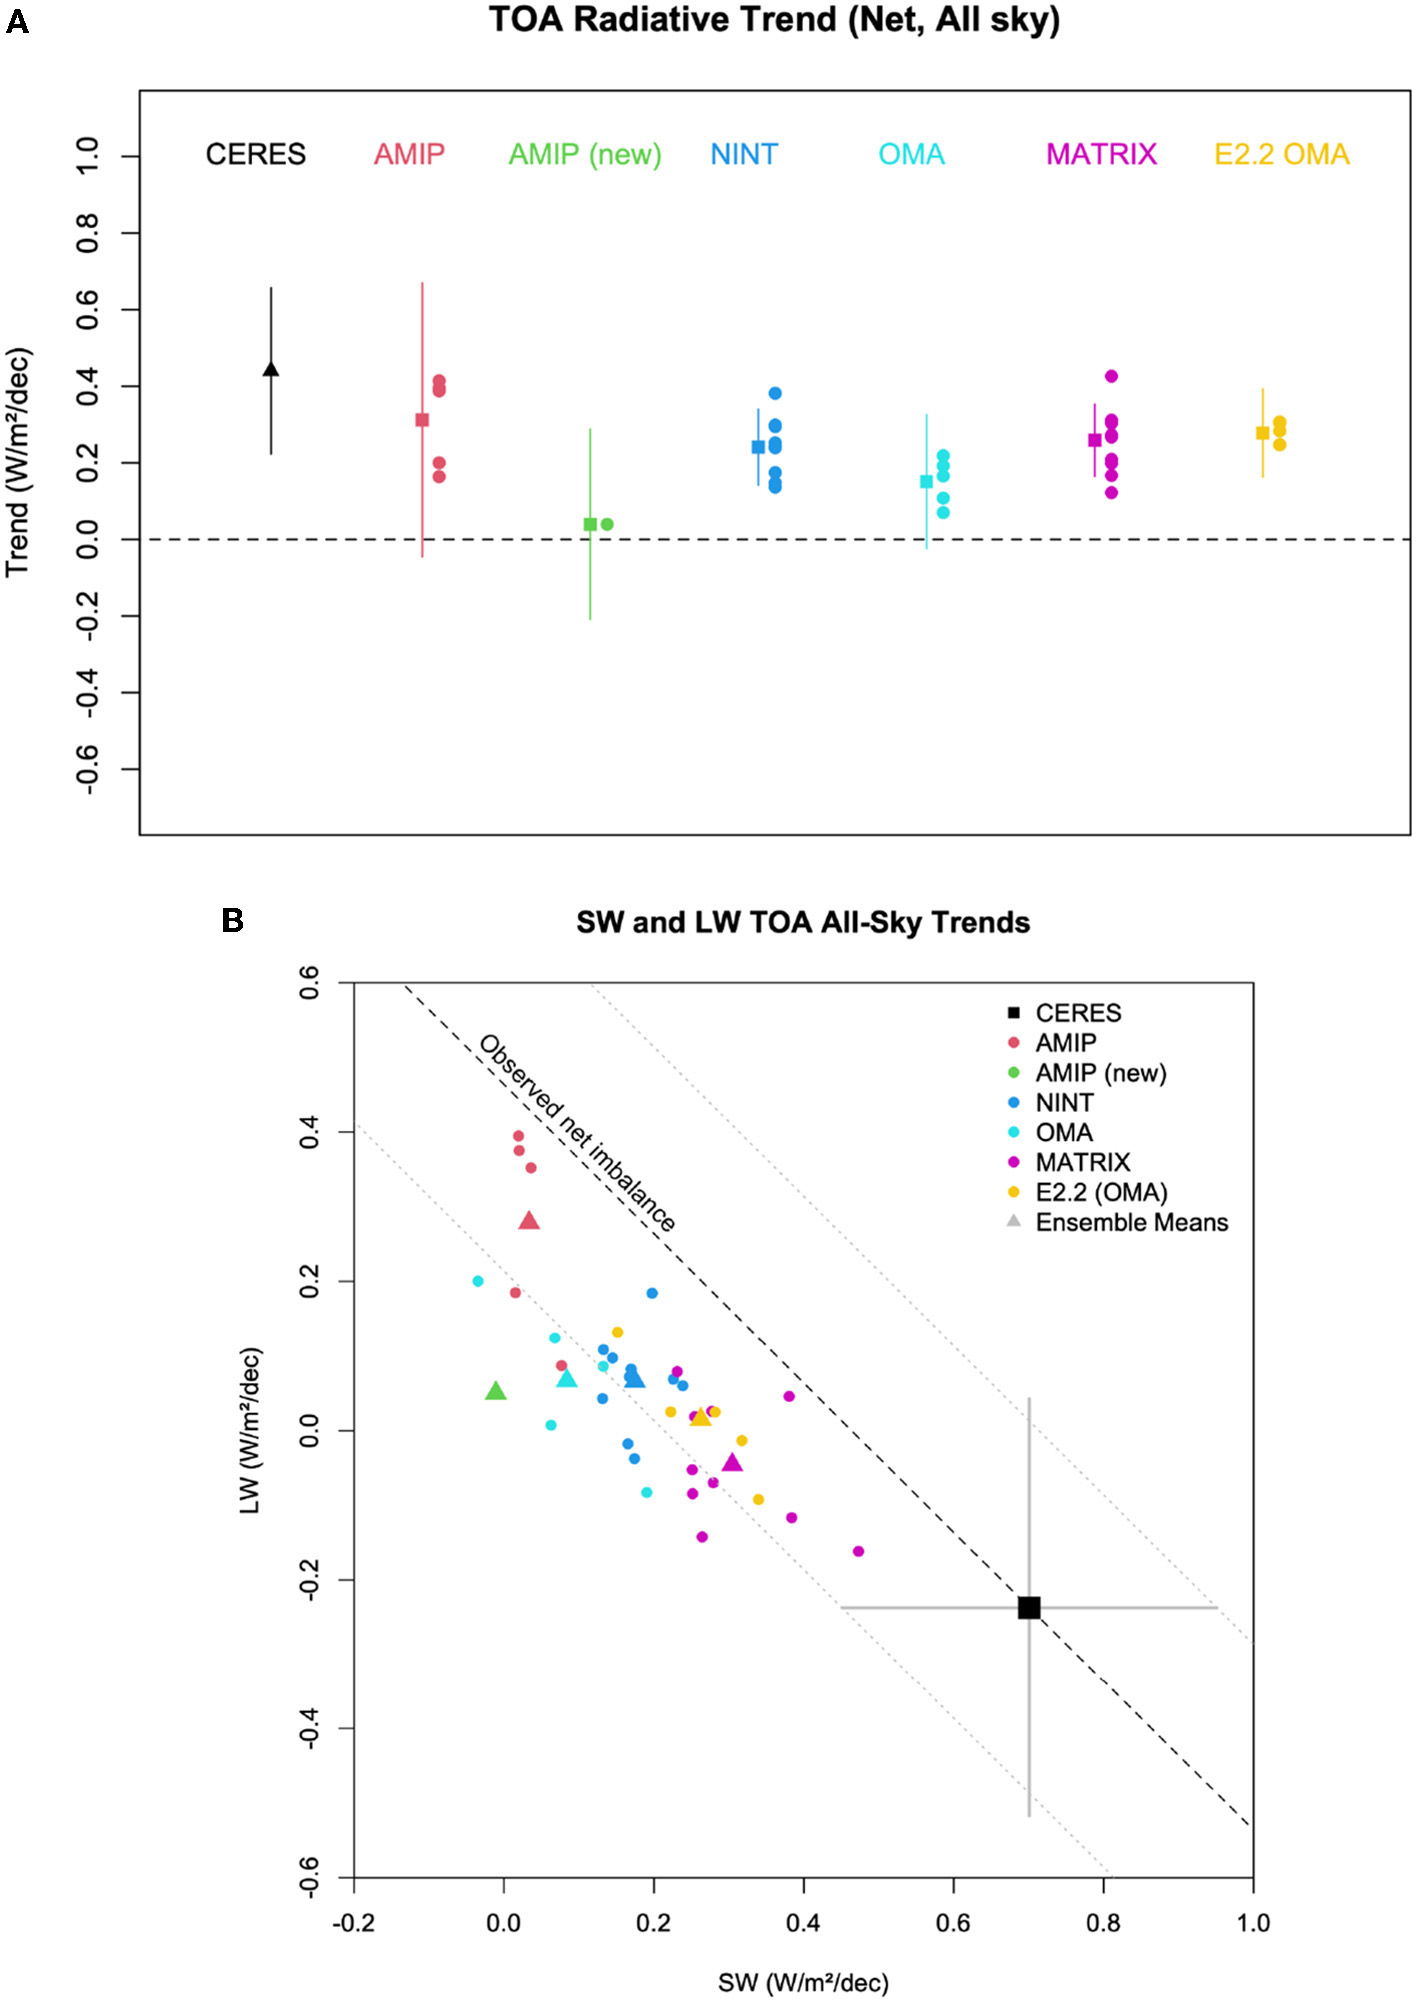
2001–2021 linear trends [from observations (EBAF Ed4.2, black), single runs (dots) and ensemble mean (with 95% uncertainty on the linear regression) for GISS-E2.1/2-G. E2.1 configurations. AMIP (orig, red) and AMIP (new, green) trends are for the available period (2001–2014 and 2001–2019, respectively)]. The new AMIP simulation uses the same composition as NINT and the original AMIP simulations but with updated SST and SIC. Note that NINT, OMA, and MATRIX correspond to physics variations in the CMIP6 database [NINT = GISS-E2.1-G p1 (10 runs), OMA = p3 (E2.1, 10 runs; E2.2, 5 runs), MATRIX = p5 (E2.1, 5 runs)]. (A) Is the net radiative imbalance trend, while (B) shows the shortwave and longwave trends independently. Positive fluxes are downward at the TOA.
The coupled model configurations included in the figure differ in their treatment of atmospheric composition. The Non-INTeractive (NINT) configuration uses fixed time-varying ozone and aerosol fields which do not vary with the climate simulation, and which were derived from AMIP simulations using the One-Moment-Aerosol (OMA) scheme and interactive gas-phase chemistry (Miller et al., 2021). The MATRIX configuration uses a more complex modal aerosol scheme and interactive chemistry (Bauer et al., 2020). Trends in aerosol forcing differ between the OMA and MATRIX simulations, with aerosols decreasing faster in the MATRIX simulations (Bauer et al., 2022).
However, examining the breakdown of shortwave and longwave components (Figure 2B) shows that these AMIP runs do not match the shortwave component of the trends at all, though the updated AMIP run has a better response in the longwave. The coupled models, particularly the MATRIX simulations, have better (but still deficient) shortwave trends and less of a discrepancy in the longwave. These results underline the previously reported potential discrepancy in EEI trends, and suggest that the results are affected by the aerosol components, at least with the original CMIP6 emissions. There may be important dependencies on variations in model physics as well, which further motivates the need for an organized intercomparison.
4. Planned analysis
The highest priority for the analysis is to see whether the results from the multi-model ensemble (MME) (Exp. 1.1) continue to exhibit a significant discrepancy with the observations, both in the long-wave and short-wave components and regionally as well as globally. We will also look for potential correlations to model sensitivity (all else being equal, higher climate sensitivity would imply a higher EEI for the same GHG trajectory), and aerosol effects. Subsequently, we will be able to assess the importance of the specific weather realization (using Exps. 1.1 and 1.2), particularly in the extra-tropics. Furthermore, using the MME we may be able to extract the fingerprint of ENSO variation on the spatio-temporal patterns of TOA radiative fluxes, and use that to get a clearer view of the forced changes which should be more comparable to the coupled model ensembles.
Results from Exp. 2 will allow for a fuller attribution of both the EEI trends in the models (to GHGs, aerosols, natural forcings, internal variability and cloud feedbacks), as well as providing input data into an attribution study for the real trends using the simulated regional fingerprints in long and shortwave fields and an optimal detection and attribution technique (e.g., Gillett et al., 2021). Combined with results from Exp 3., we will be able to extract potential interactions between the drivers (such as the impact of higher humidity due to global warming interacting with the aerosol properties and effects driven from emissions). Additionally, to the extent that calculations of implied regional ocean heat uptake (via surface fluxes) are valid, particularly in the nudged simulations (Exp. 1.3), we may be able to compare the results directly to the regional observed ocean heat content change in observations.
The overall aim is to isolate issues that relate to forcings and feedbacks that will guide both interpretation of the observations, but also guide the development of climate models and their inputs. This can only be achieved if the comparisons are as compatible as possible.
5. Summary
We propose a short, low cost extension to the CMIP6 DECK protocols to examine and attribute the increasing EEI seen in the CERES and in-situ data since 2001. We welcome broad contributions from all atmospheric modeling groups. The Tier 1 experiment is designed to be maximally accessible for the largest number of modeling groups, while the Tier 2 experiments are very similar (but lower cost) to experiments done within DAMIP and LESFMIP (Smith et al., 2022). This is an excellent opportunity to demonstrate the community need to move toward maintaining and updating input data sets on a more regular basis, and to take advantage of a new climate data record that has only recently become long enough and well-characterized enough to serve as a key target for model-data comparisons.
Statements
Data availability statement
Publicly available datasets were analyzed in this study. This data can be found here: https://ceres.larc.nasa.gov/data/#energy-balanced-and-filled-ebaf~https://portal.nccs.nasa.gov/datashare/giss_cmip6/.
Author contributions
GS, TA, SB, PD, NL, and VR jointly conceived of the protocol and solicited input from the broader community. Figure 1 was provided by GJ and JL. Figure 2 was created by GS. NA, MB, JC, LH, GJ, JL, BM, TM, DO, DP, SR, MS, DT, VT, PT, and TZ contributed to the fine-tuning of the protocols. All authors contributed to the writing of the paper.
Funding
Climate modeling at GISS was supported by the NASA Modeling, Analysis and Prediction program and simulations are made possible by the NASA Center for Climate Simulation (NCCS). We acknowledge the World Climate Research Programme, which, through its Working Group on Coupled Modelling, coordinates and promotes CMIP activities. TA was supported by both the Met Office Hadley Centre Climate Programme funded by BEIS, and the European Union's Horizon 2020 research and innovation programme under grant agreement 820829. The work of PD was performed under the auspices of the U.S. Department of Energy, Office of Science, Earth, and Environmental Systems Sciences Division, Regional and Global Model Analysis Program by Lawrence Livermore National Laboratory (LLNL) under Contract DE-AC52-07NA27344. LLNL Release Number: LLNL-JRNL-849403. BM acknowledges support by the U.S. Department of Energy under Award Number DE-SC0022070 and National Science Foundation (NSF) IA 1947282; the National Center for Atmospheric Research, which is a major facility sponsored by the NSF under Cooperative Agreement No. 1852977; and the National Oceanic and Atmospheric Administration under award NA20OAR4310392. TM was supported by the Japan Society for the Promotion of Science KAKENHI (Grant JP19H05669), the Advanced Studies of Climate Change Projection (SENTAN) of the Ministry of Education, Culture, Sports, Science, and Technology (Grant JPMXD0722680395), the Environment Research and Technology Development Fund (Grant JPMEERF21S12004) of the Environmental Restoration and Conservation Agency Provided by the Ministry of Environment of Japan, and the JST FOREST Program (Grant JPMJFR206Y).
Acknowledgments
We thank Leo Donner, Vaishali Naik, Fabien Paulot, and two reviewers for comments on the draft paper.
Conflict of interest
The authors declare that the research was conducted in the absence of any commercial or financial relationships that could be construed as a potential conflict of interest.
Publisher’s note
All claims expressed in this article are solely those of the authors and do not necessarily represent those of their affiliated organizations, or those of the publisher, the editors and the reviewers. Any product that may be evaluated in this article, or claim that may be made by its manufacturer, is not guaranteed or endorsed by the publisher.
References
1
AndrewsT. (2014). Using an AGCM to diagnose historical effective radiative forcing and mechanisms of recent decadal climate change. J. Climate. 27, 1193–1209. 10.1175/JCLI-D-13-00336.1
2
AndrewsT.Bodas-SalcedoA.GregoryJ. M.DongY.ArmourK. C.PaynterD.et al. (2022). On the effect of historical SST patterns on radiative feedback. J. Geophys. Res. Atmos. 127, e2022JD036675. 10.1002/essoar.10510623.2
3
BarkstromB. R.Louis SmithG. (1986). The earth radiation budget experiment: science and implementation. Rev. Geophys.24, 379. 10.1029/RG024i002p00379
4
BauerS. E.TsigaridisK.FaluvegiG.KelleyM.LoM. M.MillerL.et al. (2020). Historical 1850-2014 aerosol evolution and role on climate forcing using the GISS ModelE2.1 contribution to CMIP6. J. Adv. Model. Earth Syst.12, e2019MS001978. 10.1029/2019MS001978
5
BauerS. E.TsigaridisK.FaluvegiG.NazarenkoL.MillerR. L.KelleyM. (2022). The turning point of the aerosol era. J. Adv. Model. Earth Syst. 14, e2022MS003070. 10.1029/2022MS003070
6
Bodas-SalcedoA.WebbM. J.BonyS.ChepferH.DufresneJ.KleinS. A.et al. (2011). COSP: Satellite simulation software for model assessment. Bull. Am. Meteorol. Soc.92, 1023–1043. 10.1175/2011BAMS2856.1
7
ChengL.AbrahamJ.TrenberthK. E.FasulloJ.BoyerT.MannM. E.et al. (2022). Another record: ocean warming continues through 2021 despite la niña conditions, advances in atmospheric. Sciences.39, 373–385. 10.1007/s00376-022-1461-3
8
CoddingtonO.LeanJ.PilewskieP.SnowM.RichardE.KoppG.et al. (2019). Solar irradiance variability: comparisons of models and measurements. Earth Space Sci.6, 2525–2555. 10.1029/2019EA000693
9
Cuesta-ValeroF. J.García-GarcíaA.BeltramiH.FinnisJ. (2021). First assessment of the earth heat inventory within CMIP5 historical simulations. Earth Syst. Dynam. 12, 581–600, 10.5194/esd-12-581-2021
10
DonohoeA.ArmourK. C.PendergrassA. G.BattistiD. S. (2014). Shortwave and longwave radiative contributions to global warming under increasing CO2. Proc. Natl. Acad. Sci. U.S.A.111, 16700–16705. 10.1073/pnas.1412190111
11
DurackP. J.TaylorK. E.EyringV.AmesS. K.HoangT.NadeauD. (2018), Toward standardized data sets for climate model experimentation. Eos.99, 751. 10.1029/2018EO101751.
12
EyringV.BonyS.MeehlG. A.SeniorC. A.StevensB.StoufferR. J.TaylorK. E. (2016). Overview of the Coupled Model Intercomparison Project Phase 6 (CMIP6) experimental design and organization. Geosci. Model Dev.9, 1937–1958. 10.5194/gmd-9-1937-2016
13
FasulloJ. T.LamarqueJ.-F.HannayC.RosenbloomN.TilmesS.DeRepentignyP.et al. (2022). Spurious late historical-era warming in CESM2 driven by prescribed biomass burning emissions. Geophys. Res. Lett.49, e2021GL097420. 10.1029/2021GL097420
14
GelaroR.McCartyW.SuarezS.TodlingR.MolodA.TakacsL.et al. (2017). The modern-era retrospective analysis for research and applications, version 2 (MERRA-2), J. Clim.30, 5419–5454. 10.1175/JCLI-D-16-0758.1
15
GillettN. P.Kirchmeier-YoungM.RibesA.et al. (2021). Constraining human contributions to observed warming since the pre-industrial period. Nat. Clim. Chang. 11, 207–21210.1038/s41558-020-00965-9
16
HakubaM. Z.FrederikseT.LandererF. W. (2021). Earth's energy imbalance from the ocean perspective (2005–2019). Geophys. Res. Lett. 48, e2021GL093624. 10.1029/2021GL093624
17
HansenJ.FungI.LacisA.RindD.LebedeffS.RuedyR.et al. (1988). Global climate changes as forecast by Goddard Institute for Space Studies three-dimensional model. J. Geophys. Res., 93, 9341–9364. 10.1029/JD093iD08p09341
18
HansenJ.NazarenkoL.RuedyR.SatoM.WillisJ.Del GenioA.et al. (2005). Earth's energy imbalance: confirmation and implications. Science.308, 1431–1435. 10.1126/science.1110252
19
HansenJ.SatoM.KharechaP.von SchuckmannK. (2011). Earth's energy imbalance and implications. Atmos. Chem. Phys.11, 13421–13449. 10.5194/acp-11-13421-2011
20
HersbachH.BellB.BerrisfordP.HiraharaS.HorányiA.Muñoz SabaterJ.et al. (2020). The ERA5 global reanalysis. Q. J. Royal Meteorological Soc.146, 1999–2049. 10.1002/qj.3803
21
HeyblomK.SinghB.RaschH. A.DeRepentignyP. (2022). Increased variability of biomass burning emissions in CMIP6 amplifies hydrologic cycle in the CESM2 large ensemble. Geophys. Res. Lett.49, e2021GL096868. 10.1029/2021GL096868
22
HoeslyR. M.SmithS. J.FengL.KlimontZ.Janssens-MaenhoutG.PitkanenT.et al. (2018). Historical (1750–2014) anthropogenic emissions of reactive gases and aerosols from the Community Emissions Data System (CEDS). Geosci. Model Dev. 11, 369–408. 10.5194/gmd-11-369-2018
23
JohnsonG. C.LymanJ. M.LoebN. G. (2016). Improving estimates of Earth's energy imbalance. Nat. Clim. Chang.6, 639–640. 10.1038/nclimate304
24
JonesC. D.HickmanJ. E.RumboldS. T.WaltonJ.LambollR. D.SkeieR. B.et al. (2021). The climate response to emissions reductions due to COVID19: initial results from CovidMIP. Geophys. Res Lett.48, e2020GL091883. 10.1029/2020GL091883
25
KelleyM.SchmidtG. A.NazarenkoL.BauerS. E.RuedyR.RussellG.et al. (2020). GISS-E2.1: configurations and climatology. J. Adv. Model. Earth Syst.12, e2019MS002025. 10.1029/2019MS002025
26
KennedyJ. J.RaynerN. A.AtkinsonC. P.KillickR. E. (2019). An ensemble data set of sea-surface temperature change from 1850: the Met Office Hadley Centre HadSST.4.0.0.0 data set. J. Geophys. Res.: Atmos. 124, 867. 10.1029/2018JD029867
27
KovilakamM.ThomasonL.KneppT. (2023). SAGE III/ISS aerosol/cloud categorization and its impact on GloSSAC, Atmos. Meas. Tech. Discuss.16, 2709–2731. 10.5194/amt-16-2709-2023
28
KramerR. J.HeH.SodenB. J.OreopoulosL.MyhreG.ForsterP. M.et al. (2021). Observational evidence of increasing global radiative forcing. Geophys. Res. Lett. 48, e2020GL091585. 10.1029/2020GL091585
29
LevitusS.AntonovJ. I.BoyerT. P.StephensC. (2001). Warming of the world ocean. Science.287, 2225–2228. 10.1126/science.287.5461.2225
30
LoebN. G.JohnsonG. C.ThorsenT. J.LymanJ. M.RoseF.KatoS. (2021), Satellite ocean data reveal marked increase in Earth's heating rate, Geophys. Res. Letts. 48, 13. 10.1029/2021GL093047
31
LoebN. G.Manalo-SmithN.SuW.ShankarM.ThomasS. (2016a). CERES Top-of-atmosphere earth radiation budget climate data record: accounting for in-orbit changes in instrument calibration. Remote Sens. 8, 182. 10.3390/rs8030182
32
LoebN. G.MayerM.KatoS.FasulloJ. T.ZuoH.SenanR.et al. (2022). Evaluating twenty-year trends in Earth's energy flows from observations and reanalyses. J. Geophysical Research: Atmosp.127, e2022JD036686. 10.1029/2022JD036686
33
LoebN. G.SuW.DoellingD. R.WongT.MinnisP.ThomasS.MillerW. F. (2016b). “Earth's top-of-atmosphere radiation budget,” in Comprehensive Remote Sensing (Elsevier) p. 67–84. 10.1016/B978-0-12-409548-9.10367-7
34
LoebN. G.WangF. G.RoseS.KatoW. L.SmithS.Sun-MackS. (2018). Clouds and the earth's radiant energy system (CERES) energy balanced and filled (EBAF) top-of-Atmosphere (TOA) edition 4.0 data product. J. Climate.31, 895–918. 10.1175/JCLI-D-17-0208.1
35
LoebN. G.WielickiB. A.DoellingD. R.SmithG. L.KeyesD. F.KatoS. N.et al. (2009). Toward optimal closure of the earth's top-of-atmosphere radiation budget. J. Clim.22, 748–766. 10.1175/2008JCLI2637.1
36
LuntD. J.ChandanH. J.DowsettA. M.HaywoodG. M.LuntJ. C.RougierU.et al. (2021). Multivariate factorisation of numerical simulations. Geosci. Model Dev. 14, 4307–4317. 10.5194/gmd-14-4307-2021
37
MarvelK.SchmidtG. A.MillerR. L.NazarenkoL. (2016). Implications for climate sensitivity from the response to individual forcings. Nat. Clim. Change. 6, 386–389. 10.1038/nclimate2888
38
Masson-DelmotteV.ZhaiV. P.PiraniA.ConnorsS. L.PéanC.BergerS.et al. (2021). “Climate Change 2021: The Physical Science Basis,” in Contribution of Working Group I to the Sixth Assessment Report of the Intergovernmental Panel on Climate Change. Cambridge: Cambridge University Press.
39
MeehlG. A.WashingtonW. M.CollinsW. D.ArblasterJ. M.HuA.BujaL. E.et al. (2005). How much more global warming and sea level rise?Science.307, 1769–1772. 10.1126/science.1106663
40
MillerR. L.SchmidtG. A.NazarenkoL.BauerS. E.KelleyM.RuedyR.et al. (2021). CMIP6 historical simulations (1850-2014) with GISS-E2.1. J. Adv. Model. Earth Syst.13, e2019MS002034. 10.1029/2019MS002034
41
NazarenkoL. S. NTausnevG. L.RussellD.RindR. L.MillerG. A. (2022). Future climate change under SSP emission scenarios with GISS-E2.1. J. Adv. Model. Earth Syst.14, e2021MS002871. 10.1002/2014MS000403
42
QuaasJ.JiaH.SmithC.AlbrightA. L.AasW.BellouinN.et al. (2022). Robust evidence for reversal in the aerosol effective climate forcing trend, Atmos. Chem. Phys. Discuss.22, 12221–12239. 10.5194/acp-22-12221-2022
43
RaghuramanS. P.PaynterD.RamaswamyV. (2021). Anthropogenic forcing and response yield observed positive trend in Earth's energy imbalance. Nat. Commun. 12, 4577. 10.1038/s41467-021-24544-4
44
RindD.OrbeC.JonasJ.NazarenkoL.ZhouT.KelleyM.et al. (2020). GISS model E2.2: a climate model optimized for the middle atmosphere — Model structure, climatology, variability and climate sensitivity. J. Geophys. Res. Atmos. 125, e2019JD032204. 10.1029/2019JD032204
45
SlaterT.LawrenceI. R.OtosakaI. N.ShepherdA.GourmelenN.JakobL.et al. (2021). Review article: Earth's ice imbalance. Cryosphere.15, 233–246. 10.5194/tc-15-233-2021
46
SmithD. M.GillettN. P.SimpsonI. R.AthanasiadisP. J.BaehrJ.BethkeI.et al. (2022). Attribution of multi-annual to decadal changes in the climate system: the large ensemble single forcing model intercomparison project (LESFMIP). Front. Clim. 4, 955414. 10.3389/fclim.2022.955414
47
StephensG. L.HakubaM. Z.KatoS.GettlemanA.DufresneJ.-L.AndrewsT.et al. (2022). The changing nature of Earth's reflected sunlight. Proc. R. Soc. A. 478, 20220053. 10.1098/rspa.2022.0053
48
StephensG. L.LiJ.WildM.ClaysonC. A.LoebN.KatoS.et al. (2012). An update on Earth's energy balance in light of the latest global observations. Nat. Geosci. 5, 691–696. 10.1038/ngeo1580
49
SwalesD. J.PincusR.Bodas-SalcedoA. (2018). The cloud feedback model intercomparison project observational simulator package: version 2. Geosci. Model Dev., 11, 77–81. 10.5194/gmd-11-77-2018
50
TaylorK. E.JuckesV.BalajiL.CinquiniS.DenvilP.DurackJ.et al (2018). CMIP6 global attributes, DRS, Filenames, Directory Structure, and CV's (v6.2.7) Available online at: https://goo.gl/v1drZl (accessed June 01, 2023).
51
TitchnerH. A.RaynerN. A. (2014), The Met Office Hadley Centre sea ice sea surface temperature data set, version 2:1. Sea ice concentrations. J. Geophys. Res. Atmos. 119, 2864– 2889. 10.1002/2013JD020316
52
TrenberthK. E.ChengL. (2022). A perspective on climate change from Earth's energy imbalance. Environ. Res. Climate. 1, 013001. 10.1088/2752-5295/ac6f74
53
von SchuckmannK. AMinéreF.GuesF. J.Cuesta-ValeroG.KirchengastS.et al. (2023). Heat stored in the Earth system 1960-2020: Where does the energy go?Earth Syst. Sci. Data12, 2013–2041, 2020. 10.5194/essd-12-2013-2020
54
von SchuckmannK.PalmerM. D.TrenberthK. E.CazenaveA.ChambersD.ChampollionN.et al. (2016). An imperative to monitor Earth's energy imbalance. Nat. Climate Chang.6, 138–144. 10.1038/nclimate2876
55
WielickiB. A.BarkstromB. R.HarrisonE. F.LeeR. B.SmithI.CooperJ. E. (1996). Clouds and the earth's radiant energy system (CERES): An earth observing system experiment, Bull. Amer. Meteor. Soc. 77, 853–868.2.0. 10.1175/1520-0477(1996)077<0853:CATERE>2.0.CO;2
Summary
Keywords
CMIP6, climate modeling, earth's energy balance, aerosols, cloud feedbacks, AMIP
Citation
Schmidt GA, Andrews T, Bauer SE, Durack PJ, Loeb NG, Ramaswamy V, Arnold NP, Bosilovich MG, Cole J, Horowitz LW, Johnson GC, Lyman JM, Medeiros B, Michibata T, Olonscheck D, Paynter D, Raghuraman SP, Schulz M, Takasuka D, Tallapragada V, Taylor PC and Ziehn T (2023) CERESMIP: a climate modeling protocol to investigate recent trends in the Earth's Energy Imbalance. Front. Clim. 5:1202161. doi: 10.3389/fclim.2023.1202161
Received
07 April 2023
Accepted
16 June 2023
Published
03 July 2023
Volume
5 - 2023
Edited by
Matthew Collins, University of Exeter, United Kingdom
Reviewed by
Jean-Louis Dufresne, Sorbonne Université (CNRS), France; Helene Muri, Norwegian University of Science and Technology, Norway
Updates
Copyright
© 2023 Schmidt, Andrews, Bauer, Durack, Loeb, Ramaswamy, Arnold, Bosilovich, Cole, Horowitz, Johnson, Lyman, Medeiros, Michibata, Olonscheck, Paynter, Raghuraman, Schulz, Takasuka, Tallapragada, Taylor and Ziehn.
This is an open-access article distributed under the terms of the Creative Commons Attribution License (CC BY). The use, distribution or reproduction in other forums is permitted, provided the original author(s) and the copyright owner(s) are credited and that the original publication in this journal is cited, in accordance with accepted academic practice. No use, distribution or reproduction is permitted which does not comply with these terms.
*Correspondence: Gavin A. Schmidt gavin.a.schmidt@nasa.gov
Disclaimer
All claims expressed in this article are solely those of the authors and do not necessarily represent those of their affiliated organizations, or those of the publisher, the editors and the reviewers. Any product that may be evaluated in this article or claim that may be made by its manufacturer is not guaranteed or endorsed by the publisher.