 Li-Sheng Hao
 Yi-Hui Ding2
 Yan-Ju Liu
- 1Tianjin Climate Center, Tianjin, China
- 2National Climate Center, Beijing, China
This study comprehensively analyzed the long-term changes of Meiyu in the middle and lower reaches of the Yangtze River with regard to precipitation, precipitation threshold, and interdecadal changes in atmospheric circulation. Results revealed obvious new features of Meiyu precipitation since 2000. (1) Meiyu precipitation shows a significant linear increase trend, with an average increment of 73.5 mm every 10 years. The increase in torrential rain is the most significant, accounting for 61% of the total precipitation increase, and its proportion has been increasing, while the proportions of light, moderate, and heavy rain in the total precipitation have been decreasing. (2) At the interdecadal scale, Meiyu precipitation and the local surface average temperature show opposite changes. Meiyu precipitation decreases by approximately 150 mm for every 1°C increase in the average temperature. This inverse correlation was not evident before 2000. (3) The saturated specific humidity in this area shows a significant increasing trend, indicating that precipitation in this area is caused by a higher threshold of atmospheric saturation and condensation, which may be a reason for the low Meiyu precipitation during high-temperature years. (4) The main atmospheric circulation in East Asia associated with Meiyu shows clear interdecadal changes, including the Western North Pacific Subtropical High and South Asian High having become significantly stronger and having extended westward and eastward, respectively, thereby facilitating the occurrence and persistence of Meiyu precipitation. The atmospheric circulation patterns associated with Meiyu, such as the Western North Pacific Subtropical High and South Asian High, have more significant impacts on Meiyu precipitation.
1 Introduction
Meiyu is associated with rainy and overcast weather conditions with prolonged and concentrated rainfall occurring in the middle and lower reaches of the Yangtze River from June to July annually (Ding et al., 2013). Given the significant impacts of Meiyu on local industrial and agricultural production, lives of residents, and ecological construction, its change relationship, as well as associated monitoring and forecasting technologies, have become hot research topics (Liang et al., 2010; Hu et al., 2014; Ding et al., 2020; Liu and Ding, 2020; Hao et al., 2022; Ma et al., 2022).
China has a long history of studying Meiyu (Ye and Zhu, 1954; Dind, 1976; Tao, 1980). Studies have found that Meiyu is closely related to circulation changes, including the intraseasonal signal of the East Asian summer monsoon and seasonal northward jump of the Western North Pacific Subtropical High (Tao et al., 1958; Sampe and Xie, 2010; Kong and Chiang John, 2020; Zhou and Li, 2022). Heavy precipitation during the Meiyu season usually occurs on the right side of the upper-level jet inlet area and on the left side of the lower-level jet outlet area (Wang et al., 2019). The weak and strong combinations between the East Asian subtropical upper-level jet and East Asian polar frontal jet correspond accurately to the intensity and location of Meiyu precipitation (Li and Zhang, 2014; Du et al., 2022). Because of global warming, Meiyu precipitation has decreased in recent years, and the precipitation center has moved northward (Hu and Ding, 2009; Zhu et al., 2016). Meanwhile, the middle and lower reaches of the Yangtze River have been experiencing a significant weakening of continuous rainfall, uneven spatial distribution of precipitation, increase in the number of heavy precipitation days, earlier onset (June 11–15), later termination (July 11–15), and prolonged duration (30 days on average) of the Meiyu season, and other characteristics (Ding et al., 2020). All the above indicate that the characteristics of Meiyu and its influencing circulation patterns may be changing because of global warming.
Since 2000, the frequencies of extreme floods as well as extreme high-temperature and drought events in the middle and lower reaches of the Yangtze River have increased (Hao et al., 2022), resulting in the 2020 “violent Meiyu” (Liu and Ding, 2020; Guo et al., 2021; Zhou et al., 2021; Lin et al., 2022) and the 2013 and 2022 extreme high-temperature and drought events. Recent studies on Meiyu have indicated that the recent changes need to be monitored with great concern (Ding et al., 2020; Liu et al., 2021; Niu and Zhou, 2021; Lou et al., 2022). Takahashi and Fujinami (2021) analyzed the Meiyu season from 1998 to 2019 based on a variety of observational data and found that the frequencies of moderate precipitation (>0.5 mm/h) and heavy precipitation (>10 m/h) have increased from eastern China to southwestern Japan. Hatsuzuka et al. (2021) found that global warming has significantly increased the maximum hourly precipitation and extreme hourly precipitation over short-(<5 h) and long-duration (>10 h) precipitation events during the Meiyu season in Japan.
At present, there is a significant lack of understanding of the effects of global warming on Meiyu in the middle and lower reaches of the Yangtze River. In particular, the characteristic quantity of Meiyu has changed significantly since 2000. Whether Meiyu precipitation will enter a new normal in the context of climate change should be a hot research topic in coming years. Moreover, because global warming complicates Meiyu changes, most numerical models (e.g., Kimoto, 2005; Si et al., 2009; Li et al., 2010; Chen et al., 2018; Wu et al., 2019; Lin et al., 2022) cannot yet reproduce the new Meiyu change characteristics well. Therefore, intensifying the research efforts regarding the Meiyu changes and mechanisms in the context of global warming not only helps improve short-term climate prediction but also provides important scientific support for improved numerical models, disaster prevention and mitigation capabilities, and scientific response to climate change. This study intends to introduce new characteristics of Meiyu changes by comprehensively analyzing Meiyu precipitation, saturated specific humidity, and interdecadal changes in key circulations in the context of global warming.
2 Data and methodology
2.1 Data
(1) In this study, we used daily precipitation and temperature observations from more than 2,400 stations across China from 1951 to 2022 compiled by the National Meteorological Information Center (NMIC). Among the 277 stations in the Meiyu monitoring area (Zhou et al., 2007), 234 stations were established early and had complete datasets since 1961 and were therefore selected as representatives. (2) The reanalysis data used in this study have been jointly produced by the National Center for Environmental Prediction (NCEP) and National Center for Atmospheric Research (NCAR); their horizontal resolution is 2.5° × 2.5°, the vertical range is 1,000–200 hPa, and the elements are zonal wind speed u, meridional wind speed v, geopotential height h, air temperature t, specific humidity q, etc. (3) The Meiyu season onset and termination dates, Western North Pacific Subtropical High index, and South Asian High index used in this study come from the monitoring data of the National Climate Center from 1961 to 2022.
2.2 Methods
2.2.1 Anomalous field regression reconstruction method
Assuming x represents a particular time sequence, yi represents the actual sequence value of point i in the spatial field to be reconstructed.
where ai is the outlier of point i in the reconstructed space, bi is the constant term of point i in the reconstructed space, and the spatial distribution of a is the reconstructed anomalous field. To ensure that the magnitude of the reconstructed outlier is consistent with the actual magnitude, the time sequence x should be standardized or normalized during the regression calculation.
Wang et al. (2008) and Hao and Hou (2018) used this methodology to reconstruct the spatially anomalous wind speed field, height field, and precipitation in a time sequence, and analyze the interdecadal changes of the main modality; it is an effective methodology for anomalous field analysis.
2.2.2 Normalization index calculation method
It is necessary to normalize the value of the time-change sequence to facilitate comparative analysis because the units and magnitudes vary for different elements. For example, for precipitation sequence x, the following equation is used to convert data x to a value within the range [−1, 1], where x1, xi, and x1i are values at time i:
2.2.3 Saturated specific humidity calculation
According to the principles of dynamic meteorology (Holton and Hakim, 2013), specific humidity refers to the water vapor mass to humid air mass ratio. Saturated specific humidity is the specific humidity at which the air is saturated. The saturated specific humidity difference refers to the difference between the saturated specific humidity and actual specific humidity, which is a key thermal factor determining whether precipitation will be produced based on atmospheric conditions. The occurrence of atmospheric precipitation can be determined by determining the actual specific humidity q of the atmosphere at which the saturated specific humidity qs will be reached.
Specific humidity (q or SH) is calculated as follows:
where q is calculated in g/kg; mv is the mass of water vapor per unit volume; md is the mass of dry air per unit volume of the atmosphere; and e and p are the water vapor pressure and air pressure, respectively, calculated in hPa.
Saturated specific humidity (qs or SSH) is calculated as follows:
where qs is measured in g/kg and es and p are the saturated water vapor pressure and air pressure, respectively, measured in hPa. es can be obtained using the following empirical equation:
where es is measured in hPa; es0, which is 6.1078 hPa, represents the saturated water vapor pressure at 0°C on the water surface; a = 17.269 and b = 35.86 are the saturated empirical coefficients on the water surface; and t is the air temperature measured in °C.
The Meiyu region in the middle and lower reaches of the Yangtze River refer to the main areas of the middle and lower reaches of the Yangtze River and also include some areas in the northern and southern banks of the river (Zhou et al., 2007). Since each Meiyu season has different onset and termination dates, the period from June to July was used to calculate changes in the proportions of light, moderate, heavy, and torrential rain during the Meiyu season. The precipitation change curve and trend from June to July were consistent with Meiyu changes. To facilitate the circulation analysis, precipitation from June to July was used as in indicator of the Meiyu precipitation change on an annual basis. Correlation significance was determined using the F-test method, and regression reconstruction significance was determined using the t-test method. Unless otherwise specified, the climate values in this study were the 1991–2020 average values.
3 New characteristics of Meiyu changes
3.1 New characteristics of Meiyu precipitation changes
Figure 1 shows the changes in Meiyu precipitation, surface average temperature, and saturated specific humidity in the middle and lower reaches of the Yangtze River from 1961 to 2022. Observational data on Meiyu precipitation and average temperature collected from 234 representative stations in this area and reanalysis data of saturated specific humidity at the 850-hPa level in this area were used in this study. Figure 1A shows the changes in Meiyu precipitation (including the mean value and trend) and precipitation from June to July. Meiyu precipitation shows a significant linear increase trend since 2000, which passes the 0.05 reliability test. The increment is 73.5 mm per 10 years. Figure 1B shows the change curves for light, moderate, heavy, and torrential rain in the middle and lower reaches of the Yangtze River in June and July from 1961 to 2022. Light, moderate, heavy, and torrential rain have all increased; however, the magnitudes of increase in light, moderate, and heavy rain are minor and negligible, whereas the magnitude of increase in torrential rain is significant and passes the 0.05 reliability test, with an average increment of 45 mm per 10 years. The proportion of torrential rain has been increasing, whereas the proportions of light, moderate, and heavy rain in the total precipitation have been decreasing. The Meiyu precipitation increase since 2000 has been mainly due to the increase in torrential rain. Figure 1C shows the change curves of the saturated specific humidity and actual specific humidity at the 850-hPa level in June and July in the middle and lower reaches of the Yangtze River from 1961 to 2022 (3-year moving average). Since 2000, the saturated specific humidity has increased significantly, indicating that the threshold of atmospheric condensation causing precipitation in this area has been increasing. From the perspective of changes in the actual specific humidity, since 2000, the saturated specific humidity difference is increased in the early stage (2000 ~ 2008) and decreased in the later stage (2009 ~ 2022), corresponding to reduced Meiyu precipitation in the early stage and increased in the later stage. Figure 1D shows the change curves of average ground temperature and Meiyu precipitation in June and July in the middle and lower reaches of the Yangtze River from 1961 to 2022 (3-year moving average). Since 2000, Meiyu precipitation and air temperature have exhibited opposite changes and pass the 0.001 reliability test, with a correlation coefficient of −0.66. Meiyu precipitation in this area decreases by approximately 150 mm for every 1°C increase in the average ground temperature in June and July. This relationship was not evident before 2000 (i.e., correlation coefficient of only −0.27 not passing the 0.05 reliability test). Figure 2 shows the 10-year sliding abrupt change t-test curve of Meiyu precipitation in the middle and lower reaches of the Yangtze River. Meiyu precipitation changed significantly around 2000, while some new characteristics appeared afterwards.
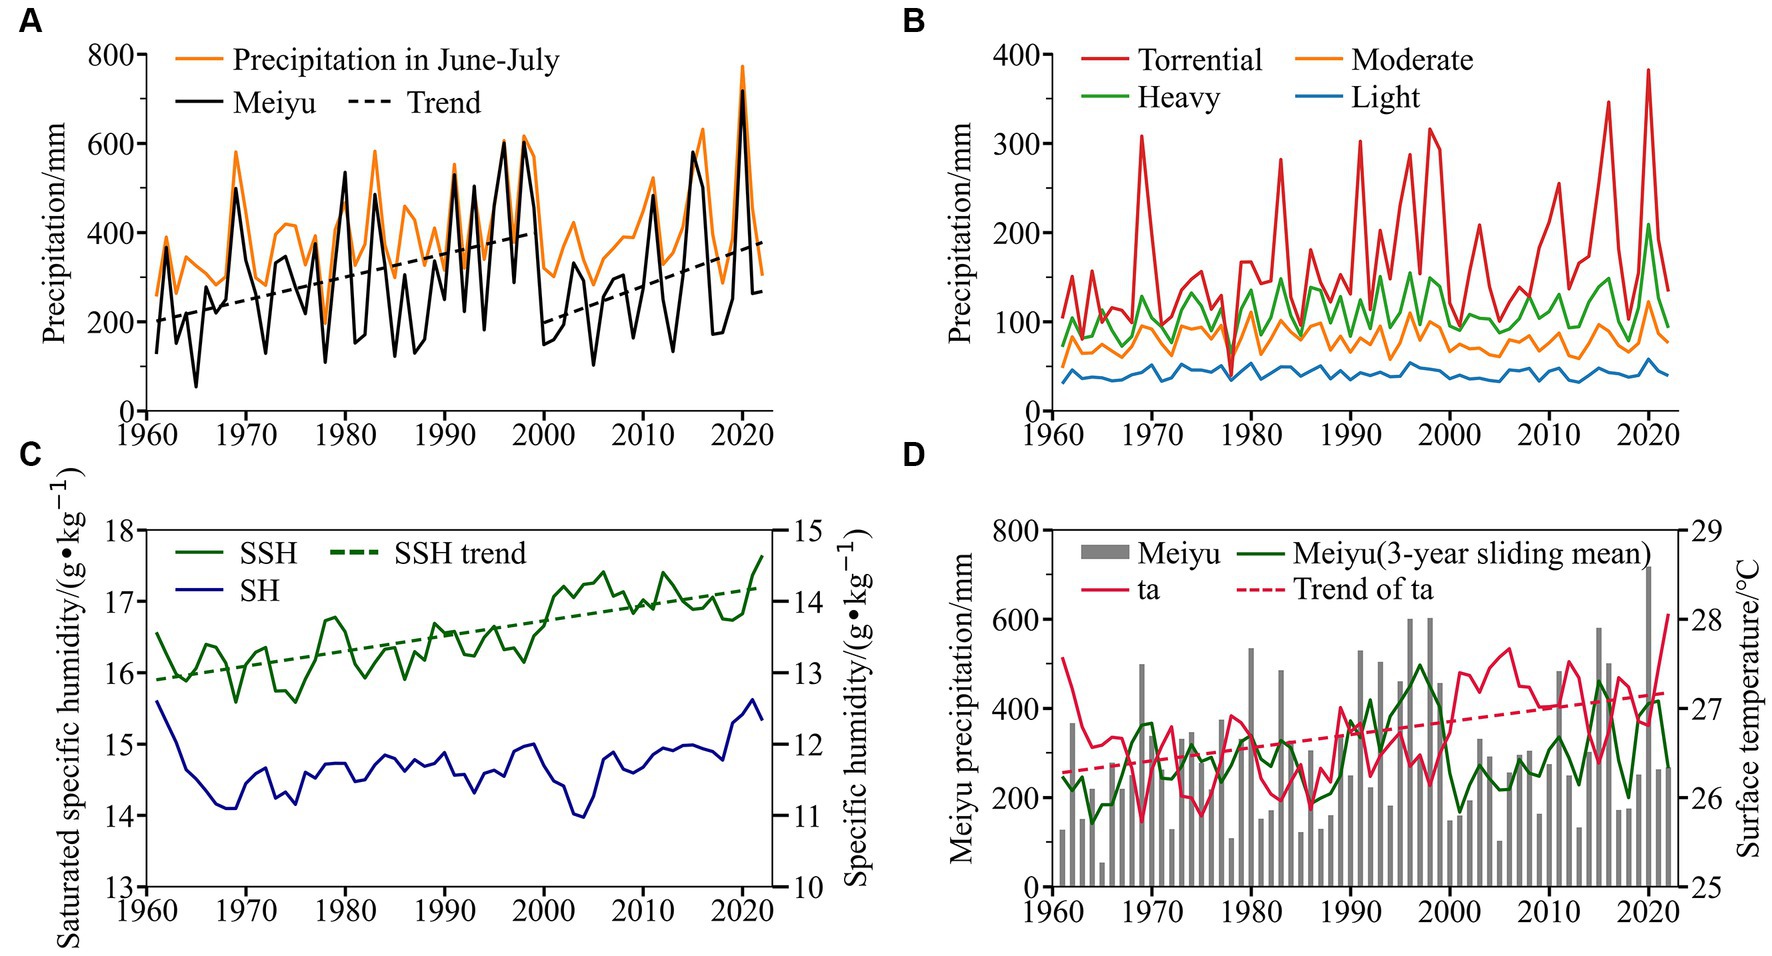
Figure 1. Changes in Meiyu precipitation, average temperature, and saturated specific humidity in the middle and lower reaches of the Yangtze River from 1961 to 2022. (A) Meiyu precipitation (black solid line, unit: mm) and its trend (black dashed line, unit: mm/a),and precipitation changes from June to July (orange line, unit: mm). (B) Changes of light(blue), moderate(orange), heavy(green), and torrential(red) rain from June to July (unit: mm). (C) Changes of saturated specific humidity (SSH, green solid line) and actual specific humidity (SH, blue solid line) at the 850-hPa level in the middle and lower reaches of the Yangtze River from June to July (3-year moving average, unit, g/kg). The green dashed line shows the linear trend of saturated specific humidity (SSH). (D) Changes of the average surface temperature (red solid line; 3-year moving average, unit: °C) and its linear trend (red dashed line; unit: °C/a), Meiyu precipitation i in June and July (grey bar, unit: mm) and its 3-year moving average(green solid line, unit: mm).
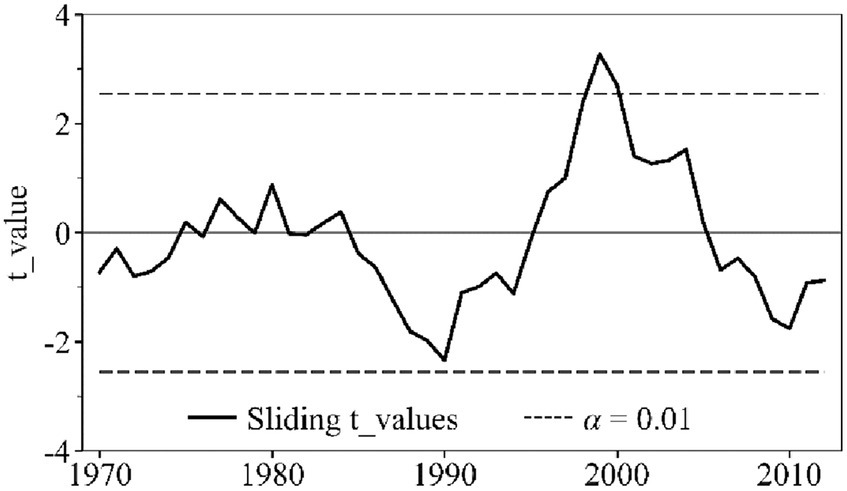
Figure 2. Ten-year sliding abrupt change t-test curve of Meiyu precipitation in the middle and lower reaches of the Yangtze River from 1961 to 2022.
Meiyu precipitation in the middle and lower reaches of the Yangtze River changed abruptly around 2000, and some new characteristics appeared thereafter. (1) Meiyu precipitation has shown a significant linear increasing trend, which is 0.6 times more pronounced compared with that before 2000, with an average increment of 73.5 mm per 10 years. The increase in torrential rain is the most significant, accounting for 61% of the total increase, and its proportion has been increasing, while the proportions of light, moderate, and heavy rain in the total precipitation have been decreasing. (2) The saturated specific humidity in this area shows a significant increasing trend, indicating that the threshold of atmospheric saturation and condensation causing precipitation has been increasing, which may be one of the reasons for the low Meiyu precipitation in high-temperature years. (3) Meiyu precipitation and temperature change inversely; that is, high temperature leads to abnormally low Meiyu precipitation, and low temperature leads to abnormally high Meiyu precipitation. This relationship was not evident before 2000. Meiyu precipitation in this area decreases by approximately 150 mm for every 1°C increase in the average ground temperature in June and July. Therefore, rainstorms, floods, high temperature, and droughts in the middle and lower reaches of the Yangtze River show obvious increasing extremes within the context of global warming, leading to events such as the 2020 “violent Meiyu” and the 2013 and 2022 extreme high-temperature events.
3.2 Temperature, specific humidity and Meiyu
Previous studies have shown that global warming has resulted in significantly less frequent typical Meiyu (high temperature and humidity; rainy weather) and significantly more frequent atypical Meiyu. In addition, weak precipitation has decreased, and heavy precipitation has increased in the Jianghuai area (Fang and Jiang, 2013; Xu, 2015). Interannual changes in the duration of the Meiyu season and total precipitation have increased (Yao et al., 2019). In the context of global warming, Meiyu in the Jianghuai area has become more complicated, making Meiyu prediction more difficult and uncertain (Wu et al., 2019; Liu et al., 2021). Further research is required to understand the changing characteristics of Meiyu in the context of global warming.
Temperature rise can affect the Meiyu precipitation threshold in the middle and lower reaches of the Yangtze River by influencing the saturated specific humidity. Equations (3–5) shows that under constant atmospheric pressure, the saturated specific humidity threshold is determined only by the change in atmospheric temperature (equations (4) and (5)). An increase in temperature will raise the saturation threshold at which the atmosphere produces precipitation, thereby hindering the occurrence of precipitation. In this case, the intensity of the external vapor transport becomes the only factor affecting atmospheric precipitation. Figure 3A shows the spatial distribution of the percentage of precipitation anomalies from June to July corresponding to surface temperature increases at 234 stations in the middle and lower reaches of the Yangtze River (obtained from equations (1) and (2)). As the temperature rises, precipitation in the middle and lower reaches of the Yangtze River decreases by more than 20%, which passes the 0.05 reliability test. Figure 3B shows the spatial distribution of the saturated specific humidity difference anomalies from June to July corresponding to the temperature increase (obtained from equations (1) and (2)). As the temperature rises, the saturated specific humidity difference increases significantly in the middle and lower reaches of the Yangtze River, indicating that the threshold of atmospheric saturation and condensation causing precipitation in this area is increasing, which may be one of the reasons for the potential decreasing trend of Meiyu precipitation in this area.
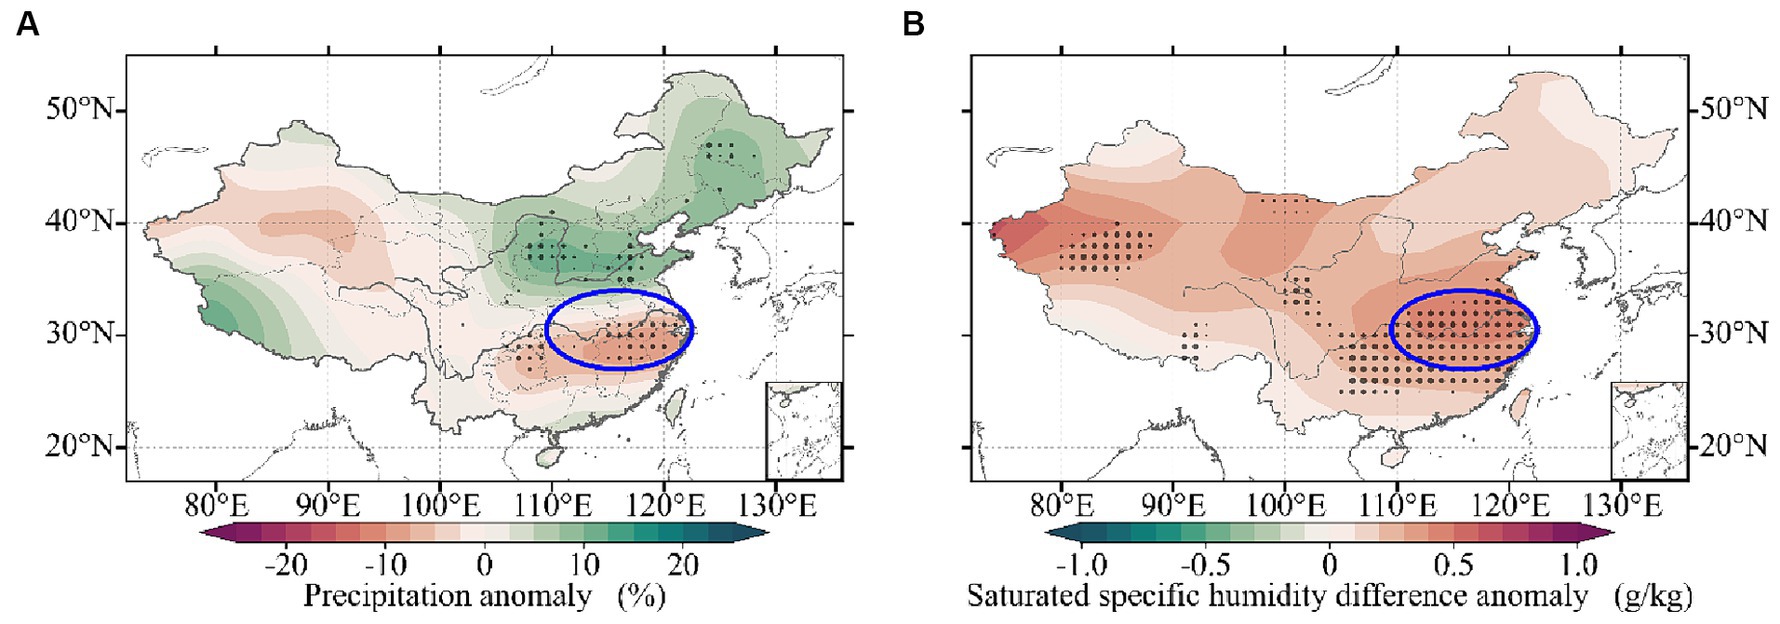
Figure 3. Spatial distributions of the (A) percentage of precipitation anomalies (unit: %) and (B) saturated specific humidity difference anomalies at 850-hPa level (unit: g/kg) corresponding to the temperature rise in the middle and lower reaches of the Yangtze River in June and July from 1961 to 2022. The anomalies are the regression reconstruction results upon the average ground temperature departure in June and July from 1961 to 2022. The black-dotted areas pass the 0.05 reliability test. The blue circles indicate the middle and lower reaches of the Yangtze River.
Figure 4 shows the spatial distributions of the precipitation trend and interdecadal changes (2000–2022 average minus the 1961–1999 average) in June and July in the middle and lower reaches of the Yangtze River from 1961 to 2022. The precipitation in the middle and lower reaches of the Yangtze River showed a clear increasing trend over time (Figure 4A), with an average increase of more than 15 mm per decade. Figure 4B shows the spatial distribution of precipitation for June–July 2000–2022 minus the multi-year (1961–2022) mean. From 2000 to 2022, the precipitation over the eastern and northern Jianghuai Yangtze Plain is clearly positive, which is consistent with related studies indicating that the Meiyu belt has moved northward (Hu and Ding, 2009; Sun, 2014; Zhu et al., 2016), that is, after 2000, precipitation in the northeast of the Yangtze Plain region has increased significantly.
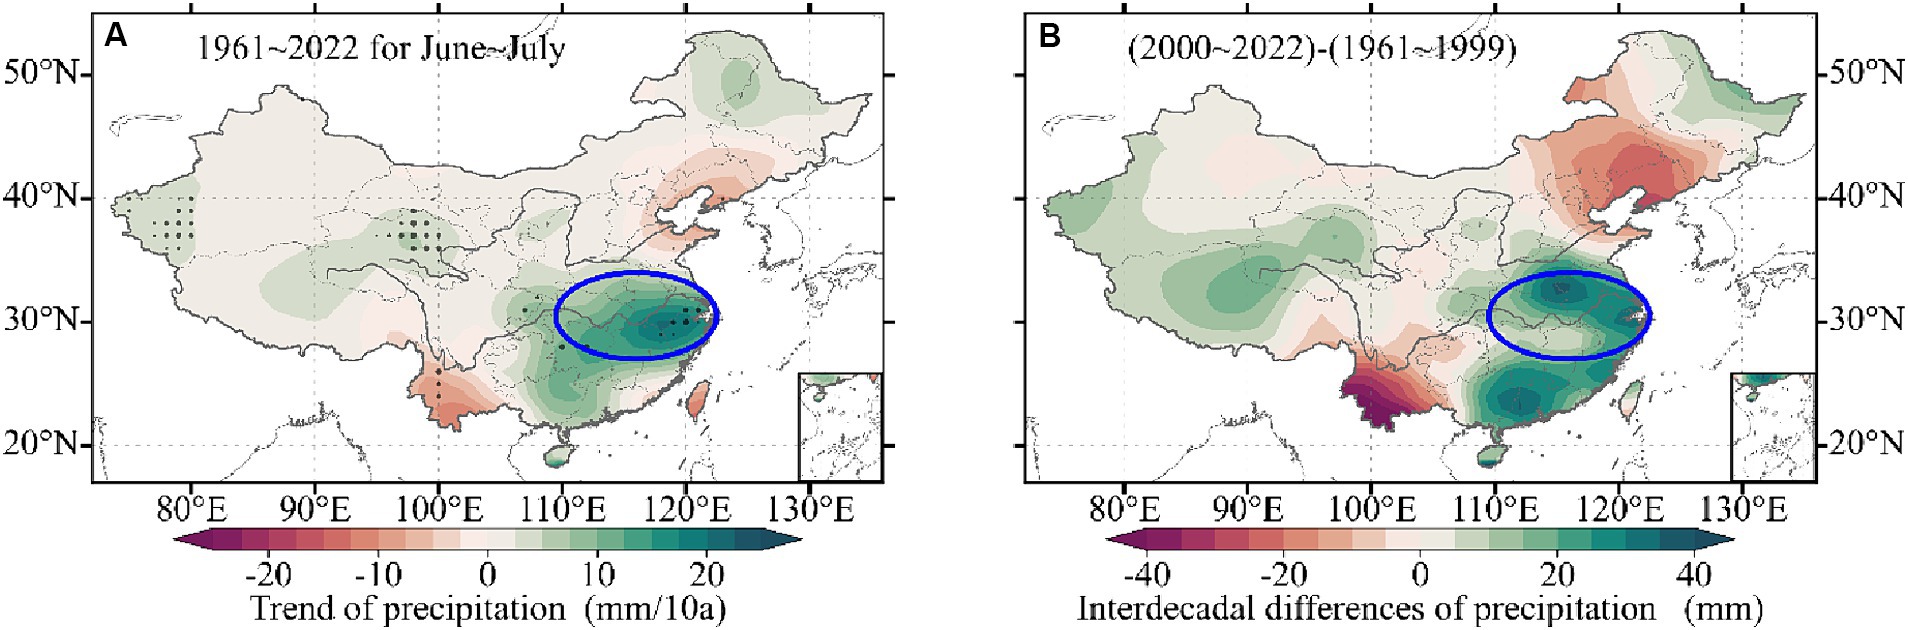
Figure 4. Spatial distributions of the (A) trend of precipitation in June and July in the middle and lower reaches of the Yangtze River from 1961 to 2022 (unit: mm/10a; the black dotted areas passed the 0.05 reliability test) and (B) interdecadal differences of precipitation (2000–2022 average minus the 1961–1999 average, unit, mm). The blue circles indicate the middle and lower reaches of the Yangtze River.
3.3 Circulation changes in before and after 2000
Global warming can affect Meiyu in the middle and lower reaches of the Yangtze River through changes in atmospheric circulation. Some preliminary studies have shown that the northward shift of the Meiyu belt caused by global warming is related to the water vapor transport weakening in the South China Sea and water vapor transport enhancement in the Bay of Bengal since 2000 (Sun, 2014). Some studies also suggest that the water vapor flux changes in the middle and lower reaches of the Yangtze River and the interdecadal changes of relative humidity have a critical impact on the interdecadal changes of Meiyu intensity in this area (Sun et al., 2019). In the following, we present a comparative analysis of the circulation changes around 2000, which helps further understand the impact of the interdecadal changes of the East Asian atmospheric circulation on Meiyu precipitation in the middle and lower reaches of the Yangtze River.
Figure 5 shows a synthetic comparison of the circulation anomalies at the 500-hPa level, 200-hPa level, and vertically-integrated water vapor flux (from 1,000 to 300 hPa) before and after 2000. Figures 5A,B show that the Western North Pacific Subtropical High became stronger, with the western ridge point extending westward substantially. In addition, the upper-level trough near Lake Baikal became an evident high-pressure ridge. According to the synthetic comparison of the South Asian High and upper-level wind field anomalies at the 200-hPa level (Figures 5C,D), the South Asian High became significantly stronger after 2000, the eastern ridge point extended eastward substantially, and an evident easterly anomaly appeared over North China in the East Asian region, indicating that the upper-level jet weakened significantly over this region, resulting in weakened upward movement caused by the disturbance of the upper-level jet. Figures 5E,F is the spatial distribution of the vertically integrated water vapor flux anomaly and its divergence anomaly. It can be seen that, before 2000 (Figure 5E), the water vapor flux in the western part of the Yangtze Plain area was divergent, while in the northeast it was convergent. There was an obvious anomaly of southerly water vapor flux in the western region of the Yangtze Plain area, indicating an enhanced southerly wind water vapor transport in the western region. Due to the influence of water vapor, there is more precipitation in the western region. After 2000 (Figure 5F), the western part of the Yangtze Plain changed from divergence to convergence and the northeastern part to divergence. Further analysis reveals that water vapor divergence in the northeast mainly occurs in the upper levels above 700 hPa, which is favorable for the water vapor convergence in the lower layer. There is a significant anomaly of northward wind water vapor flux in the western region, and an anomaly of easterly wind water vapor flux in the northeastern region. This indicates that there is a decrease in water vapor in the western region, while there are more water vapor in the northeastern region. The influence of water vapor is conducive to the occurrence of Meiyu precipitation in the northeast of the middle and lower reaches of the Yangtze River.
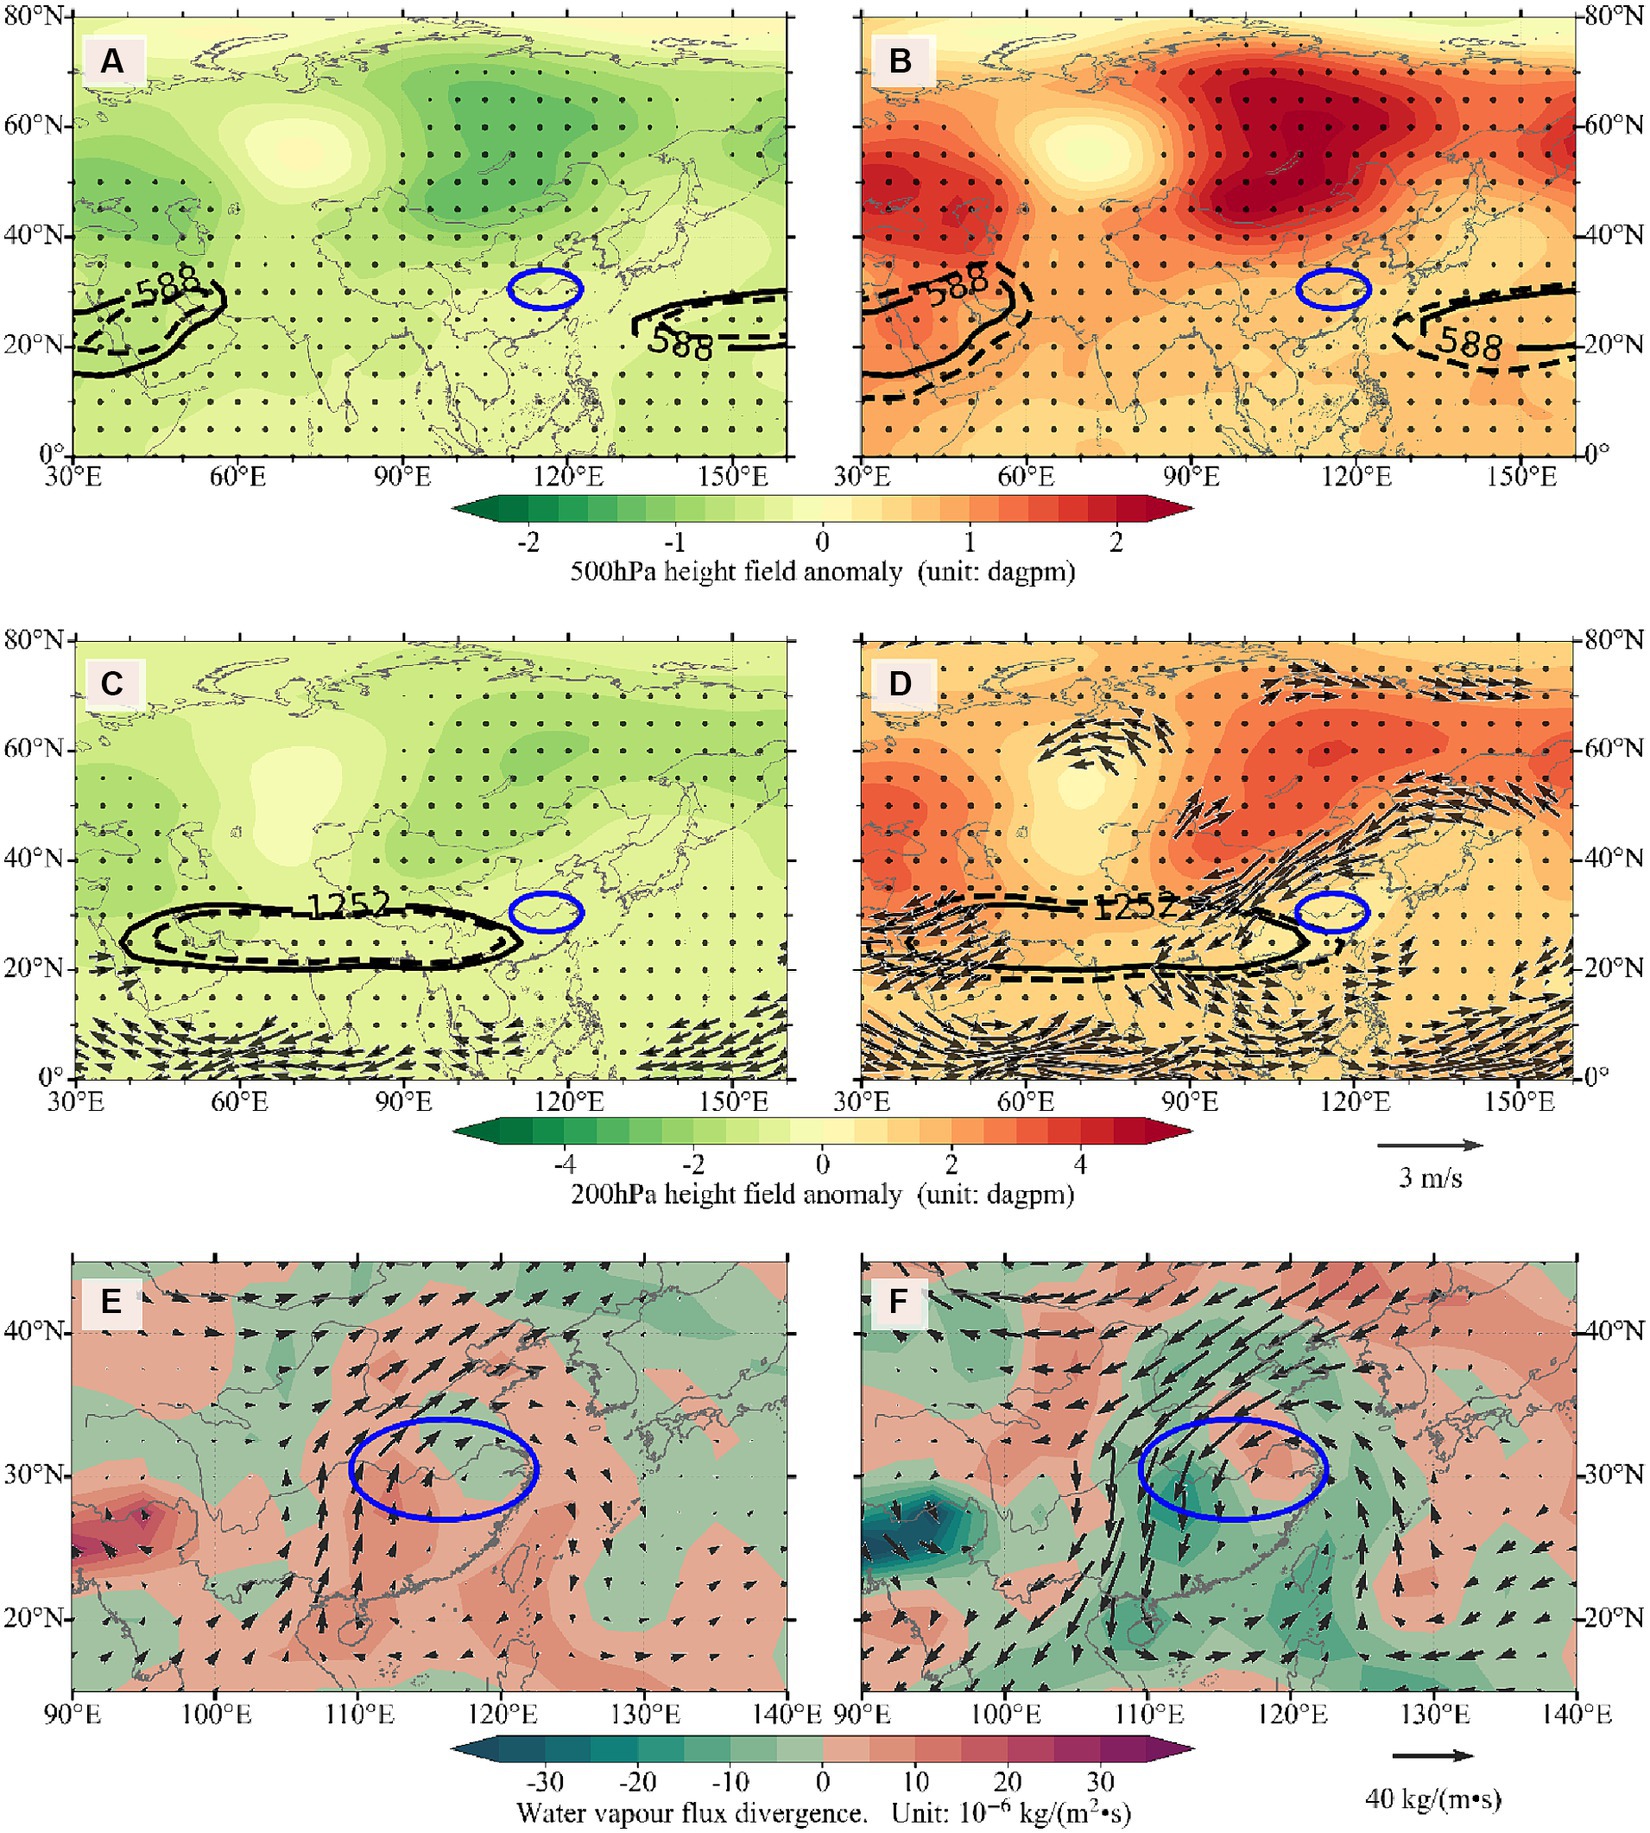
Figure 5. Synthetic comparison of the circulation anomalies at the 500, 200 hPa level, and vertically integrated water vapor flux from 1,000 to 300 hPa in (panels A,C,E) 1961–1999 and (panels B,D,F) 2000–2022. The climate values refer to the 1961–2022 average. (A) Synthetic comparison of circulation at the 500-hPa level from 1961 to 1999; Subtropical High profile (dashed line) and its climate value (solid line) during this period (unit: dagpm); the shaded area is the height field anomaly (unit: dagpm); and the black-dotted area passes the 0.05 reliability test. (B) Same as in panel a, but from 2000 to 2022. (C) Synthetic comparison of circulation at the 200-hPa level from 1961 to 1999; the isoline is the South Asian High profile (dashed line) and its climate value (solid line; unit: dagpm); the shaded area is the height field anomaly (unit: dagpm); and the black-dotted area passes the 0.05 reliability test; the arrows represent the horizontal wind speed anomaly (unit: m∙s−1) and pass the 0.05 reliability test. (D) Same as in panel c, but from 2000 to 2022. (E) Vertically integrated (1,000 ~ 300 hPa) water vapor flux anomalies [arrows; unit: kg/(m∙s)] and their divergence anomalies [shaded areas; unit: 10−6 kg/(m∙s)] from 1961 to 1999. (F) Same as in panel e, but from 2000 to 2022.
Apparently, since 2000, the atmospheric circulation in East Asia has undergone obvious interdecadal changes: The Western North Pacific Subtropical High and South Asian High have become significantly stronger and extended toward each other. This circulation configuration facilitates the occurrence and persistence of Meiyu precipitation. However, the upper-level westerly jet and the lower-level southerly jet in East Asia have weakened sharply, resulting in weakened dynamic upward movement and restricted southerly water vapor source in North China, which hinders the occurrence of Meiyu precipitation. Because of the significant changes of the atmospheric water vapor transport, as well as convergence and divergence at higher and lower levels, Meiyu precipitation has decreased west of the middle and lower reaches of the Yangtze River, which facilitates the occurrence of Meiyu precipitation in the northeast. Therefore, the characteristics of Meiyu precipitation after 2000 have become more complex, making prediction more difficult.
According to the analysis earlier in this article, Meiyu precipitation decreases with the increase of temperature, saturated specific humidity, and precipitation threshold, but the trend increased with time. This is because the interdecadal changes in Meiyu precipitation and circulation facilitate the occurrence of Meiyu, thereby masking potential decreases in Meiyu precipitation. Previous studies (e.g., Tao and Zhu, 1964; Ren et al., 2007) showed that the seasonal northward jump, east–west movement, and stable maintenance of the Western North Pacific Subtropical High and South Asian High are important indicators of the occurrence and persistence of Meiyu precipitation in the middle and lower reaches of the Yangtze River. In early summer, when the South Asian High leaves the plateau and moves eastward, the Western North Pacific Subtropical High moves northward and westward, and Meiyu begins; when the South Asian High returns to the plateau, the Western North Pacific Subtropical High retreats to the southeast, and Meiyu ends. According to statistical data (Huang and Qian, 2004), the abnormal enhancement of the South Asian High may easily cause flooding in the Yangtze River Basin and drought in North China; the abnormal weakening of the South Asian High may easily cause drought in the Yangtze River Basin and flooding in North China. In addition, typical drought and flood phenomena in the Yangtze River Basin and North China show opposite characteristics. According to a synthetic analysis (Tan et al., 2005), in years when the South Asian High moves eastward, the Western North Pacific Subtropical High strengthens and extends westward, and convergence occurs at 850 -hPa level in the Yangtze River Basin. In addition, the upward movement is strong, resulting in increased precipitation in the Yangtze River Basin. In years when the South Asian High moves westward, the Western North Pacific Subtropical High weakens and withdraws eastward. The Yangtze River Basin is controlled by abnormal northerly winds, and the upward movement is weak, resulting in less precipitation. Analyses of the mechanism (Liu et al., 2006; Ren et al., 2007; Zhu and Ren, 2023) show that when the eastern margin of the South Asian High extends eastward, the subsidence forced by the upper-level advective dynamics of negative vorticity produces divergence in the Subtropical High region of the medium level, which dynamically affects the development of negative vorticity in the Subtropical High and induces the westward extension of the Western North Pacific Subtropical High. In contrast, the adiabatic heating effect accompanying the strong subsidence enlarges the latitudinal temperature gradient, thereby facilitating the development of north–south winds and indirectly affecting thermally the development of the Western North Pacific Subtropical High. This mechanism caused the continuous rain in the Huaihe River Basin in 2003, the second Meiyu in the Yangtze River Basin in July 1998, and years of abnormal high Meiyu precipitation in the Yangtze River Basin.
Table 1 shows the statistical correlations between Meiyu precipitation and the Western North Pacific Subtropical High and South Asian High indices in June and July. Meiyu precipitation in the middle and lower reaches of the Yangtze River has a significant positive correlation with the intensity of the Western North Pacific Subtropical High and a significant negative correlation with the location of its western ridge; it also has a significant positive correlation with the intensity of the South Asian High and a significant positive correlation with the East Extension Index of its eastern margin (Zhu and Ren, 2023). Most of the correlations with other indices are not significant. Figure 6 shows the change curves of the intensity index of the western North Pacific Subtropical High, the western ridge index, the intensity index of the South Asian High, and the East Extension Index of the eastern margin of the South Asian High. An 11-year moving average was used to highlight interdecadal changes. The intensities of the Western North Pacific Subtropical High and South Asian High demonstrate obvious interdecadal changes, showing gradual enhancement trends since 2000. The longitude of the western ridge of the Western North Pacific Subtropical High has been decreasing since 2000, indicating a significant westward extension. The East Extension Index of the eastern margin of the South Asian High shows significant interdecadal changes, especially after 2000, and the East Extension Index clearly shows a gradual increasing trend. Therefore, although the temperature and precipitation threshold have increased since 2000, the potential trend of Meiyu precipitation has decreased. However, the interdecadal changes of the Western North Pacific Subtropical High and South Asian High facilitate over longer time scales the occurrence of Meiyu precipitation, generally resulting in new characteristics of increasing Meiyu precipitation in the middle and lower reaches of the Yangtze River but also greater interannual changes in recent years.
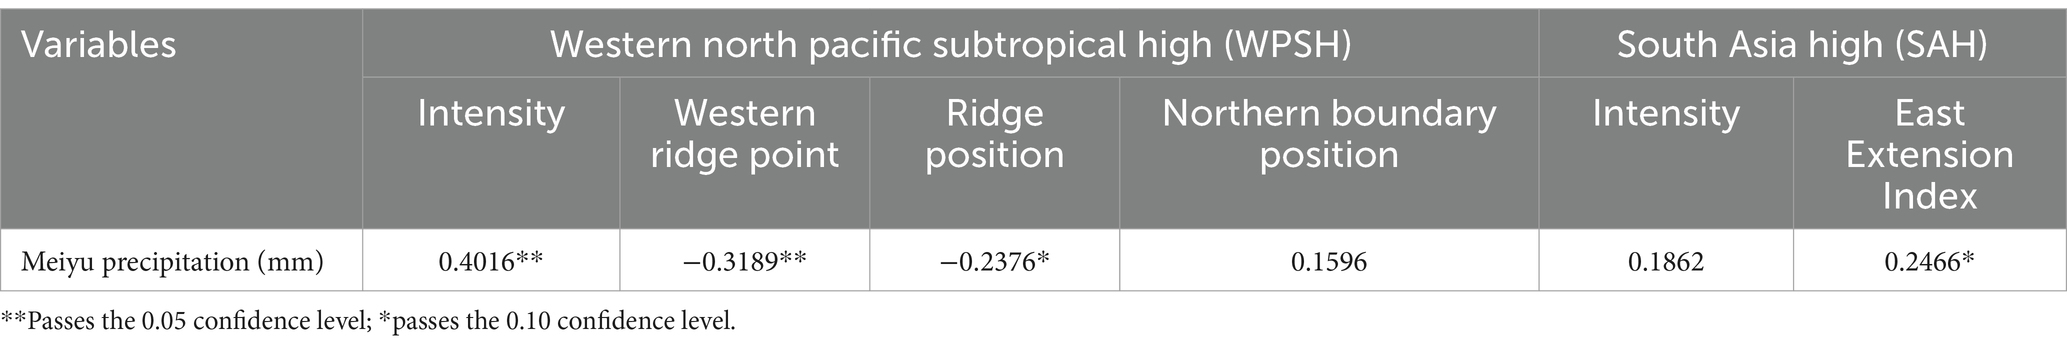
Table 1. Correlation coefficients between Meiyu precipitation and the western North pacific subtropical high and south Asian high indices.
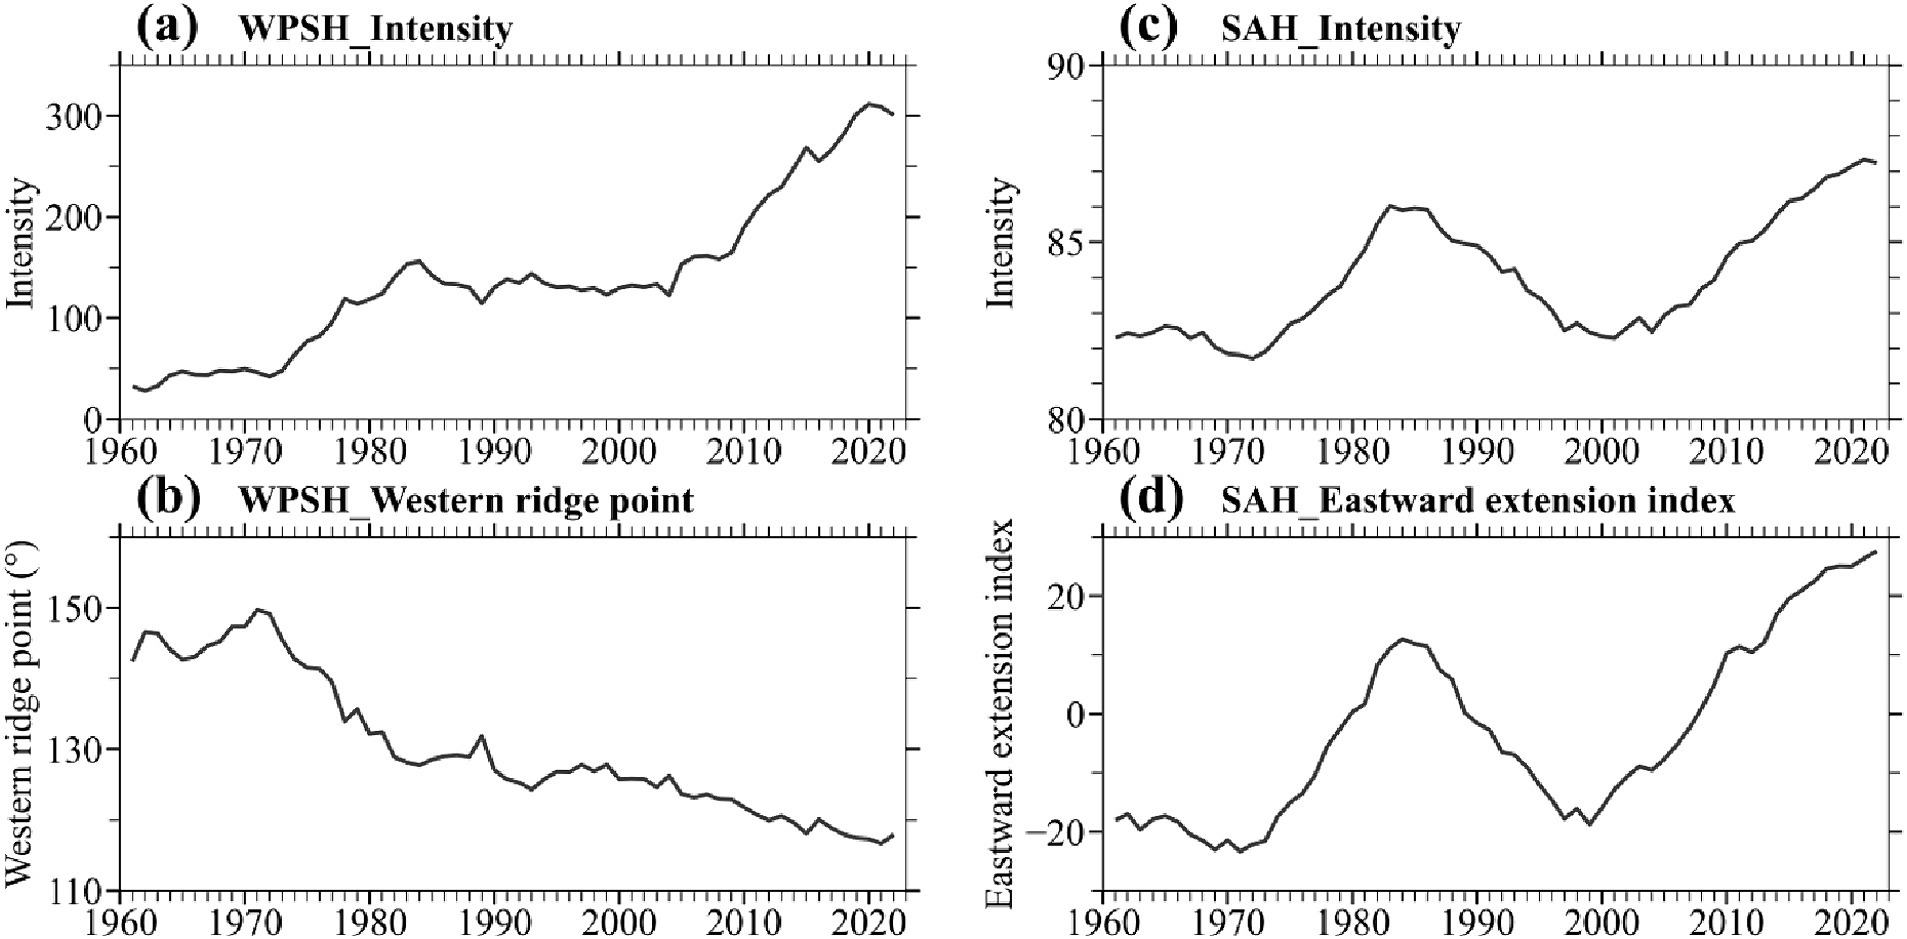
Figure 6. Changes of the Western North Pacific Subtropical High and South Asian High indices from 1961 to 2022 (11-year moving average). (A) Intensity index of the Western North Pacific Subtropical High; (B) western ridge index of the Western North Pacific Subtropical High; (C) intensity index of the South Asia High; (D) East Extension Index of the eastern margin of the South Asian High.
4 Summary and discussion
Meiyu precipitation in the middle and lower reaches of the Yangtze River changed abruptly around 2000, and new characteristics appeared thereafter. (1) The Meiyu precipitation shows a significant linear increase trend, with an average increment of 73.5 mm every 10 years. The increase in torrential rain is the most significant, accounting for 61% of the total precipitation increase, and its proportion has been increasing, whereas the proportions of light, moderate, and heavy rain in the total precipitation have been decreasing. (2) Meiyu precipitation and surface average temperature change inversely, that is, high temperature leads to abnormally low Meiyu precipitation, and low temperature leads to abnormally high Meiyu precipitation. This relationship was not evident before 2000. If the surface average temperature in this area increases by 1°C in June, July, Meiyu precipitation decreases by about 150 mm. (3) Saturated specific humidity in this area shows a significant increasing trend, indicating that the threshold of atmospheric saturation and condensation causing precipitation in this area is increasing, which may be one of the reasons for the low Meiyu precipitation in high-temperature years. (4) The atmospheric circulation has undergone obvious interdecadal changes in East Asia. The Western North Pacific Subtropical High and South Asian High have become significantly stronger and have extended westward and eastward, respectively, thereby facilitating the occurrence and persistence of Meiyu precipitation. In contrast, the Indian summer monsoon and East Asian subtropical summer monsoon weaken, thereby restricting the water vapor source and preventing Meiyu precipitation.
Although the surface temperature and precipitation threshold have increased since 2000, this has led to a potential decrease in Meiyu precipitation. However, the interdecadal changes of the Western North Pacific Subtropical High and South Asian High facilitate over longer time scales the occurrence of Meiyu precipitation, generally resulting in new characteristics of increasing Meiyu precipitation in the middle and lower reaches of the Yangtze River but also greater interannual variability in recent years. This implies that the atmospheric circulation patterns associated with Meiyu, such as the Western North Pacific Subtropical High and South Asian High, have more significant impacts on Meiyu precipitation.
Due to the synergistic effects of temperature rise and interdecadal changes in atmospheric circulation, rainstorms, floods, high temperature, and droughts in the middle and lower reaches of the Yangtze River show obvious increasing extremes, resulting in events such as the 2020 “violent Meiyu” and the 2013 and 2022 extreme high-temperature events. The cause and impact mechanisms of circulation changes require further investigations, especially in relation to the prediction of extreme precipitation events and precipitation changes during the Meiyu season.
Data availability statement
The original contributions presented in the study are included in the article/supplementary material, further inquiries can be directed to the corresponding authors.
Author contributions
L-SH: Conceptualization, Formal analysis, Investigation, Methodology, Visualization, Writing – original draft, Writing – review & editing. Y-HD: Conceptualization, Methodology, Supervision, Writing – review & editing. Y-JL: Data curation, Funding acquisition, Investigation, Methodology, Validation, Writing – original draft.
Funding
The author(s) declare that financial support was received for the research, authorship, and/or publication of this article. This work was supported by the Guangdong Major Project of Basic and Applied Basic Research (2020B0301030004), Innovation and Development Special Project of the China Meteorological Administration (CXFZ 2022 J017), and Climate Change Detection and Response (CMA2022ZD03) by the Key Innovation Team of the China Meteorological Administration.
Conflict of interest
The authors declare that the research was conducted in the absence of any commercial or financial relationships that could be construed as a potential conflict of interest.
Publisher’s note
All claims expressed in this article are solely those of the authors and do not necessarily represent those of their affiliated organizations, or those of the publisher, the editors and the reviewers. Any product that may be evaluated in this article, or claim that may be made by its manufacturer, is not guaranteed or endorsed by the publisher.
References
Chen, X., Wu, P., Roberts, M. J., and Zhou, T. (2018). Potential underestimation of future Mei-Yu rainfall with coarse-resolution climate models. J. Clim. 31, 6711–6727. doi: 10.1175/JCLI-D-17-0741.1
Ding, Y., Liang, P., Liu, Y., and Zhang, Y. (2020). Multiscale variability of Meiyu and its prediction: a new review. J. Geophys. Res. Atmos. 125:e2019JD031496. doi: 10.1029/2019JD031496
Du, Y., Xie, Z., Wang, N., Miao, Q., and Zhang, L. (2022). Influence of zonal variation of the subtropical westerly jet on rainfall patterns and frequency of heavy precipitation events over East Asia. J. Clim. 35, 3011–3026. doi: 10.1175/JCLI-D-21-0872.1
Fang, S. D., and Jiang, Z. H. (2013). Analysis of the change in the precipitation intensity distribution in the Yangze-Huaihe River basin under global warming. Climatic and Environ. Res. 18, 757–766. doi: 10.3878/j.issn.1006-9585.2012.12050
Guo, Y., Zhang, R., Wen, Z., Li, J., Zhang, C., and Zhou, Z. (2021). Understanding the role of SST anomaly in extreme rainfall of 2020 Meiyu season from an interdecadal perspective. Whitaker's almanack 64, 1619–1632. doi: 10.1007/s11430-020-9762-0
Hao, L., and Hou, W. (2018). Study on summer precipitation change in North China and prediction technology. Beijing: China Meteorological Press, 201pp.
Hao, L. S., Ma, N., and He, L. Y. (2022). Circulation anomalies characteritics of the abnormal drought and high temperature event in the middle and lower reaches of the Yangtze River in summer of 2022. J. Arid Meteorol. 40, 21–732. doi: 10.11755/j.issn.1006-7639(2022)-05-0721
Hatsuzuka, D., Sato, T., and Higuchi, Y. (2021). Sharp rises in large-scale, long-duration precipitation extremes with higher temperatures over Japan. Npj Climate and Atmospheric Sci. 4, 1–7. doi: 10.1038/s41612-021-00184-9
Holton, James R., and Hakim, Gregory J. (2013). An introduction to dynamic meteorology. Elsevier Inc., Academic Press US, 532.
Hu, Y. M., and Ding, Y. H. (2009). Possible reasons for northward shift of Meiyu belt in Yangtze Huaihe River region during 2000-2005. Meteorolog. Monthly 35, 37–43. doi: 10.7519/j.issn.1000-0526.2009.12.005
Hu, Y., Zhu, Y., Zhong, Z., and Ha, Y. (2014). New predictors and a statistical forecast model for Mei-Yu onset date in the middle and lower reaches of the Yangtze River valley. Weather Forecast. 29, 654–665. doi: 10.1175/WAF-D-13-00109.1
Huang, Y. Y., and Qian, Y. P. (2004). Relationship between south Asian high and characteristic of precipitation in mid- and lower reaches of Yangtze River and North China. Plateau Meteorol 23, 68–74.
Kimoto, M. (2005). Simulated change of the east Asian circulation under global warming scenario. Geophys. Res. Lett. 32:L16701. doi: 10.1029/2005GL023383
Kong, W. W., and Chiang John, C. H. (2020). Interaction of the westerlies with the Tibetan plateau in determining the Mei-Yu termination. J. Clim. 33, 339–363. doi: 10.1175/JCLI-D-19-0319.1
Liang, P., Ding, Y. H., and He, J. H. (2010). A study of determination index of regional Meiyu over the Yangtze-Huaihe Basin. Chinese J. Atmospheric Sci. 34, 418–428. doi: 10.3878/j.issn.1006-9895.2010.02.15
Li, J., Wu, Z., Jiang, Z., and He, J. (2010). Can global warming strengthen the east Asian summer monsoon? J. Clim. 23, 6696–6705. doi: 10.1175/2010JCLI3434.1
Li, L., and Zhang, Y. C. (2014). Effects of different configurations of the east Asian subtropical and polar front jets on precipitation during the Mei-Yu season. J. Clim. 27, 6660–6672. doi: 10.1175/JCLI-D-14-00021.1
Lin, C. H., Sun, Y., and Zhang, X. B. (2022). The 2020 record-breaking Mei-Yu in the Yangtze River valley of China: the role of anthropogenic forcing and atmospheric circulation. Bull. Am. Meteorol. Soc. 103, S98–S104. doi: 10.1175/BAMS-D-21-0161.1
Liu, Y. Y., and Ding, Y. H. (2020). Characteristics and possible causes for the extreme Meiyu in 2020. Meteorolog. Monthly 46, 1393–1404. doi: 10.7519/j.issn.1000-0526.2020.11.001
Liu, Y. Y., Wang, Y. G., and Gong, Z. S. (2021). Precursory signals of the 2020 summer Ccimate in China and evaluation of real-time prediction. Meteorolog. Monthly 47, 488–498. doi: 10.7519/j.issn.1000-0526.2021.04.010
Liu, H. Z., Zhao, S. R., and Zhao, C. G. (2006). Weather abnormal and evolutions of Western Pacific subtropical high and south Asian high in summer of 2003. Plateau Meteorology 25, 169–178.
Lou, D. J., Wang, Y. G., and Chen, C. (2022). Circulation characteristics and precursory signals of abnormal Meiyu rainfall in the middle and lower reaches of the Yangtze River in the past 20 years. Meteorolog. Monthly 48, 1130–1139. doi: 10.7519/j.issn.1000-0526.2022.041802
Ma, J., Wei, K., and Chen, W. (2022). Self-maintaining mechanism of a large-scale persistent heavy rainfall event in Mei-yu period: case study of Yangtze River heavy rainfall in 2020. Chin. J. Atmos. Sci. 46, 1394–1406. doi: 10.3878/j.issn.1006-9895.2201.21082
Niu, R. Y., and Zhou, B. (2021). Analysis of abnormal characteristics and causes of Meiyu over the Yangtze-Huaihe River basin in 2019. Meteorolog. Monthly 47, 1347–1358. doi: 10.7519/j.issn.1000-0526.2021.11.004
Ren, R. C., Li, Y. M., and Wu, G. X. (2007). Impact of South Asia high on the short-term variation of the subtropical anticyclone over Western Pacific in july 1998. Acta Meteorologica Sinica 65, 183–197. doi: 10.11676/qxxb2007.018
Sampe, T., and Xie, S. (2010). Large-scale dynamics of the Meiyu-Baiu rainband: environmental forcing by the westerly jet. J. Clim. 23, 113–134. doi: 10.1175/2009JCLI3128.1
Si, D., Dinf, Y. H., and Liu, Y. J. (2009). Evaluation of Meiyu prediction in the Yangtze-Huaihe region by coupled ocean-atmosphere general circulation model (BCC_CM1.0). Acta Meteorologica Sinica 67, 947–960. doi: 10.11676/qxxb2009.092
Sun, Y. T. (2014). Changes in the Meiyu belt and its association with water vapor transport in terms of global warming. Nanjing: Nanjing University of Information Science & Technology, Master’s Thesis, 56.
Sun, B., Wang, H., Zhou, B., and Li, H. (2019). Interdecadal variation in the synoptic features of Mei-Yu in the Yangtze River valley region and relationship with the Pacific decadal oscillation. J. Clim. 32, 6251–6270. doi: 10.1175/JCLI-D-19-0017.1
Takahashi, H. G., and Fujinami, H. (2021). Recent decadal enhancement of Meiyu–Baiu heavy rainfall over East Asia. Sci. Rep. 11:13665. doi: 10.1038/s41598-021-93006-0
Tan, J., Yang, H., and Shuqing, S. (2005). Characteristics of the longitudinal oscillation of South Asia high during summer. Trans. Atmos. Sci. 28, 452–460.
Tao, S. Y., and Zhu, F. K. (1964). The 100-mb flow patterns in southern Asia in summer and its relation to the advance and retreat of the West-Pacific subtropical anticyclone overthe far east. Acta Meteorologica Sinica 34, 387–396. doi: 10.11676/qxxb1964.039
Tao, S. Y., Zhao, Y. J., and Chen, X. M. (1958). The relationship between Meiyu in fareast and the behaviour of circulation over asia. Acta Meteorologica Sinica 29, 119–134. doi: 10.11676/qxxb1958.014
Wang, X., Dong, X., Deng, Y., Cui, C., Wan, R., and Cui, W. (2019). Contrasting pre-Mei-Yu and Mei-Yu extreme precipitation in the Yangtze River valley: influencing systems and precipitation mechanisms. J. Hydrometeorol. 20, 1961–1980. doi: 10.1175/JHM-D-18-0240.1
Wang, B., Yang, J., Zhou, T. J., and Wang, B. (2008). Interdecadal changes in the major modes of Asian–Australian monsoon variability: strengthening relationship with ENSO since the late 1970s. J. Clim. 21, 1771–1789. doi: 10.1175/2007JCLI1981.1
Wu, C. Q., Liu, Y. Z., and Jai, R. (2019). Response of climate during the Meiyu period over the Yangtze-Huai River valley to global warming. Acta Meteorologica Sinica 77, 84–99. doi: 10.11676/qxxb2018.046
Xu, Chen, (2015). A study on statistical characteristics of Meiyu turning from typical to atypical and its possible causes. Nanjing: Nanjing University of Information Science & Technology, Master's Thesis, 77.
Ye, D. Z., and Zhu, B. Z. (1954). Beginning of seasonal transition in East Asia and its relation to atmospheric circulation. Acta Meteorologica Sinica 26, 71–88.
Yao, Y. H., Lin, H., and Wu, Q. G. (2019). Linkage between interannual variation of the east Asian intraseasonal oscillation and Mei-Yu onset. J. Clim. 32, 145–160. doi: 10.1175/JCLI-D-17-0873.1
Zhou, P. H., and Li, X. Z. (2022). Comparison of intraseasonal variation of the meridional displacement of the Western North Pacific subtropical high in early and late summer. J. Clim. 35, 6361–6379. doi: 10.1175/JCLI-D-21-0864.1
Zhou, B., Liang, P., and Wang, D. Q. (2007). GB/T 33671–2017 Meiyu monitoring indicators. Beijing: China Standards Press.
Zhou, Z. Q., Xie, S. P., and Zhang, R. H. (2021). Historic Yangtze flooding of 2020 tied to extreme Indian Ocean conditions. Proceed. National Academy of Sci. 118:e2022255118. doi: 10.1073/pnas.2022255118
Zhu, J., Danqing, H., and Yang, T. (2016). Changes of Meiyu system in the future under A1B scenario simulated by MIROC_Hires model. Theor. Appl. Climatol. 123, 461–471. doi: 10.1007/s00704-015-1371-8
Keywords: middle and lower reaches of the Yangtze River, Meiyu, new characteristics, atmospheric circulation, interdecadal variation
Citation: Hao L-S, Ding Y-H and Liu Y-J (2024) New characteristics of Meiyu precipitation changes in the middle and lower reaches of the Yangtze River since 2000. Front. Clim. 6:1372460. doi: 10.3389/fclim.2024.1372460
Edited by:
Xin Wang, Chinese Academy of Sciences (CAS), ChinaCopyright © 2024 Hao, Ding and Liu. This is an open-access article distributed under the terms of the Creative Commons Attribution License (CC BY). The use, distribution or reproduction in other forums is permitted, provided the original author(s) and the copyright owner(s) are credited and that the original publication in this journal is cited, in accordance with accepted academic practice. No use, distribution or reproduction is permitted which does not comply with these terms.
*Correspondence: Li-Sheng Hao, aGxzNTQ1MTVAMTYzLmNvbQ==; Yan-Ju Liu, bGl1eWFuakBjbWEuZ292LmNu