Abstract
The success of climate adaptation and nature conservation measures depends significantly on public support. Although the value of protecting iconic species is often easy to communicate to non-expert audiences, conveying the broader importance of ecosystem restoration and conservation for climate resilience is more challenging. To address this, we developed a method that combines spatially explicit models of complex, self-organizing ecosystems with state-of-the-art visualization techniques. This approach creates immersive, three-dimensional panoramic views of natural landscapes, illustrating how people live in and interact with these ecosystems. Our method showcases the inherent complexity of ecosystems, highlighting features such as spatial patterning and the dynamic processes that shape them, as well as the critical role of this complexity in supporting biodiversity. Additionally, it demonstrates the potential of restored or even constructed ecosystems as nature-based solutions to future climate challenges. Adaptable to various ecosystems and locations, with the optional addition of audio or text explanations, this visualization tool can be used in diverse contexts, from museum exhibits to on-site virtual experiences, effectively reaching broad audiences. We present our visualization approach through two case studies that bring to life past climate-adaptive ecosystems and envision future developments. The first case depicts a historic medieval village, now located within a low-lying polder, which was once founded on an expansive, climate-resilient marsh that naturally rose with sea levels due to continuous sediment deposition. The second case explores a planned nature restoration project in Biesbosch National Park, where an embanked meadow is planned to be converted into a tidal wetland.
1 Introduction
Coastal communities the world over are under increasing stress from climate change (Temmerman et al., 2013; Glavovic et al., 2022). Sea level rise threatens to drown low-lying fields, forests, and mega-cities alike, and residents face a crucial choice—adapt or flee. Communities wishing to protect themselves against the rising sea often turn to familiar measures, such as dikes, and expect these to scale up endlessly to meet their needs, preserving the rest of the landscape in its current state, which they perceive to be its “natural” or “normal” state. Novel ideas, like nature based solutions, and other more adaptive coastal defenses are often excluded for being too disruptive to the “proper” state of the region. This phenomenon, known as shifting baseline syndrome, is observed across all areas of global change adaptation and is considered to be one of the key stumbling blocks in dealing with climate change (Pauly, 1995; Soga and Gaston, 2018).
It seems, then, that adaptation of human mindsets may be one of the biggest hurdles to overcome in order to create a climate-resilient coastline. To that end, we have developed a new technique that uses 3D visualization to depict either past or future (coastal) ecosystems. By providing local communities with an immersive experience of how their ancestors worked with the natural landscape, rather than trying to keep nature out, or of what their own surroundings might look like under different adaptation scenarios, we can make substantial progress in overcoming that hurdle.
Here, we describe a pipeline that builds on self-organized complexity models to create a lifelike representation of natural landscapes and the everyday human lives that are associated with them (Section 2). We further describe two examples to illustrate the process of making a 3D visualization of a landscape modeled by means of, in this case, a coupled hydrodynamic-biogeomorphological model (Section 3). Finally, we discuss the possibilities for applying our method to different scenarios and in different settings (Section 4).
1.1 Shifting baseline syndrome hinders nature restoration
Shifting baseline syndrome is the phenomenon of gradually changing perceptions regarding the natural state of the world: each generation regards the state of the world during its formative years as the “normal” or “natural” condition. Anything newer is seen as undesirable change, while anything older is backwards and outdated (Soga and Gaston, 2018). The shifting baseline syndrome can lead to a positive feedback loop of increasing environmental degradation and a changing perception and appreciation of the natural world as the loop continues over generational timescales. Soga and Gaston (2018) identify a lack of natural history knowledge, of interaction with the natural environment, and of familiarity with that environment as causes of a shifting baseline perception of the natural world.
One example of this can be found in the rural landscapes of the Netherlands. Since the late Middle Ages, large areas along the Dutch coast have been diked to keep out the sea and increase the amount of land available for human use. These areas, known as polders, were once exposed to the tides, but are now completely cut off from the sea. Prior to the systematic poldering of the Dutch delta, settlers in these regions lived on raised mounds on the tidal flats. Their baseline perception of their surroundings consisted of continuous interaction with the tides and the complex system they formed around them, including a rich variety in species along the tidal gradient and an intricately patterned channel network throughout the landscape (see also Section 1.2). In contrast, their modern descendants grew up in a much simplified, binary landscape—rigid boundaries (dikes) separate human-occupied land from the sea, a plain, straight-lined pattern of rectangular fields covers the landscape, and few areas are allowed to grow wild.
By coupling nature restoration efforts with measures to counteract the causes of shifting baseline syndrome, we can reverse the feedback loop and support the adaptation of human mindsets to the necessity of adapting to climate change.
1.2 Self-organization shapes landscapes and we can model it
A characteristic of many pristine ecosystems is that they are shaped through a set of naturally occurring feedback loops which determine the morphological evolution of the landscape, a process known as self-organization (Klausmeier, 1999; van de Koppel and Rietkerk, 2004; Zhao et al., 2019). Self-organization happens across multiple spatial scales, which can lead to highly heterogeneous, complex landscapes with different patterns across these scales (Liu et al., 2014; Tarnita et al., 2017). This multi-scale heterogeneity and associated complexity are a key difference from heavily human-influenced landscapes, which tend to be highly homogenized and simplified, and is what makes these landscapes look natural.
Through self-organization, many ecosystems develop recognizable spatial patterns (Rietkerk and van de Koppel, 2008), a phenomenon thought to enhance resilience to disturbances, adaptability to long-term changes, and evasion of tipping (e.g., van de Koppel and Rietkerk, 2004; Liu et al., 2014; Zhao et al., 2019; Rietkerk et al., 2021). As such, self-organizing ecosystems are at the focus of a wide range of nature-based solutions to climate change, relying on the innate adaptability of the self-organizing systems to facilitate the resilience of the proposed solutions.
The self-organized nature and complexity of pristine ecosystems can be visually communicated by including self-organized patterning in visualizations. Rather than rendering an artist's impression or freehand drawing, this can be done easily and with scientific accuracy by using one of the many models provided to us by self-organization theory, simulating the processes that drive the formation of these patterns. Examples of modeled self-organizing systems include peat bogs (Rietkerk et al., 2004), salt marshes (Zhao et al., 2021; van de Vijsel et al., 2023), cold-water coral mounds (van der Kaaden et al., 2021), semi-arid vegetation (Klausmeier, 1999), mussel beds (Liu et al., 2014), and tropical forests (Wuyts et al., 2019). For the examples in this paper we used the model of van de Vijsel et al. (2023), which simulates the self-organization of the creek pattern characteristic of salt marsh landscapes (Figure 1).
Figure 1
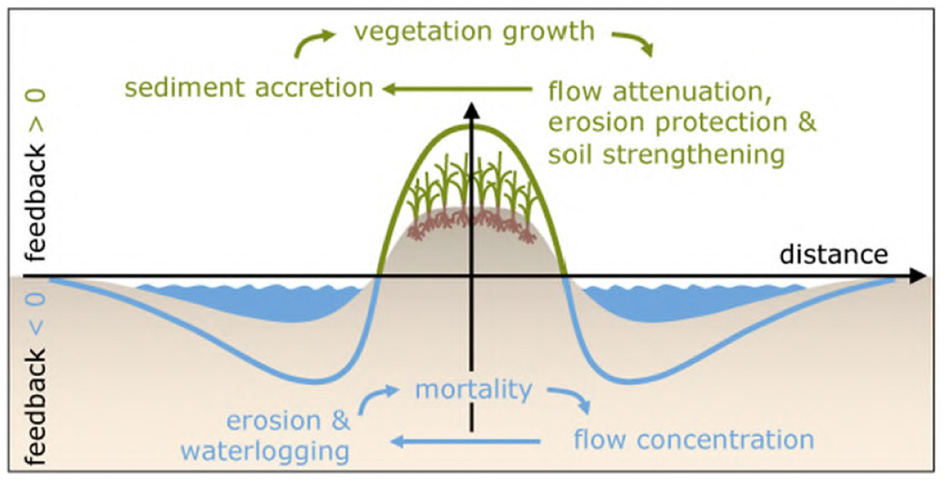
Biogeomorphological feedbacks leading to scale-dependent pattern formation in salt marshes. Reproduced from van de Vijsel et al. (2023) (license CC BY 4.0).
1.3 Visualizing modeled landscapes in 3D
3D visualization methods are in common use in fields such as architecture and urban planning (Bishop and Lange, 2005), where they are used to visualize architectural products such as houses for sale, or even large-scale urban design. Recent work applies such techniques to the planning of infrastructure in rural settings (e.g., Bittner et al., 2024) and of small-scale green areas such as parks (e.g., Dhaini and Dreksler, 2024). The method presented in this paper utilizes the same visualization techniques, but uses them to visualize the output of models of self-organizing ecosystems in a context of nature conservation and restoration. That is to say, rather than examining how a landscape might look under human direction, we use these techniques to explore and envision how our ancestors adapted their planning and infrastructure to more natural surroundings (as in the example in Section 3.1), and how present-day ecosystems might adapt themselves to novel settings created in nature restoration projects (Section 3.2). The key novelty, then, is in the accurate and realistic visualization of complex natural ecosystems, to help convey the benefits of pristine ecosystems and of allowing them to evolve and self-organize with minimal human interference.
2 The method
Here, we outline a novel approach that constructs a 3D computer graphics representation of a spatially extensive ecosystem using spatial self-organization models to mimic the natural spatial shape of these ecosystems. The examples included in this paper are visualizations used to communicate the work of our research group to societal partners and the general public. This work focuses on intertidal wetland ecosystems that are shaped by the interplay of tidal water flow and vegetation growth, leading to a topography of creeks and banks along which the vegetation sorts itself, based on the elevation and distance to the nearest creek. The visualized projects made use of the SFere model (van de Vijsel et al., 2023), which provides a detailed, high-resolution simulation of the sedimentation and erosion processes that form the channel pattern characteristic of salt marsh landscapes, though other models may also be used with this method (see Section 2.1 for model requirements). Our method is structured as a pipeline (Figure 2), from the modeling of a self-organized landscape, through the addition of specific and localized details, to the final rendering of realistic landscape panoramas.
Figure 2
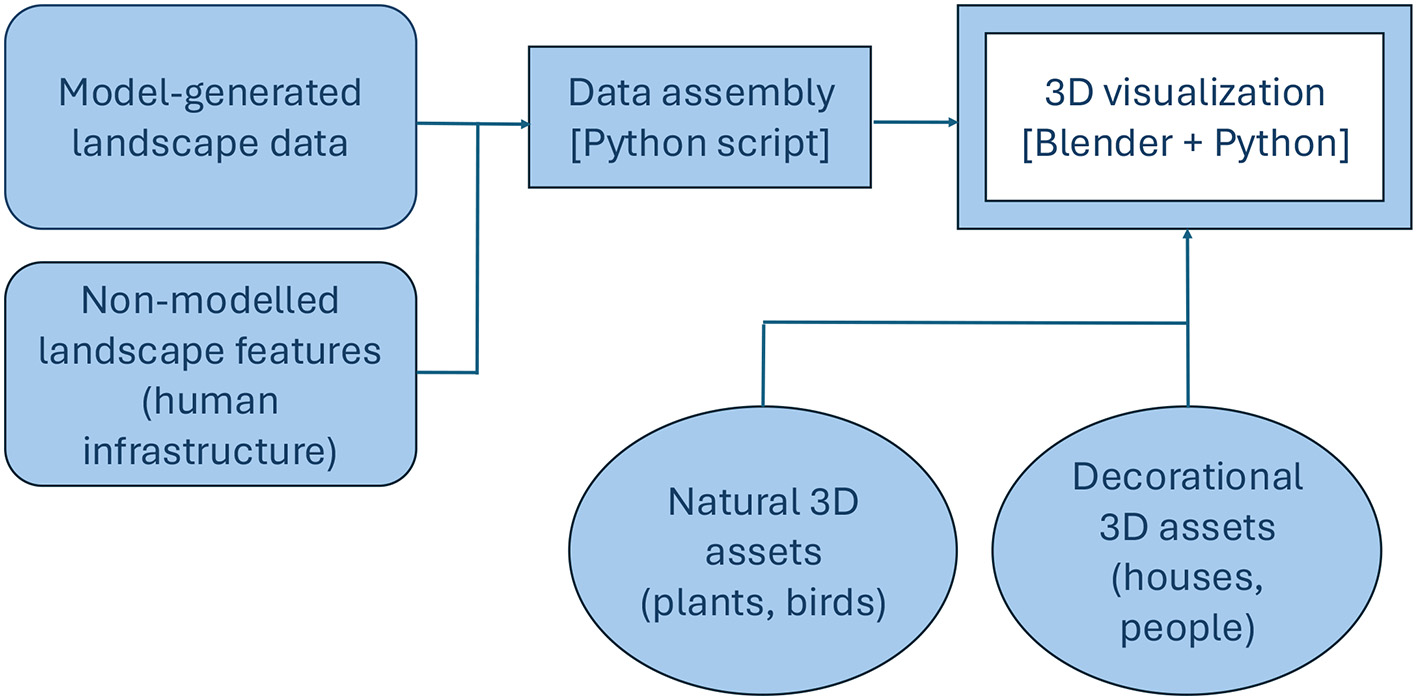
The visualization pipeline—from scientific model to photorealistic images.
2.1 Requirements for the landscape
To build a realistic-looking landscape, it is essential to consider that the ecosystem requires a realistic boundary and transition into a bordering ecosystem. Self-organization models are typically run on a square or rectangular domain, with hard or periodic boundaries. Obviously, these are not useful in the case of computer visualizations, and a more realistic boundary is required (Figure 3). Similarly, the landscape should not look too mathematical (e.g., perfectly regular), which can be avoided by adding random noise to the initial conditions or the feedback processes driving landscape formation.
Figure 3
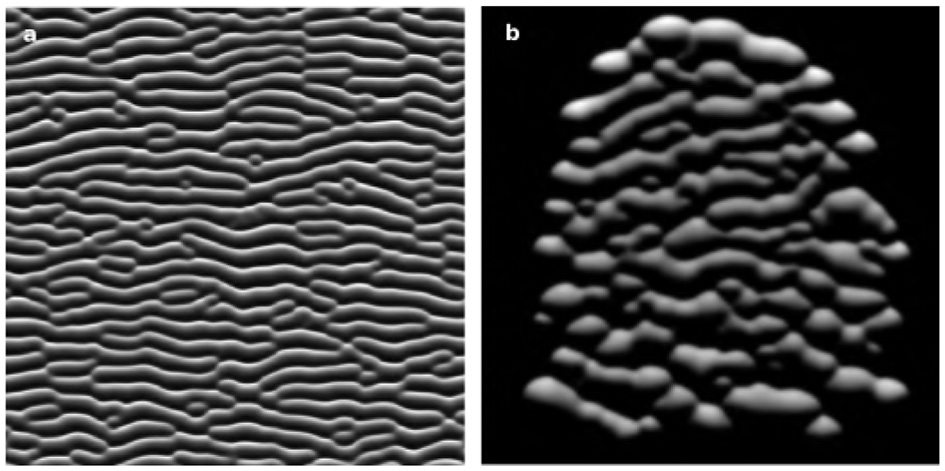
Modeled self-organized pattern of a mussel bed with a square (a) and irregular (b) boundary.
In the method presented below, the developer has the freedom to freely place “cameras” through which viewers will experience the landscape, thus determining their point of view. This point of view, together with any limitations of the model used, will determine vital characteristics of the landscape (scale of patterns, ecosystem boundary) and of the image (scale and resolution of the visible detail).
2.2 A pipeline from self-organization model to 3D CGI visualization
The goal of the visualization pipeline (Figure 2) is to prepare the data obtained from an ecosystem or landscape model, combine it with additional landscape features such as human infrastructure (paths, roads) and buildings, and pass it to a software application that builds the images. For this paper, we have used the 3D visualization software Blender (https://www.blender.org/) for this purpose. We chose to work with Blender as it is open source and freely available, and can itself be programmed using Python to compose a 3D scene with the data that is supplied. Other appropriate software would do the job just as well.
The pipeline starts with a scientific model generating an elevation map (digital elevation model, DEM) of a landscape (Figure 4A). A DEM of the landscape to be visualized is necessary for the next stages in the pipeline. Our salt marsh model also computes plant stem density throughout the landscape, which we will use when adding plants to the visualization. Once the terrain is defined, it needs to be filled with detail, everything from sky, soil texture, and water, to plants, animals, and man-made objects. This can be done manually in Blender's GUI (graphical user interface). However, to construct an entire landscape it is worth using the accompanying Python API (application programming interface), as we have done here.
Figure 4
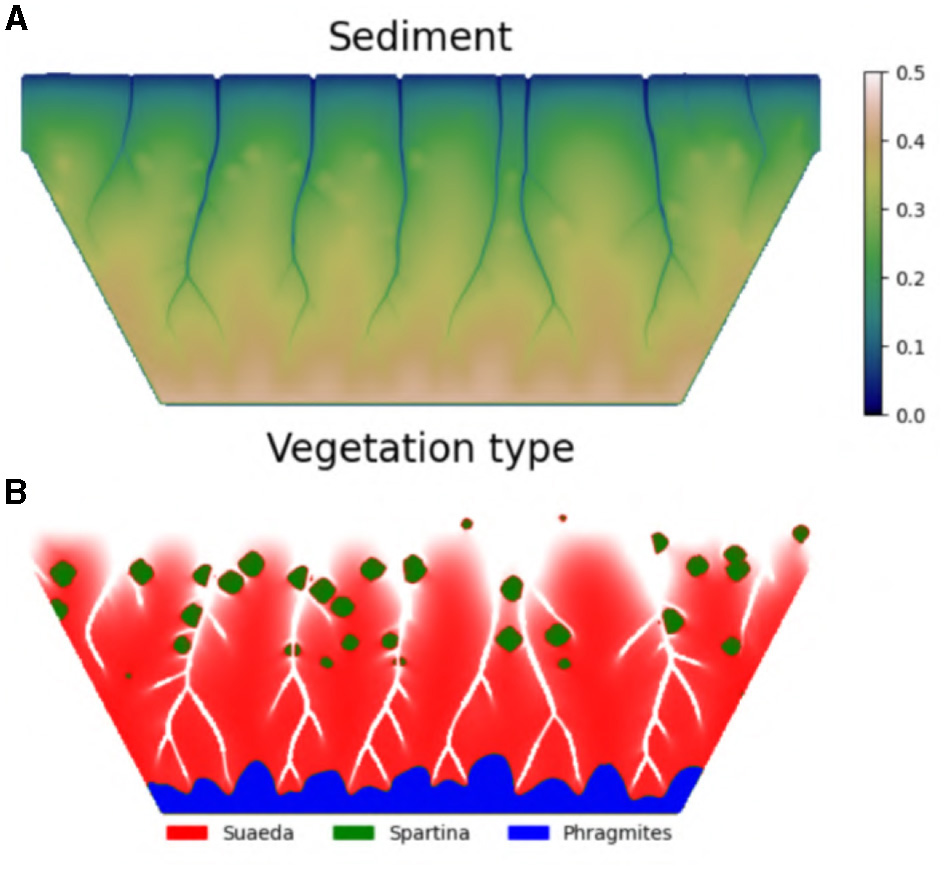
Example of a modeled tidal marsh landscape. The basin is bounded by a dike on three sides, with only the seaward side being open to the tides. Shown are (A) the modeled elevation and (B) the areas in which the different vegetation types grow (their “habitat maps”).
The use of a Python script allows us to place a large number of objects in the landscape with just a few lines of code. For instance, by masking the landscape at different elevation ranges, we create habitat maps (Figure 4B) which direct the program to fill each of these regions in the image with the appropriate plant species, using modeled vegetation density to determine exactly how many individual plants to include. For this, we have individually visualized 5–6 plants of each species (Figure 5). By placing countless copies of these few individuals at various orientations throughout the image, we give our visualization a degree of heterogeneity that appears natural to the human eye. A similar approach can be used to add large numbers of animals and people to the visualization, if desired.
Figure 5
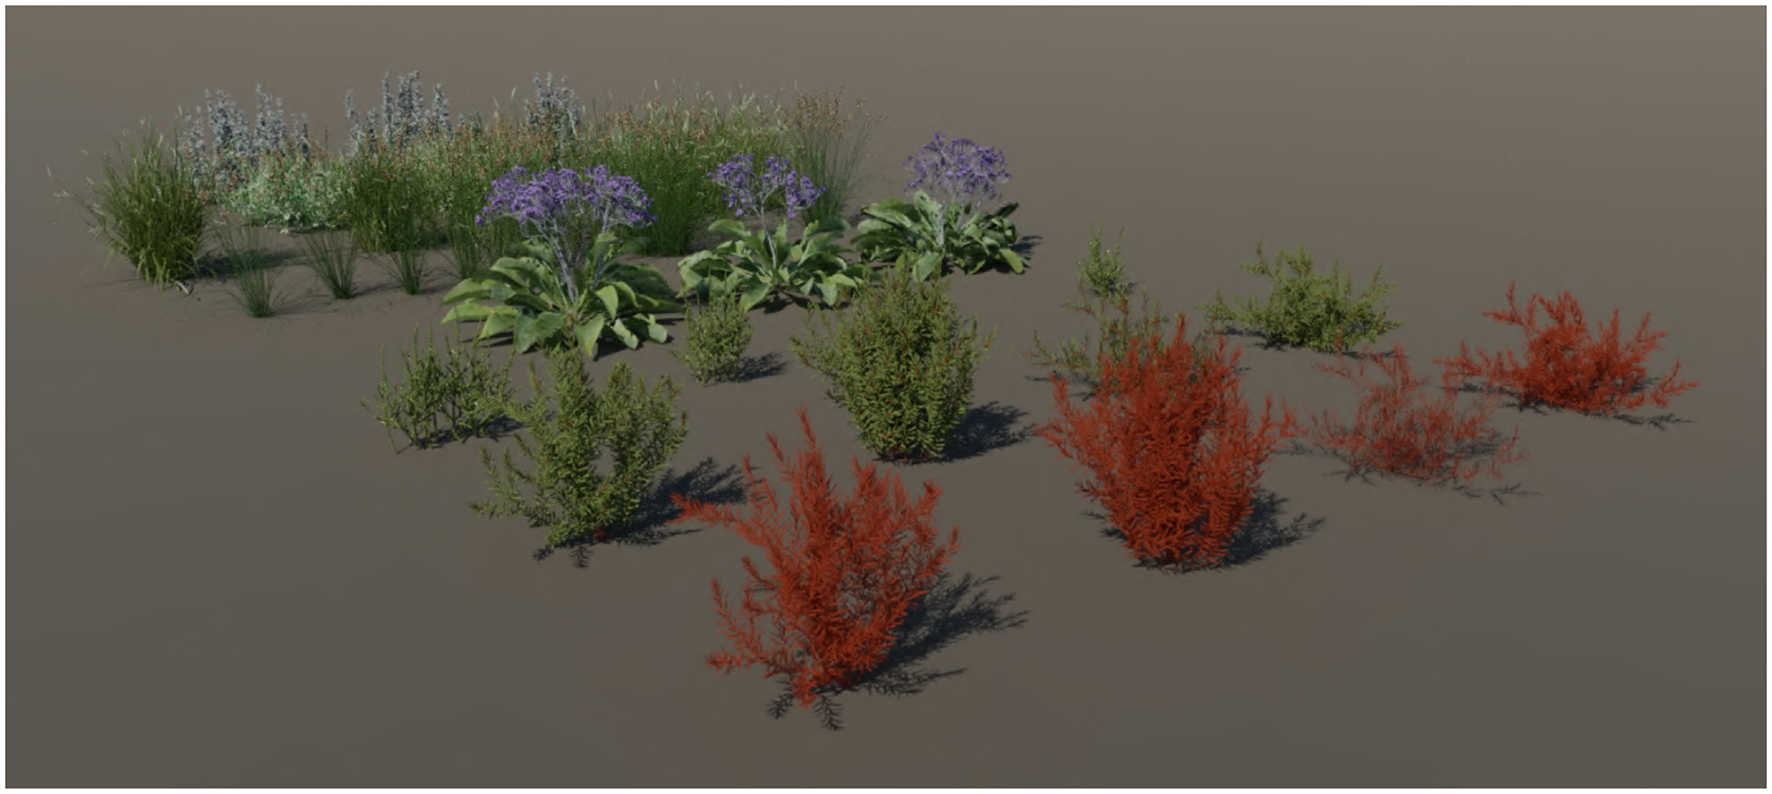
Plant objects used in the visualization examples in Section 3. A small number of objects of each species, when reproduced en masse across an entire landscape, are sufficient to achieve a naturally heterogeneous appearance.
For parts of the landscape that will be visible close up, we define the placing of people and objects individually, to craft panoramic scenes that will draw in viewers and help convey the message the visualization is intended to communicate (see examples in Section 3.1). For this, we use objects licensed from 3D graphics artists (such as the plants in Figure 5), and the Python script specifies the coordinates at which each object should be placed to create the intended scene. The script also specifies the location of a “camera” through which the scene will be viewed.
Once the Python script is completed, the scene is passed to Blender, which renders the complete 3D panorama of the landscape (Figure 6).
Figure 6
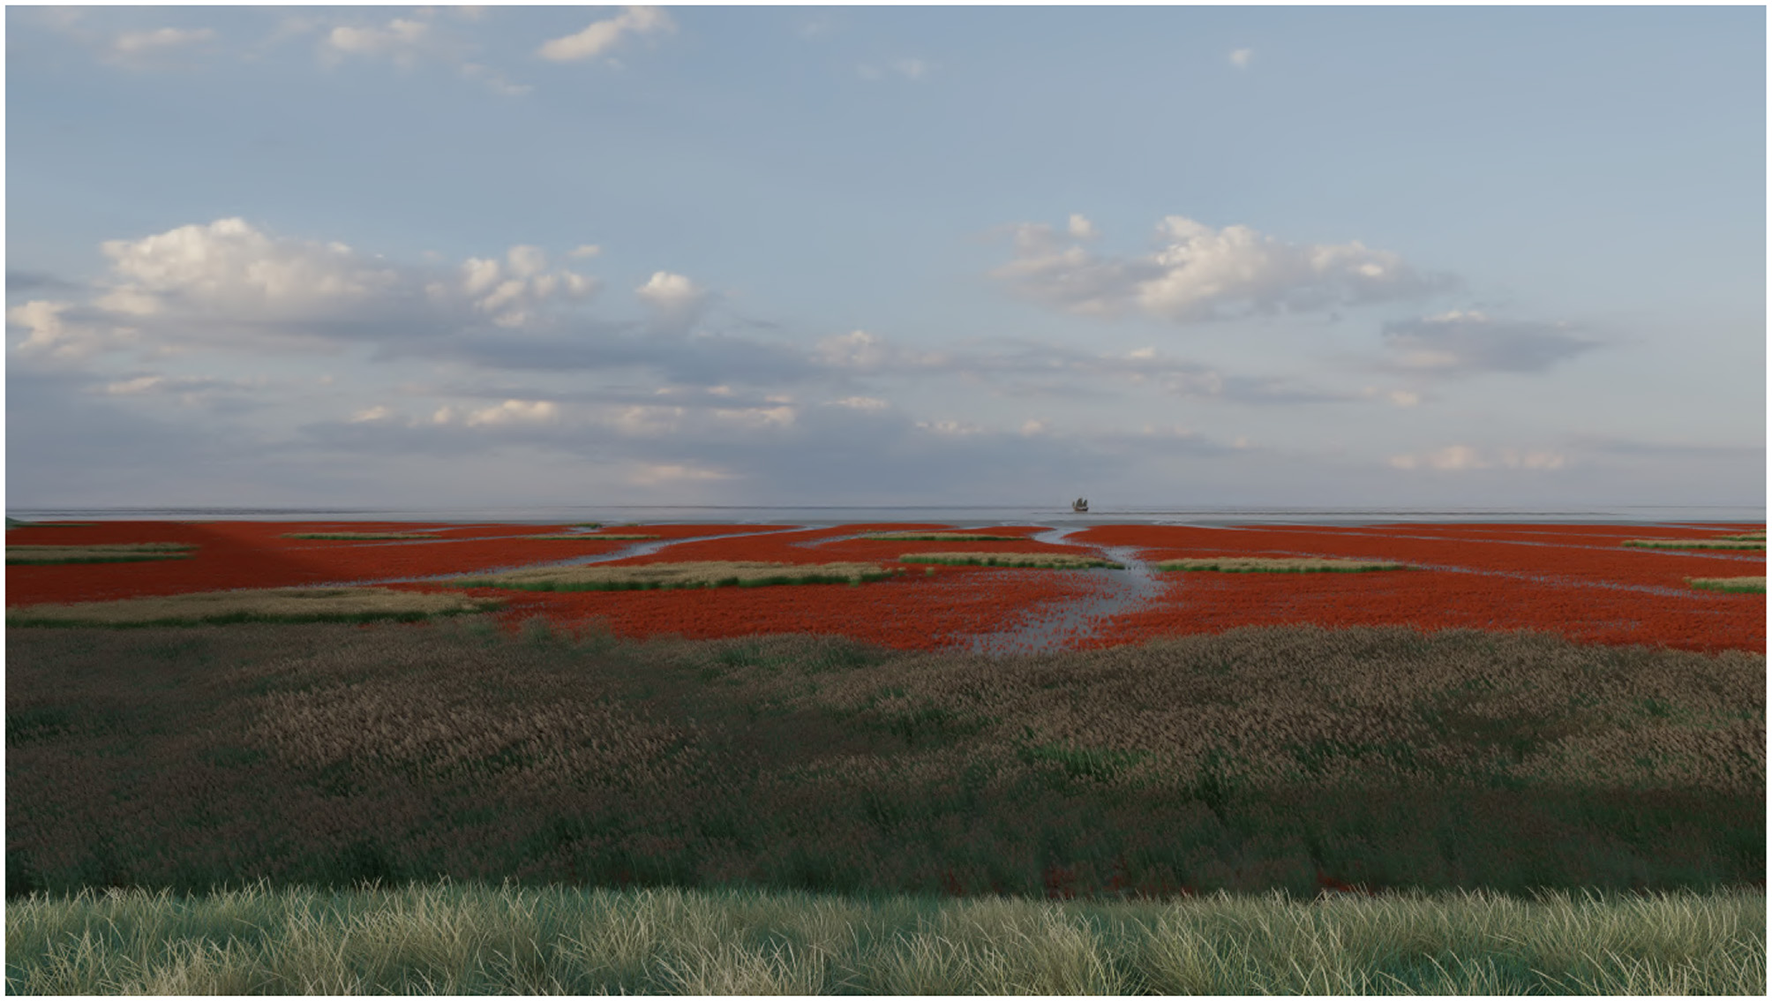
The rendered landscape—the famous red beach of Panjin, China, with its characteristic Suaeda salsa plants.
Finally, the panorama may be converted into a virtual reality (VR) app, which allows users to view it from within the landscape on their computer, phone, or immersively using VR goggles. At this stage, text and audio may be added alongside or embedded in the scene to enhance the story telling and provide further information.
An example of the code for this pipeline can be found via https://doi.org/10.5281/zenodo.14008586.
3 Results: a historic scene, and a future native restoration project
In the course of our work, we have been able to utilize our visualization method for two different purposes:
Visualizing a scientifically reconstructed historical village on a climate-resilient salt marsh, to convey to modern-day residents of the same village that life behind a dike is not the only way to deal with the sea. Location: Wemeldinge, in the south of The Netherlands.
Visualizing the predicted development of a planned managed realignment (marsh restoration) project, supporting the efforts of local government to deal with resistance to the project among some residents. Location: Merwelanden recreational area, near the city of Dordrecht, The Netherlands.
These examples of the application of our method are described in detail below.
3.1 Example 1: a historic village on a climate-proof marsh
Conveying the benefits of green coastal defenses—salt marshes and tidal flats—to coastal societies can be a major challenge, especially when it involves converting land that is human-used or even built-upon to marine natural landscape. Moreover, “giving up” land that has been claimed from the sea by past generations might be experienced as going against the identity of coastal communities, further creating adversity and alienation to the proposed coastal adaptation. Hence, despite providing additional safety, natural coastal defenses can face significant societal obstacles limiting their implementation.
Strikingly, a comparison between historic information and modern engineering points out that natural coastal defenses have played an important role in providing safety to coastal inhabitants in pre-industrial times. In Europe in the Middle Ages, before dikes provided general protection to low-lying coastal regions, people lived in an open coastal landscape by creating mounds on which farms or even entire villages were situated (such as in Figures 7, 8). Typically, these mounds were not higher than 1–2 meters above mean high water level. Agricultural fields were similarly enclosed by small dikes not exceeding 1–2 meters in elevation above mean high water level. Apparently, the salt marsh or floodplain landscape on which these villages were situated could sufficiently buffer the tidal amplitude as well as wave action to make these mounds and dikes safe, given the standards of the time. Much of this landscape has been embanked in many European estuaries, and dikes are now often situated right next to the water's edge. Moreover, modern dikes may rise as high as 10 meters above the landscape. The difference in dike height illustrates the potential of nature-based flood defenses in improving coastal safety.
Figure 7
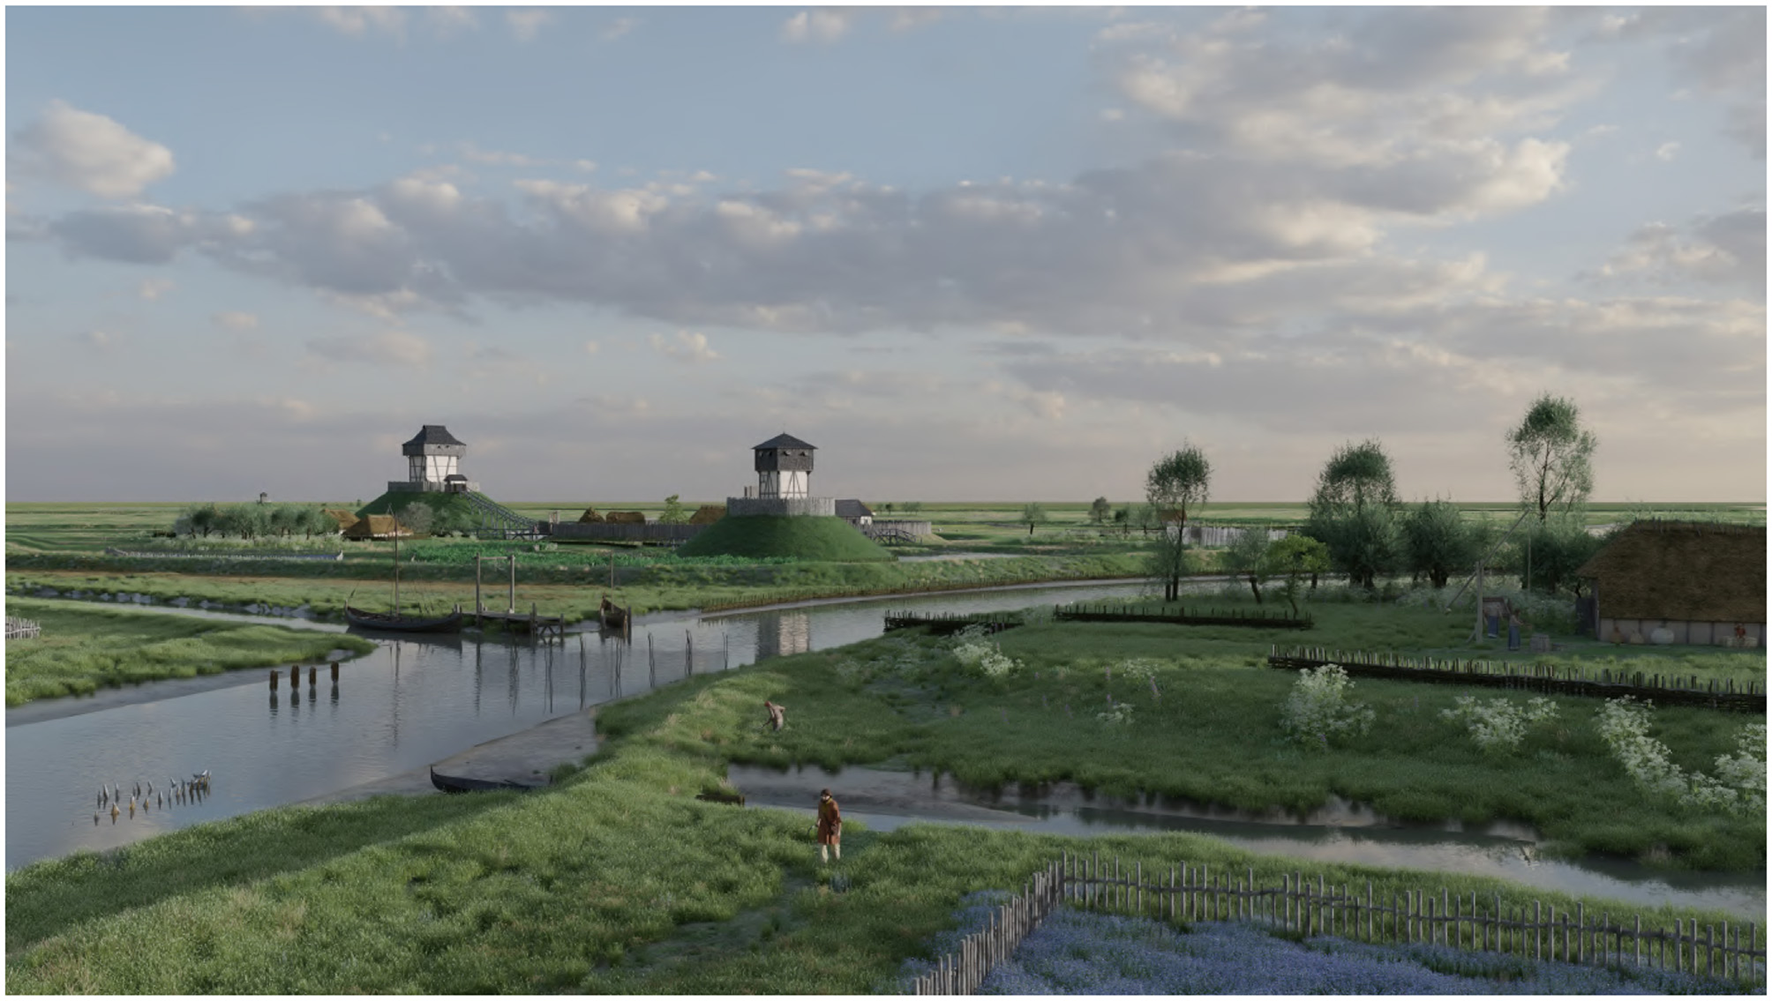
Visualization of the motte-and-bailey of Medieval Wemeldinge (unusually, Wemeldinge seems to have had two mottes, as shown here). Note the low dikes around the village and along the river—1–2 meters above the marsh surface were sufficient to protect the farmlands below the dwelling mounds. See Supplementary material for a comparison to the present-day landscape.
Figure 8
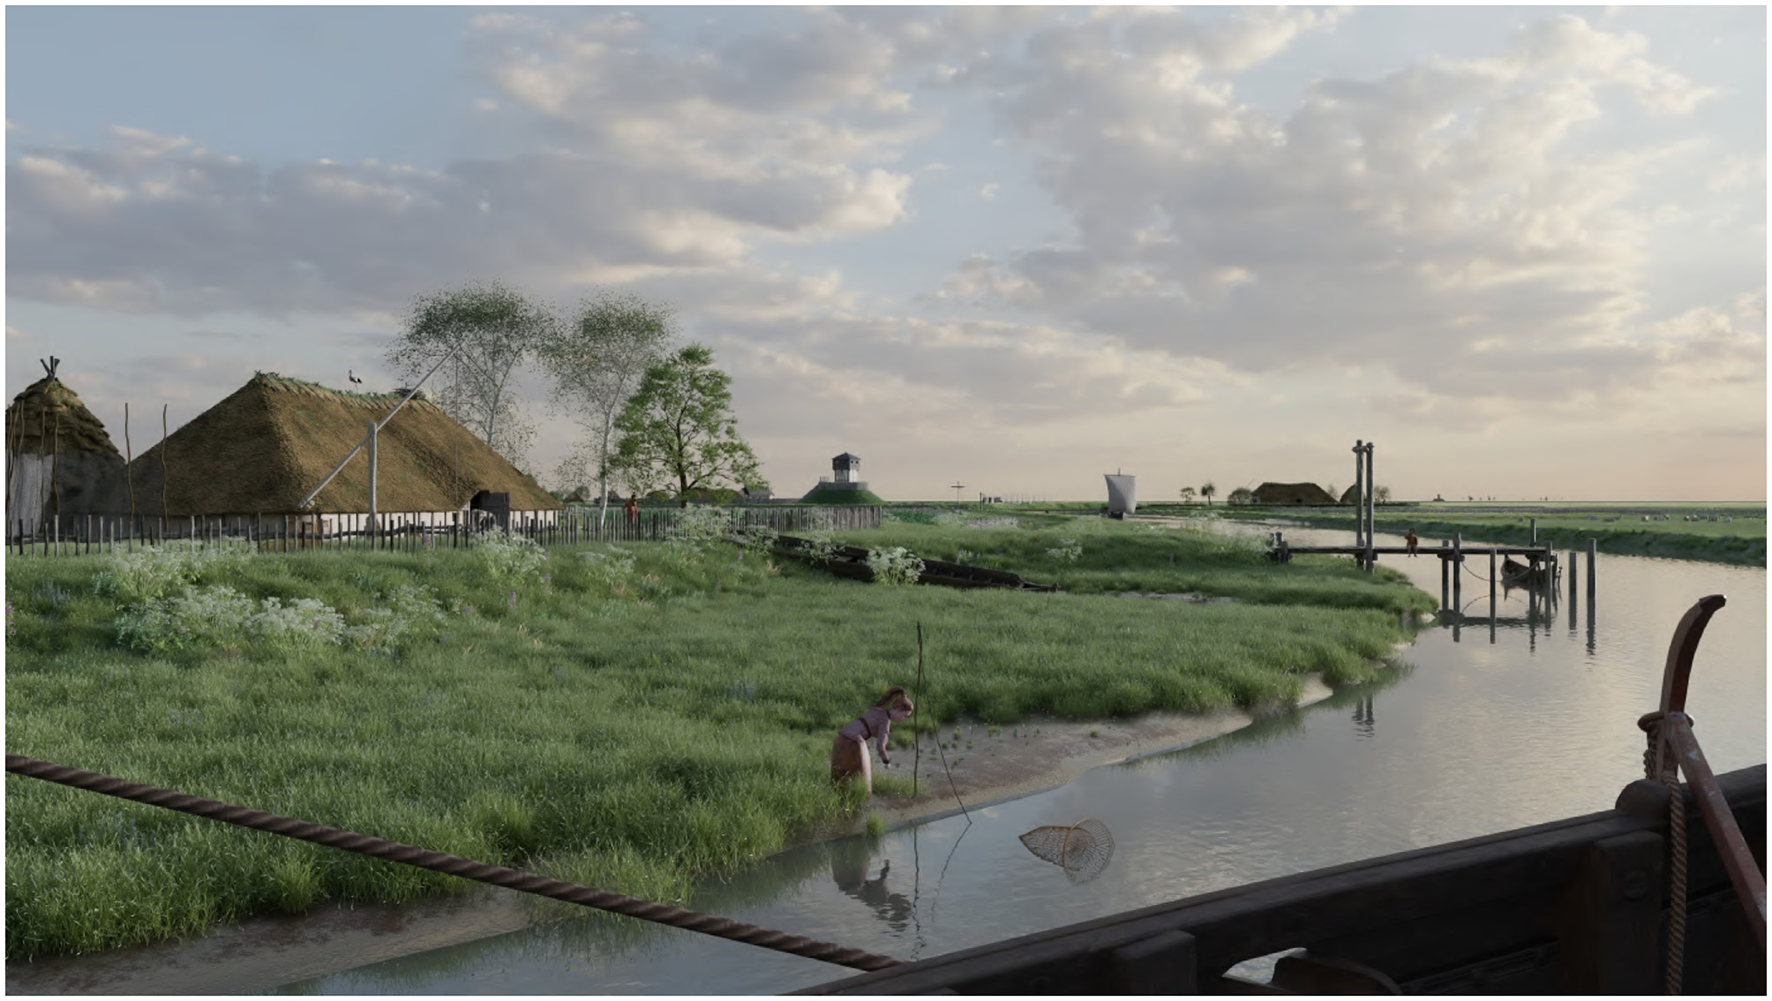
Visualization of a farm in 12th century Wemeldinge. The farmhouse and additional facilities are built on an artificial mound tall enough to keep them above high tide and the occasional storm flood. In addition to farming, the proximity to the water means additional income from fishing, and easy transport by boat.
A further interesting comparison may be made between the agricultural and aquacultural practices of early and modern settlers. In Wemeldinge's early decades, crops were cultivated on land that was regularly inundated with saltwater and shellfish were harvested from their natural habitat on the tidal flats. Today, the villagers farm on “dry,” non-saline land, with all the benefits of modern intensive farming. Besides farming, tourism is a major source of income. Furthermore, there remains a strong cultural perception of “us against the sea,” which strengthens the perceived need to control nature. However, some parts of the Dutch delta are already suffering from marked salt intrusion, which is turning the preconceptions of common agricultural practice on their heads. This may prove to be the area in which learning to work with the sea, rather than against it, is most beneficial.
Knowledge and understanding of the natural state of the - nowadays embanked—natural landscape has for the most part been lost from the coastal communal memory. Improved understanding of the extent of the natural landscape in the past, and the services it provided to people making a living under much harsher conditions, will likely improve the appreciation and acceptance of restoration projects aimed at restoring that landscape. Moreover, the general interest in local history and historical identity might amplify exposure to the concept of nature-based solutions, where natural landscapes are used as an additional or alternative solution for improving coastal safety. For this reason, we describe here a visualization case study in which a historical village is depicted in 1150 AD, situated in a semi-open salt marsh landscape.
Our visualization builds upon the real-world village of Wemeldinge in the province of Zeeland in the Netherlands. For this village, sufficient historical information is available about its construction in the High Middle Ages, which we further expanded through discussion with historical and archaeological experts. We do not aim to provide a historically accurate description, but rather create an informative impression of what the village potentially looked like, building on those elements that are described in the historical record.
An imprint of the 12th century layout of the village can still be seen in it today. In our visualization, we use these lasting features to link the old landscape with the new, thus forming perceptual links between the everyday lives of current residents and those of their early ancestors:
In its early days, the village had a motte-and-bailey form, with a wooden keep atop a tall artificial hill (motte) overlooking the bailey, the central part of the village surrounded by a low dike topped with a palisade (Figure 7). The motte still stands today, a prominent feature in the low-lying landscape.
Inside the bailey, a wooden church stood on a small mound, below which there lay a watering hole, as well as several houses and communal buildings. Today, the same watering hole can be found at the foot of the mound on which a 13th century stone church has taken the place of the wooden one.
Traffic to and from the village traveled along a natural channel, where water flowed past the dike to the sea, its banks dotted with farmhouses on dwelling mounds. Once larger dikes were constructed, the channel dried up. As it follows a convenient path through the landscape, it continues to serve the same transport function today, but as a road. Some of the same dwelling mounds can be spotted along it, now topped with modern farmhouses.
Our visualizations offer a glimpse into the historic Dutch village before embankment, showcasing both the interactions with and the benefits from the surrounding salt marsh landscape (Figures 8, 9). Using the appeal of historic settings, we aim to convey the importance of natural landscapes with a straightforward message: in the 12th century, a 1.5-meter-high dike was sufficient to protect the community against the sea, while a 10-meter mount was constructed to guard against human threats (Figure 7). Today, however, without the buffering effects of salt marshes and due to modern safety standards combined with human-made sea-level rise intensified by embankment practices, dikes need to be significantly higher, i.e., often exceeding 9 meters, to meet required safety regulations.
Figure 9
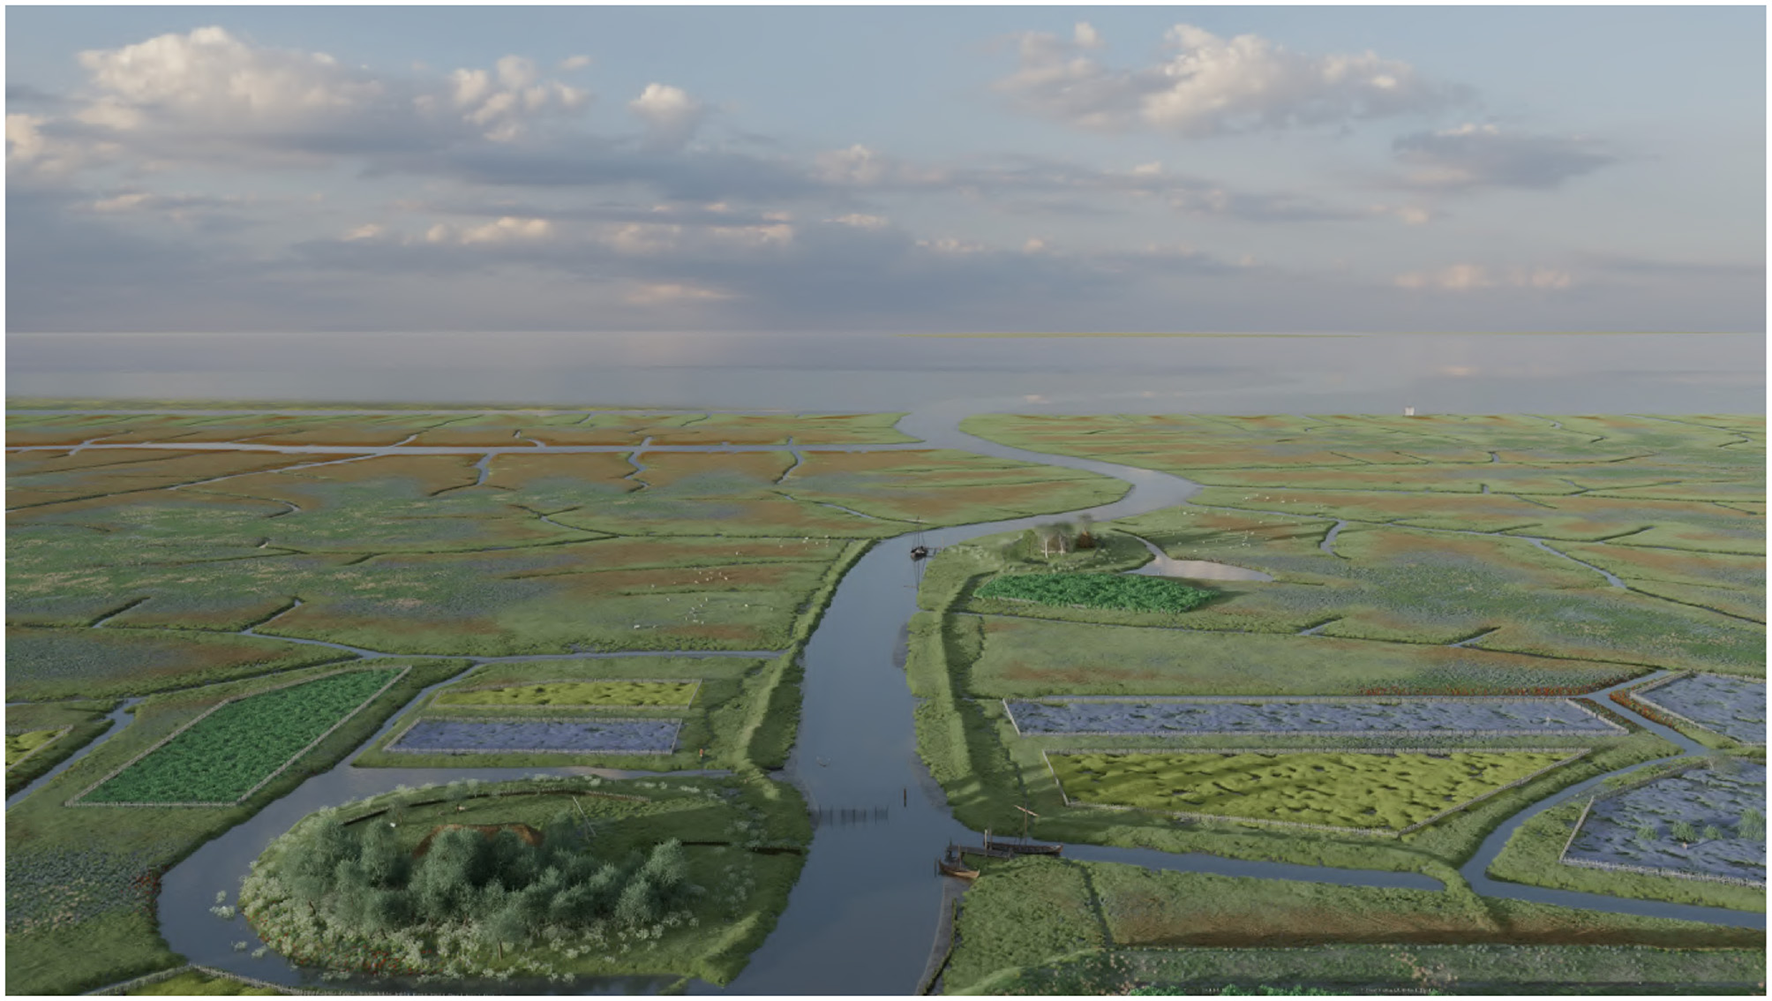
Visualization of the view toward the sea from above Wemeldinge. The main channel (today a road) carries traffic, past farms on mounds, toward the village. Farmers grow salt-resistant crops in fenced-off fields on the marsh. Their sheep can be seen dotted around the landscape, grazing on the native vegetation. See Supplementary material for a comparison to the present-day landscape.
We combined 360° images at select locations in the landscape into a mobile app, which guides users on a walk along the former river (now a road), where they can compare the existing landscape with the 3D visualizations presented on their phones (Figure 10). Each viewing point in the app is accompanied by a short textual explanation. The app may also be viewed on a regular computer or using a VR system. This allows users, especially local residents, to explore the past landscape and experience the everyday environment of their ancestors.
Figure 10
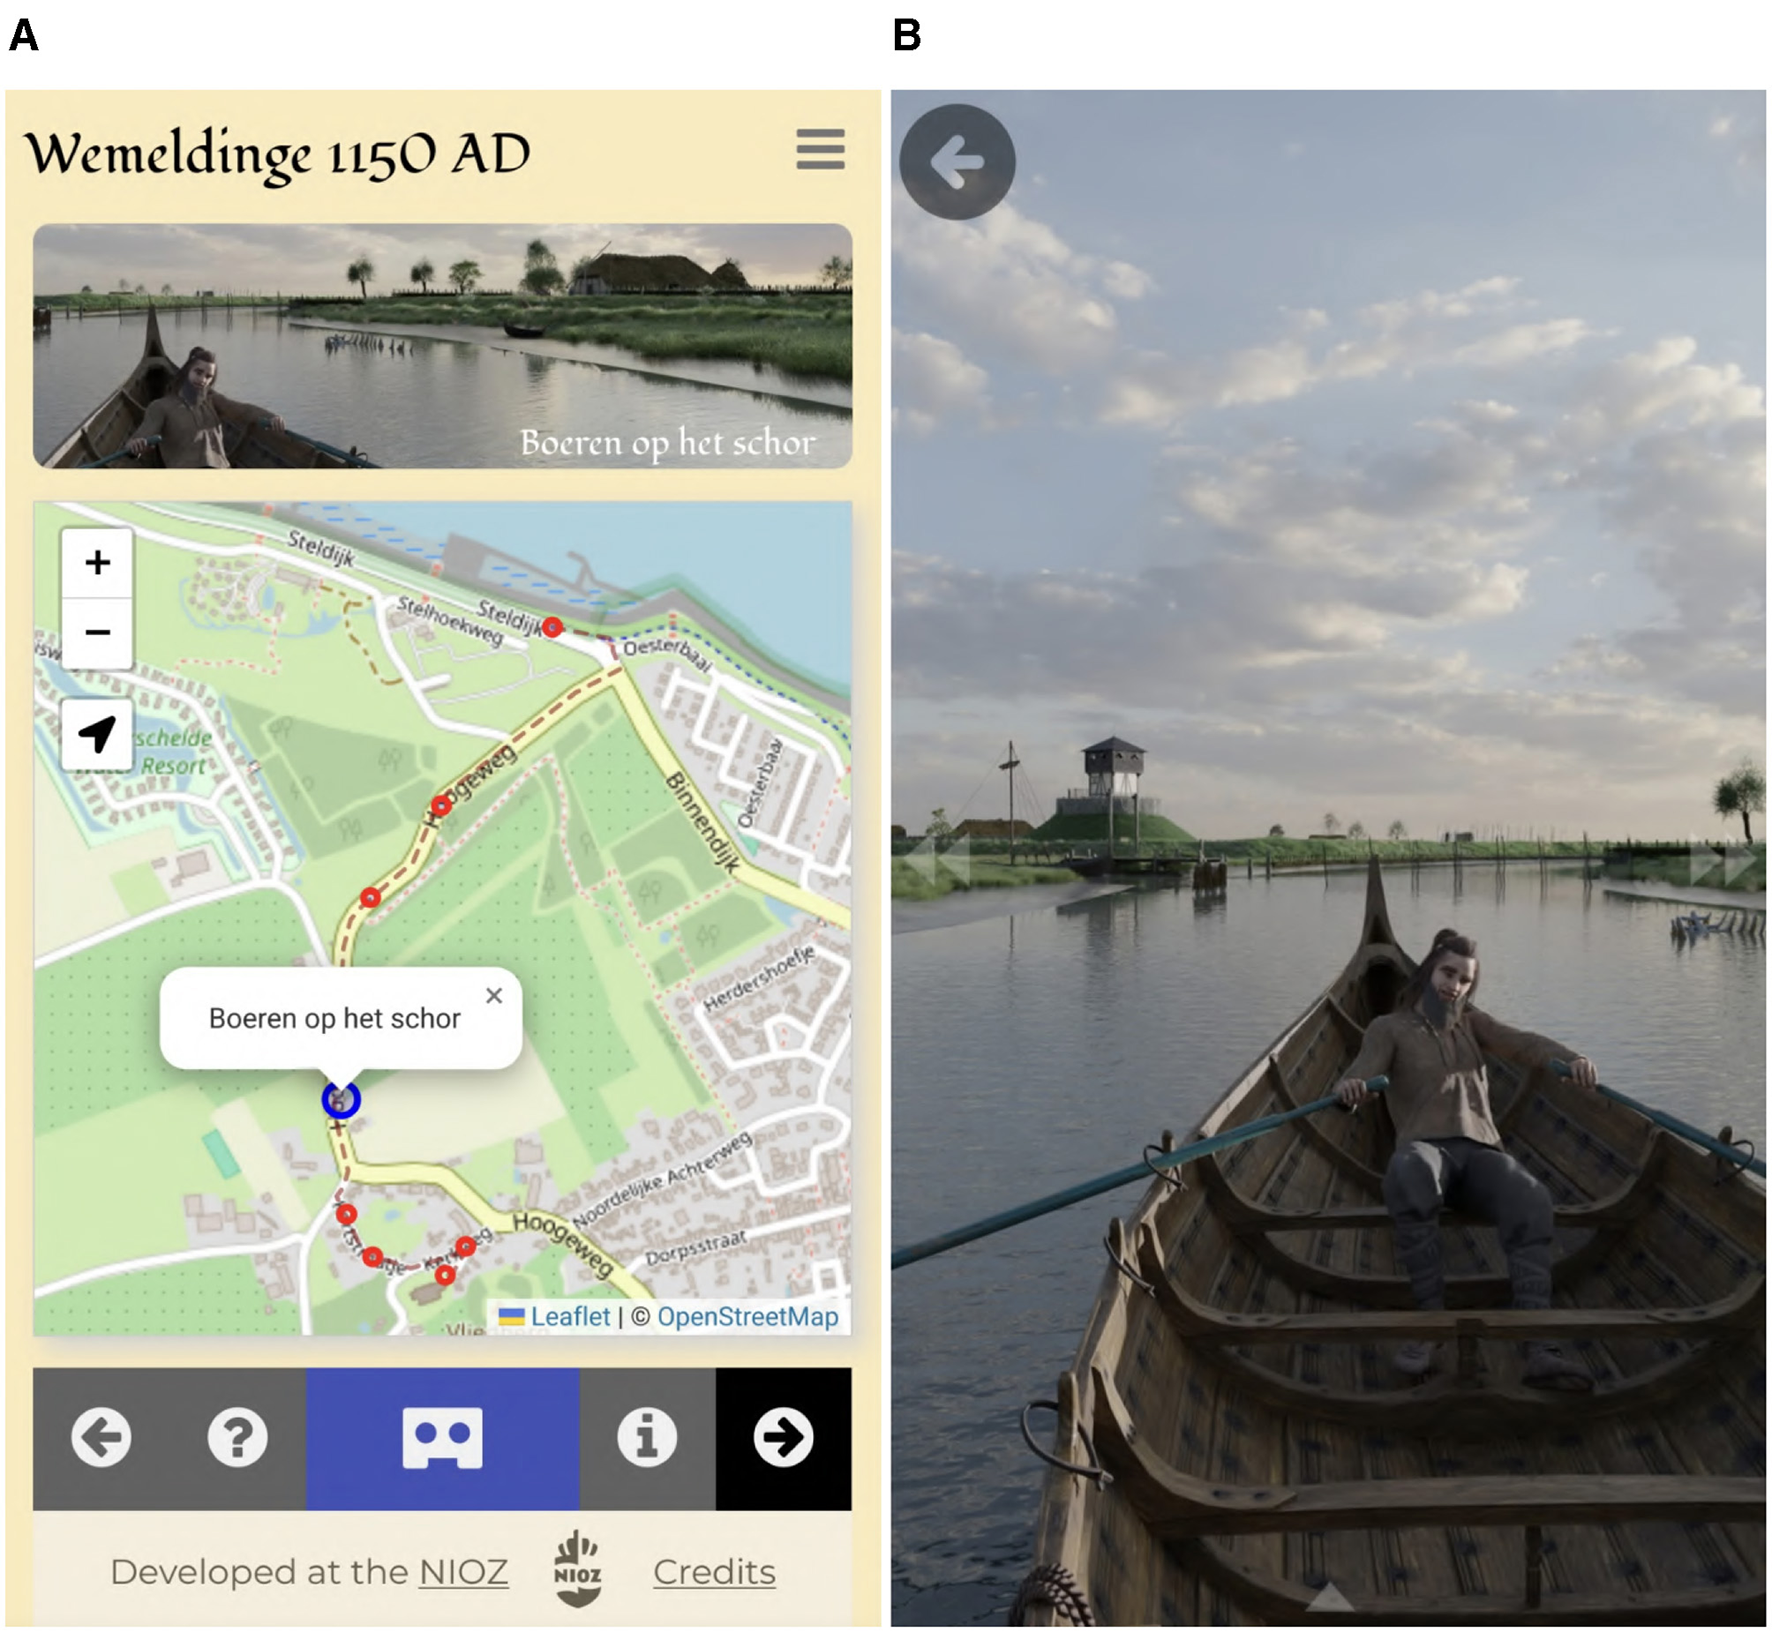
Screenshots of the Wemeldinge app. (A) A map indicates the walking route along the former river. Red dots on the map indicate stops along the route, and the blue circle indicates the current stop. (B) A 360° visualization of the past landscape at the current stop can be viewed in the app. The visualization can turn together with the user, to always show a point of view that corresponds to what they see in reality.
The full visualization can be found at https://dataportal.nioz.nl/visualmodels/wemeldinge/.
3.2 Example 2: de-embanking of a polder area to restore tidal flood-forest landscapes
Adapting landscapes to a future of sea level rise and other impacts of climate change may require that areas that are now in human use—for agriculture, recreation or even buildings—are sacrificed to allow for improved defenses. Especially in the case of nature-based safety solutions that lead to loss of agricultural landscapes, resistance can be significant. Visualization can in that case be used to convey the utility and appeal of the restored or even newly created natural landscape to coastal communities. In this case study, we describe a visualization project that was implemented to restore a climate-resilient tidal flat and flood-forest landscape, at the Merwelanden recreational park, South Holland, the Netherlands. With this visualization, we put forward a new Ecotech approach that aims to improve the appreciation for a planned landscape adaptation for use during or just after the development and acceptance of the restoration project.
Intertidal, freshwater flood-forests were once abundant in the western part of the Netherlands, as well as many other low-lying estuarine European landscapes. Since medieval times, much of this landscape has been converted into polders (land reclaimed from the sea), or into willow plantations to support the local basket-weaving industry. During the 20th century, the use of willow twigs for basketry has been replaced by plastics, and willow cultivation lots were converted into polder areas for agricultural use. Loss of flood-forest habitat has become a major concern, as it harbors many species with specific adaptation to tidal conditions and even salt stress, traits that can become important in the future when sea level rise and salinization become more prevalent. For this reason, in combination with EU restoration directives, the Dutch infrastructure directorate Rijkswaterstaat aims to restore intertidal habitats by de-embanking 60 ha of what is currently meadowland under combined agricultural and recreational use. This project has met with significant resistance, especially from recreational users that fear the loss of the habitat they were used to (it is worth noting that the area was not open to recreational users, though they could walk along the surrounding dike and will continue to be able to do so after the projected restoration is complete).
We developed a visualization from a model-based prediction of how the landscape would develop. We used the reduced-complexity marsh formation model of van de Vijsel et al. (2023) for this, as we did not have opportunity nor funding for a detailed modeling and parametrization of the development of this area, and doing so is beyond the scope of the current project. Developmental plans were obtained from Rijkswaterstaat, which highlighted the main breaches in the dikes that currently surround the polder.
After modeling the post-breach development of the polder terrain, we generated a visualization incorporating the projected marsh landscape with existing and recognizable landmarks, such as a farmhouse-turned-restaurant atop the dike and the surrounding treeline, as well as planned paths and recreational facilities (Figures 11, 12). We also consulted a local ecologist involved in the restoration project, to improve our predictions of the vegetation diversity and distribution in the projected landscape (Figure 12).
Figure 11
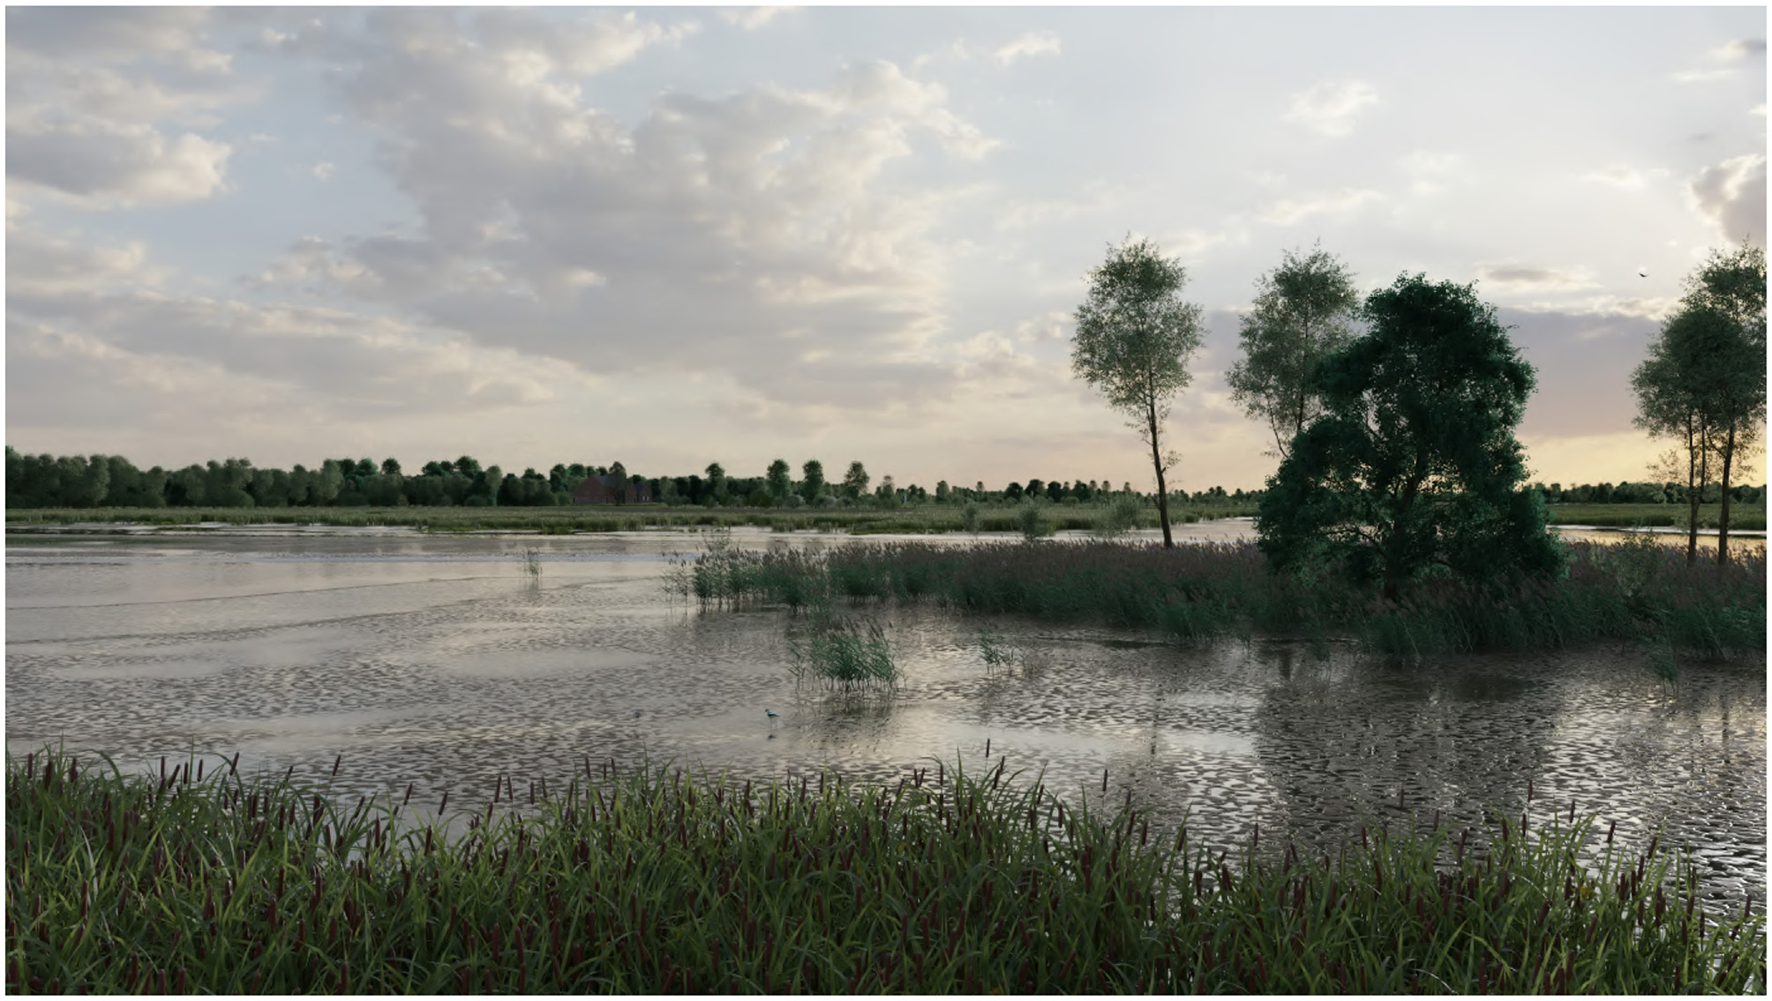
Restored tidal flats in the Merwelanden after the planned de-embankment. The farmhouse at the polder's edge, a known landmark, is just visible in the far distance. See Supplementary material for a comparison to the present-day landscape.
Figure 12
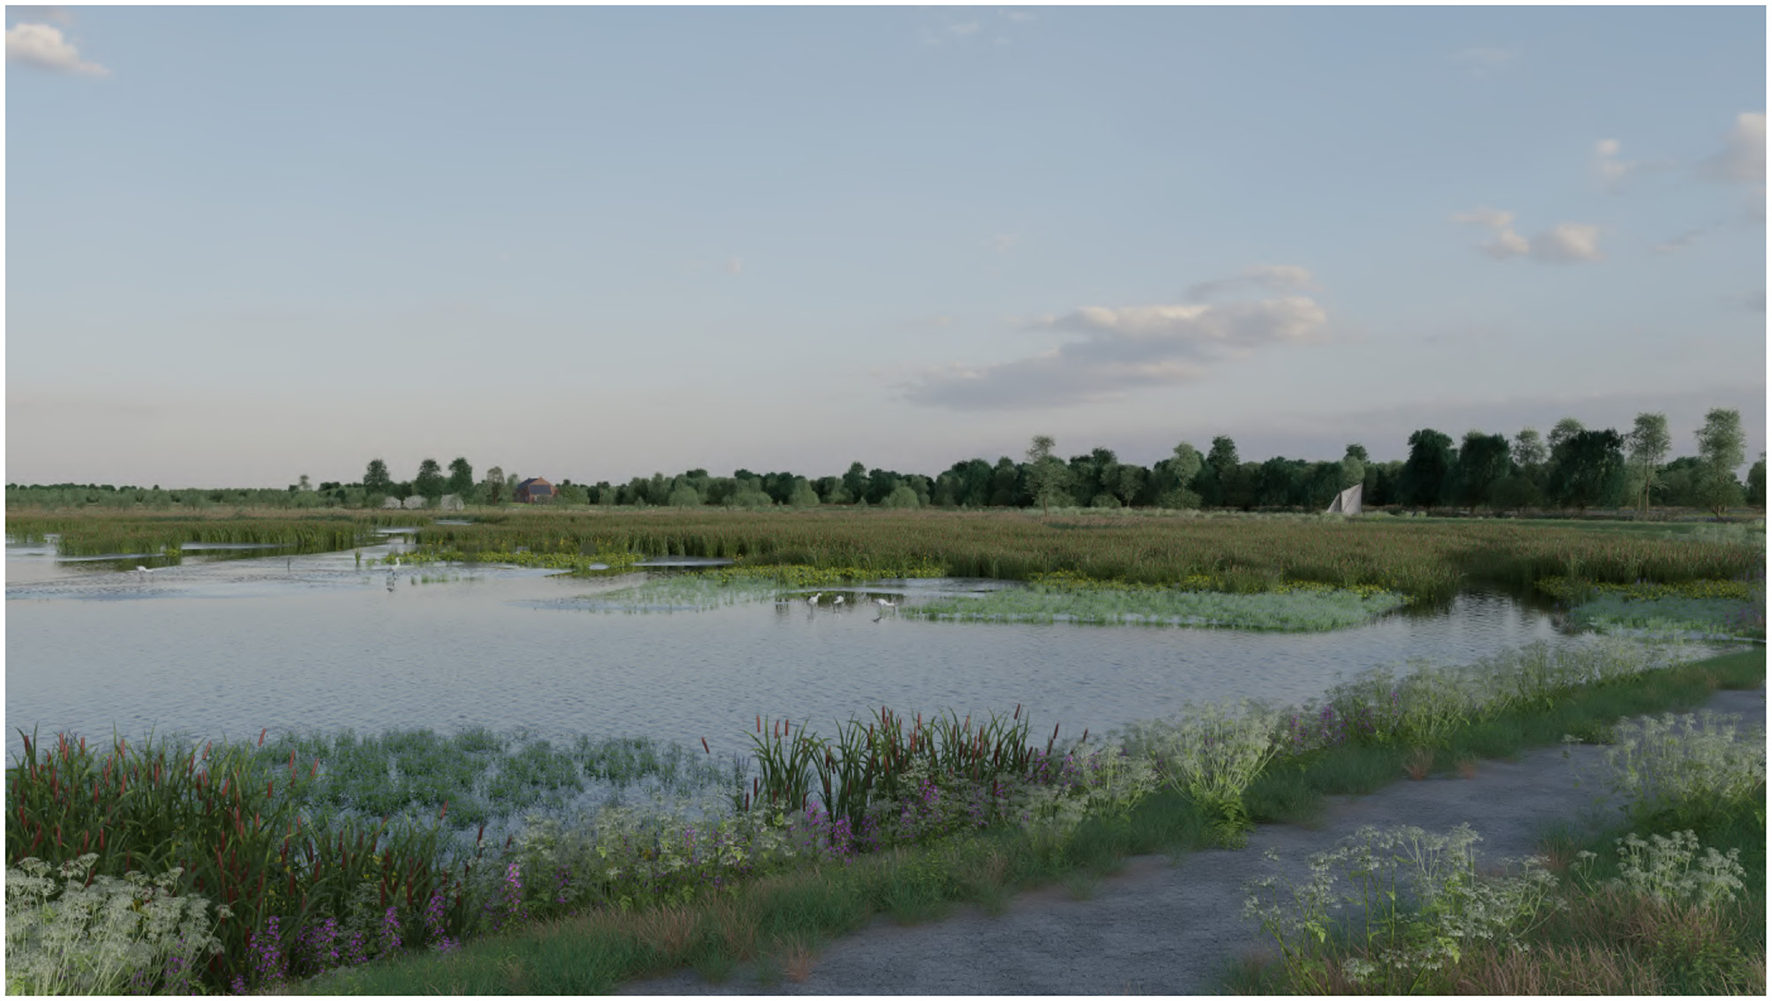
High marsh vegetation and other wildlife return to the Merwelanden after de-embankment. The same recognizable treeline and farmhouse are visible in the background, as in Figure 11.
Here, again, we created an app that leads residents and visitors along the dike surrounding the Merwelanden, allowing to compare the present-day landscape with the future development of their surroundings.
The full visualization can be found at https://dataportal.nioz.nl/visualmodels/Merwelanden/ (the visualizations themselves may be viewed here, though at the time of writing the site is still under construction and some features may not work).
4 Discussion
Here, we have described a novel approach to visualize realistic looking natural systems on the basis of landscapes predicted by spatial models of ecosystem complexity. With these models, we depict past natural systems that have disappeared due to human activity, or future ecosystems that might result from restoration or nature-creation projects. Using this computer-graphics-based approach that is new to the field of ecosystem restoration, we aim to build appreciation for the appeal and value of past and future ecosystems.
4.1 The technology of making life-like visualizations
The visualizations presented in this paper are in essence a model, like any other model used in scientific contexts—a stylized and hypothetical representation of a world that once was, or that might be in the future. Like any model, the technology that we present is in part based on information, combining process-based descriptions of ecosystem dynamics with historic or cultural information, explained with educated guesses or artistic interpretations for those elements where no information is available. This model representation is at best partially correct, and should be viewed in that manner.
Although our aim is to make a 3D visualization of natural systems, the human elements still play a crucial role. Human elements, like historical houses or people dressed in old-fashioned attire, provide visual cues for the temporal context of the visualized system. Similarly, appropriate buildings, forms of transportation, or technology included in natural scenes will give the impression it is placed in the future. Moreover, if a solely natural environment is going to be depicted, making photographs in present-day ecosystems is much more cost-effective, and will lead to similar images. Hence, despite the focus on depicting natural systems, human elements play a vital role in giving them context and meaning.
A crucial component in making the visualizations of natural systems presented in this paper appear realistic is the inclusion of natural patterns and heterogeneity at all relevant scales, ranging from patchiness at the scale of individual plants to landscape patterns driven by feedbacks between biological and geomorphological processes. Ecological complexity models provide a mechanistic basis for describing this heterogeneity, in the form of regular patterns (Klausmeier, 1999; Rietkerk and van de Koppel, 2008), systems with patterns nested within each other at different scales (Liu et al., 2014; van de Vijsel et al., 2023), or even scale-free patterns (Pascual and Guichard, 2005). Moreover, biogeomorphological models can form the basis of fractal-like landscape opography (as is already implemented in landscape-forming modeling systems such as https://www.world-machine.com/), but also provide a guide for the placement of the vegetation. Combining these various forms of self-organization is crucial for generating a landscape that feels realistic both from an aerial perspective and from the perspective of a person experiencing the landscape on foot.
4.2 Counteracting shifting baseline syndrome
Our ecosystem visualization method provides opportunities for counteracting all three causes of SBS (Section 1.1). With its simplest application—images alone, without further information or interactivity—it already provides a means for users to become familiar with natural systems they have not previously been exposed to. Combining the images into a navigable landscape, a VR experience, or a computer game, enables users to interact, at least virtually, with those natural systems. Finally, text boxes, speech bubbles, and audio recordings can all be incorporated into the various types of application to provide additional information, re-introducing to the users lost knowledge of the natural history of the landscape they are experiencing and the stories of those who live in it.
4.3 Engaging societal partners, not just the public
In this paper, we presented a new technology that integrates scientific models of natural landscape evolution with cutting-edge visualization techniques to bring to life past and future landscapes. This method has the potential to improve science communication efforts relating to landscape conservation and restoration, as well as contributing to nature and science education more generally. Although our examples here focused largely on static images, the fact that these are generated via the same platform as animated films and computer games opens up a whole host of opportunities to broaden the output of this method - the visualized landscapes can form the basis for films and games, especially in popular genres like strategy games or first-person exploration.
In the course of our work on these case studies, we have demonstrated our 3D- and VR- visualizations to small groups of various stakeholders. They invariably react with great enthusiasm and amazement, though their takeaways from seeing the actual content vary depending on their interest in the specific case study. Representatives of the Water Board and engineering companies, who are involved in carrying out managed realignment schemes but are not meaningfully impacted by public opinion, see it as nothing more that a bit of fun. Elected decision-makers responsible for controversial de-embankment projects are enthusiastic about the potential of this tool in communicating to voters the desirable outcomes of their policies. Municipalities are interested especially in our app format, as they expect it to draw tourists to areas visualized in the app. Public education and science communication organizations, such as the Geopark Schelde Delta, see so much potential in the visualizations as an educational and science communication tool, that they are actively supporting new visualization projects utilizing this method. In short, those who strive to educate the public about complex ecosystems and how humans interact with them, as well as those who aim to convince the public of the benefits of restoring and preserving such ecosystems, all agree that our visualizations are a highly useful tool in achieving these goals.
For us, as researchers, working on these case studies and other visualization projects has brought about collaboration with colleagues from a far wider range of disciplines than we have ever experienced before. Not only have we needed to approach experts from other sciences, engineering disciplines, and the humanities for their input on specific visualization projects, but as the exposure of our visualizations increases we are approached more and more by researchers interested in collaborating with us. What is more, the use of 3D-visualizations is drawing funding for projects whose practical contributions were previously less clear to funding bodies.
In conclusion, the science-based visualization of self-organizing ecosystems brings great potential for promoting knowledge and understanding of these ecosystems, both in the general public and among non-expert stakeholders, and its use creates opportunities for interdisciplinary collaborations. Our model-to-visual pipeline allows for a flexible working process, from the choice of ecosystem to the form of the final product, making it useful to researchers and stakeholders in a variety of contexts, and allowing for a plethora of output formats to engage audiences of all kinds.
Statements
Data availability statement
The original contributions presented in the study are included in the article/Supplementary material, further inquiries can be directed to the corresponding author.
Author contributions
AH-S: Software, Visualization, Writing – original draft. DS: Visualization, Writing – review & editing. JK: Visualization, Writing – review & editing. Q-XL: Methodology, Resources, Writing – review & editing. JB: Writing – review & editing. RB: Methodology, Software, Writing – review & editing. JK: Conceptualization, Funding acquisition, Methodology, Project administration, Resources, Software, Supervision, Visualization, Writing – original draft, Writing – review & editing.
Funding
The author(s) declare that financial support was received for the research and/or publication of this article. This work was funded by the Royal Netherlands Academy of Science (award no. PSA-SA-E-02) and by the Ministry of Science and Technology of the People's Republic of China (award no. 2016YFE0133700).
Acknowledgments
The authors are grateful to Ulco Glimmerveen for the 3D plant models used in the visualizations.
Conflict of interest
The authors declare that the research was conducted in the absence of any commercial or financial relationships that could be construed as a potential conflict of interest.
Generative AI statement
The author(s) declare that no Gen AI was used in the creation of this manuscript.
Publisher’s note
All claims expressed in this article are solely those of the authors and do not necessarily represent those of their affiliated organizations, or those of the publisher, the editors and the reviewers. Any product that may be evaluated in this article, or claim that may be made by its manufacturer, is not guaranteed or endorsed by the publisher.
Supplementary material
The Supplementary Material for this article can be found online at: https://www.frontiersin.org/articles/10.3389/fclim.2025.1525331/full#supplementary-material
References
1
BishopI. D.LangeE. (2005). Visualization in Landscape and Environmental Planning: Technological and Applications. London: Taylor and Francis. 10.4324/9780203532003
2
BittnerK.BaumgartingerM.SchauppenlehnerT. (2024). Real-time VR landscape visualization for wind farm repowering: a case study in eastern austrian world heritage sites. J. Dig. Landsc. Arch. 9, 366–374. 10.14627/537752033
3
DhainiI.DrekslerB. (2024). Co-creation in immersive virtual reality: insights from a multi-stakeholder planning workshop in jabal moussa biosphere reserve, Lebanon. J. Dig. Landsc. Arch. 9, 10–17. 10.14627/537752002
4
GlavovicB.DawsonR.ChowW.GarschagenM.HaasnootM.SinghC.et al. (2022). “Cross-chapter paper 2: cities and settlements by the sea,” in Climate Change 2022: Impacts, Adaptation and Vulnerability. Contribution of Working Group II to the Sixth Assessment Report of the Intergovernmental Panel on Climate Change (Cambridge, UK and New York, NY, USA: Cambridge University Press), 2163–2194. 10.1017/9781009325844.019
5
KlausmeierC. A. (1999). Regular and irregular patterns in semiarid vegetation. Science284, 1826–1828. 10.1126/science.284.5421.1826
6
LiuQ.-X.HermanP. M. J.MooijW. M.HuismanJ.SchefferM.OlffH.et al. (2014). Pattern formation at multiple spatial scales drives the resilience of mussel bed ecosystems. Nat. Commun. 5:5234. 10.1038/ncomms6234
7
PascualM.GuichardF. (2005). Criticality and disturbance in spatial ecological systems. Trends Ecol. Evol. 20, 88–95. 10.1016/j.tree.2004.11.012
8
PaulyD. (1995). Anecdotes and the shifting baseline syndrome of fisheries. Trends Ecol. Evol. 10:430. 10.1016/S0169-5347(00)89171-5
9
RietkerkM.BastiaansenR.BanerjeeS.van de KoppelJ.BaudenaM.DoelmanA. (2021). Evasion of tipping in complex systems through spatial pattern formation. Science374:eabj0359. 10.1126/science.abj0359
10
RietkerkM.DekkerS. C.WassenM. J.VerkroostA. W. M.BierkensM. F. P. (2004). A putative mechanism for bog patterning. Am. Nat. 163, 699–708. 10.1086/383065
11
RietkerkM.van de KoppelJ. (2008). Regular pattern formation in real ecosystems. Trends Ecol. Evol. 23, 169–175. 10.1016/j.tree.2007.10.013
12
SogaM.GastonK. J. (2018). Shifting baseline syndrome: causes, consequences, and implications. Front. Ecol. Environ. 16, 222–230. 10.1002/fee.1794
13
TarnitaC. E.BonachelaJ. A.ShefferE.GuytonJ. A.CoverdaleT. C.LongR. A.et al. (2017). A theoretical foundation for multi-scale regular vegetation patterns. Nature541, 398–401. 10.1038/nature20801
14
TemmermanS.MeireP.BoumaT. J.HermanP. M. J.YsebaertT.De VriendH. J. (2013). Ecosystem-based coastal defence in the face of global change. Nature504, 79–83. 10.1038/nature12859
15
van de KoppelJ.RietkerkM. (2004). Spatial interactions and resilience in arid ecosystems. Am. Nat. 163, 113–121. 10.1086/380571
16
van de VijselR. C.van BelzenJ.BoumaT. J.van der WalD.BorsjeB. W.TemmermanS.et al. (2023). Vegetation controls on channel network complexity in coastal wetlands. Nat. Commun. 14:7158. 10.1038/s41467-023-42731-3
17
van der KaadenA.-S.MohnC.GerkemaT.MaierS. R.de FroeE.van de KoppelJ.et al. (2021). Feedbacks between hydrodynamics and cold-water coral mound development. Deep Sea Res. Part I: 178:103641. 10.1016/j.dsr.2021.103641
18
WuytsB.ChampneysA. R.VerschuerenN.HouseJ. I. (2019). Tropical tree cover in a heterogeneous environment: a reaction-diffusion model. PLoS ONE14:e0218151. 10.1371/journal.pone.0218151
19
ZhaoL.-X.XuC.GeZ.-M.van de KoppelJ.LiuQ.-X. (2019). The shaping role of self-organization: Linking vegetation patterning, plant traits and ecosystem functioning. Proc. R. Soc. B Biol. Sci. 286:20182859. 10.1098/rspb.2018.2859
20
ZhaoL.-X.ZhangK.SiteurK.LiX.-Z.LiuQ.-X.van de KoppelJ. (2021). Fairy circles reveal the resilience of self-organized salt marshes. Sci. Adv. 7:eabe1100. 10.1126/sciadv.abe1100
Summary
Keywords
3D-visualization, salt marsh, shifting baselines, sea level rise, computer graphics, science communication
Citation
Hillen-Schiller AJ, Steijvers D, de Kok JC, Liu Q-X, van Belzen J, Bidarra R and van de Koppel J (2025) Using photorealistic 3D visualization to convey ecosystem restoration to the public. Front. Clim. 7:1525331. doi: 10.3389/fclim.2025.1525331
Received
09 November 2024
Accepted
09 April 2025
Published
15 May 2025
Volume
7 - 2025
Edited by
Reide Corbett, East Carolina University, United States
Reviewed by
Andrew Lovett, University of East Anglia, United Kingdom
Cathy Cole, Centre for Alternative Technology, United Kingdom
Updates
Copyright
© 2025 Hillen-Schiller, Steijvers, de Kok, Liu, van Belzen, Bidarra and van de Koppel.
This is an open-access article distributed under the terms of the Creative Commons Attribution License (CC BY). The use, distribution or reproduction in other forums is permitted, provided the original author(s) and the copyright owner(s) are credited and that the original publication in this journal is cited, in accordance with accepted academic practice. No use, distribution or reproduction is permitted which does not comply with these terms.
*Correspondence: Johan van de Koppel Johan.van.de.Koppel@nioz.nl
†Present address: Abigail J. Hillen-Schiller, Department of Physical Geography, University of Utrecht, Utrecht, Netherlands
Disclaimer
All claims expressed in this article are solely those of the authors and do not necessarily represent those of their affiliated organizations, or those of the publisher, the editors and the reviewers. Any product that may be evaluated in this article or claim that may be made by its manufacturer is not guaranteed or endorsed by the publisher.