- 1Disaster Prevention Research Institute, Kyoto University, Kyoto, Japan
- 2Research Center for Climate and Atmosphere, National Research and Innovation Agency, Bandung, Indonesia
- 3Department of Computer Engineering, School of Electrical Engineering, Telkom University, Bandung, Indonesia
This study investigates the characteristics and future projections of warm rain during the winter monsoon (December–February; DJF) over the western part of the Java Sea (WJS), Indonesia, using satellite observations (TRMM), reanalysis data (ERA5), and model simulations (Atmospheric General Circulation Model; AGCM). The WJS, influenced by winter monsoon, experiences increased Sea Surface Temperatures (SST), which play a significant role in atmospheric dynamics and precipitation. Analysis of ERA5 data from 1950 to 2009 indicates a significant upward trend in SST for both the Indonesian region (slope 0.0070°C/yr) and the WJS (slope 0.0094°C/yr), with the highest SST increases occurring during DJF. Relating SST and Cloud Liquid Water Content (CLWC) during DJF shows a positive correlation coefficient (R) in the pathway of winter monsoon including the WJS. The R between cloud particles (CLWC, graupel and Cloud Ice Water Content; CIWC) and rainfall during DJF in WJS is higher for CLWC and rainfall which indicates the importance of CLWC. Warm rain processes, driven by CLWC, are evident, as TRMM observations of shallow rainfall align with CLWC spatial distributions. AGCM simulations successfully replicate the observed CLWC patterns, showing strong agreement with TRMM data in the western region of Indonesia including WJS. The study also compares low-level convergence patterns from ERA5 and AGCM data at 925 hPa, revealing similar trends in WJS, where convergence facilitates CLWC formation. The analysis of CLWC percentiles at an average of 1,000–700 hPa highlights a significant increase in CLWC over the pathway of winter monsoon, including the WJS, during DJF across 30-year intervals. The trends of CLWC for the Indonesia area and WJS also demonstrate the increasing value. These findings underscore the critical role of the winter monsoon in shaping warm rain processes in WJS and its implications for extreme weather events, such as flooding in land areas such as Jakarta.
1 Introduction
Warm rain is a critical component of the hydrological cycle, especially in tropical regions, where it is the dominant precipitation mechanism. In the tropics, warm rain accounts for approximately 31% of total rainfall volume and covers 72% of the rain-affected areas (Lau and Wu, 2003). These statistics highlight its pivotal role in shaping tropical hydrology and climate dynamics. Warm rain forms in clouds with temperatures above 0°C through the droplet collision-coalescence process, bypassing the ice-phase Bergeron-Findeisen mechanism (Rogers and Yau, 1989; Tao et al., 2012). Enhanced by high moisture availability and strong updrafts, this process sustains significant rainfall, impacting regional water resources, ecosystems, and weather patterns.
Climate change intensifies atmospheric and oceanic dynamics. According to the Intergovernmental Panel on Climate Change (IPCC, 2013), global sea surface temperatures (SST) have risen by approximately 2°C, coupled with a warming atmosphere with an increasing capacity to hold water vapor by about 7% per 1°C rise, as described by the Clausius-Clapeyron relation. This warming enhances cloud water content (CWC), which includes cloud liquid water content (CLWC) at temperatures above freezing and cloud ice water content (CIWC) at colder altitudes. Additionally, it increases rain liquid water content (RLWC), the liquid-phase component of precipitation derived from CLWC (Lebsock et al., 2008; L’Ecuyer et al., 2009; Suzuki et al., 2011; Zhang et al., 2020). As a result, warm rain events become more frequent, intensifying the hydrological cycle and leading to stronger and more frequent rainfall (Gao et al., 2021). Given the close relationship between CLWC and warm rain formation, this study uses CLWC as a proxy for warm rain occurrence.
Warm rain processes have been categorized into three types by Liu and Zipser (2009), namely isolated events, clouds adjacent to a rain system, and clouds embedded within larger clusters. Investigating these processes requires advanced observational tools, such as The Tropical Rainfall Measuring Mission (TRMM), which uses radar and radiometric sensors to monitor rainfall and cloud phases, including CLWC, graupel, and CIWC. This study employs TRMM data alongside simulations from the Meteorological Research Institute Atmospheric General Circulation Model (MRI-AGCM) to explore changes in warm rain processes through the CLWC, particularly in the Java Sea. The MRI-AGCM has been used to study the future rainfall change by Mizuta et al. (2012), Osakada and Nakakita (2018), and Mori et al. (2021) in Japan and East Asia region. It is a good opportunity to use and validate the MRI-AGCM data in Indonesia region.
The Java Sea, situated between Java, Sumatra, and Borneo, serves as a key region for studying warm rain processes due to its tropical maritime climate and strong monsoonal influences. During the winter monsoon, moist northeasterly winds enhance cloud formation and precipitation over the Java Sea (Chang et al., 2006), contributing significantly to regional water resources while also posing flood risks (Aldrian and Susanto, 2003). Local wind interactions create convergence zones that further intensify rainfall over the Java Sea (Ningsih, 2000; Matsumoto et al., 2017). These convective systems, particularly those developing at night and early morning, often propagate inland toward Jakarta due to land-sea interactions and moisture convergence. Moreover, during the northwest monsoon, prevailing easterly currents in Jakarta Bay can amplify coastal flooding when combined with heavy rainfall and storm tides (Shen et al., 2019; Lee et al., 2020).
Understanding warm rain dynamics is essential for assessing climate change impacts, improving rainfall predictions, and formulating adaptation strategies for regions increasingly vulnerable to extreme weather events. In the context of rising global temperatures, this study aims to investigate the future behavior of warm rain and its dynamics associated with convergence in tropical regions like Indonesia, with a particular focus on the Western Java Sea (WJS).
2 Research location, data, and method
2.1 Research location
The study utilizes a combination of observational data, reanalysis, and model simulations to analyze the characteristics and future projections of warm rain during the winter monsoon in the WJS. The WJS is in the northern part of Jakarta, a major city and former capital of Indonesia, making it a region of significant importance. Jakarta often experiences severe impacts during the winter monsoon due to increased rainfall (Nuryanto et al., 2021). This study focuses on the WJS within the coordinates 106°–110°E longitude and 4°–6°S latitude as shown in Figure 1.
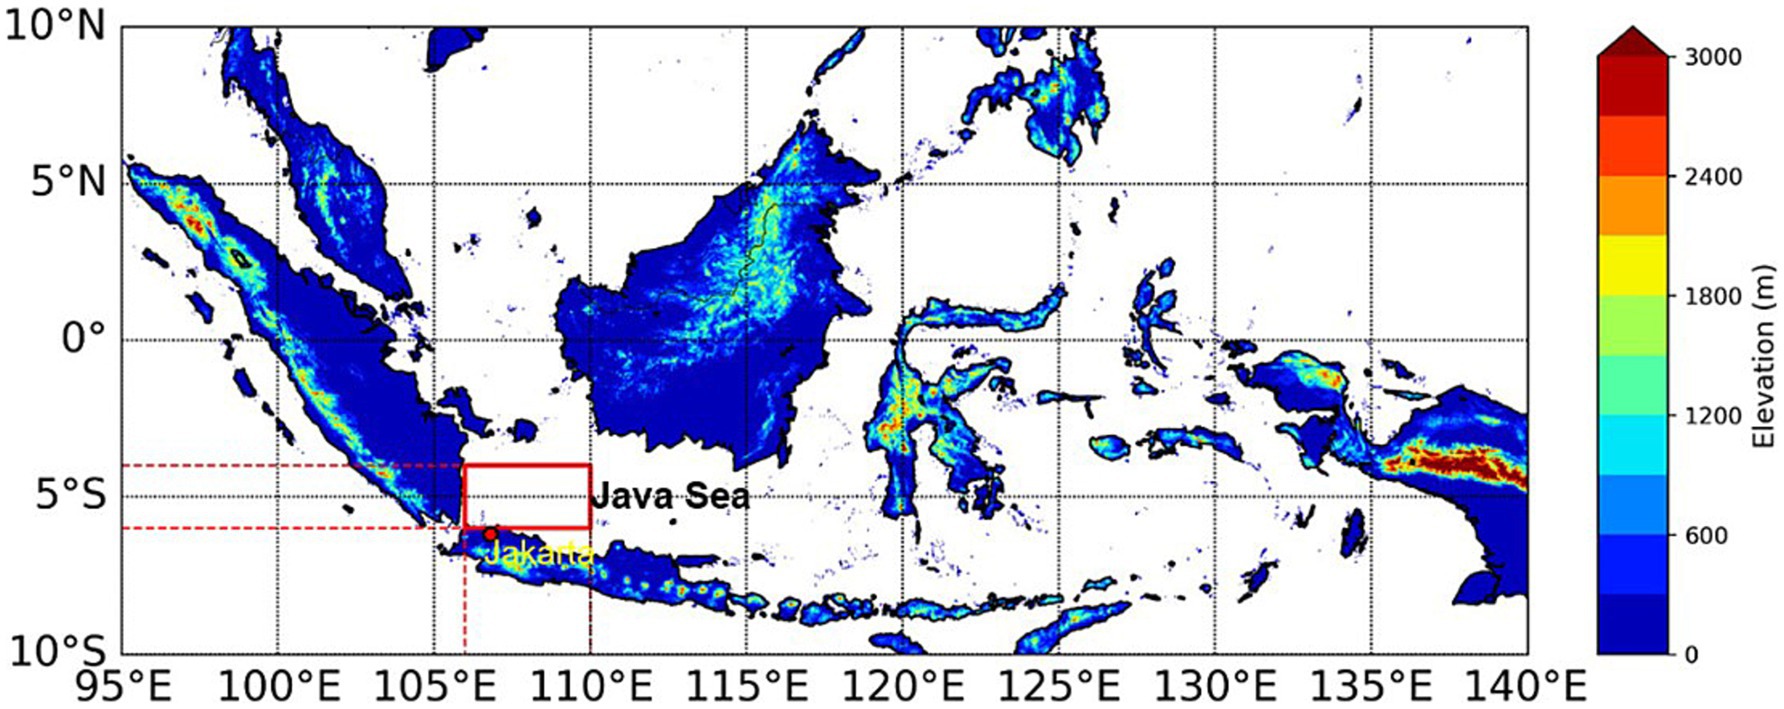
Figure 1. The topographic map of Indonesia highlights the WJS, marked by a red square box (coordinates: 6°S to 4°S, 106°E to 110°E). The red dot is Jakarta.
2.2 Data
2.2.1 ERA5
The SST and convergence data used in this study are from the ERA5 dataset, developed by the European Centre for Medium-Range Weather Forecasts (ECMWF) under the Copernicus Climate Change Service (C3S). The SST data covers 60 years (1950–2009), while the convergence data spans 17 years (1998–2014), calculated from the zonal wind (U) and meridional wind (V) component (Hersbach et al., 2020). The shorter period of U and V is to align with TRMM, otherwise it would be nice to look at onvergence over a longer period, since ERA-5 is available from 1940 to present. ERA5 is a comprehensive global atmospheric reanalysis dataset that provides hourly estimates of a wide range of climate-related variables, encompassing atmospheric, land, and oceanic components. It provides global coverage with a horizontal grid resolution of 0.25° × 0.25° and a daily temporal resolution. The dataset includes 137 vertical levels, extending from the Earth’s surface to an altitude of approximately 80 km. These high-resolution features make ERA5 an invaluable resource for analyzing climate dynamics across various spatial and temporal scales.1
2.2.2 TRMM
This study utilizes data from the TRMM satellite (TRMM, 2011a), a Low Earth Orbit (LEO) satellite designed to operate in tropical and subtropical regions between 35°N and 35°S (Kummerow et al., 1998). Specifically, the study uses the 3A12, 3A11, and 3A25 datasets, covering the period from 1998 to 2014 (17 years). The TRMM 3A12 dataset, derived from the TRMM 2A12 product, utilizes the TRMM Microwave Imager (TMI) sensor to detect various cloud particles, including CLWC, graupel, and CIWC. Additionally, the 3A12 data provides surface precipitation (rainfall) measurements. This dataset provides monthly data with a spatial resolution of 0.5° × 0.5° and 28 vertical layers with an interval ranging from 0.5 to 1 km (TRMM, 2011b). The 3A11 dataset analyzes the melting layer region, offering valuable information about this critical boundary. (TRMM, 2011c). Meanwhile, the 3A25 dataset, derived from the 2A25 product, utilizes radar observations to examine shallow (warm) rainfall (TRMM, 2011d). These datasets collectively provide critical insights into precipitation and cloud characteristics, with TRMM’s observational area encompassing key tropical regions. Users can freely access and download the data from the NASA Goddard Earth Sciences Data and Information Services Center (GES DISC).2
2.2.3 AGCM
The model used in this study is the MRI-AGCM3.2, developed as part of the atmospheric component of the Earth System Model MRI-ESM1 (Yukimoto et al., 2012). MRI-AGCM3.2 builds on the previous version jointly developed by the Japan Meteorological Agency (JMA) and the Meteorological Research Institute (MRI) (Mizuta et al., 2012). It also includes minor updates from MRI-AGCM3.1, which was utilized in earlier 20-km resolution experiments (Kitoh and Kusunoki, 2008). This model features newly developed parameterization schemes for various physical processes designed collaboratively by JMA and MRI. These modular schemes, enable users to switch between updated and conventional implementations. For experiments conducted at a 20-km resolution, the models are designated as MRI-AGCM3.1S and MRI-AGCM3.2S, representing the super-high-resolution configurations. This research focused on CLWC parameters at altitudes between 1,000 and 700 hPa. According to Pruppacher et al. (1998), clouds in global climate model (GCM) simulations are typically assumed to consist entirely of ice at temperatures below approximately −40°C and entirely of liquid at temperatures above 0°C. However, in the tropics, systematic high biases are observed at all levels above 700 hPa (Li et al., 2018). The elevation data resolution for the Indonesian region is 1.25° × 1.25°, and the AGCM dataset provides monthly temporal resolution. Additionally, this study utilizes U and V to calculate convergence (Hersbach et al., 2020). The data can be accessed in the Data Integration and Analysis System (DIAS)3.
2.3 Methodology
The methodology consists of six main components. First, the increase in SST data over Indonesia, including WJS was analyzed using ERA5 reanalysis data. Second, the analysis examined the relationship between SST and CLWC using TRMM data, applying correlation coefficient (R) methods. To resolve the differences in spatial and temporal resolutions between ERA5 SST data and TRMM CLWC data, linear interpolation adjusted the ERA5 data to match the TRMM grid resolution of 0.5° × 0.5°. Additionally, daily data was aggregated to a monthly timescale for consistency. Third, the R-value between warm rainfall and CLWC was investigated using TRMM data. Fourth, the performance of the AGCM was validated by comparing its output with satellite-derived CLWC data for past conditions, utilizing the R-value. Linear interpolation was also used to align the AGCM grid resolution of 1.25° × 1.25° with TRMM data. Since AGCM output includes only total CWC without distinguishing between liquid and ice phases, data below the freezing level (1,000–700 hPa) were used to represent CLWC. Fifth, the linkage between warm rain and atmospheric convergence at 925 hPa during winter monsoon was examined using convergence from the AGCM, along with the convergence value derived from ERA5. Finally, future projections of warm rain were assessed by analyzing AGCM-simulated CLWC data during winter monsoon, focusing on potential increases in warm rain associated with climate change.
3 Results and discussions
3.1 The increasing of SST in Indonesia
Figure 2 shows the spatial distribution of the 30-year climatology of SST around Indonesia, including the WJS region, highlighted by the red rectangle. Figure 2a represents the period 1950–1979, while Figure 2b covers 1980–2009. The analysis indicates a clear pattern of increasing SST across all regions of Indonesia, including the WJS, in 30-year increments. The increasing of SST will enhance moisture capacity as proposed by Clausius–Clapeyron relation, which predicts that the atmosphere’s moisture-holding capacity increases by approximately 7% per 1°C rise in temperature (Martinkova and Kysely, 2020). A warmer atmosphere holds more water vapor, potentially resulting in heavier rainfall during the winter monsoon (Loo et al., 2015; Fahad et al., 2024). The warming trend in the WJS region can have significant implications for atmospheric dynamics, including the increased moisture-holding capacity of the air, which directly affects cloud formation and precipitation processes. These changes may significantly impact regional hydrology and weather patterns, such as increasing the risks of flooding and other climate-related effects, which could affect surrounding areas like Jakarta, located in the coastal region (Xu et al., 2019).

Figure 2. Spatial distribution of SST from ERA5 for the 30-year climatology of (a) 1950–1979 and (b) 1980–2009.
Figure 3 shows the annual and seasonal SST time series for Indonesia and WJS reveals a consistent warming trend across all seasons, with positive linear regression slopes indicating a steady increase in SST over the decades. The annual mean SST trend shows an increase of 0.0061°C/yr for Indonesia and 0.0083°C/yr for WJS, highlighting a slightly faster warming in WJS. Seasonal trends further support this pattern, with the most pronounced warming observed during the DJF period, where SST increases are 0.0070°C/yr for Indonesia and 0.0094°C/yr for WJS. This seasonal peak aligns with the winter monsoon, a critical period for precipitation processes. These consistent SST increases enhance the atmosphere’s moisture-holding capacity, as per the Clausius–Clapeyron relation, which contributes to intensified cloud formation and precipitation processes. The WJS is slightly higher in SST warming compared to the broader Indonesian region, underscoring its sensitivity to climatic and oceanic dynamics, reinforcing the role of rising SSTs in amplifying warm rain and hydrological changes in the region. The highest increase in SST during DJF is very significant to be studied in Indonesian areas, especially in the WJS, due to its impact on this region. For the following analysis we will focus on the DJF to see the effect of the increasing SST. The DJF analysis also considers climate change, as indicated by the observed increase in SST.
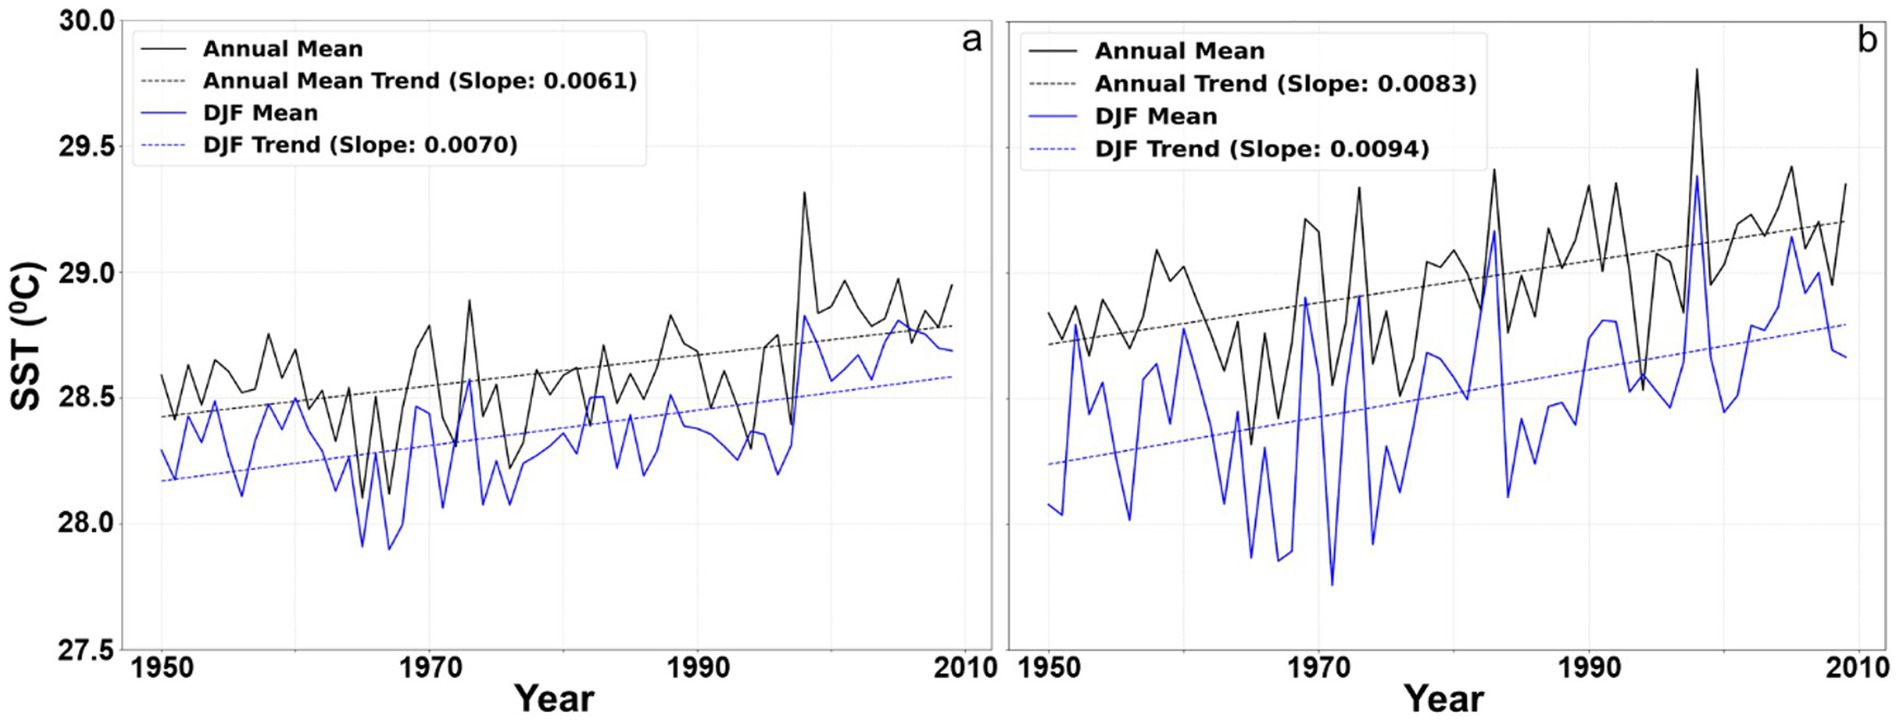
Figure 3. Time series of SST for annual and seasonal climatology in (a) Indonesia and (b) the WJS over 1950–2009 (60 years).
3.2 Cloud particles profile and its correlation to SST and rainfall
The vertical profile of cloud particles over the Indonesian region reveals distinct characteristics of microphysical processes, as shown in Figure 4. CLWC is concentrated primarily below 4 km, with a significant peak near the surface, indicative of warm cloud processes and abundant moisture in the lower troposphere. Li et al. (2013) found that the CLWC is concentrated around 3 km in the East and South China Sea. However, CLWC diminishes rapidly above 4 km as water droplets freeze into ice particles due to decreasing temperatures with altitude. Meanwhile, CIWC dominates the mid to upper troposphere, peaking around 12–14 km. This reflects the formation of ice-phase particles in colder atmospheric layers, driven by convective updrafts that transport moisture upward. CIWC decreases above 16 km, likely due to limited moisture and reduced ice nucleation at higher altitudes.
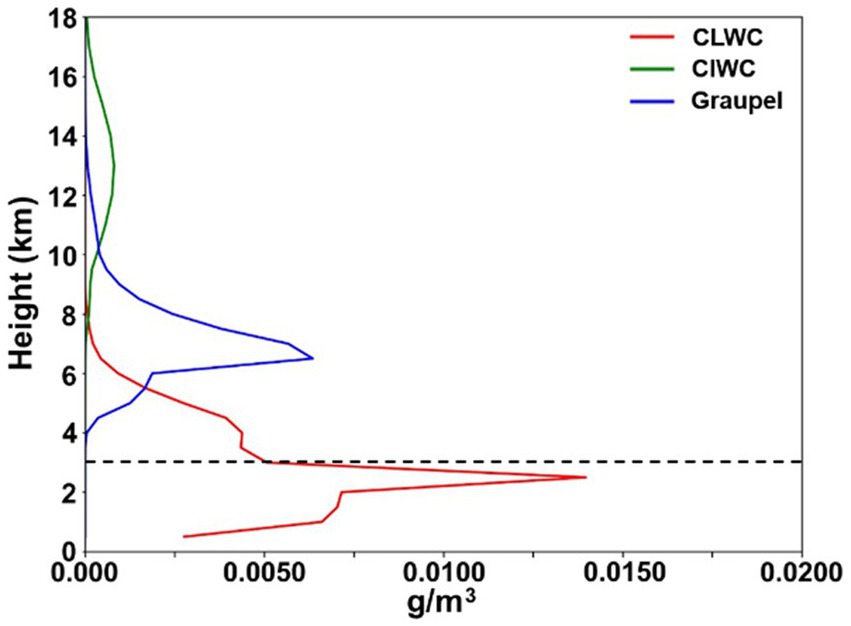
Figure 4. Average values of cloud particles (CLWC, graupel, CIWC) over the Indonesia region from 1998 to 2014.
Graupel, characterized by its formation through riming processes, is prominent between 4 km and 14 km, with a peak concentration around 6–8 km. This range highlights intense convective activity, where supercooled water and ice crystals collide and grow into graupel. As part of warm and moist tropics, the Indonesian region supports vigorous convection, driven by processes such as those associated with the Intertropical Convergence Zone (ITCZ) and mesoscale convective systems (Houze and Churchill, 1987; Emanuel, 1994).
The R between SST and CLWC, calculated for each grid cell every month, reveals complex spatial and seasonal dynamics, particularly over WJS. The annual climatology shows low or negative R values in most monsoon pathways, as seen in Figure 5a. This suggests that as SST increases, the average CLWC at lower levels (0.5–3 km) decreases, likely reflecting the convective nature of precipitation in this tropical region. Warmer SSTs enhance atmospheric instability, leading to deeper convection that facilitates the rapid conversion of CLWC into precipitation or transport to higher altitudes where it transitions into mixed-phase or ice particles. This dynamic results in reduced CLWC at lower levels. The averaging of wet and dry season processes further dilutes the SST-CLWC relationship, contributing to the overall weak R in the annual climatology across the monsoon pathway. In contrast, during the DJF climatology (Figure 5b), a pronounced positive correlation emerges in the northern part of Indonesia, influenced by the winter monsoon. This seasonal shift highlights the role of enhanced SST in driving atmospheric moisture and shallow convection, leading to higher CLWC during DJF. This pattern aligns with previous studies, such as Kodama et al. (2009), who linked warm SSTs to increased warm rain production, and Shah and Srivastava (2019), who reported positive SST-CLWC correlations in the Arabian Sea and central India. While this relationship is held in many regions, the WJS exhibits a weaker correlation, even during DJF. Despite increasing trends in SST and CLWC, the persistently low or negative R values in some parts of WJS suggest additional atmospheric processes at play, such as enhanced precipitation efficiency where cloud liquid water is more effectively converted into precipitation or shifts in cloud microphysics, including transitions from warm to mixed-phase clouds, which may limit CLWC accumulation.

Figure 5. The spatial distribution of R between SST and CLWC at a height of 0.5 -3 km for (a) annual climatology and (b) DJF climatology from 1998 to 2014.
Figure 6 highlights the R between rainfall and three cloud particle types: CLWC, graupel, and CIWC over WJS. Figure 6a demonstrates the highest R between rainfall and CLWC, indicating that CLWC in lower atmospheric layers contributes significantly to rainfall. Zhang et al. (2020) proposed that increasing CLWC leads to increased in rainfall. This strong relationship highlights the dominance of warm rain processes, particularly in tropical regions like Indonesia where abundant moisture and convective activity during winter monsoon drive rainfall formation. The efficient conversion of CLWC into raindrops under warm conditions is a characteristic feature of tropical convective systems. Figure 6b shows a moderate correlation between graupel and rainfall, suggesting the importance of ice-phase processes in influencing precipitation. Graupel forms within convective clouds through riming, where supercooled liquid water freezes upon contact with ice particles, contributing to rainfall through melting as it falls into warmer layers. The role of graupel is particularly significant in mixed-phase clouds where strong updrafts prevail, indicating that it plays a secondary but crucial role in enhancing rainfall. Figure 6c displays the lowest correlation between CIWC and rainfall, which suggests that cloud ice contributes less directly to the rainfall. This weaker relationship likely stems from the fact that ice-phase particles must undergo additional processes, such as melting, to contribute to rainfall. The tropical environment, characterized by a warm and moist atmosphere, often supports warm rain mechanisms, thereby reducing the direct contribution of CIWC. Together, these correlations emphasize that while warm rain processes are dominant, ice-phase particles, particularly graupel, also play a critical role in modulating precipitation (Takahashi, 1976).
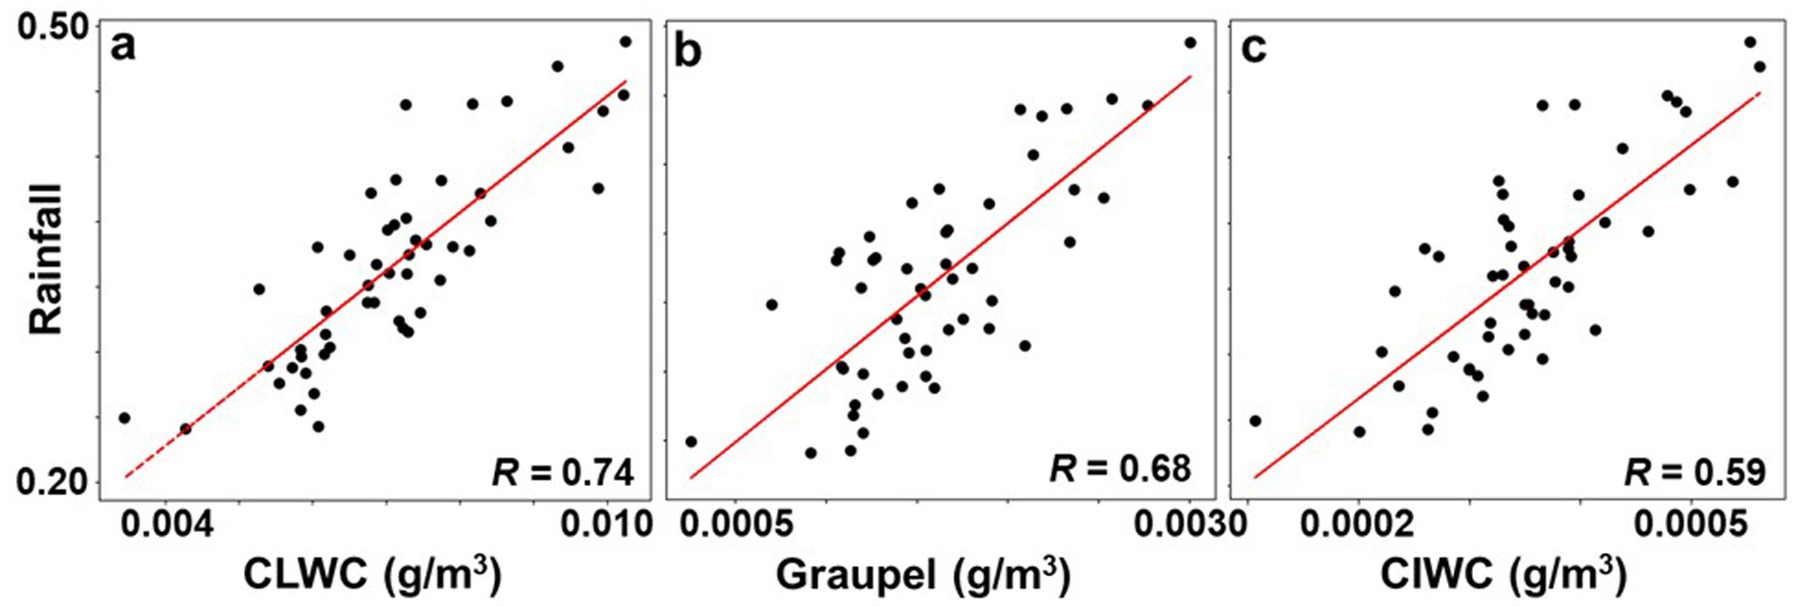
Figure 6. The R between (a) rainfall and CLWC, (b) rainfall and graupel, and (C) rainfall and CIWC during DJF from 1998 to 2014 over WJS.
3.3 Warm rain investigation through CLWC
3.3.1 Freezing level average in Indonesia
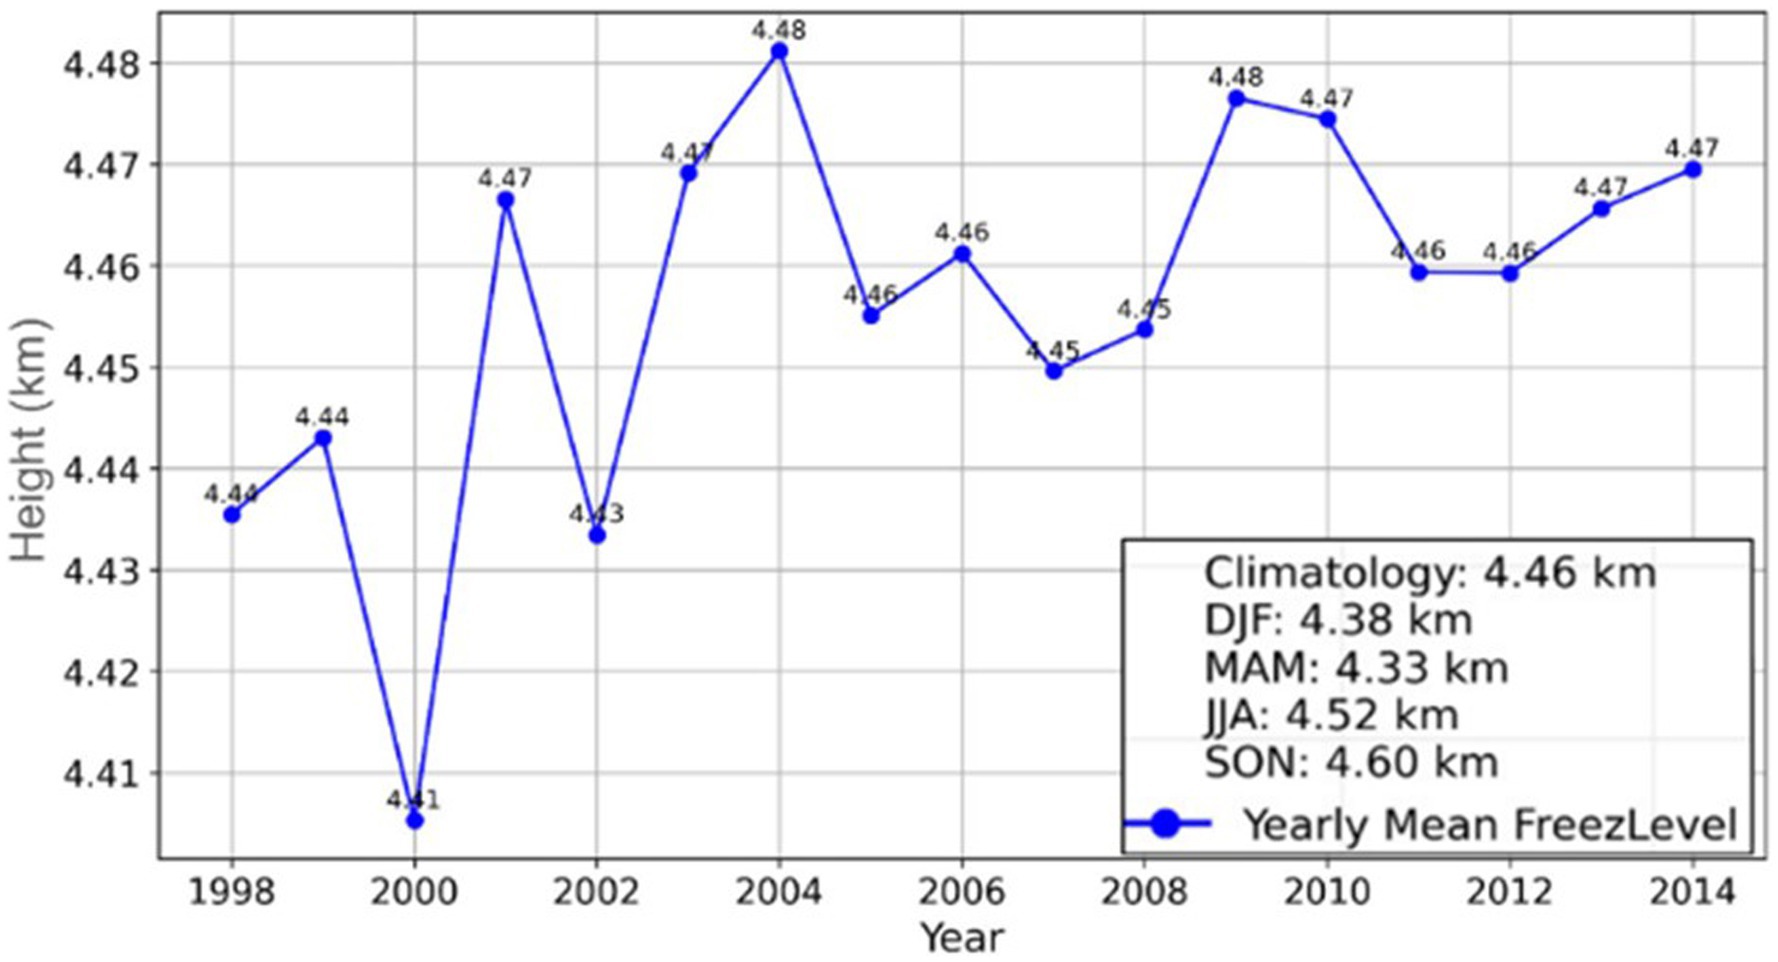
Figure 7 reveals the annual average of the freezing levels observed by TRMM (data set 3A11) from 1998 to 2014 over the Indonesian region for annual and seasonal. It reveals a mean climatological value of 4.46 km, with a range between 4.41 and 4.47 km. Seasonal variability is evident, with the freezing level being notably lower during DJF at 4.38 km, likely due to the winter monsoon’s influence, which brings cooler air masses and increased cloud condensation. Conversely, the freezing level is highest during SON at 4.60 km, followed by JJA at 4.52 km, reflecting warmer atmospheric conditions during these periods. This seasonal fluctuation highlights the dynamic interaction between atmospheric temperature and precipitation processes in Indonesia, where lower freezing levels during DJF enhance warm rain formation by reducing the reliance on the ice-phase process. The melting layer height confirms the pattern shown in Figure 4, where CLWC decreases rapidly at around 4 km. The melting layer height is also a key factor in selecting CLWC data from TRMM and AGCM.
3.3.2 Warm rain investigation through CLWC
We investigate warm rain through a comparison of warm rainfall and CLWC. Warm rainfall refers to precipitation that occurs when radar reflectivity is detected below the freezing level. Figures 8a,b show the spatial distribution of warm rainfall and the average CLWC at heights of 0.5–3 km during DJF from 1998 to 2014, respectively. The results highlight the significant influence of monsoon dynamics on these parameters. During DJF, both warm rainfall and CLWC are more concentrated over maritime regions (black elliptical circle area), aligning with monsoon-driven moisture influx. Figure 8 shows a consistent relationship between warm rainfall and CLWC, as monsoonal circulation enhances cloud development, increases CLWC, and promotes warm rainfall. These findings underscore the critical role of monsoon dynamics in shaping seasonal variations in warm rain and CLWC over the WJS and surrounding regions.

Figure 8. Spatial distribution comparison of (a) warm rainfall and (b) average CLWC at height 0.5–3 km from 1998 to 2014 for DJF. Black elliptical circle indicates the monsoonal pathway.
3.4 Validating the output AGCM using satellite observation
3.4.1 Vertical profile comparison
A comparison of the average vertical profiles of CLWC/CIWC from TRMM and CWC from AGCM over the Indonesia region for 1998–2014 is shown in Figure 9a (annual climatology) and Figure 9b (DJF climatology). The figures highlight similarities and differences in the representation of cloud microphysics. Annual climatology indicates that the TRMM satellite captures both CLWC and CIWC, while the AGCM primarily simulates total CWC (the sum of CLWC and CIWC), which tends to be overestimated in the lower atmosphere (1000–700 hPa) compared to TRMM observations. TRMM CLWC is concentrated at lower altitudes, while AGCM exhibits higher CWC values throughout the vertical column. Focusing on the lower part of the atmosphere, at heights of 1,000–700 hPa (approximately 0–3 km), indicates that both datasets align well for CLWC, with TRMM offering more detailed differentiation between liquid and ice phases.
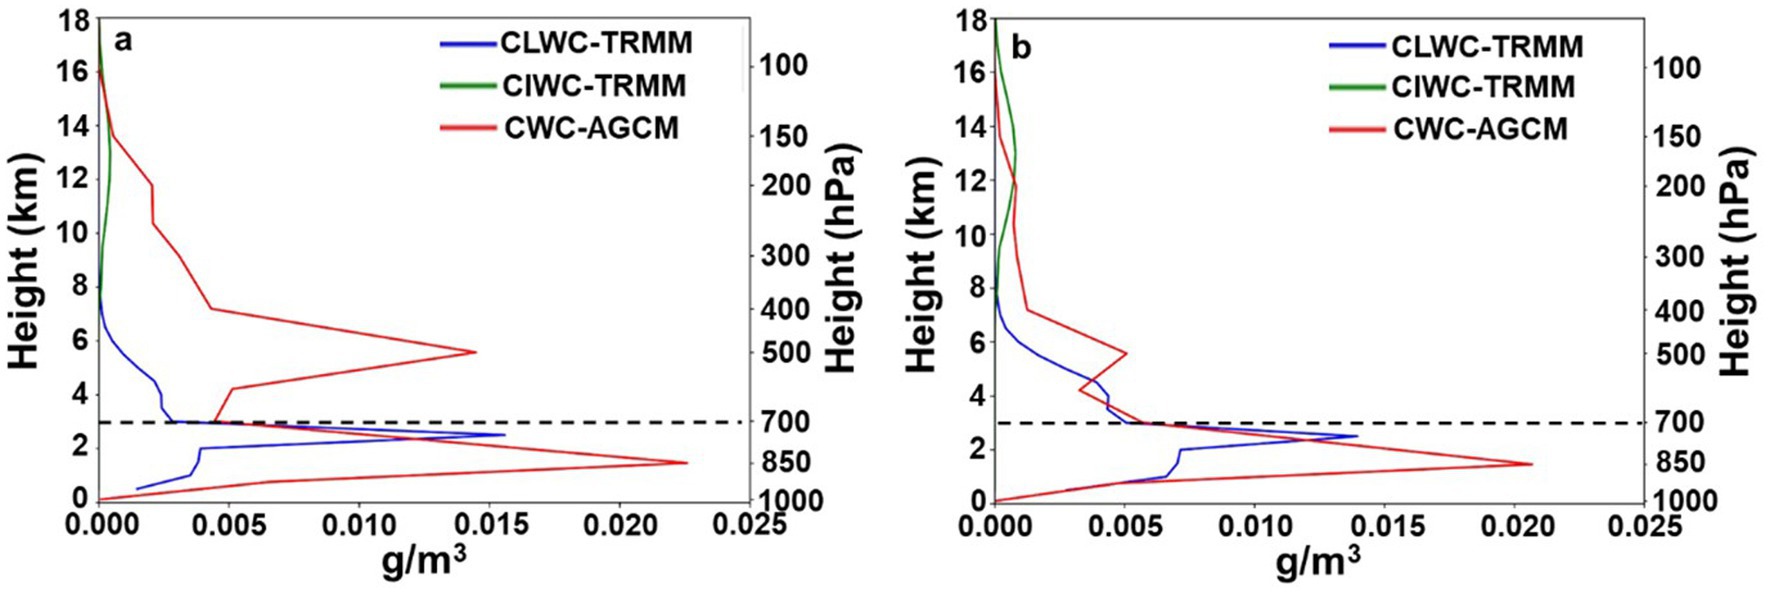
Figure 9. Comparison of the average vertical profiles of CWC, including CLWC and CIWC, between TRMM and AGCM from 1998 to 2014 for (a) annual climatology and (b) DJF climatology over the Indonesia region.
3.4.2 Correlation coefficient of CLWC distribution
The R between CLWC observed by the TRMM satellite and CLWC simulated by the AGCM, as shown in Figure 10, is calculated for each grid cell every month and reveals notable seasonal and annual variations. For annual climatology, higher correlations are observed in the northern parts of Indonesia, where atmospheric dynamics are simpler, allowing better agreement between AGCM and TRMM data. Seasonally, the DJF period demonstrates the strongest correlations, particularly over maritime regions, as the AGCM effectively simulates CLWC during DJF when atmospheric moisture is abundant. Moreover, while the AGCM performs better under stable monsoonal conditions, as seen in DJF, the lower correlations in eastern Indonesia highlight its limitations, suggesting that the model is more effective in the more humid western regions during the winter monsoon.

Figure 10. The spatial distribution of R between CLWC from TRMM and CLWC from AGCM at a height of 1,000–700 hPa for (a) annual climatology and (b) DJF climatology during 1998–2014.
3.5 Investigating warm rain due to convergence during DJF
Figure 11 illustrates the 17-years (1998–2014) average distribution of convergence (divergence) indicated by negative (positive) value at 925 hPa from the ERA5 dataset (Figure 11a) and the AGCM model (Figure 11b), as well as the CLWC at 850 hPa observed by TRMM (Figure 11c) over Indonesia during DJF. The ERA5 and AGCM outputs show similar convergence patterns in the northern and western parts of Indonesia, with notable activity over WJS and areas near Western Sumatra. However, the AGCM model tends to overestimate convergence values compared to ERA5, especially over the WJS, indicating a potential bias in the model’s sensitivity to atmospheric dynamics.

Figure 11. Convergence (divergence) is indicated as negative (positive) by (a) ERA5 reanalysis, (b) AGCM, and (c) CLWC from TRMM during the DJF for the period 1998–2014 at 925 hPa.
The relationship between convergence and CLWC is evident when comparing the convergence outputs to the CLWC from TRMM (Figure 11c). Regions such as Western Sumatra and WJS display a strong alignment, suggesting that areas of high convergence are associated with increased CLWC. This indicates that convergence plays a critical role in cloud development and precipitation formation in these areas. However, some regions show discrepancies in distribution, potentially due to differing atmospheric dynamics or limitations in capturing local-scale processes. Furthermore, these differences could be attributed to the varying spatial resolutions, as the AGCM’s larger grid size may struggle to capture finer local-scale processes. These results suggest that convergence at 925 hPa has some influence on CLWC in the WJS, but the weak correlation indicates it may not play a significant role in driving warm rain formation during DJF. According to Compo et al. (1999) and Chang et al. (2005), cold surges during DJF often enhance atmospheric instability over the South China Sea, particularly in the region north of Borneo and along the Indo-China coast, due to intense low-level wind convergence at their leading edge. This low-level convergence also influences WJS, where it can increase precipitation, potentially affecting regional weather patterns and maritime conditions.
Overall, the similarities between ERA5 and AGCM in identifying key regions of convergence highlight the reliability of the model in capturing large-scale patterns. However, the AGCM’s tendency to overestimate convergence values indicates the need for further refinement to enhance its accuracy. This is especially crucial in the dynamic atmospheric conditions of Indonesia, where accurately representing convergence is vital for understanding cloud processes and rainfall distribution. It should be noted that this study provides only a brief exploration of convergence during DJF, focusing on whether convergence or divergence dominates and examining the intensity of convergence. A more detailed investigation, utilizing data with higher temporal and spatial resolution, is necessary to gain a deeper understanding of convergence in the WJS.
3.6 Future projection of warm rain
This part investigates the future changes in warm rain by analyzing the spatial and temporal distribution of extreme CLWC values using model projections of AGCM. The focus is on understanding the potential increase in the 95th percentile (P95) of CLWC distribution under future climate scenarios. Figure 12 illustrates the temporal evolution of extreme CLWC values P95 during the DJF period from 1950 to 2099 at 30-year intervals, averaged over heights of 1,000–700 hPa, focusing on the western part of Indonesia, including the WJS. The results reveal a consistent increase in extreme CLWC values over time, particularly in WJS. From 1950–1979 (Figure 12a) to 2070–2099 (Figure 12e), the intensity of CLWC extremes becomes progressively stronger, reflecting the influence of warming temperatures and enhanced atmospheric moisture during DJF. This trend highlights the significant role of the winter monsoon in amplifying CLWC values in this region. The increased moisture availability due to rising SSTs and stronger monsoonal dynamics leads to more intense warm rain processes, as indicated by CLWC.
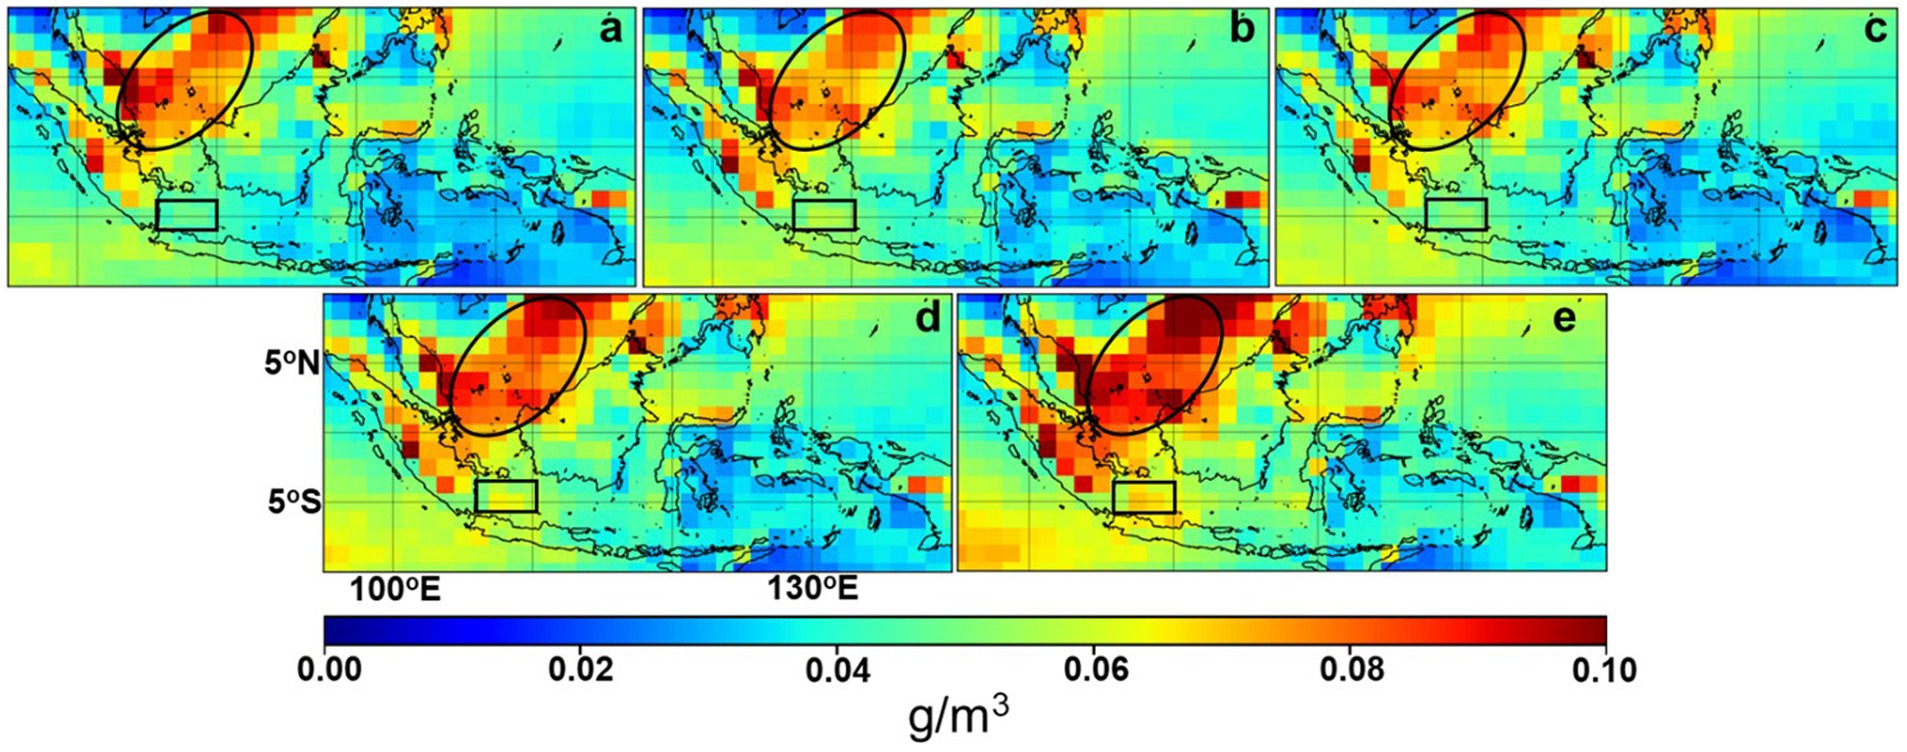
Figure 12. Temporal evolution of extreme CLWC values (95th percentile) at height 1,000–700 hPa during the DJF period from 1950 to 2099, shown at 30-year intervals: (a) 1950–1979, (b) 1980–2009, (c) 2010–2039, (d) 2040–2069, and (e) 2070–2099.
Figure 13 illustrates the increasing trend of extreme CLWC values (P95) over 150 years (1950–2099) at the 1,000–700 hPa pressure level, based on output from an AGCM. Two regions are represented, the Indonesia area (R1; red dots and trendline) and the WJS area (R2; blue crosses and trendline). Both regions show a consistent positive trend in CLWC over time, indicating a long-term increase. The slopes of the trendlines reveal a slightly steeper increase for the Indonesia area (0.00007182 g/m3 per year) compared to the WJS (0.00004988 g/m3 per year), suggesting regional differences in the rate of cloud water accumulation.
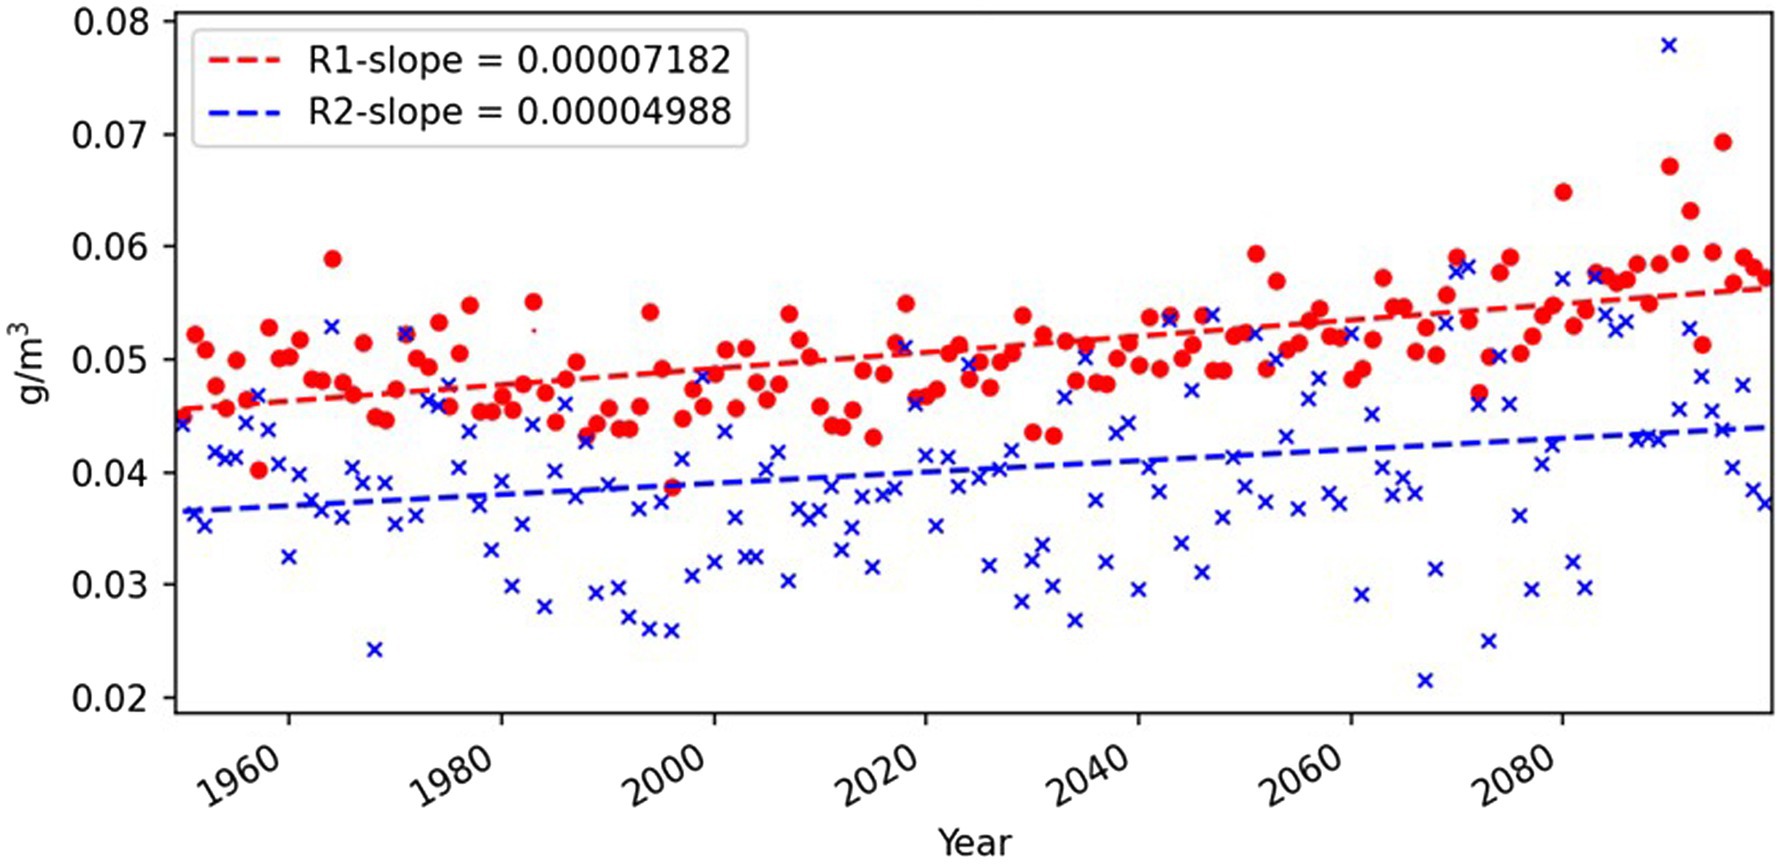
Figure 13. Time series and trendline of extreme CLWC values (95th percentile) during the DJF period from 1950 to 2099, averaged over Indonesia (R1; red dots and red dashed line) and WJS (R2; blue crosses and blue dashed line).
The stronger trend in the Indonesia area may be attributed to its geographical location near the equator, where convection and moisture convergence are more intense. In contrast, the WJS area shows a slightly weaker trend, possibly reflecting its relatively smaller influence from equatorial dynamics or local atmospheric conditions. This regional variability highlights the importance of local climate factors in shaping CLWC trends, which could be linked to broader climate change phenomena, such as increasing SST and changes in atmospheric circulation patterns. These increasing trends in CLWC have significant implications for future climate and weather in both regions. Enhanced CLWC may lead to more frequent and intense precipitation events, particularly over the Indonesia area, with the WJS and its surrounding regions being especially vulnerable, highlighting a heightened risk of extreme precipitation events in the future. This underscores the urgent need for improved climate adaptation strategies to mitigate the impacts of intensifying warm rain extremes in the region.
4 Conclusion
This study highlights the critical role of the winter monsoon in shaping warm rain processes over WJS, Indonesia, by leveraging TRMM satellite observations, ERA5 reanalysis data, and AGCM model simulations. The results reveal a significant upward trend in SST in the WJS and broader Indonesian region, with the highest increases occurring during the DJF period. This warming drives enhanced atmospheric dynamics, as evidenced by positive correlations between SST and CLWC, emphasizing the importance of CLWC as a proxy for warm rain processes. By serving as an indicator of liquid-phase precipitation development, CLWC provides critical insights into the mechanisms driving warm rain formation in the region.
Warm rain is identified as the dominant precipitation mechanism in the WJS, as evidenced by the alignment of warm rainfall patterns from TRMM observations with the spatial distribution of CLWC. AGCM simulations show strong consistency with TRMM data and ERA5 reanalysis, particularly in capturing low-level convergence patterns that promote CLWC formation. Analysis of CLWC percentiles at lower atmospheric levels (1,000–700 hPa) reveals a significant increase in CLWC over 30-year intervals along the winter monsoon pathway in Indonesia. Moreover, a 150-year trend indicates that CLWC will continue to increase in this region during DJF, reflecting the intensification of warm rain processes driven by the winter monsoon.
These findings underscore the potential for more frequent and intense precipitation events in the WJS and surrounding regions, raising concerns about extreme weather impacts, such as flooding in adjacent land areas like Jakarta. The study underscores the urgency of developing effective climate adaptation strategies to mitigate the risks associated with intensifying warm rain extremes in the region.
Data availability statement
The datasets presented in this study can be found in online repositories. The names of the repository/repositories and accession number(s) can be found in the article/supplementary material.
Author contributions
WH: Data curation, Formal analysis, Methodology, Visualization, Writing – original draft, Writing – review & editing. EN: Conceptualization, Formal analysis, Funding acquisition, Supervision, Writing – review & editing.
Funding
The author(s) declare that financial support was received for the research and/or publication of this article. This work was supported by MEXT-Program for the advanced studies of climate change projection (SENTAN) Grant Number JPMXD0722678534 and the SENTAN program, DPRI, Kyoto University.
Acknowledgments
We would like to sincerely express our deepest gratitude to Prof. Tetsuya Takemi for his generous support in securing the funding for this research. We are also truly grateful to Prof. Nobuhito Mori, Prof. Kosei Yamaguchi, and Assist. Prof. Yukari Naka for their valuable discussions and insightful suggestions throughout the course of this work. Special thanks are also extended to Mr. Risyanto, M.Sc., and Ms. Elfira Saufina, M.Si., for their kind assistance and support during the research process.
Conflict of interest
The authors declare that the research was conducted in the absence of any commercial or financial relationships that could be construed as a potential conflict of interest.
Generative AI statement
The author(s) declare that no Gen AI was used in the creation of this manuscript.
Publisher’s note
All claims expressed in this article are solely those of the authors and do not necessarily represent those of their affiliated organizations, or those of the publisher, the editors and the reviewers. Any product that may be evaluated in this article, or claim that may be made by its manufacturer, is not guaranteed or endorsed by the publisher.
Footnotes
1. ^https://www.ecmwf.int/en/forecasts/dataset/ecmwf-reanalysis-v5
2. ^https://disc.gsfc.nasa.gov/
3. ^https://data.diasjp.net/dl/storages/filelist/dataset:650
References
Aldrian, E., and Susanto, R. D. (2003). Identification of three dominant rainfall regions within Indonesia and their relationship to sea surface temperature. Int. J. Climatol. 23, 1435–1452. doi: 10.1002/joc.950
Chang, C. P., Wang, Z., McBride, J., and Liu, C. H. (2005). Annual cycle of Southeast Asia—maritime continent rainfall and the asymmetric monsoon transition. J. Clim. 18, 287–301. doi: 10.1175/JCLI-3257.1
Compo, G. P., Kiladis, G. N., and Webster, P. J. (1999). The horizontal and vertical structure of east Asian winter monsoon pressure surges. Q. J. R. Meteorol. Soc. 125, 29–54. doi: 10.1002/qj.49712555304
Fahad, A. A., Hasan, M., Sharmili, N., Islam, S., Swenson, E. T., and Roxy, M. K. (2024). Climate change quadruples flood-causing extreme monsoon rainfall events in Bangladesh and Northeast India. Q. J. R. Meteorol. Soc. 150, 1267–1287. doi: 10.1002/qj.4645
Gao, W., Xue, L., Liu, L., Lu, C., Yun, Y., and Zhou, W. (2021). A study of the fraction of warm rain in a pre-summer rainfall event over South China. Atmos. Res. 262:105792. doi: 10.1016/j.atmosres.2021.105792
Hersbach, H., Bell, B., Berrisford, P., Hirahara, S., Horányi, A., Muñoz-Sabater, J., et al. (2020). The ERA5 global reanalysis. Q. J. R. Meteorol. Soc. 146, 1999–2049. doi: 10.1002/qj.3803
Houze, R. A., and Churchill, D. D. (1987). Mesoscale organization and cloud microphysics in a bay of Bengal depression. J. Atmos. Sci. 44, 1845–1868. doi: 10.1175/1520-0469(1987)044<1845:MOACMI>2.0.CO;2
IPCC (2013). Climate change 2013: The physical science basis. Contribution of working group I to the fourth assessment report of the intergovernmental panel on climate change, chapter 2. Cambridge: Cambridge University Press
Kitoh, A., and Kusunoki, S. (2008). East Asian summer monsoon simulation by a 20-km mesh AGCM. Clim. Dyn. 31, 389–401. doi: 10.1007/s00382-007-0285-2
Kodama, Y. M., Katsumata, M., Mori, S., Satoh, S., Hirose, Y., and Ueda, H. (2009). Climatology of warm rain and associated latent heating derived from TRMM PR observations. J. Clim. 22, 4908–4929. doi: 10.1175/2009JCLI2575.1
Kummerow, C., Barnes, W., Kozu, T., Shiue, J., and Simpson, J. (1998). The tropical rainfall measuring mission (TRMM) sensor package. J. Atmos. Ocean. Technol. 15, 809–817. doi: 10.1175/1520-0426(1998)015<0809:TTRMMT>2.0.CO;2
L’Ecuyer, T. S., Berg, W., Haynes, J., Lebsock, M., and Takemura, T. (2009). Global observations of aerosol impacts on precipitation occurrence in warm maritime clouds. J. Geophys. Res. Atmos. 114:273. doi: 10.1029/2008JD011273
Lau, K. M., and Wu, H. T. (2003). Warm rain processes over tropical oceans and climate implications. Geophys. Res. Lett. 30:567. doi: 10.1029/2003GL018567
Lebsock, M. D., Stephens, G. L., and Kummerow, C. (2008). Multisensor satellite observations of aerosol effects on warm clouds. J. Geophys. Res. Atmos. 113:929. doi: 10.1029/2008JD009929
Lee, S., Kang, T., Sun, D., and Park, J. J. (2020). Enhancing an analysis method of compound flooding in coastal areas by linking flow simulation models of coasts and watershed. Sustain. For. 12:6527. doi: 10.3390/su12166572
Li, J. F., Lee, S., Ma, H. Y., Stephens, G., and Guan, B. (2018). Assessment of the cloud liquid water from climate models and reanalysis using satellite observations. Terr. Atmos. Ocean. Sci. 29, 653–678. doi: 10.3319/TAO.2018.07.04.01
Li, J., Yang, C., Li, F., He, Q., and Li, W. (2013). A comparison of summer precipitation structures over the South China Sea and the East China Sea based on tropical rainfall measurement mission. Acta Oceanol. Sin. 32, 41–49. doi: 10.1007/s13131-013-0376-3
Liu, C., and Zipser, E. J. (2009). “Warm rain” in the tropics: seasonal and regional distributions based on 9 yr of TRMM data. J. Clim. 22, 767–779. doi: 10.1175/2008JCLI2641.1
Loo, Y. Y., Billa, L., and Singh, A. (2015). Effect of climate change on seasonal monsoon in Asia and its impact on the variability of monsoon rainfall in Southeast Asia. Geosci. Front. 6, 817–823. doi: 10.1016/j.gsf.2014.02.009
Martinkova, M., and Kysely, J. (2020). Overview of observed Clausius-Clapeyron scaling of extreme precipitation in midlatitudes. Atmos. 11:786. doi: 10.3390/atmos11080786
Matsumoto, J., Wang, B., Wu, G., Li, J., Wu, P., Hattori, M., et al. (2017). “An overview of the Asian monsoon years 2007−2012 (AMY) and multi-scale interactions in the extreme rainfall events over the Indonesian maritime continent,” in The Global Monsoon System: Research and Forecast. eds. C.-P. Chang, S. Mori, M. D. Yamanaka, S. Y. Ogino, H. Jun-Ichi, and F. Syamsudin (Singapore: World Scientific), 365–385.
Mizuta, R., Yoshimura, H., Murakami, H., Matsueda, M., Endo, H., Ose, T., et al. (2012). Climate simulations using MRI-AGCM3.2 with 20-km grid. J. meteor. Soc. Japan 90A, 233–258. doi: 10.2151/jmsj.2012-A12
Mori, N., Takemi, T., Tachikawa, Y., Tatano, H., Shimura, T., Tanaka, T., et al. (2021). Recent nationwide climate change impact assessments of natural hazards in Japan and East Asia. Weather Clim. Extremes 32:100309. doi: 10.1016/j.wace.2021.100309
Ningsih, N. S. (2000). Three-dimensional model for Coastal Ocean circulation and sea floor topography changes: Application to the Java Sea. Kyoto, Japan: Kyoto University.
Nuryanto, D. E., Pawitan, H., Hidayat, R., and Aldrian, E. (2021). The occurrence of the typical mesoscale convective system with a flood-producing storm in the wet season over the greater Jakarta area. Dynamics Atmospheres Oceans 96:101246. doi: 10.1016/j.dynatmoce.2021.101246
Osakada, Y., and Nakakita, E. (2018). Future change of occurrence frequency of Baiu heavy rainfall and its linked atmospheric patterns by multiscale analysis. SOLAIAT 14, 79–85. doi: 10.2151/sola.2018-014
Pruppacher, H. R., Klett, J. D., and Wang, P. K. (1998). Microphysics of clouds and precipitation. Aerosol Sci. Technol. 28, 381–382. doi: 10.1080/02786829808965531
Rogers, R. R., and Yau, M. K. (1989). A short course in cloud physics. Bull. Amer. Meteor. Soc. 45:619.
Shah, R., and Srivastava, R. (2019). Effect of climate change on cloud properties over Arabian Sea and Central India. Pure Appl. Geophys. 176, 2729–2738. doi: 10.1007/s00024-019-02125-3
Shen, Y., Morsy, M. M., Huxley, C., Tahvildari, N., and Goodall, J. L. (2019). Flood risk assessment and increased resilience for coastal urban watersheds under the combined impact of storm tide and heavy rainfall. J. Hydrol. 579:124159. doi: 10.1016/j.jhydrol.2019.124159
Suzuki, K., Stephens, G. L., Van Den Heever, S. C., and Nakajima, T. Y. (2011). Diagnosis of the warm rain process in cloud-resolving models using joint CloudSat and MODIS observations. J. Atmos. Sci. 68, 2655–2670. doi: 10.1175/JAS-D-10-05026.1
Takahashi, T. (1976). Warm rain, giant nuclei and chemical balance—a numerical model. J. Atmos. Sci. 33, 269–286. doi: 10.1175/1520-0469(1976)033<0269:WRGNAC>2.0.CO;2
Tao, W. K., Chen, J. P., Li, Z., Wang, C., and Zhang, C. (2012). Impact of aerosols on convective clouds and precipitation. Rev. Geophys. 50:369. doi: 10.1029/2011RG000369
TRMM (2011a). TRMM microwave imager precipitation profile L3 1 month 0.5 degree x 0.5 degree V7. Greenbelt, MD: Goddard Earth Sciences Data and Information Services Center.
TRMM (2011b). TRMM microwave imager precipitation profile L3 1 month 0.5 degree x 0.5 degree V7, greenbelt, MD, Goddard earth sciences data and information services center (GES DISC). Available online at: https://disc.gsfc.nasa.gov/datacollection/TRMM_3A12_7.html (Accessed August 14, 2024).
TRMM (2011c) TRMM Microwave Imager Oceanic Rainfall L3 1 month 5 degree x 5 degree V7, Greenbelt, MD, Goddard Earth Sciences Data and Information Services Center (GES DISC). Available online at: https://disc.gsfc.nasa.gov/datacollection/TRMM_3A11_7.html (Accessed September 1, 2024).
TRMM (2011d) TRMM radar rainfall statistics L3 1 month (5 x 5) and (0.5 x 0.5) degree V7, greenbelt, MD, Goddard earth sciences data and information services center (GES DISC). Available online at: https://disc.gsfc.nasa.gov/datacollection/TRMM _3A25_7.Html (Accessed October 5, 2024).
Xu, H., Xu, K., Lian, J., and Ma, C. (2019). Compound effects of rainfall and storm tides on coastal flooding risk. Stoch. Environ. Res. Risk Assess. 33, 1249–1261. doi: 10.1007/s00477-019-01695-x
Yukimoto, S., Adachi, Y., Hosaka, M., Sakami, T., Yoshimura, H., Hirabara, M., et al. (2012). A new global climate model of the meteorological research institute: MRI-CGCM3—model description and basic performance—. J. meteorol. Soc. Jpn. 90A, 23–64. doi: 10.2151/jmsj.2012-A02
Zhang, W., Xu, G., Xi, B., Ren, J., Wan, X., Zhou, L., et al. (2020). Comparative study of cloud liquid water and rain liquid water obtained from microwave radiometer and micro rain radar observations over Central China during the monsoon. J. Geophys. Res. Atmos. 125:e2020JD032456. doi: 10.1029/2020JD032456
Keywords: climate change, SST, warm rain, CLWC, TRMM, AGCM
Citation: Harjupa W and Nakakita E (2025) Investigation and future projections of warm rain during the winter monsoon in the Western Java Sea, Indonesia. Front. Clim. 7:1581382. doi: 10.3389/fclim.2025.1581382
Edited by:
Rui Liu, University of Canberra, AustraliaReviewed by:
Erik Swenson, George Mason University, United StatesJason T. Ortegren, University of West Florida, United States
Copyright © 2025 Harjupa and Nakakita. This is an open-access article distributed under the terms of the Creative Commons Attribution License (CC BY). The use, distribution or reproduction in other forums is permitted, provided the original author(s) and the copyright owner(s) are credited and that the original publication in this journal is cited, in accordance with accepted academic practice. No use, distribution or reproduction is permitted which does not comply with these terms.
*Correspondence: Wendi Harjupa, aGFyanVwYS53ZW5kaS42aEBreW90by11LmFjLmpw
 Wendi Harjupa
 Eiichi Nakakita