- 1Africa Centre of Excellence (ACE)-Regional Transport Research and Education Centre Kumasi (TRECK), College of Engineering, Kwame Nkrumah University of Science and Technology, Kumasi, Ghana
- 2Department of Environmental Science, Kwame Nkrumah University of Science and Technology, Kumasi, Ghana
Introduction: Unpaved roads make up 80% of the global road network and 90% in developing countries. In Sierra Leone—one of the world’s most climate-vulnerable nations—secondary unpaved roads account for 96% of the core network, serving as vital links for rural access, markets, and social inclusion. Yet, no structured framework currently guides the management of climate risks to these roads.
Methods: This study reviewed international climate risk and vulnerability assessment frameworks and identified their limited applicability in resource-constrained contexts due to heavy data demands, proprietary software, and high computing requirements. To address this gap, a five-phase, context-specific framework was developed, adapted from the IPCC vulnerability model. The framework employs cost-effective, open-source tech tools (QGIS, QField, PostGIS, cloud storage, and Microsoft Power BI) and integrates index-based, spatial, and stakeholder-driven approaches to generate composite indicators of road condition deficiency, maintenance efficacy, and roads’ criticality.
Results: Application of the framework in Sierra Leone demonstrated its ability to identify climate-vulnerable unpaved road segments and highlight priority areas for adaptation. The framework proved practical under local data and institutional constraints, avoiding reliance on costly proprietary tools or high-end computing infrastructure.
Discussion: Nationally, the framework offers the first structured approach for integrating climate resilience into road management in Sierra Leone, supporting the National Roads Agency. Globally, it contributes a transferable, resource-efficient, and community-driven methodology for embedding climate adaptation into transport planning across the Global South. It aligned with national and international policies (Sierra Leone National Adaptation Plan (NAP), Sierra Leone Nationally Determined Contributions (NDC), UN Sustainable Development Goas (SDGs 9, 11 and 13).
1 Introduction
Over the past four decades, sub-Saharan Africa has experienced more than 1,500 weather-related disasters [Emergency Events Database (EM-DAT), 2023], which have significantly affected its economy and rural livelihoods. Sierra Leone’s tropical climate, characterized by alternating dry and wet seasons, exposes communities to a range of climate-related hazards (World Bank, 2018a). The country’s diverse geography increases the complexity of identifying road vulnerability, with each terrain posing unique challenges under climate stressors. This susceptibility is intensified by the increasing frequency of extreme weather events, such as floods, landslides, droughts, heatwaves, sea-level rise, and storm surges, combined with widespread dependence on natural resources. These factors collectively threaten critical infrastructure, especially road networks (World Bank, 2018b). Climate-related disasters are increasingly damaging road infrastructure through washouts, erosion, and structural failures, resulting in accidents, traffic disruptions, economic losses, and escalating maintenance costs. These impacts underscore the urgent need for vulnerability assessments to support climate-resilient adaptation and mitigation strategies.
Road transport is the dominant mode of transportation in Sierra Leoneaccounting for over 95% of inland passenger and freight movement, and it plays a crucial role in national development, particularly since the railway system was discontinued between 1970 and 1979 (Logistics Cluster, 2019). The country’s 11,300 km road network includes primary (Grade A), secondary (Grade B), and feeder roads (Grade F). Of the 4,044 km core road network (CRN), only 40% is paved, while more than 96% of the remaining network consists of unpaved secondary roads. This imbalance presents significant challenges for road managers, particularly under the combined pressures of climate change, limited data, economic constraints, and climate expertise shortages (United Nations Development Programme, 2021; Nelson et al., 2019).
Given this context, unpaved roads, which account for more than 80% of the global road network (Ngezahayo et al., 2019), are particularly vulnerable to climate-induced damage due to their limited resilience and maintenance. In Sierra Leone, the absence of practical, locally adapted vulnerability assessment tools further exacerbates the problem. Despite their importance, these roads are often overlooked in structured climate risk evaluations, thus revealing a critical research gap in climate-resilient infrastructure planning. This paper addresses that gap by (i) reviewing existing frameworks for climate risk and vulnerability assessment; (ii) proposing a context-specific, cost-effective methodology informed by historical and projected climate data; and (iii) demonstrating the framework’s applicability in identifying unpaved road segments most at risk from climate change. The findings aim to support data-driven planning and decision-making for sustainable road infrastructure management in Sierra Leone.
1.1 Reader’s guide
his paper presents the development and application of a framework for assessing the vulnerability of unpaved roads to climate change in Sierra Leone. Section 1 introduces the study. Section 2 outlines the materials and methods, covering the study area, unpaved road context, data collection and analysis, indicator selection, climate hazards, and the vulnerability assessment framework. Section 3 provides a methodological overview and literature review, including climate risk assessment approaches, vulnerability levels, sensitivity, and exposure of unpaved roads. Section 4 applies the framework through case studies, highlighting its relevance to road agencies. Section 5 presents results from historical weather events, 30-year climate data, and exposure analysis. Section 6 discusses the findings, while Section 7 concludes with practical and policy implications, as well as the study’s strengths and limitations. The final sections cover acknowledgements, author contributions, declaration of interests, and funding information.
2 Materials and methods
2.1 Study area
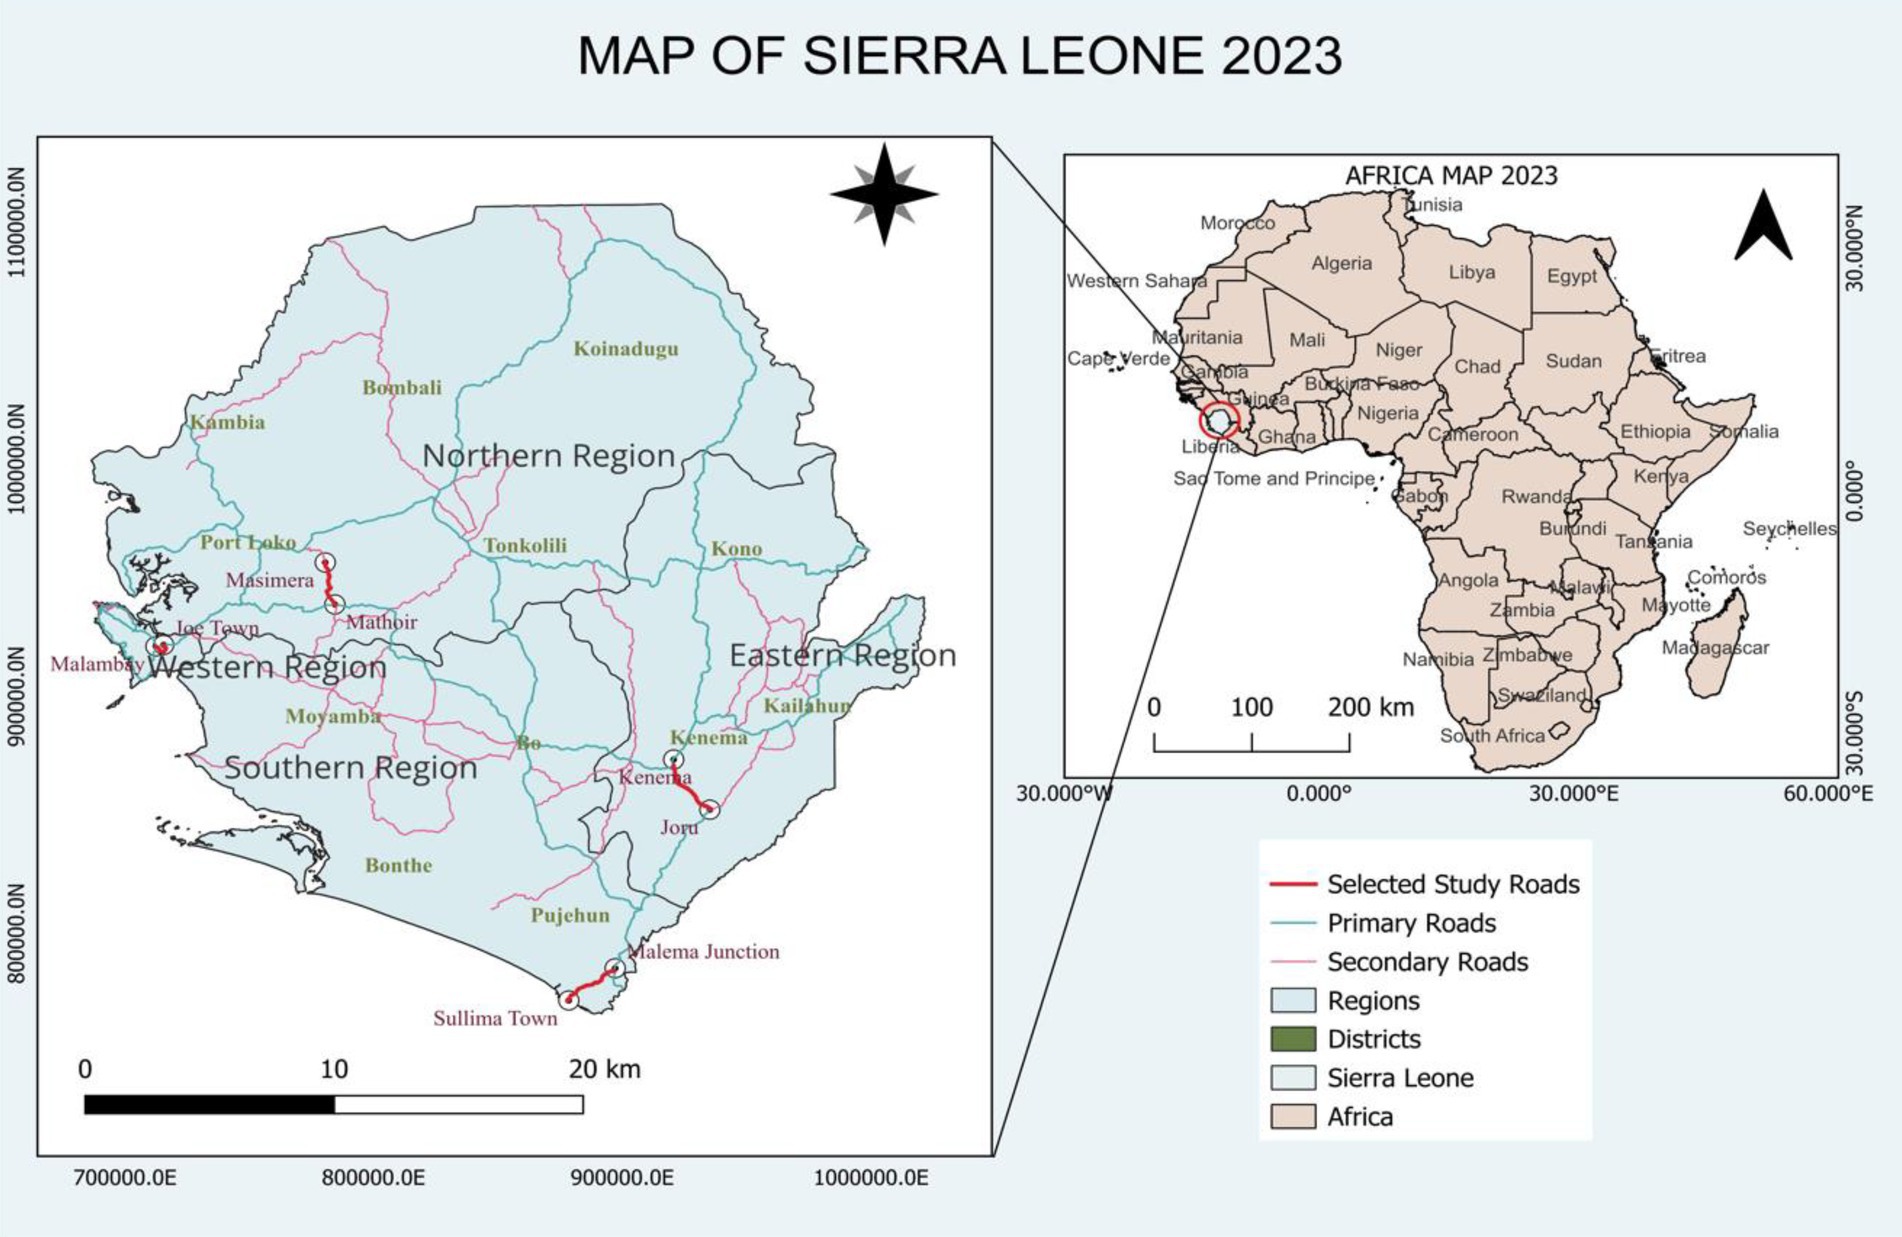
This study focuses on Sierra Leone, located on the west coast of Africa and characterized by a monsoon climate. The country is bordered by Guinea to the north and east, Liberia to the south, and the Atlantic Ocean to the west. It comprises four main geographic zones: interior plains, plateau and mountain regions, coastal marshes, and the Sierra Leone Peninsula [Comité Permanent Inter-états de Lutte contre la Sécheresse dans le Sahel (CILSS), 2016]. The coastal marsh region extends 320 km along the Atlantic Ocean, spanning 8 to 40 km in width, and is prone to flooding due to its sandy and clayey soils (USAID, 2016). The Sierra Leone Peninsula, which includes the capital city Freetown, features a forested mountain range that peaks at 880 m at Picket Hill. Inland, the interior plains encompass the seasonally flooded “Bolilands” in the north and the southern lowlands, characterized by rolling forested terrain and occasional hills exceeding 300 m in elevation (USAID, 2016). Figure 1 presents a map of Sierra Leone and highlights the key road networks, regions, and districts essential for conducting climate risk assessments.
Sierra Leone’s tropical climate, characterized by a rainy season from May to September and a dry season from October to April, has increasingly contributed to weather-related disasters in recent years. Coastal and low-lying roads are particularly vulnerable to deterioration from intense rainfall, particularly in areas along the coast. In contrast, inland regions such as the Peninsula Mountains receive significantly higher annual rainfall (over 5,000 mm) than the north-eastern region (approximately 2,000 mm), which poses different but equally challenging conditions for road resilience (Kamara et al., 2025). To ensure the long-term sustainability of the road infrastructure, climate resilience assessments should prioritize drainage capacity, material durability, and adaptive maintenance strategies.
2.2 Description of unpaved secondary roads in Sierra Leone
This section details the infrastructure’s sector, subsector, technical attributes, connectivity, and interactions with other infrastructure components, as required by a vulnerability assessment framework (Zebisch et al., 2021; Zlateva and Hadjitodorov, 2022). Such information supports a clearer understanding of the unpaved secondary road’s functionality and its potential susceptibility to climate change impacts (Zebisch et al., 2021; Zlateva and Hadjitodorov, 2022). The Sierra Leone Roads Authority (SLRA) is responsible for managing national roads, while the Ministry of Transport and Aviation (MoTA) provides the policy and regulatory framework for transport governance and road safety. Furthermore, the Ministry of Works and Public Assets (MOWPA) oversees policy formulation and implementation for the road and public asset sectors, including infrastructure construction, rehabilitation, and maintenance (Logistics Cluster, 2019).
According to the Sierra Leone Roads Authority (SLRA) road network classification, secondary roads constitute the second tier of the national road network (Padrosa, 2009). They connect district centers, towns, villages, and areas of tourism or agriculture (Bech Padrosa, 2009; Logistics Cluster, 2019). These roads serve as regional arteries that link production and distribution centers, while also functioning as intermediate connectors between primary (Class A) roads and feeder (Class F) roads. They facilitate a considerable volume of medium- and long-distance travel (Bech Padrosa, 2009; Logistics Cluster, 2019). Traffic along these roads typically comprised both through traffic (long-distance travel) and local traffic with origins or destinations nearby [Bech Padrosa, 2009; Research for Community Access Partnership (ReCAP), 2019]. Secondary roads facilitate the movement of passengers and freight by balancing mobility and access. However, conflicting movements such as intersections that require vehicles to slow down or stop may occur (Bech Padrosa, 2009; Logistics Cluster, 2019). Due to inadequate funding, these roads receive limited engineering and maintenance attention, despite their critical socioeconomic role in providing access to high-population centers and supporting economic activities. As a result, they face numerous challenges, which are further exacerbated by extreme weather events. These include frequent washouts, severe erosion, traffic disruptions, increased maintenance costs, fatalities during adverse weather, excessive dust in the dry season, and impassability during the rainy season [Research for Community Access Partnership (ReCAP), 2019].
2.3 Geographical context of unpaved secondary road locations
This section outlines the region’s distinct geographic characteristics, including topography, land use, and climate patterns that may influence the infrastructure’s susceptibility to climate-related hazards. Such contextual understanding informs the adaptation of the proposed framework to address the specific challenges and risks faced by infrastructure in the area, thereby enhancing the precision and relevance of the vulnerability assessment framework (Fleming et al., 2023). Geologically, Sierra Leone consists of the Liberian granite-greenstone terrain and the Kasila Group mobile belt, with diverse soil types such as sandy clay and loam. The country’s dense drainage network, fed by rivers originating in the Fouta Djallon highlands of Guinea, presents significant challenges. Major rivers, including the Great Scarcies, Rokel, and Mano, traverse the national landscape.
Over the past four decades, Sierra Leone has experienced more than 110 weather-related disasters, indicating a concerning climatic trend (Delforge et al., 2023). Analysis on key climate variables, such as rainfall, temperature, wind speed, and relative humidity, revealed consistent upward trends over the past three decades. Furthermore, a near-term point forecast generated using a statistical autoregressive integrated moving average (ARIMA) time series model projected a continued increase in climate change and variability in the coming decades. These findings underscore the importance of evaluating the implications of key climate variables for unpaved secondary roads. Given that erosion is the primary impact factor for unpaved roads (Paige-Green and Verhaeghe, 2018) and considering the region’s relief features and geomorphological, hydrological, and climatological conditions, as well as historical data on natural disasters and recent extreme events, unpaved secondary roads are likely to be increasingly vulnerable to the adverse effects of climate change and variability. Accordingly, the implementation of the proposed framework is of vital importance for mitigating these impacts.
2.4 Data collection and analysis architecture for road vulnerability assessment
This section presents the data collection and analysis architecture developed to assess the vulnerability of unpaved secondary roads in Sierra Leone. The architecture was designed in response to persistent challenges such as data scarcity, limited technical capacity, high proprietary software costs, and infrastructural and financial constraints. It aims to provide a cost-effective, open-source, and practically replicable system that can be integrated into Sierra Leone’s national road management framework. The architecture utilizes a combination of open-source geospatial tools, including QGIS, QField Mobile App, PostGIS, and QFieldCloud, to facilitate Global Positioning System (GPS)-enabled data collection, centralized storage, and real-time collaboration between field teams and office-based analysts. Field assessors collect the necessary data using Android devices, while QFieldCloud allows for synchronization with centralized databases. PostGIS stores geospatial data such as road condition attributes (e.g., potholes, rutting), hazard zones, and infrastructure features (e.g., culverts, ditches) together with environmental and socioeconomic factors. The system replaces traditional paper-based methods and enables segmentation of road stretches into 100-meter intervals for granular vulnerability analysis. Through participatory approaches, the architecture integrates local knowledge, such as previous disruptions caused by climate events, and utilizes a standardized 0–5 rating scale to assess road deficiencies. The results are analyzed and visualized in Microsoft Fabric (Power BI) utilizing a multidimensional road vulnerability index (RVI) model to highlight geographic disparities, support adaptation planning, and inform investment prioritization. Advanced analytics identify high-risk road segments, supporting targeted mitigation and policy actions. This integrated architecture provides a scalable, locally adaptable, and data-driven system for infrastructure resilience planning.
Figure 2 presents the innovative automated platform for collecting field data on road vulnerability. The platform captures geospatial data, including georeferenced road condition attributes (e.g., rutting, potholes, and washouts), mapped survey points, lines, and polygons representing affected segments, and contextual information such as land cover, flood zones, and elevation models. Key GeoPackage layers used in the assessment include road segments (classified by surface type, condition, and vulnerability status), drainage structures (e.g., culverts and ditches with condition data), observation points (geotagged notes and photographs of damage), and hazard zones (e.g., flood-prone, erosion, and landslide risk areas).
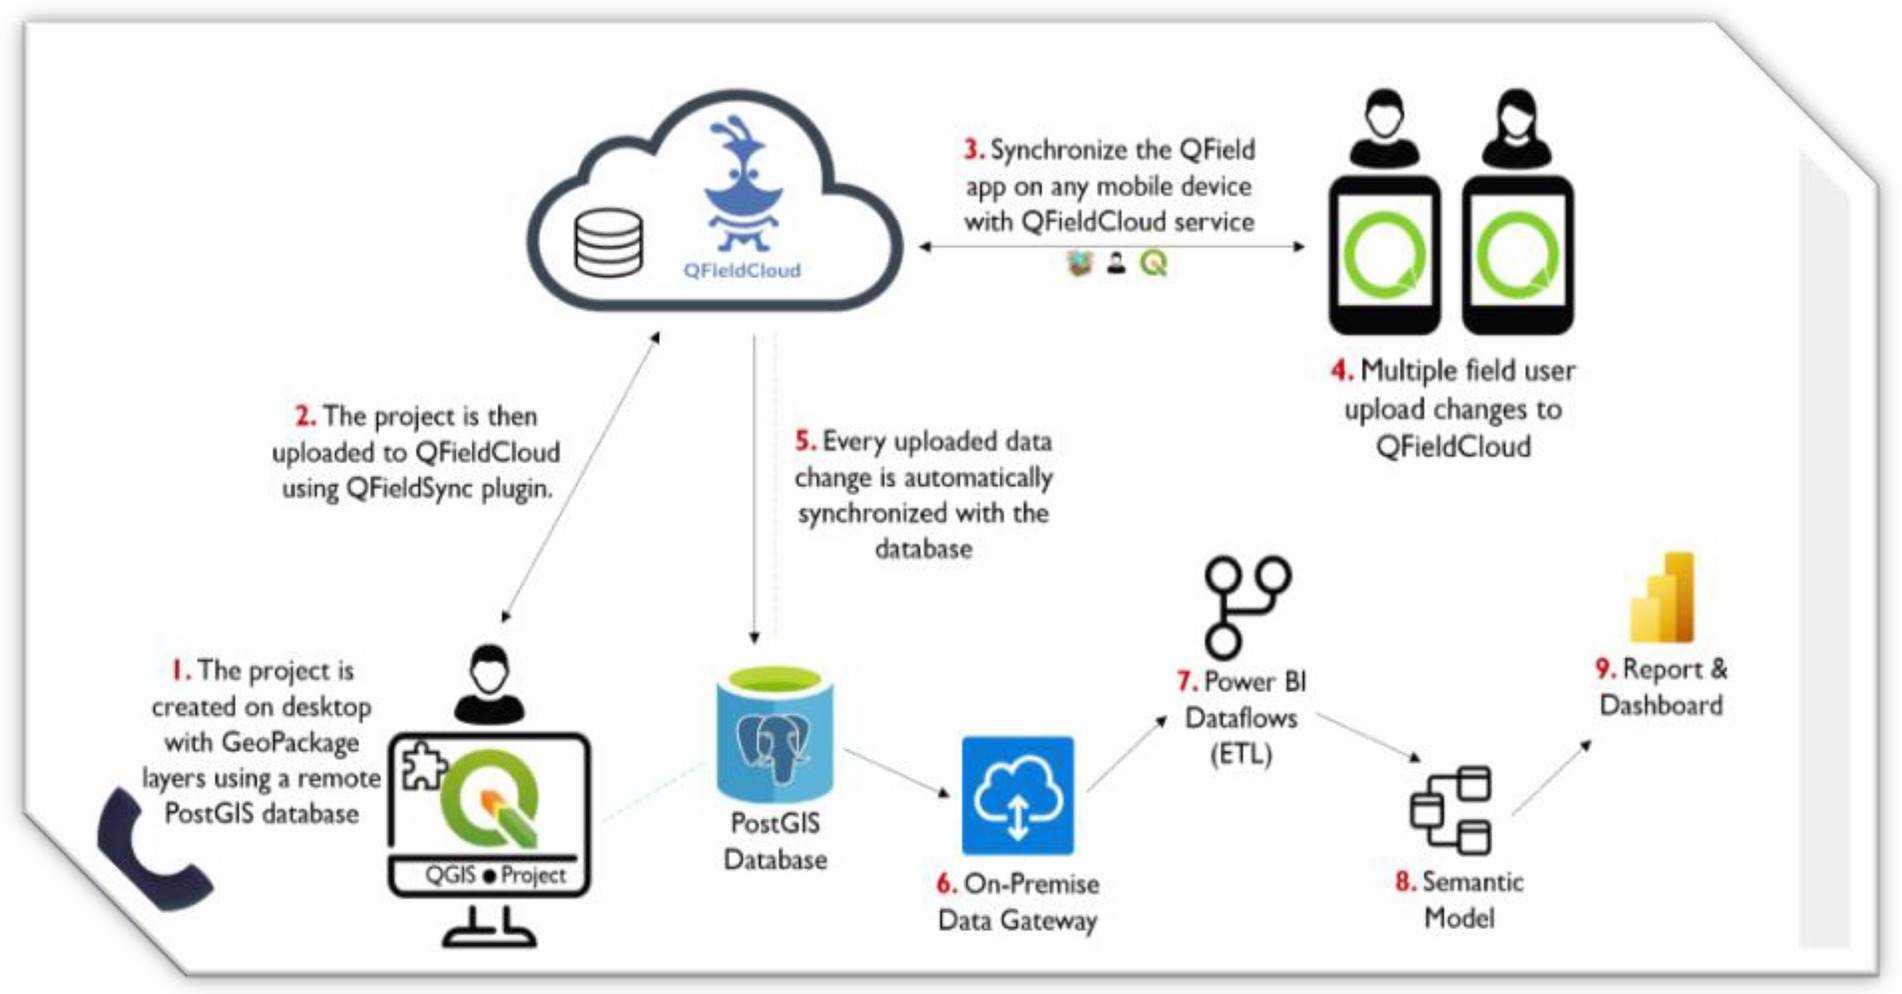
Figure 2. Data collection and analysis architecture developed for the road vulnerability assessment.
The data collection process comprises the following steps: (1) the project is created on a desktop with GeoPackage layers linked to a remote PostGIS database; (2) the project is uploaded to QfieldCloud using the QFieldSync plugin; (3) the QField app on Android mobile devices is synchronized with QfieldCloud; (4) multiple field users upload data changes to QfieldCloud; (5) all uploaded changes are automatically synchronized with the PostGIS database; (6) data from PostGIS is linked to Microsoft Power BI through an On-premises Data Gateway; (7) Power BI Dataflows perform extraction, transformation, and cleansing of the data; (8) semantic models organize the data by creating connections and relationships; and (9) reports are generated in a form of dashboards, maps, charts, etc. for analysis and decision-making.
2.5 Indicators of the identified climate hazards
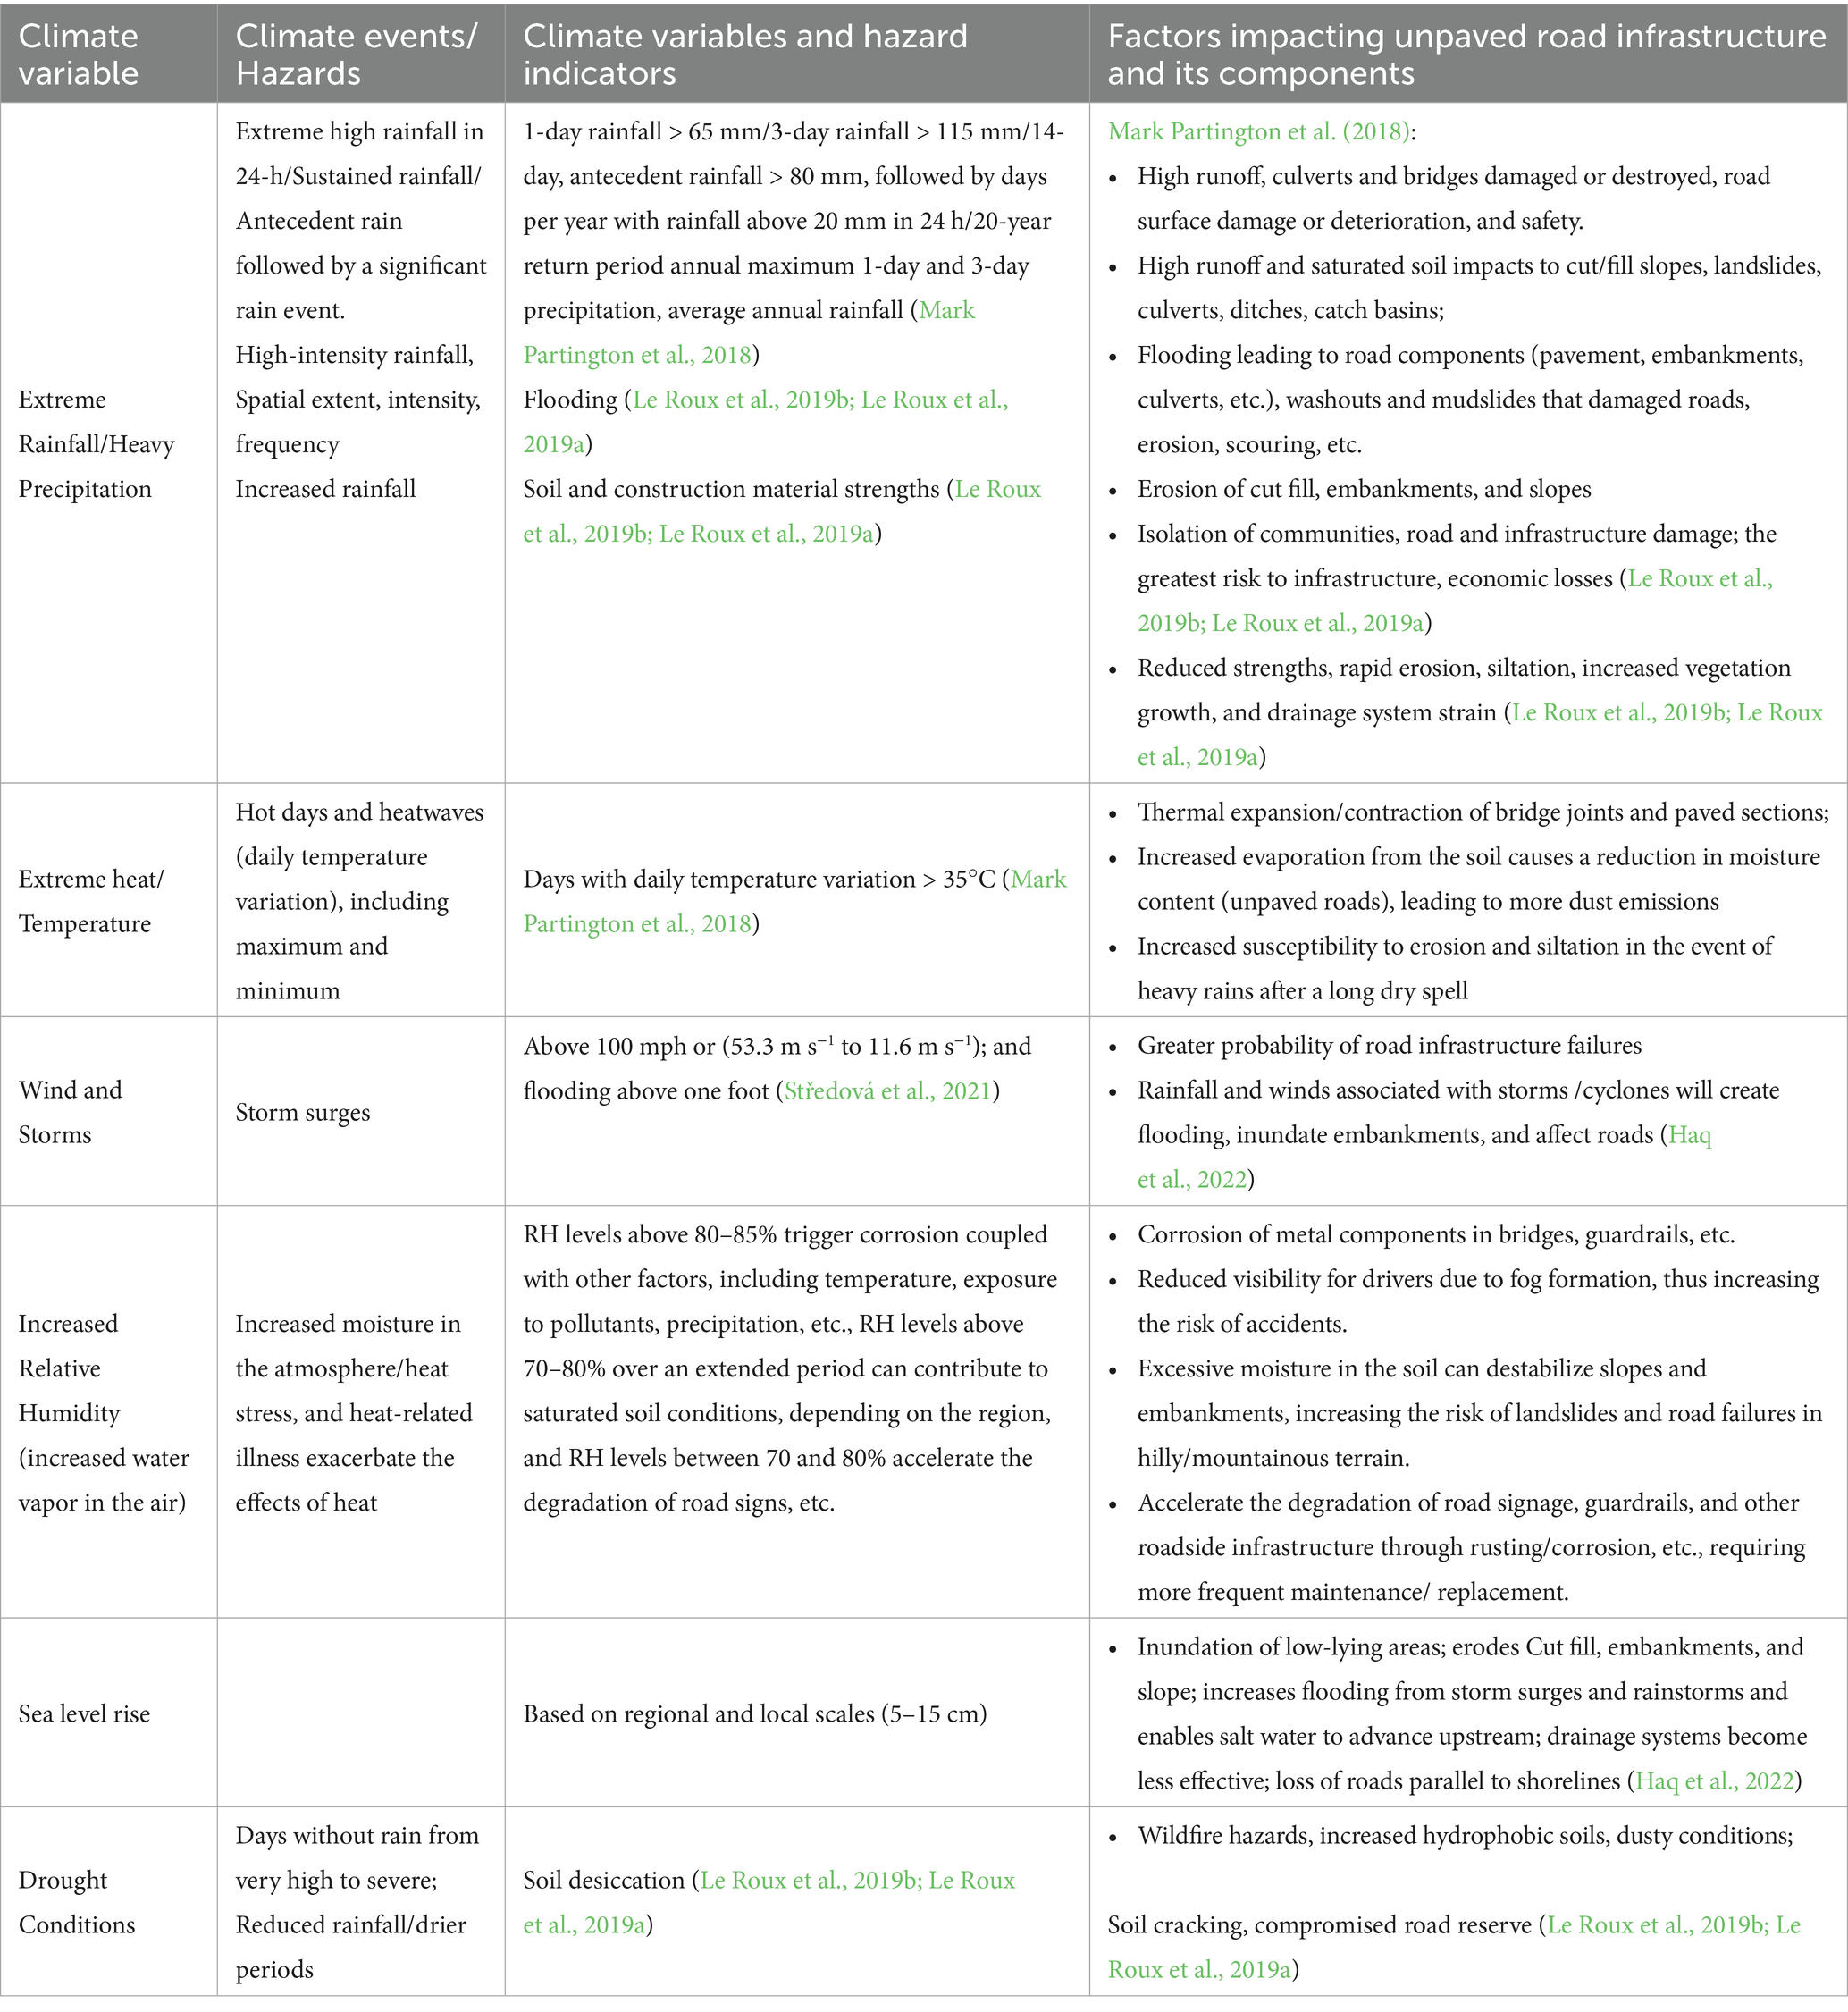
Indicators essential for characterizing climate variables and hazards within the proposed vulnerability assessment framework for unpaved secondary roads in Sierra Leone are critical for understanding infrastructure vulnerability. As noted by Zlateva and Hadjitodorov (2022), selecting appropriate indicators is a key step in assessing the sensitivity and exposure of infrastructure within specific geographic contexts. Indicators offer quantifiable metrics of parameters such as temperature extremes, precipitation levels, and wind speeds, enhancing our understanding of climate impacts (Zebisch et al., 2021). These metrics enable comparative analyses across hazards and regions, support trend identification, and assist in prioritizing interventions (Fleming et al., 2023). Furthermore, indicators aid stakeholders in interpreting complex climate data, thereby informing evidence-based decision-making and policy formulation (Sun et al., 2019). Table 1 summarizes the relevant climate variables, associated hazards, disaster-triggering indicators, and their impacts on infrastructure.
As illustrated in Table 1, extreme rainfall contributes to flooding, erosion, and infrastructure degradation, while extreme heat accelerates evaporation, weakens road materials, and exacerbates erosion. Wind and storms often result in structural failures and inundation. High humidity promotes material corrosion and slope instability, whereas sea-level rise leads to shoreline erosion and disrupts drainage systems. Additionally, drought conditions cause soil cracking and compromise the structural integrity of the road reserve. These impacts highlight the need for context-specific resilience strategies and prioritized maintenance planning in areas vulnerable to frequent and severe climate events.
2.6 Identification of potential climate variables and hazards that most affect the vulnerability of unpaved secondary roads
Climate variables and hazards that most significantly influence the vulnerability of unpaved secondary roads are essential components of the proposed vulnerability assessment framework. Recognizing these factors enables a more accurate evaluation of associated risks and vulnerabilities (Zlateva and Hadjitodorov, 2022). Studies have demonstrated that key climate variables and hazards adversely affecting unpaved roads include rainfall, temperature, wind speed, relative humidity, storms, flooding, drought, sea-level rise, wildfires, and landslides, among others (Mark Partington et al., 2018; Le Roux et al., 2019b; Le Roux et al., 2019a; Paige-Green and Verhaeghe, 2018; Verhaeghe et al., 2020; de Abreu et al., 2022). For example, Le Roux et al. (2019a,b) reported that elevated temperatures can negatively impact unpaved roads by increasing soil evaporation, reducing moisture content, intensifying dust generation, and heightening susceptibility to erosion and siltation during heavy rainfall. Moreover, the combination of higher temperatures and increased atmospheric CO2 concentrations may promote rapid vegetation growth, potentially obstructing runoff drainage from the road reserve (Le Roux et al., 2019b; Le Roux et al., 2019a).
Ngezahayo et al. (2021) reported that unpaved roads are highly influenced by climate factors such as temperature and rainfall. Under dry conditions, soil surfaces are particularly susceptible to erosion due to elevated temperatures and traffic-induced shear stresses, while dislodged materials are prone to transport by rainwater splashing or surface runoff. Similarly, Lera and Kuleno (2020) found that intense rainfall, combined with the inherent weakness and lack of cohesion in pavement materials, significantly contributes to the degradation of unpaved roads. Among climate variables, rainfall, particularly its intensity, represents a primary influencing factor. Changes in seasonal precipitation patterns and river flow, along with rising sea levels and elevated temperatures, pose considerable risks to unpaved roads (de Abreu et al., 2022). These factors contribute to increased surface runoff, flooding, landslides, slope failures, and structural road damage during periods of intense rainfall. Additionally, de Abreu et al. (2022) asserted that rising sea levels exacerbate flooding risks and accelerate the failure of road pavements and embankments, while saturated conditions reduce the lifespan of pavement layers. Storm surges, coupled with strong winds and frequent cyclones, cause coastal infrastructure inundation, erosion of road bases and bridge supports, and disruptions due to debris accumulation on roadways (de Abreu et al., 2022).
Solomon et al. (2022) revealed that Sierra Leone lacks sufficient climatic data necessary for informed decision-making. However, using a global circulation model, they applied a global circulation model and identified several key climate variables—namely rainfall, temperature, wind speed, relative humidity, and solar radiation—as major threats. These variables vary significantly and are projected to continue varying in the coming decades. Similarly, the World Bank Disaster Risk Management Diagnostic Note highlighted multiple climate-related hazards affecting Sierra Leone, including high temperatures and humidity, which elevate heat index values that impact various economic sectors; extreme rainfall events, which trigger flash floods, riverine flooding, and landslides across the country; and rising sea levels, which intensify coastal erosion and compound the risks associated with climate change. Additionally, the report emphasized the country’s exposure to frequent floods, storms, and fires, underscoring its vulnerability to natural disasters (World Bank, 2020). From this context, the key climate factors that influence the vulnerability of unpaved road infrastructure, including rainfall, temperature, wind speed, relative humidity, storms, flooding, drought, sea-level rise, wildfires, and landslides, fluctuate across Sierra Leone. Moreover, studies have projected their continued intensification in the coming decades (World Bank, 2020).
2.7 Vulnerability assessment framework for unpaved secondary roads
The final output is a locally adapted vulnerability assessment framework that integrates technical analysis with stakeholder input and combines global best practices with context-specific realities. Central to this framework is the data collection and analysis platform illustrated in Figure 2, which enables efficient, GPS-enabled field data gathering, centralized geospatial processing, and interactive visualization. The framework supports data-driven decision-making for prioritizing unpaved road infrastructure in national climate adaptation strategies. Figure 3 presents the proposed integrated system for assessing the climate risk and vulnerability of unpaved secondary roads in Sierra Leone. The proposed vulnerability assessment framework for unpaved secondary roads in Sierra Leone adopts a structured, five-phase approach adapted from global best practices, offering a practical and context-specific process for implementation. It integrates cost-effective tools and stakeholder engagement to enhance the relevance and usability of results for decision-makers. Figure 3 illustrates the methodological flowchart of the vulnerability assessment framework.
In the first phase, the target infrastructure (unpaved secondary roads) is defined, and key data are collected on historical weather-related events, climate information, road conditions, usage, community perceptions, and socio-environmental factors, such as population distribution and access to alternative routes. In addition, understanding the geographic context is crucial at this stage. In the second phase, the framework employs tools such as QGIS and QField for GPS-enabled mobile data collection, supported by cloud-based storage systems. A local community perception survey on climate change and its implications for unpaved roads is also conducted. This phase emphasizes stakeholder involvement to ensure community-relevant data and strengthen local ownership of the assessment process. In the third phase, climate risk is analyzed through the identification of trends, variability, forecasting and extreme events over the past 30 years. International Business Machines (IBM) Statistical Package for the Social Sciences is used to analyze local community perceptions of climate change and variability. Includes the use of Microsoft Power Business Intelligence (BI) for road condition deficiency analysis, maintenance efficacy evaluation, and assessments of adaptive capacity and road criticality, based on factors such as functional importance, usage levels, and availability of alternative routes. In the fourth phase, Microsoft Power BI is used to present the findings through dynamic dashboards. These dashboards present composite indices, including the deficiency index (Di), maintenance index (Mn), and criticality index (Cr), and generate geospatial maps to identify and rank vulnerable road segments for prioritized action. In the fifth phase, the assessment findings are translated into practice by informing infrastructure adaptation strategies, asset management planning, and policymaking. This phase includes stakeholder consultations for validation and promotes iterative monitoring and refinement of interventions to ensure long-term resilience. Together, these phases form a holistic framework that quantifies vulnerability and supports targeted, evidence-based adaptation and policy decisions for improving the resilience of unpaved secondary roads in Sierra Leone.
3 Methodology overview
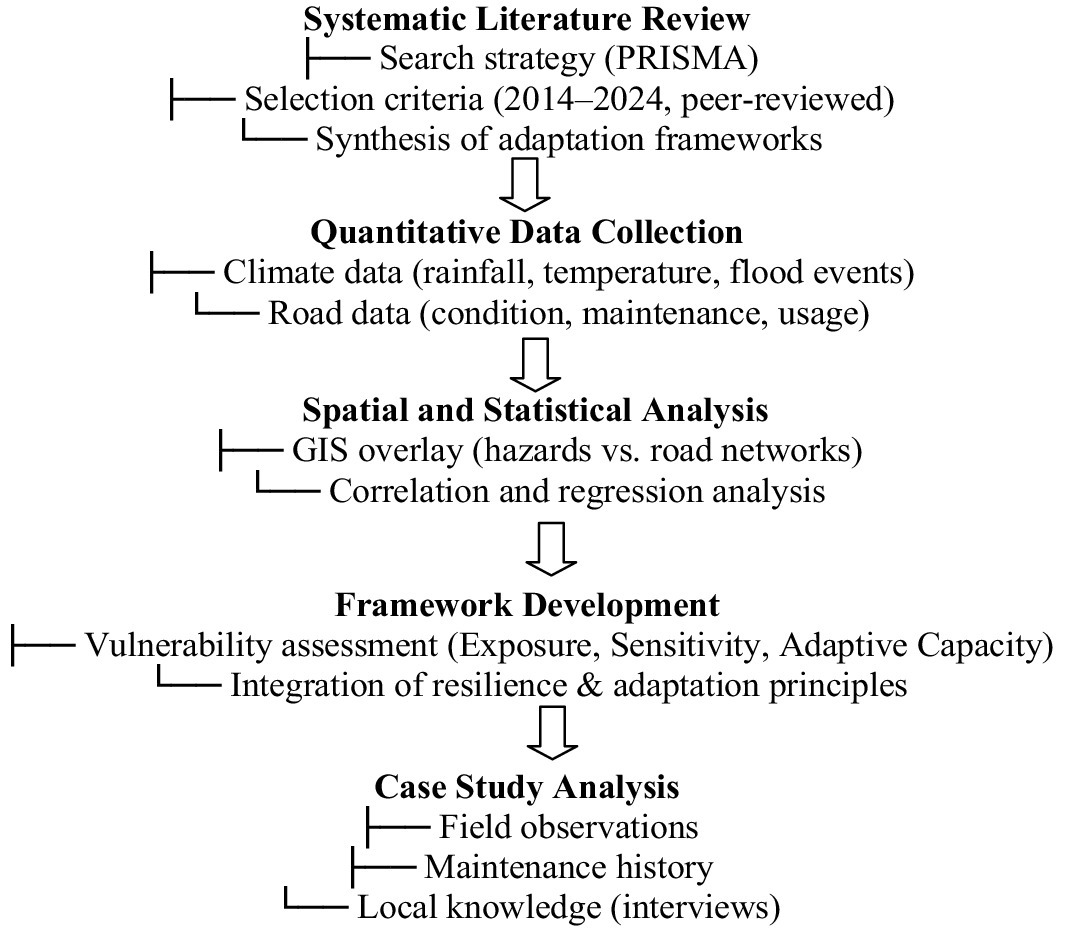
This study employed a mixed-methods approach to develop a framework for assessing the vulnerability of unpaved secondary roads to climate change in Sierra Leone. The methodology integrates a systematic literature review, quantitative and spatial analysis, case study evaluation, and composite index development to capture the exposure, sensitivity, and adaptive capacity dimensions (Gobo, 2023). Figure 4 presents the methodological flowchart guiding this study.
3.1 Literature review
The literature review was conducted following the Preferred Reporting Items for Systematic Reviews and Meta-Analyses protocol and sourced peer-reviewed articles published between 2014 and 2025 from databases such as Scopus and Web of Science, using keywords such as ‘road vulnerability’, ‘climate adaptation’, and ‘unpaved roads’. Inclusion criteria encompassed studies with clear methodologies and relevance to developing countries, while exclusion criteria comprised non-English and non-empirical studies. This review provided information on the adaptation of international assessment frameworks, such as that of Le Roux et al. (2019a,b), to local contexts. Quantitative data, including climate variables (e.g., rainfall, flood frequency) and infrastructure condition data, were analyzed to evaluate exposure and sensitivity, as defined by the Federal Highway Administrations (FHWA) (2017), while Geographic Information System (GIS)-based spatial analysis identified roads located in climate-vulnerable zones (Nunfam, 2021). Statistical methods, such as correlation and regression analysis, were applied to determine the relationships between climate factors and road deterioration. Complementing these, case studies drawn from selected corridors provided local insights through maintenance records, field observations, and community interviews, allowing the triangulation of findings. Similarly, the exposure analysis of identified climate hazards for the infrastructure under review utilized research-based forecasts and simulation results from climate models that accounted for potential future climate change. Relevant models and projections were sourced from authoritative and widely recognized datasets and platforms, as recommended by Zlateva and Hadjitodorov (2022):
1. Copernicus Climate Change Service, which provides authoritative information about the past, present, and future climate change service Climate Data Store (CDS) (2022), which offers historical, current, and projected climate information through the climate data store.
2. Coordinated Regional Climate Downscaling Experiment [Coordinated Regional Climate Downscaling Experiment (Cordex), 2022] providing global and regional climate simulations and statistical downscaling outputs.
3. European Environment Agency (2022), via the European Climate Adaptation Platform (Climate-ADAPT)
4. Adam (2022) for statistical time series ARIMA modeling applied to near-term point forecasts.
These inputs informed the development of a localized framework grounded in the principles of exposure, sensitivity, and adaptive capacity (Zlateva and Hadjitodorov, 2022) and integrating the concepts of resilience and adaptation to support practical decision-making by road agencies.
The Federal Highway Administrations (FHWA) (2017) defines vulnerability in transportation as the degree to which a system is exposed to climate effects, as well as its sensitivity and capacity to adapt. Sensitivity describes the degree to which an asset or system is affected by climatic stressors, with highly sensitive assets experiencing substantial impacts from even minor climatic variations, whereas lesssensitive assets exhibit greater tolerance. Exposure indicates whether an asset is located in an area subject to climate variability or extreme weather events, serving as a foundational element of vulnerability. Resilience is defined as the ability to anticipate, plan for, adapt to, and recover quickly from disruptions, while adaptation involves adjusting or maintaining transportation assets to respond to environmental changes, thereby maximizing benefits and minimizing adverse impacts. The development of the proposed framework commenced with a review of existing techniques, which assessed their effectiveness across different scales of road vulnerability assessment using methodologies established by international aid organizations.
3.1.1 Climate risk and vulnerability assessment approaches for critical infrastructure
Globally, several approaches have been developed to assess the impacts of climate change on critical infrastructure. This study classifies these approaches into five broad categories: scenario-based, index-based, process-based, spatial, and integrated assessments. Scenario-based assessments project future climate conditions under different emission pathways or models to explore potential impacts on infrastructure and inform adaptation strategies (Gaarder et al., 2023). Index-based assessments quantify vulnerability using indicators that span physical, social, economic, and environmental factors (Le Roux et al., 2019b; Le Roux et al., 2019a). These indicators are aggregated into indices to facilitate comparison across regions. Process-based assessments investigate interactions between climate stressors and infrastructure systems by examining exposure, sensitivity, and adaptive capacity (Le Roux et al., 2019b; Le Roux et al., 2019a). Spatial assessments leverage GIS and spatial modeling to map the geographical distribution of climate risks and vulnerabilities, incorporating land use and infrastructure data. Integrated assessments combine elements of these approaches to capture the complexity of climate-infrastructure interactions (Khemesh, 2025). Using these methods, stakeholders can gain a nuanced understanding of climate-related risks and design effective adaptation strategies, particularly for critical systems such as transport infrastructure. Process-based vulnerability assessments of climate change involve a systematic approach to identifying, analyzing, and prioritizing the potential impacts of climate change on a specific system or region and considering both the exposure to climate hazards and the system’s sensitivity and adaptive capacity. For instance, the UNCTAD (2017) framework for assessing climate change impacts on coastal transportation infrastructure in the Caribbean adopts a process-based vulnerability assessment approach, focusing on exposure, sensitivity, and adaptive capacity to enhance the resilience of Small Island Developing States.
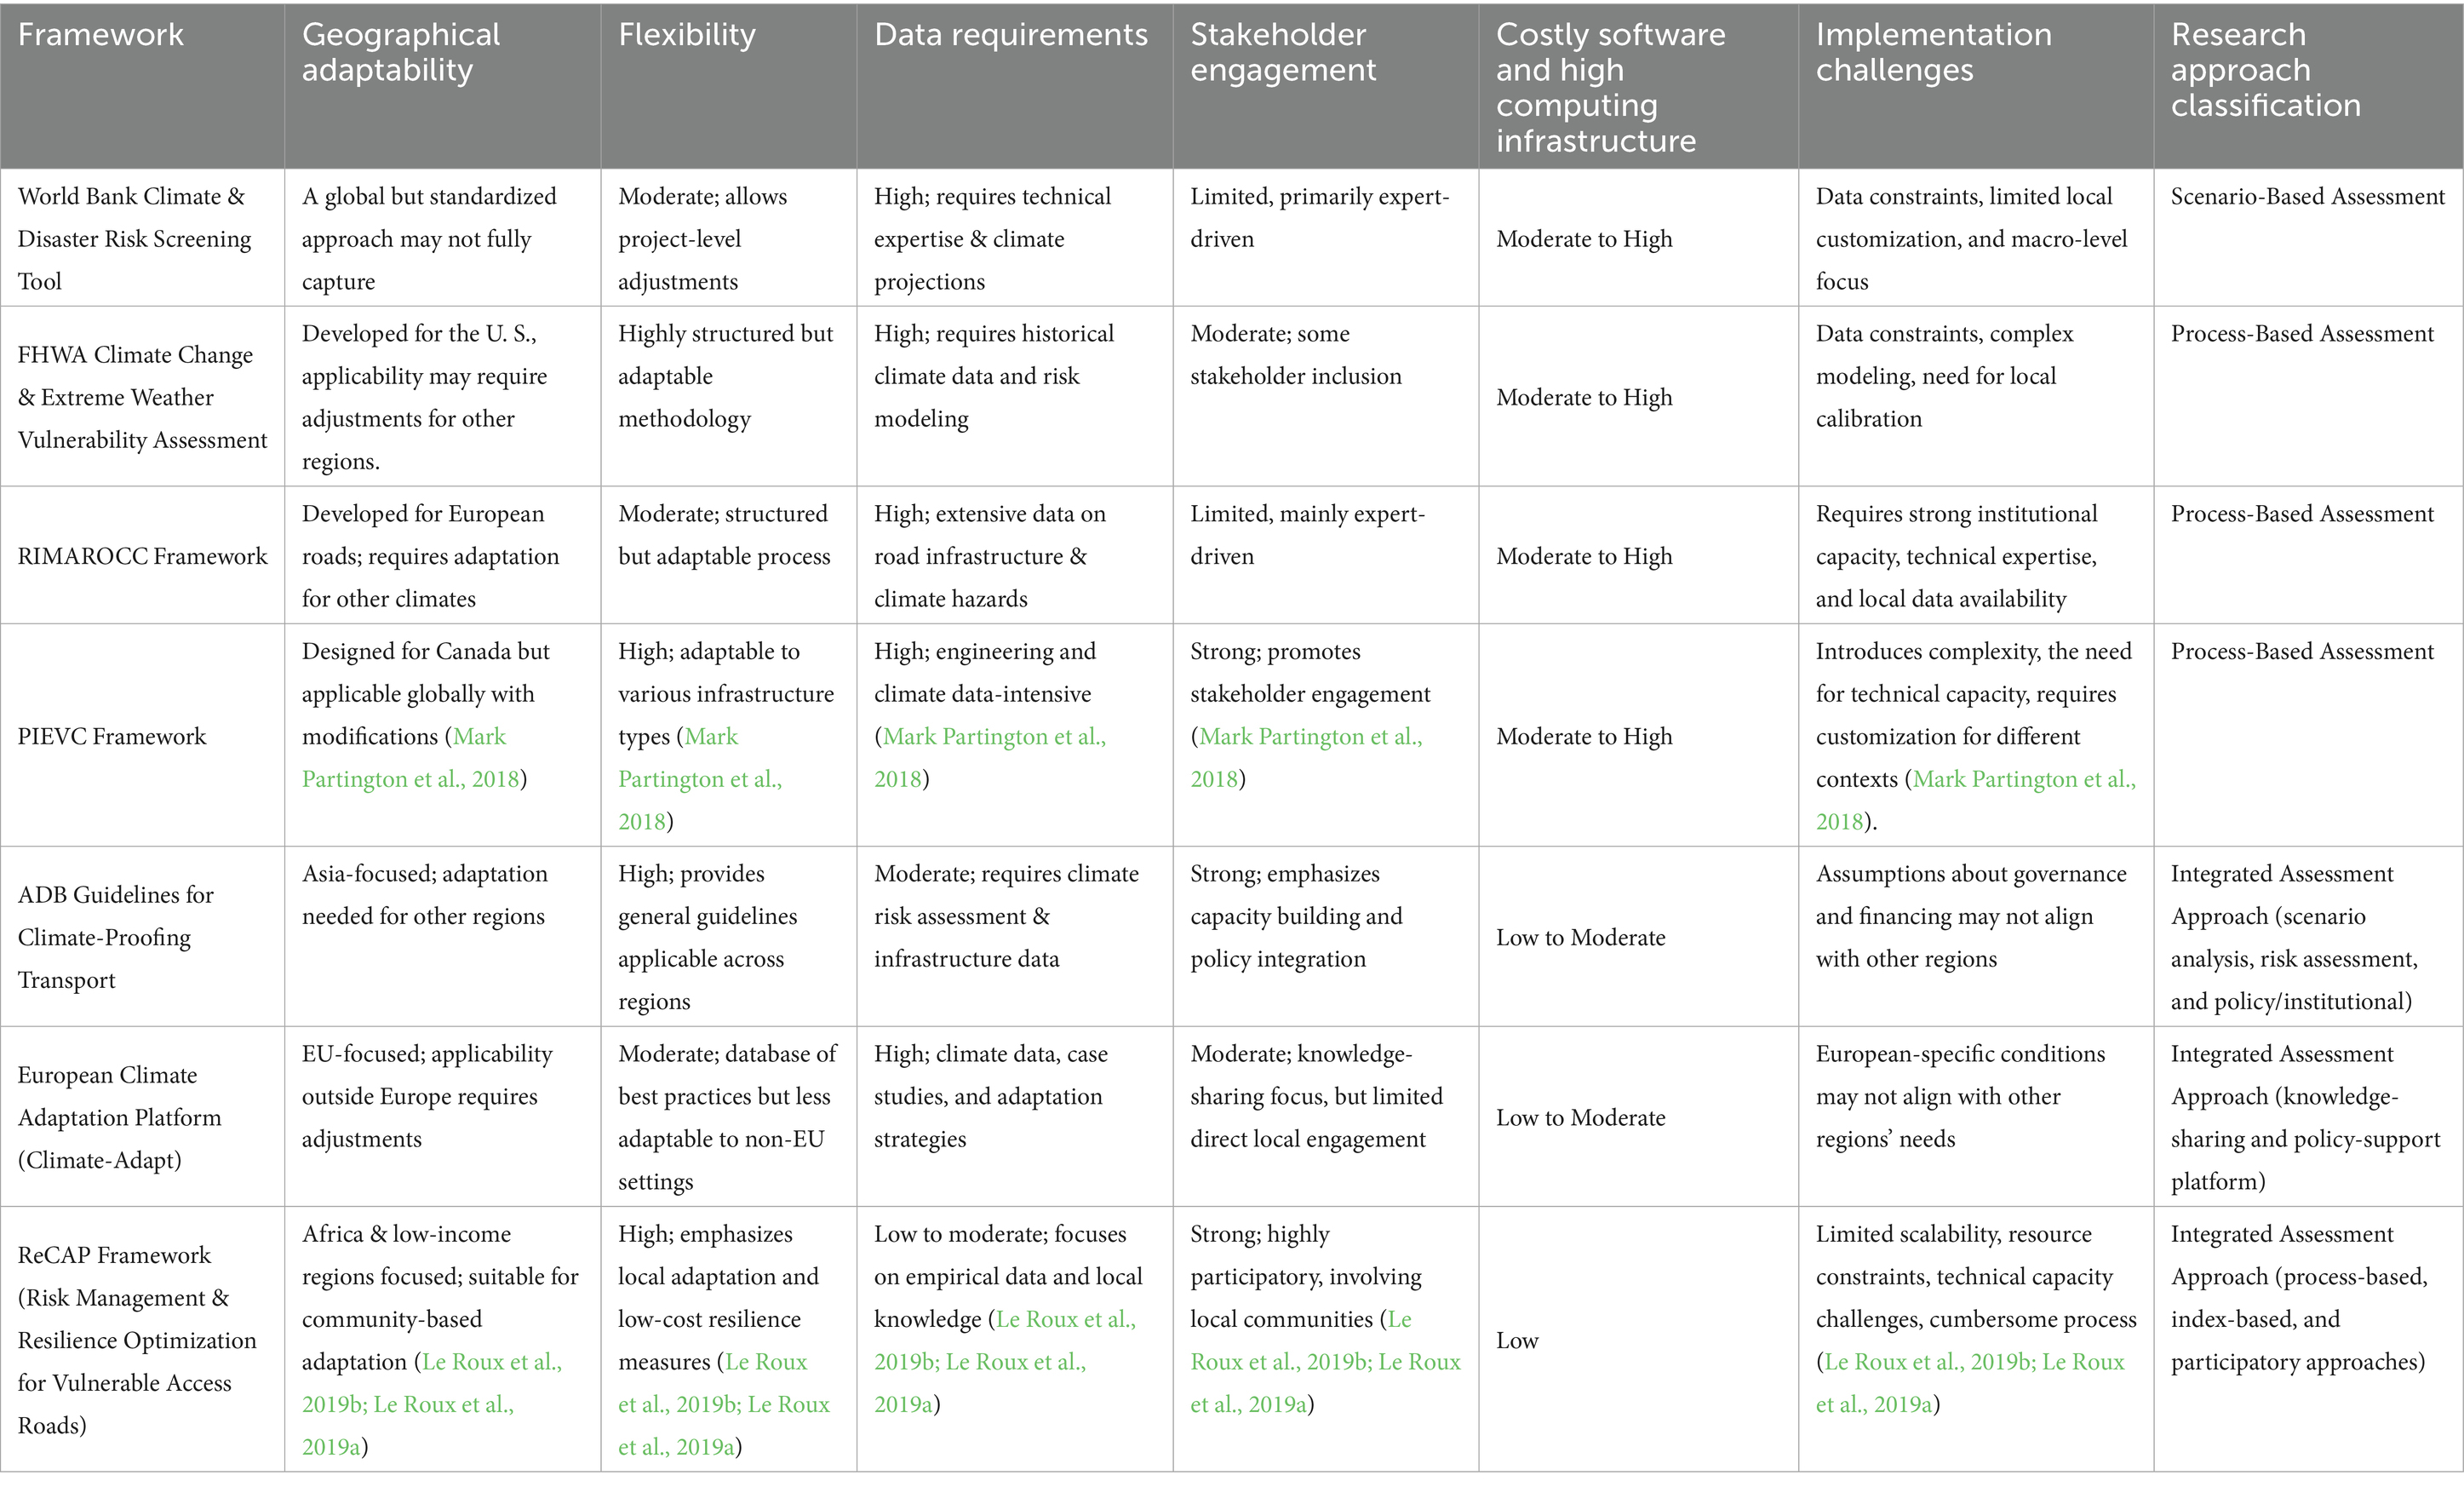
Vulnerability assessments can provide an enhanced understanding of both community and environmental needs related to capacity-building and identify appropriate adaptation and mitigation measures (de Sherbinin et al., 2019). Despite widespread development, many vulnerability assessment frameworks, including those presented in Table 2, face similar limitations. These include reliance on costly proprietary software, high computing infrastructure, high data and technical requirements, narrow geographic applicability, and limited flexibility for local adaptation and stakeholder engagement amid diverse climate, infrastructure, and socio-economic contexts. A core challenge is that vulnerability is not directly measurable; rather, it is a multidimensional concept shaped by interacting physical, socioeconomic, and cultural factors, which vary over time and space. As a result, confusion often arises between index-based and indicator-based approaches, and many frameworks struggle to reflect the lived realities of vulnerable communities (de Sherbinin et al., 2019).
Against this backdrop, this study reviewed key climate risk and vulnerability assessment frameworks to identify the most appropriate model for application in Sierra Leone. Prominent frameworks include the World Bank’s Climate and Disaster Risk Screening Tools (2022); the FHWA Vulnerability Assessment Framework (2017), the risk management for roads in changing climate (RIMAROCC); Framework based on Climate-ADAPT The European Climate Adaptation Platform Climate-ADAPT, (2023), the Public Infrastructure Engineering Vulnerability Committee (PIEVC) Protocol (2018), the Asian Development Bank (ADB) Guidelines for Climate-Proofing Investment in the Transport Sector [Asian Development Bank (ADB), 2011], and the Risk Management and Resilience Optimization for Vulnerable Access Roads framework developed under ReCAP (Le Roux et al., 2019b; Le Roux et al., 2019a). These frameworks provide structured approaches for assessing climate risk but share common limitations, including reliance on standardized formats, use of costly proprietary software (e.g., ArcGIS, MATLAB, HEC-RAS), high data and technical requirements, and limited adaptability to local socio-economic and geographic contexts. Frameworks such as PIEVC and ADB Guidelines require significant modification to suit Sierra Leone’s climate, infrastructure conditions, and institutional capacities. Similarly, the ReCAP framework focuses on vulnerable access roads and encourages local engagement, but its broader applicability is limited by scalability and capacity constraints.
Given the limitations of existing frameworks, conducting effective vulnerability assessments in Sierra Leone, particularly for unpaved roads, requires flexible, context-specific approaches that combine technical rigor with strong local engagement.
Unlike conventional models that rely on large datasets, expensive proprietary software, or high-end computing infrastructure requiring highly specialized expertise, this framework adopts a flexible five-step process where exposure and sensitivity determine potential impacts, moderated by adaptive capacity. By ranking sector vulnerabilities as low, medium, or high, the framework enables policymakers, engineers, and local stakeholders to identify priority areas for intervention more effectively [Climate System Analysis Group (CSAG), 2020]. While informed by international best practices (Zlateva and Hadjitodorov, 2022; Zebisch et al., 2021), the framework is structured to accommodate local infrastructural realities, ensuring a more actionable and context-specific vulnerability assessment. The implementation strategy consists of five methodological steps, detailed in the following sections.
As presented in Table 2, climate risk and vulnerability assessment frameworks vary in their suitability depending on regional context, data availability, and stakeholder engagement. Selecting an appropriate framework requires balancing technical feasibility with local adaptability. The following sections present the proposed framework developed in this research, which integrates tools and methodologies designed to address the implementation challenges identified in prominent international frameworks for assessing climate risk and vulnerability in road infrastructure, as outlined in Table 2.
3.1.2 Vulnerability levels of unpaved secondary roads to identified climate hazards
The vulnerability levels of the infrastructure under review were determined by combining analyses of sensitivity and exposure to identified climate hazards and variables within the specific geographic region, by the IPCC approach [Climate System Analysis Group (CSAG), 2020]:
In the proposed vulnerability assessment framework for unpaved secondary roads, the vulnerability levels were determined by following the steps outlined in the ReCAP guidelines:
1. The geometric mean was computed based on the severity and extent of distress (physical damages or defects observed on the road surface, such as cracks, potholes, and rutting) for each unpaved secondary road infrastructure element within each segment and across the entire road stretch. The geometric mean combines multiple vulnerability factors of road infrastructure, such as exposure, sensitivity, and adaptive capacity, into a single composite score by multiplying their values and taking the nth root, where n is the number of factors. This approach balances each indicator’s influence by minimizing extremes and ensuring that a low score in any dimension significantly lowers the overall vulnerability, reflecting the need to consider all factors collectively.
2. The maximum value among the computed geometric means of the elements under each infrastructure aspect was selected for each segment and the entire road stretch.
3. The median was calculated from the selected maximum geometric means for each segment and the entire road stretch.
4. The average of the medians across all segments was calculated as the overall vulnerability level of the unpaved secondary road infrastructure.
5. This procedure was repeated for three dimensions: infrastructure condition, maintenance regime, and criticality, represented by Di, Mn, and Cr, respectively.
6. These indicators were treated as composite indicators contributing to the RVI.
7. The combination of Di, Mn, and Cr produced a quantifiable RVI, with values ranging from 1 to 5.
The four levels of the RVI are defined as follows:
1. Very high vulnerability (4 < RVI ≤ 5): the unpaved road infrastructure at a specific location was considered very highly vulnerable to the identified climate hazards and relevant climate variables
2. High vulnerability (3 < RVI ≤ 4): the unpaved road infrastructure at a specific location was considered highly vulnerable to the identified climate hazards and relevant climate variables
3. Medium vulnerability (2 < RVI ≤ 3): the unpaved road infrastructure at a specific location was considered moderately vulnerable to the identified climate hazards and relevant climate variables
4. Low vulnerability (1 < RVI ≤ 2): the unpaved road infrastructure at a specific location was considered to have low vulnerability to the identified climate hazards and relevant climate variables.
Furthermore, the vulnerability levels were determined using the Microsoft Power BI platform (Microsoft Fabric). This platform generates visualization tools—including maps, charts, graphs, matrices, and query reports, that illustrate the key factors influencing the RVI. Key factors contributing to the system’s challenges encompass maintenance lapses and criticality stemming from a lack of alternative routes. The vulnerability maps produced through Microsoft Fabric provided critical insights into areas expected to experience significant societal impacts, thereby guiding stakeholders in formulating essential adaptation strategies (de Sherbinin et al., 2019). These interactive tools played a pivotal role in informing decisions related to the allocation of billions of dollars in adaptation funding, particularly within frameworks such as the Green Climate Fund (de Sherbinin et al., 2019). The RVI calculations conducted within Microsoft Fabric incorporated geomorphological terrain, vegetational landscapes, topographical features, river basin contributions, soil composition, and population distribution and density. This comprehensive approach to vulnerability assessment aligns with the findings of previous studies (Le Roux et al., 2019b; Le Roux et al., 2019a; Paige-Green and Verhaeghe, 2018; Verhaeghe et al., 2020; Madushani et al., 2024) and is expressed in Equation 1 as follows:
3.1.3 Sensitivity of unpaved secondary roads to the identified hazards
The proposed vulnerability assessment framework recommends conducting sensitivity analyses on infrastructure components to evaluate their susceptibility, regardless of their proximity to identified hazards. This analysis considers the overall functionality of the infrastructure, along with its direct and indirect interactions with other systems under climate hazard conditions. It incorporates quantitative data, qualitative assessments, and expert judgment as key inputs. For unpaved secondary roads, the framework identifies seven key component areas, each with specific elements: (1) Erodibility factors, such as drainage, road surface, side drains, and embankment slopes; (2) Drainage over streams, which involves structures, approach fills, and erosion protection, and subgrade issues, such as material type and moisture content; (3) Slope stability for both cuts and fills; (4) Drainage within the road reserve, including the road shape and shoulder conditions; (5) Construction quality and erosion protection measures; (6) Maintenance quantity and quality; and (7) Criticality factors, such as access to public facilities, alternative road availability, and typical vehicle types used.
The sensitivity assessment of unpaved secondary road infrastructure to identified climate variables and hazards was conducted by assigning ratings to the current condition of the infrastructure, the maintenance regime, and its criticality. Experts recommend using a school grade-type scheme, typically a scale from 1 to 5, to facilitate effective communication (Zebisch et al., 2021). The roads were pre-segmented into 100-meter intervals, within which each road component was evaluated based on two criteria: the degree of distress (severity) and the extent of distress (spread), which were both rated on a scale from 0 to 5 (Le Roux et al., 2019b; Le Roux et al., 2019a). This evaluation was carried out for all elements of unpaved secondary roads across each identified aspect, including maintenance effectiveness and criticality.
The framework categorizes sensitivity into four levels:
1. Not sensitive (0): No observable impact from climate hazards.
2. Low sensitivity (1–2): Acceptable condition, with minimal expected impact.
3. Medium to high sensitivity (2–3): Potential for moderate to significant impact.
4. Very high sensitivity (3–5): Severe impact likely under climate hazards.
3.1.4 Exposure of unpaved secondary road infrastructure to the identified climate hazards
The proposed vulnerability assessment framework incorporated location-specific climate conditions by integrating historical and projected climate data from international and national sources using GIS. The exposure analysis considered key variables such as precipitation, temperature, wind speed, and relative humidity, based on historical records (1991–2021) and a 30-year climatological baseline from NASA POWER (Stackhouse and Kusterer, 2000; Tayyeh and Mohammed, 2023). Additional datasets included EM-DAT, IPCC TG-Data, IMF Climate Data, and the World Bank Climate Change Portal [IMF-Climate data, 2022; Intergovernmental Panel on Climate Change (IPCC), 2022; World Bank, 2022; Emergency Events Database (EM-DAT), 2023]. A near-term forecast was generated using an ARIMA statistical time-series model. Detailed data sources are provided in the Supplementary material.
4 Case study analysis
4.1 Applicability of the proposed framework by road agencies in managing road infrastructure
To evaluate the effectiveness of the proposed vulnerability assessment framework in enhancing the resilience of unpaved secondary roads to current and future climate hazards and variability, the framework was applied to four unpaved secondary roads across four distinct geographic regions in Sierra Leone. Each road was analyzed within the framework to identify region-specific climate variables influencing vulnerability and to assess multiple contributing factors. These included the road’s current condition and components, topographical features, vegetational landscape, adjacent river basins, geological and soil characteristics, road geometry, traffic volume, accessibility to public facilities, the availability and condition of alternative routes, population distribution and density, presence of watercourses, and maintenance regime. These factors were assessed to determine the sensitivity (Si) to current and future climate exposures (Eci, Efi), the adaptive capacity (Aci) of the roads, and their criticality (Cri) to the communities they serve. The adaptive capacity and sensitivity contributed to road condition deficiencies and maintenance efficacy, which together with road criticality form the RVI.
The selected roads were segmented into 100-meter intervals using QGIS plugins. Field data were synchronized through QFieldCloud and transferred to a PostGIS database for real-time analysis. A participatory approach enriched the dataset with local knowledge, including historical data on weather-related events such as floods and landslides, as well as infrastructure conditions. Trained field assessors evaluated road deficiencies using a standardized 0–5 rating scale aligned with international vulnerability assessment frameworks. Collected data on climate threats, geospatial features, and socioeconomic variables were analyzed in Microsoft Fabric using the Multi-dimensional RVI. The Multi-dimensional RVI is a composite metric that quantifies the susceptibility of road segments to damage or disruption by integrating multiple factors, such as structural condition, exposure to climate hazards, environmental sensitivity, and accessibility importance, into a single, spatially-referenced score (Le Roux et al., 2019b; Le Roux et al., 2019a). Advanced analytics and interactive dashboards were employed to visualize climate risks. This integrated system facilitated data-driven decision-making, allowing for the precise identification of both critical road segments and broader areas requiring adaptation and mitigation interventions. Based on a combination of geospatial technology, automated data processing, and community engagement, this study established a replicable and scalable framework for climate-resilient road infrastructure planning, representing a significant advancement in road vulnerability assessment methodologies.
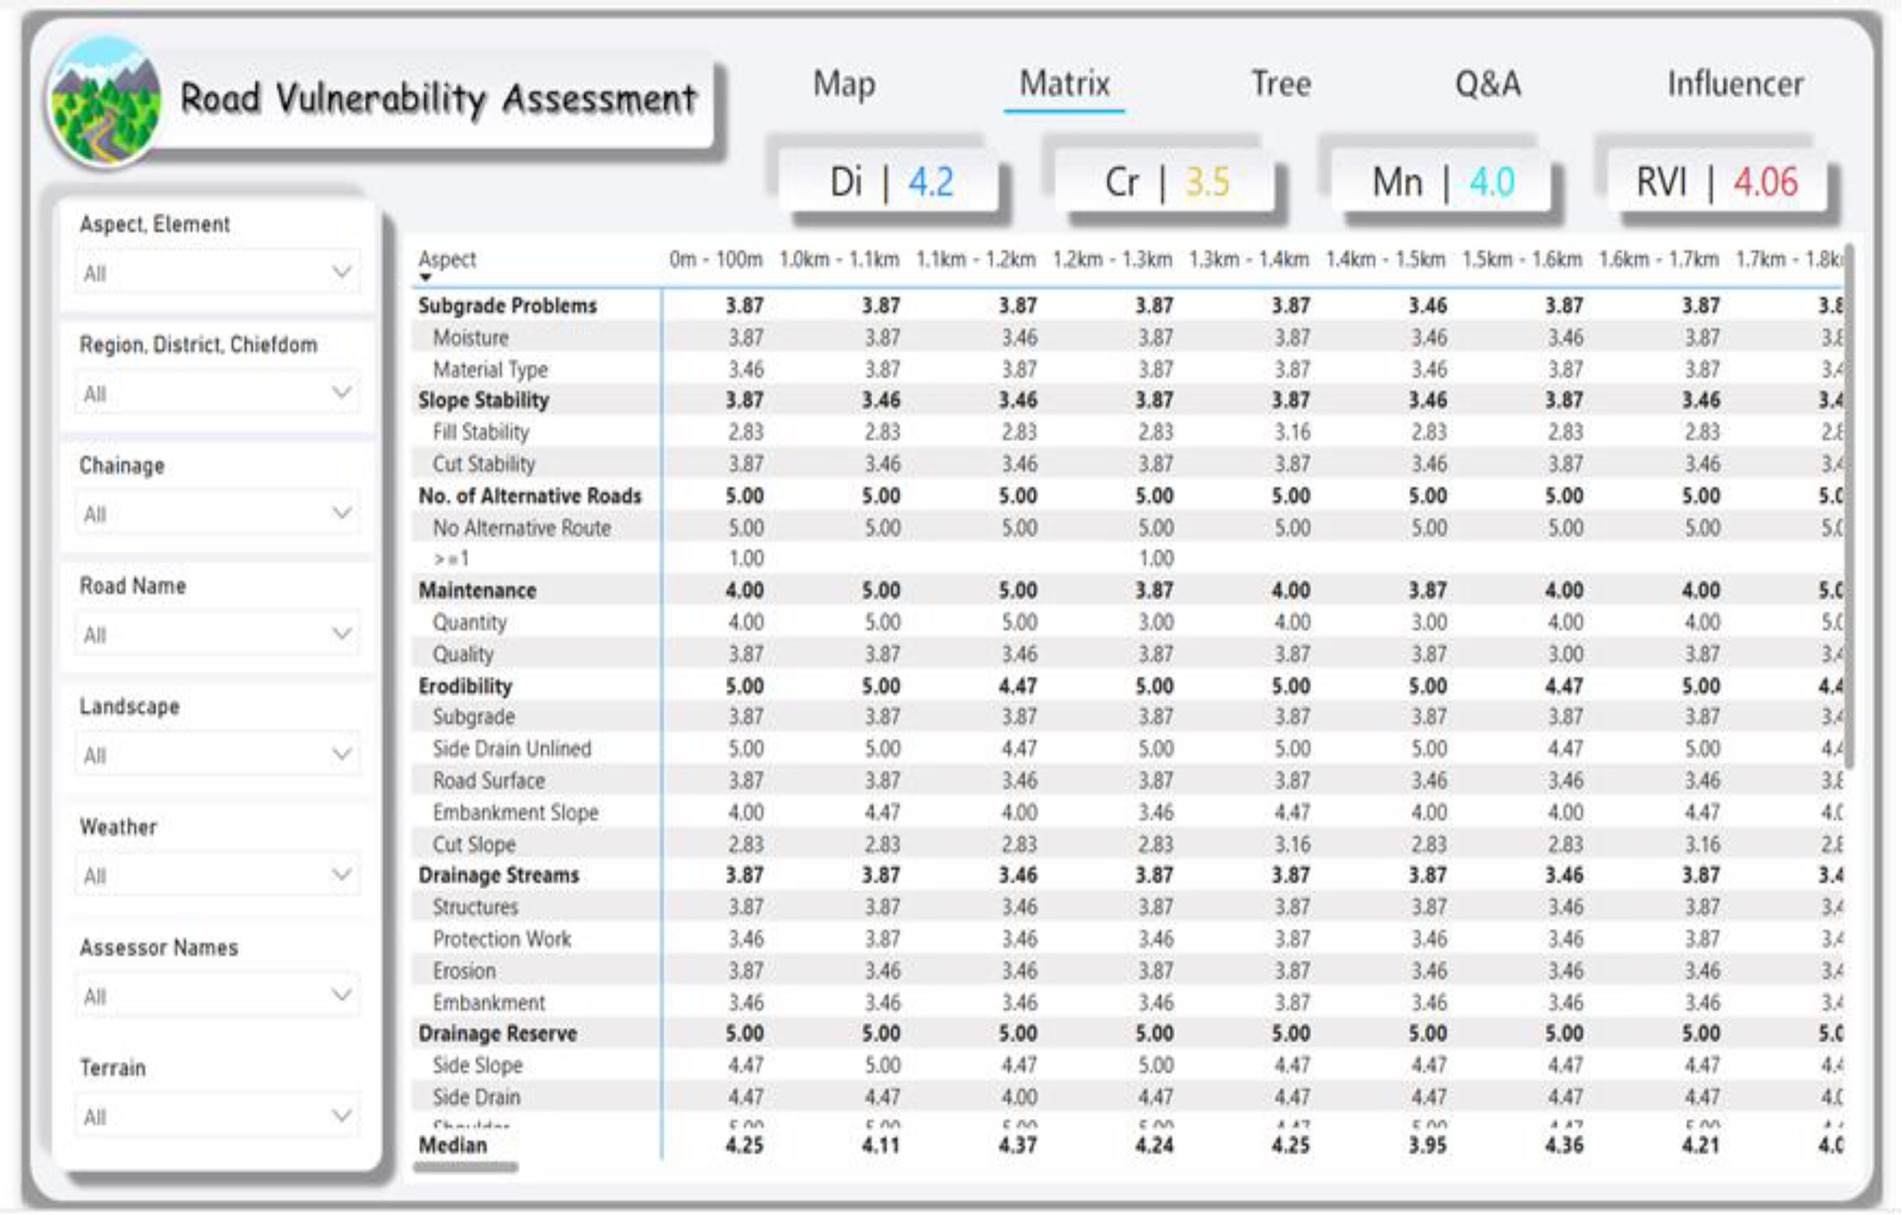
Inputs obtained through a community participatory approach, including location and frequency of road cut-offs, accident incidence due to adverse weather, remedial coping practices undertaken by communities prior to the arrival of road managers, and the frequency and quality of road maintenance, facilitated the refinement of information fed into the Microsoft Fabric platform. Figure 5 illustrates the outputs from the framework for the case study of npaved secondary roads combined (North, South, East, and West).
Figure 5 presents a section of a vulnerability assessment matrix for four unpaved secondary roads, each representing one of Sierra Leone’s four regions. The data, collected using simple, open-source, and low-cost technologies (as detailed in Appendix 3), assesses physical and environmental stressors across road segments defined by chainage. The RVI of 4.06 reflects a high level of overall vulnerability across the assessed unpaved roads. The most critical stressors include inadequate drainage reserves, such as poorly designed side slopes, side drains, and embankments, alongside the complete absence of alternative routes and significant issues with moisture-sensitive subgrades and unstable fill/cut slopes.
A general maintenance score of 4.0 further underscores the inconsistency in intervention quality and frequency. Erosion risks from exposed subgrades and unlined drains, combined with insufficient protection around drainage streams, leave the roads particularly prone to washouts during heavy rainfall. Regional terrain and climate variations suggest slope instability is most severe in the East and South, drainage deficiencies dominate the rapidly urbanizing West, and erosion-related vulnerabilities are more pronounced in the wind-exposed North. Additionally, a general criticality score of 3.5 indicates that these roads are highly important, providing access to economic hubs and public facilities for the communities they serve, yet remain highly vulnerable. These insights call for climate-informed, district-level planning that incorporates both instrumental data and local knowledge.
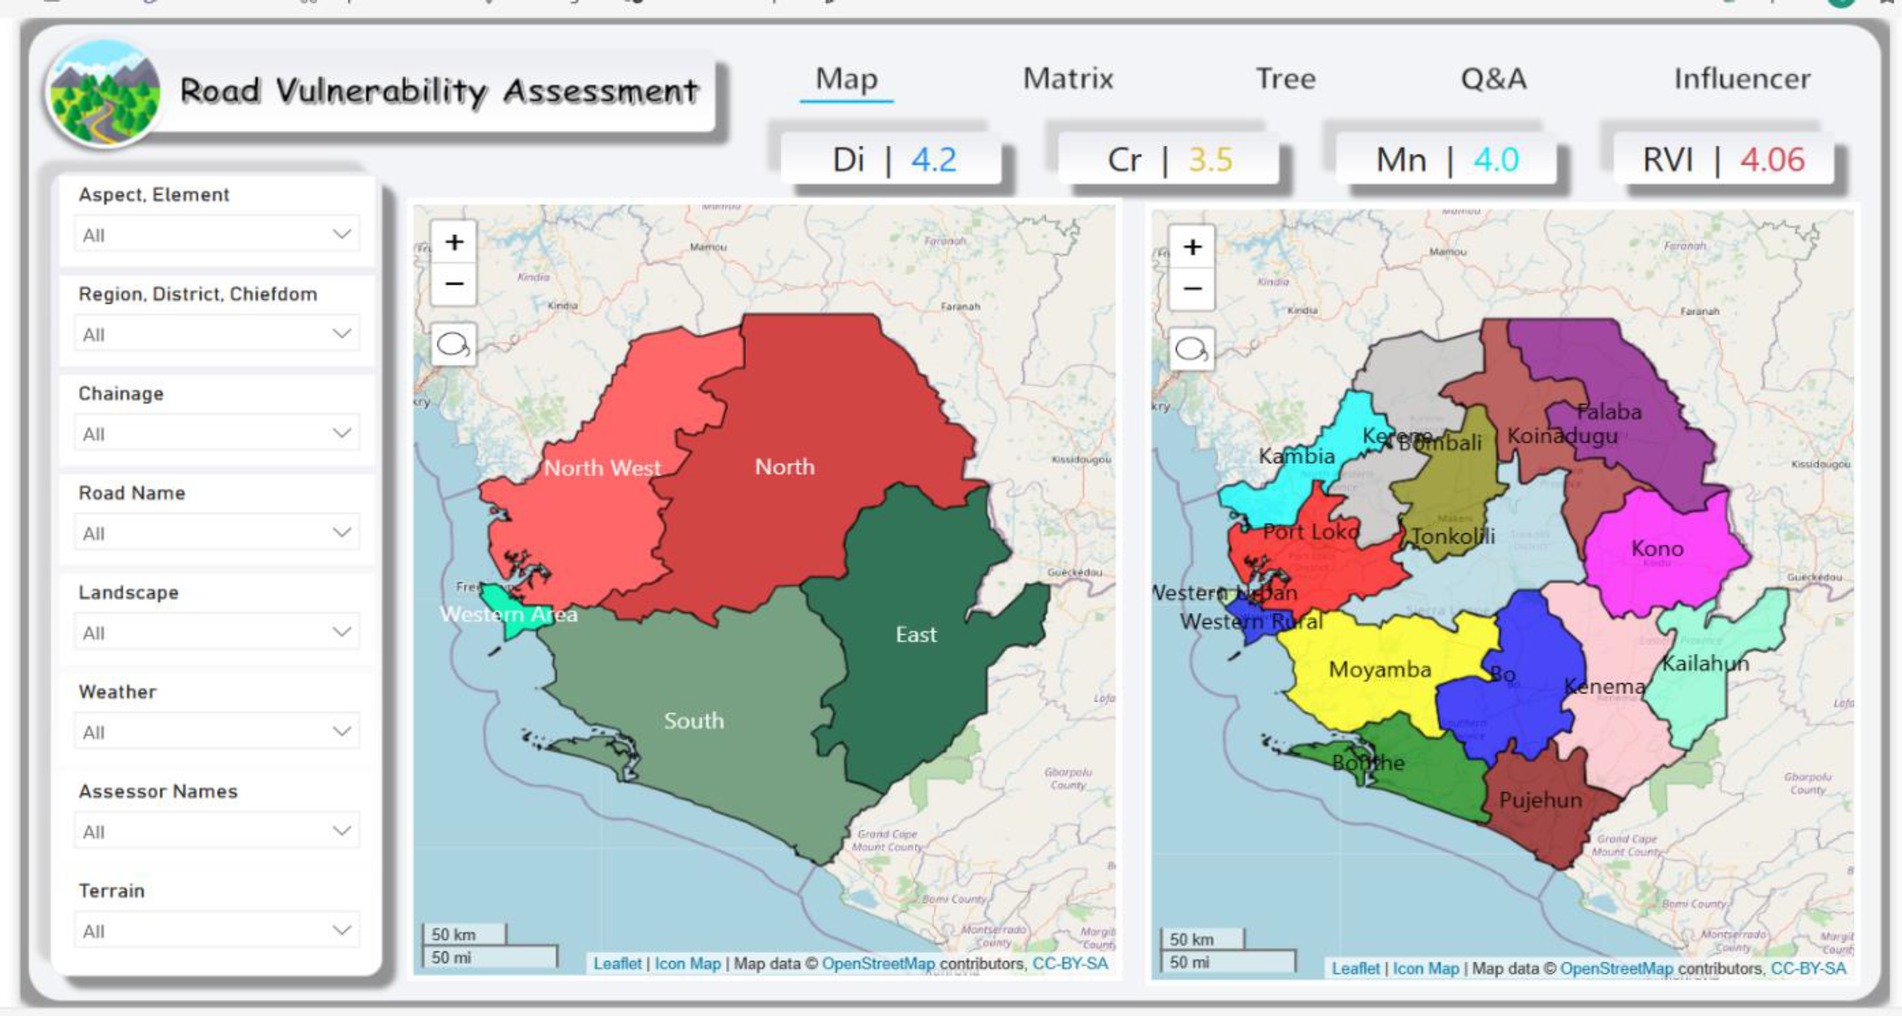
This result can be displayed as interactive maps using the visualization tool of Microsoft Power BI, which forms part of the framework. This mapping capability is a key strength of the platform, enabling spatial representation of road vulnerability and criticality, an important feature often missing in generic assessment frameworks. The integration of visual mapping into the framework enhances decision-making by allowing stakeholders to easily identify high-risk segments and prioritize interventions based on location-specific data.
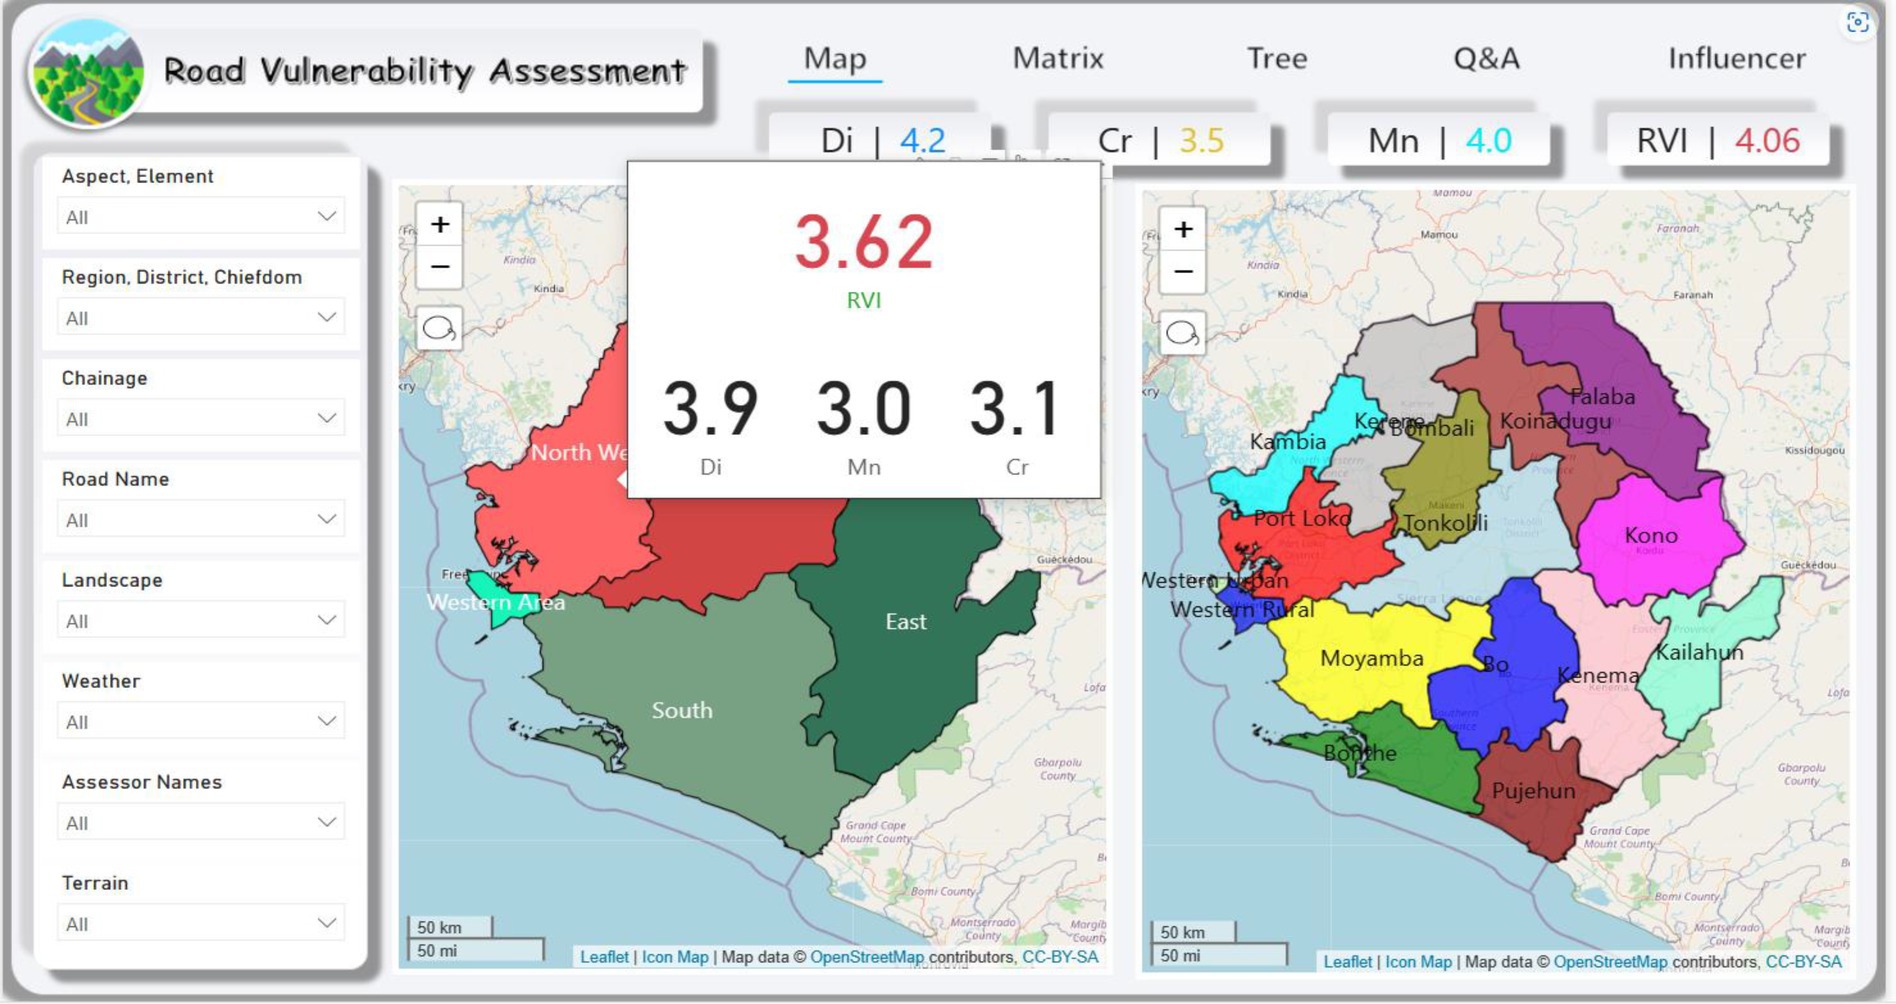
Figure 6 illustrates the vulnerability assessment indices for the case study of unpaved road 1: Mathoir–Masemera road in the Northern province in the form of a map.
Figure 7 illustrates the vulnerability assessment results for unpaved secondary roads in the Northern region. It indicates a high level of vulnerability to climate change impact, with an overall RVI of 3.62 on a 1–5 scale. This is driven by a severe road condition deficiency (Di = 3.9), suggesting significant deterioration. The relatively high maintenance efficacy score (Mn = 3.0) reflects insufficient maintenance responses to existing challenges. Additionally, a criticality score of 3.1 highlights the moderate socioeconomic importance of these roads. These findings underscore the urgent need for targeted interventions to improve resilience and functionality.
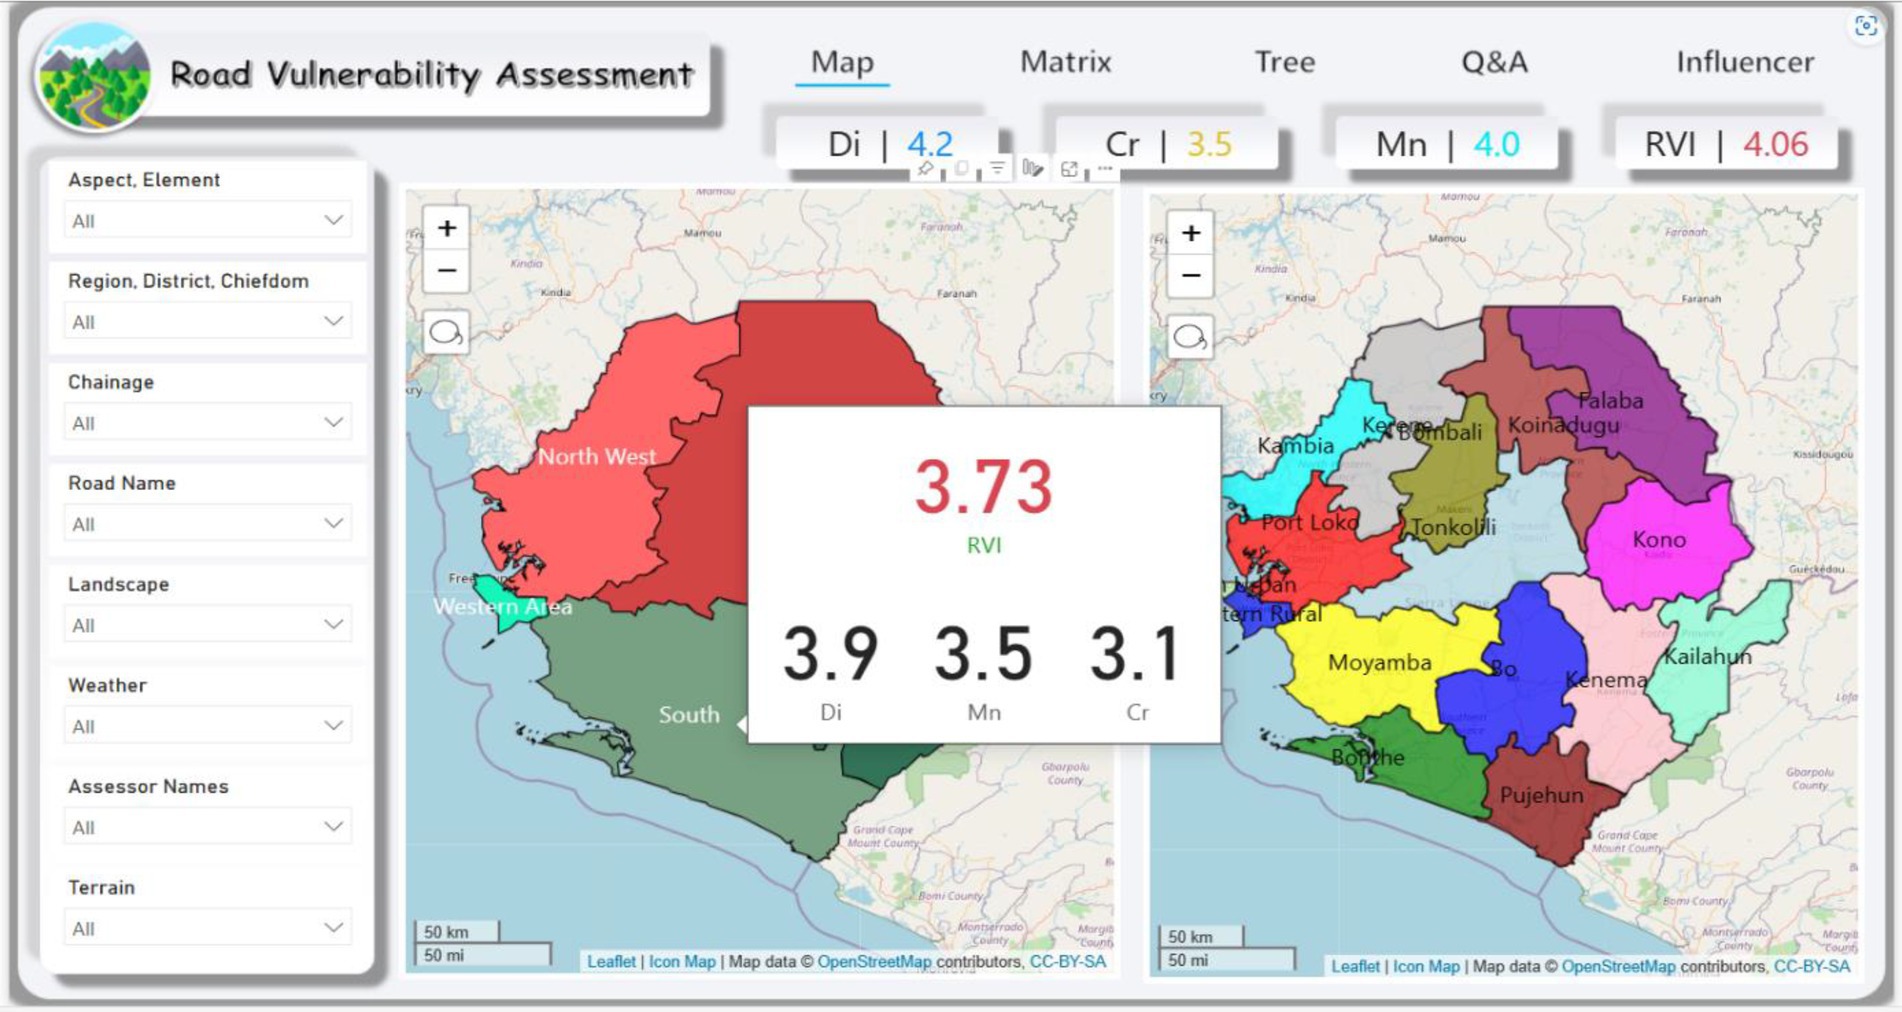
Figure 8 illustrates the vulnerability assessment indices for the case study of road 2: Malema Junction–Sulima Spur road in the Southern province in the form of a map.
Figure 8 illustrates that unpaved secondary roads in the Southern region are highly vulnerable, with an overall RVI of 3.73. The high road condition deficiency (Di = 3.9) indicates severe deterioration. The relatively high maintenance score (Mn = 3.5) suggests significant maintenance needs, either due to infrequent interventions or substandard work that fails to ensure resilience to climate change and variability. A criticality score of 3.1 reflects moderate socioeconomic importance. These results call for more effective and climate-responsive maintenance strategies.
Figure 9 illustrates the vulnerability assessment indices for the case study of road 3: Kenema—Zimmi road in the Eastern province in the form of a map.
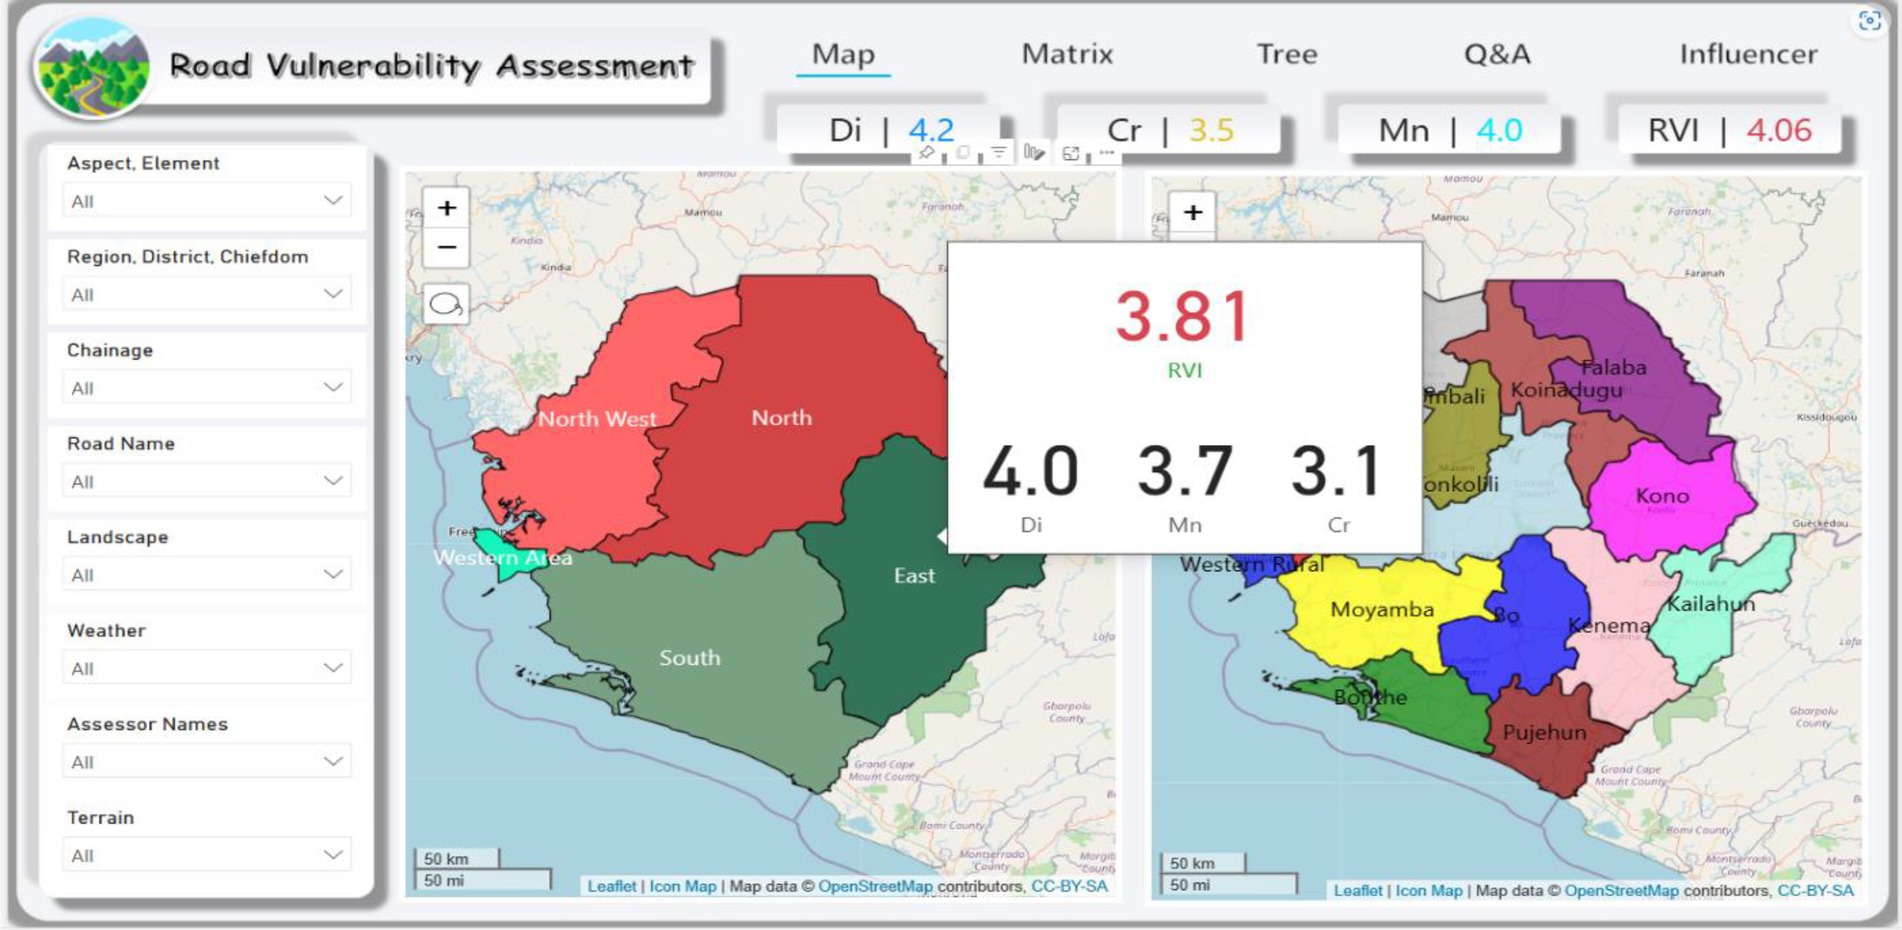
Figure 9 shows that unpaved secondary roads in the Eastern region are highly vulnerable, with an overall RVI of 3.81. The road condition deficiency is severe (Di = 4.0), indicating extensive deterioration. The relatively high maintenance score (Mn = 3.7) reflects significant maintenance needs either due to infrequent interventions or poor-quality works that fail to ensure resilience against climate change and variability. The criticality score of 3.1 indicates moderate socioeconomic relevance. These findings underscore the need for improved, climate-resilient maintenance strategies.
Figure 10 illustrates the vulnerability assessment indices for the case study of road 4: Malembe road in the Western region in a map form.
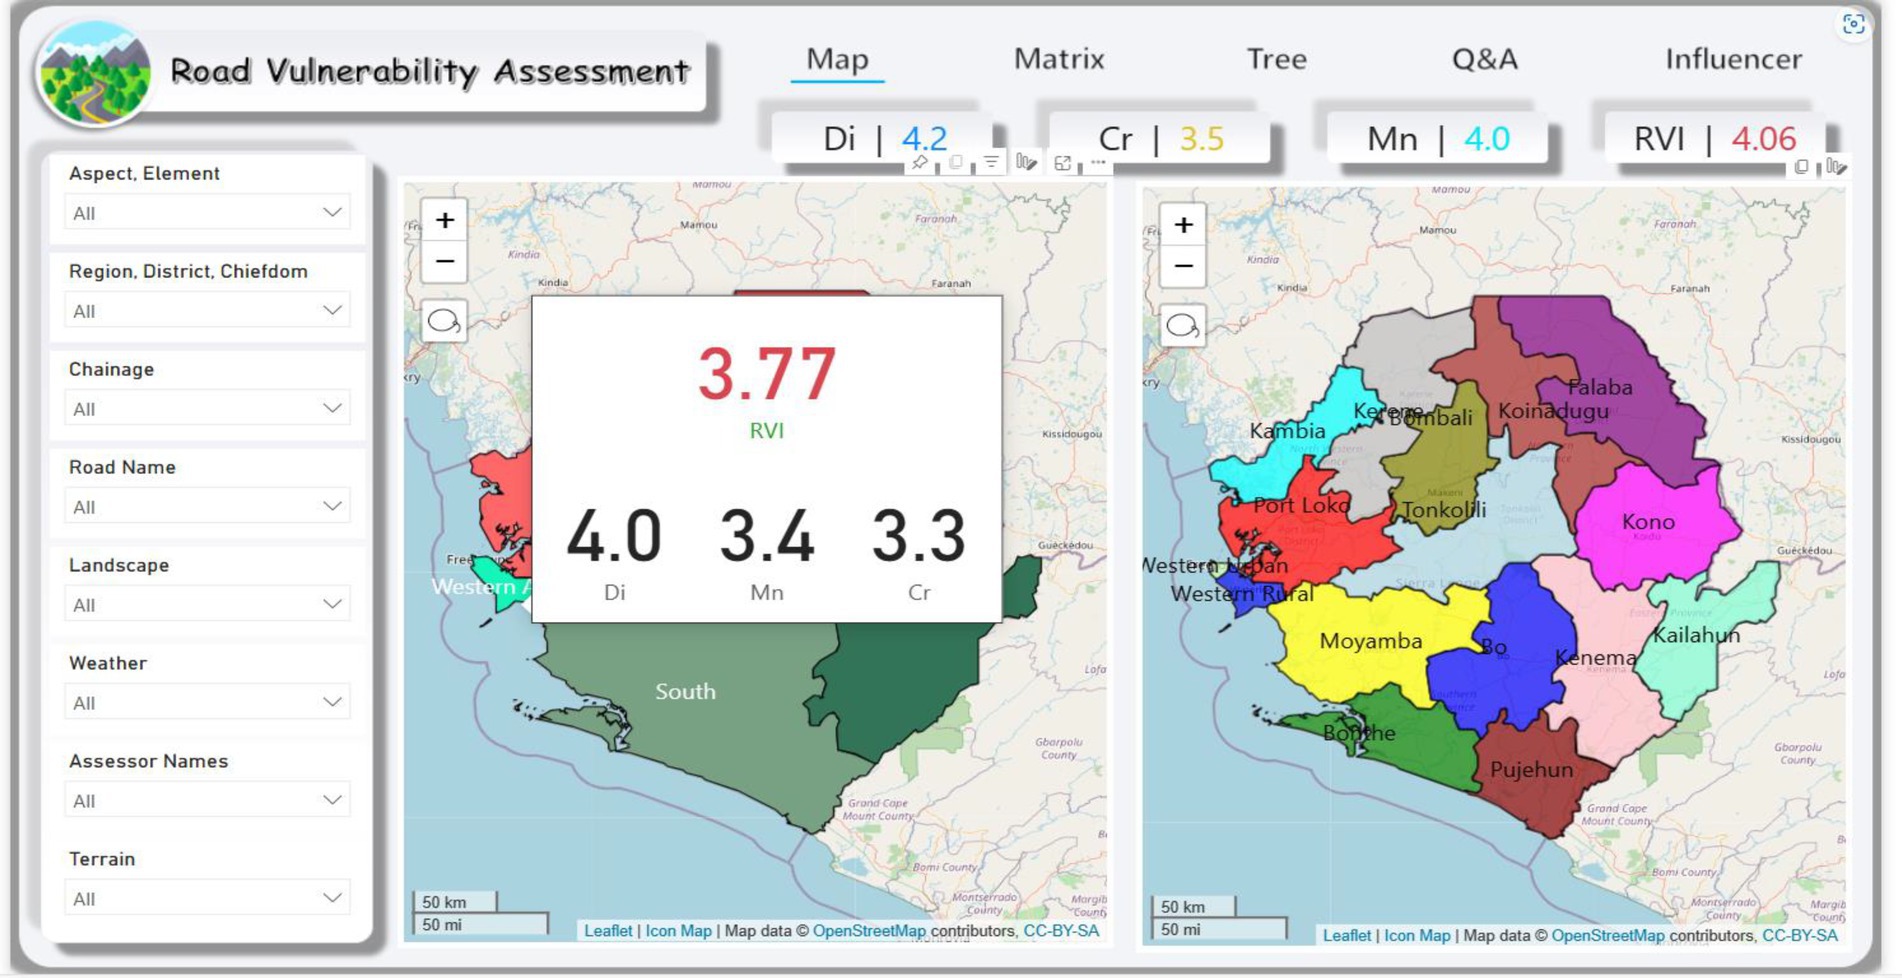
Figure 10 shows that unpaved secondary roads in the Western Region are highly vulnerable, with an overall RVI of 3.81 on a 1–5 scale. The road condition deficiency is severe (Di = 4.0), indicating significant deterioration. The relatively high maintenance score (Mn = 3.4) reflects high maintenance needs, suggesting that either routine maintenance is lacking or is performed below the standard required to ensure climate resilience. A criticality score of 3.3 signals moderate to high socioeconomic importance. These findings highlight the need for sustained, high-quality maintenance to improve road resilience amid climate variability.
In summary, Figures 7–10 present the vulnerability assessment of the case study of unpaved secondary roads across the country. They include analyses of vulnerability indices for the North, South, East, and West regions, using road condition deficiency (Di), maintenance efficacy (Mn), and criticality (Cr) scores on a 1–5 scale. All regions recorded high RVI values between 3.62 and 3.81, indicating consistently high vulnerability. Severe deterioration is evident from high Di scores (3.9–4.0), while elevated Mn scores (3.0–3.7) suggest significant maintenance needs; likely due to infrequent or poor-quality interventions. Cr scores (3.1–3.3) point to moderate to high socioeconomic relevance. Overall, these results highlight the combined impact of road conditions, maintenance gaps, and functional importance, emphasizing the need for targeted, climate-resilient road maintenance strategies.
Community inputs on road cut-offs, accident rates, coping measures, and maintenance quality were integrated through the Microsoft Fabric platform, thereby enabling a multi-dimensional analysis and visualization of vulnerability. The results, presented in Figure 5, reveal consistently high vulnerability across all four roads, with RVI values ranging from 3.62 to 3.81 on a 1–5 scale. High Di scores (3.9–4.0) indicate severe deterioration, while elevated Mn scores (3.0–3.7) reflect substantial maintenance needs stemming from either infrequent or low-quality interventions. Criticality scores (3.1–3.3) demonstrate moderate to high socioeconomic importance. This explicit connection between the framework and the case studies validates the model’s ability to capture region-specific vulnerabilities and underscores the urgent need for targeted, climate-resilient maintenance strategies to safeguard these vital road networks. The findings confirm that this context-sensitive, data-light approach delivers accurate, district-level diagnostics of climate vulnerability, making it a scalable and field-responsive alternative to traditional frameworks such as FHWA, ADB, and PIEVC. Additionally, the use of Microsoft Fabric dashboards improved stakeholder engagement and supported informed decision-making, further reinforcing the framework’s value for climate-resilient infrastructure planning in low-resource settings.
5 Results
5.1 Results of decades of historical weather-related events
Table 3 presents the output from the EM-DAT and data from national institutions, including the NDMA-SL [Emergency Events Database (EM-DAT) (2023); NDMA-SL (2023)].
These results provide a comprehensive overview of significant weather-related disaster events from 1975 to 2022, indicating that flooding was the most prevalent weather-related event, followed by storms (Table 3). Both flash combined with riverine flooding and storm events were the most prevalent weather-related hazards across all regions, accounting for 51 and 46 of the 110 recorded events, respectively, over the observed period. This high incidence is strongly linked to the influence of large-scale atmospheric drivers, such as the El Niño–Southern Oscillation (ENSO) and the Intertropical Convergence Zone [ITCZ; Intergovernmental Panel on Climate Change (IPCC), 2022]. ENSO events, particularly La Niña phases, are associated with enhanced rainfall in West Africa, whereas seasonal shifts and intensification of the ITCZ can lead to prolonged and intense precipitation episodes [Intergovernmental Panel on Climate Change (IPCC), 2022]. These mechanisms contribute substantially to the observed recurrent flooding, especially in the Western and Southern provinces, where urban runoff and topographic exposure amplify flood risks.
5.2 Results of climate change and variability (30-year meteorological data)
Tables 4–7 present an analysis of meteorological data spanning from 1991 to 2021, including precipitation, temperature, wind speed, and relative humidity (NASA Langley Research Center, 2023).
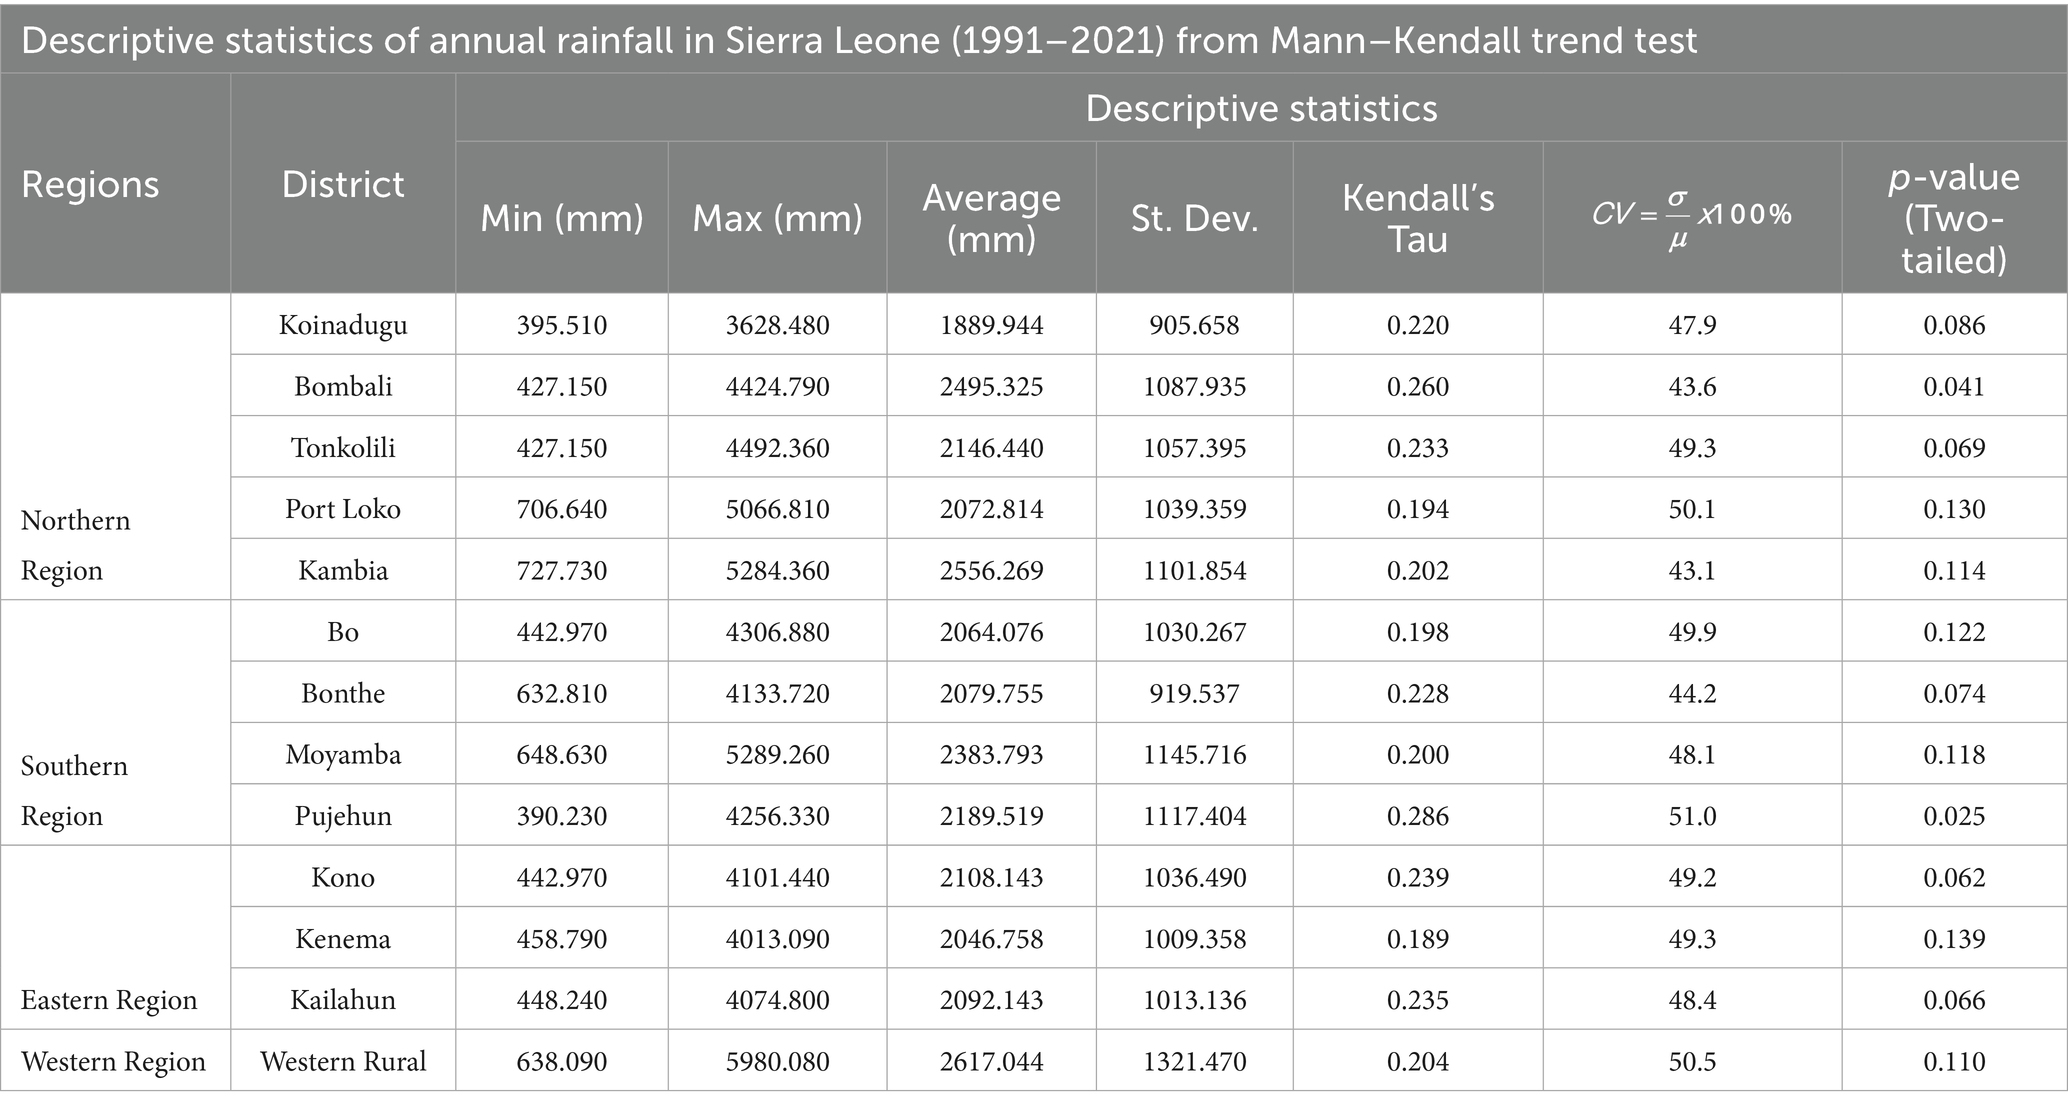
Key observations from Table 4 reveal the variability in rainfall patterns across districts. All districts showed substantial rainfall variability, with mean annual values ranging from approximately 1,890 mm (Koinadugu) to over 2,600 mm (Western Area). High standard deviations (SDs) indicate significant year-to-year fluctuations. Kendall’s tau (τ) values suggest weak to moderate upward trends in most districts, with Pujehun (τ = 0.286, p = 0.025) and Bombali (τ = 0.260, p = 0.041) showing the most notable increases. These findings highlight regional differences in climate exposure, an essential factor in assessing unpaved road vulnerability. To efficiently capture spatial variability and inform the development of a regionally responsive framework for assessing unpaved road vulnerability to climate change, one district per region was selected based on the highest coefficient of rainfall variation (CoV), indicating greater climate stress: Port Loko (North, 50.1%), Pujehun (South, 51.0%), Kenema (East, 49.3%), and Western Rural (West, 50.5%). Additionally, these districts exhibited distinct trend characteristics, including positive Kendall’s tau values and meaningful Sen’s slopes, with Pujehun showing both the highest CoV and a statistically significant upward trend, thus reinforcing its relevance. This targeted selection ensured analytical clarity, avoided redundancy from similar intra-regional patterns, and enhanced the framework’s ability to reflect diverse ecological and geographic climate risks. These findings are consistent with previous studies such as Wadsworth et al. (2019) and Gebrechorkos et al. (2019).
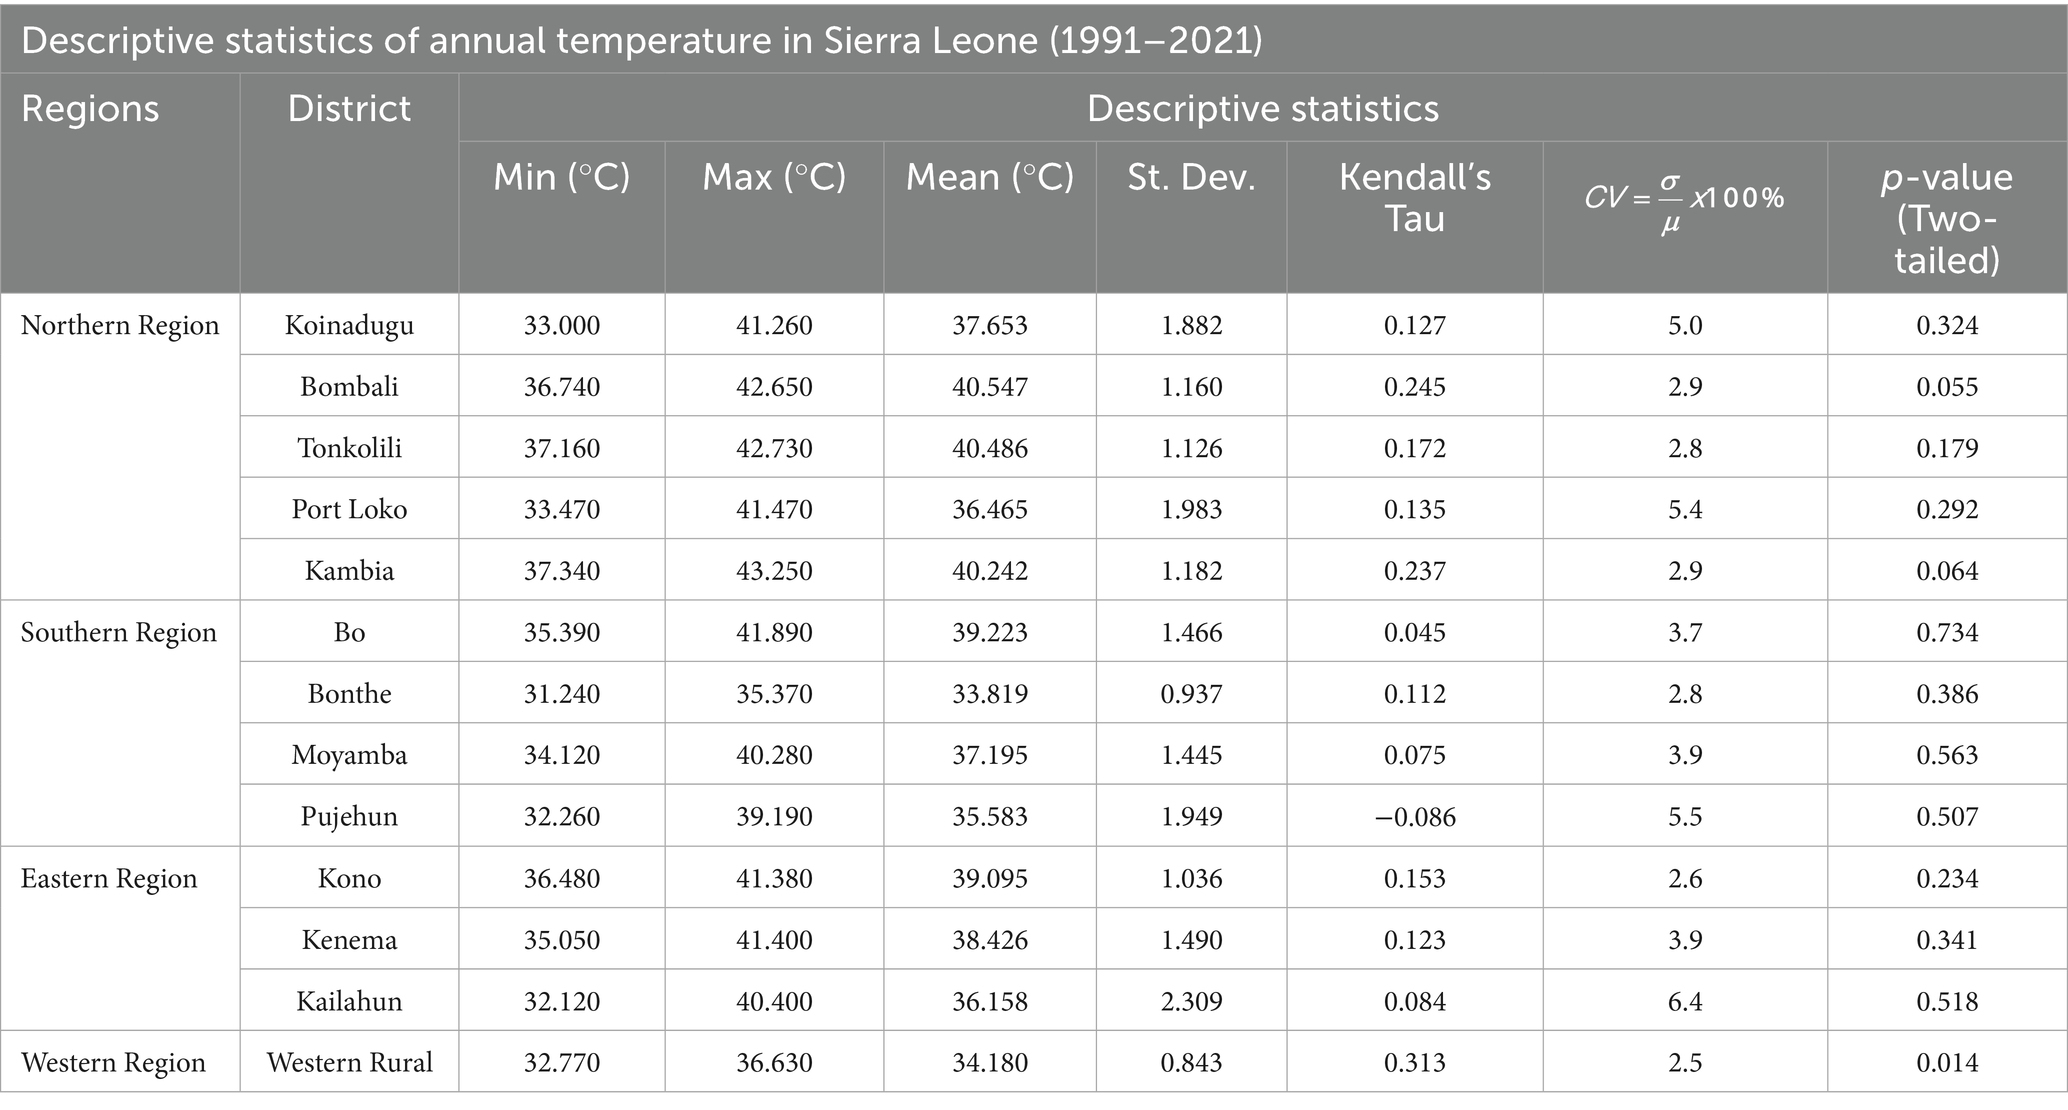
Table 5 presents key descriptive statistics and trend analyses of annual temperature across Sierra Leone’s districts over the past 30 years. Mean temperatures ranged from approximately 33.8°C (Bonthe) to 40.5°C (Bombali), with low to moderate interannual variability (SDs between 0.8°C and 2.3°C). Most districts showed weak positive temperature trends, though only Western Rural and Western Urban (τ = 0.313, p = 0.014) exhibited statistically significant increases. These results indicate a gradual and spatially uneven warming pattern, with more pronounced changes in the Western region, which represents an important consideration for climate-sensitive infrastructure planning. To capture spatial variability and support a regionally tailored framework for assessing unpaved road vulnerability to temperature-related climate stress, one district per region was selected based on the highest CoV: Port Loko (North, 5.4%), Pujehun (South, 5.5%), Kailahun (East, 6.4%), and Western Rural (West, 2.5%). As presented in Table 6, these districts exhibited distinct trends: Port Loko showed moderate warming, Pujehun a slight cooling trend, Kailahun a stronger warming signal, and Western Rural the most significant warming (τ = 0.313, Sen’s slope = 53.488, p = 0.014). This strategic selection improved analytical focus, reduced intra-regional redundancy, and strengthened the framework’s ability to reflect varied climate risks.
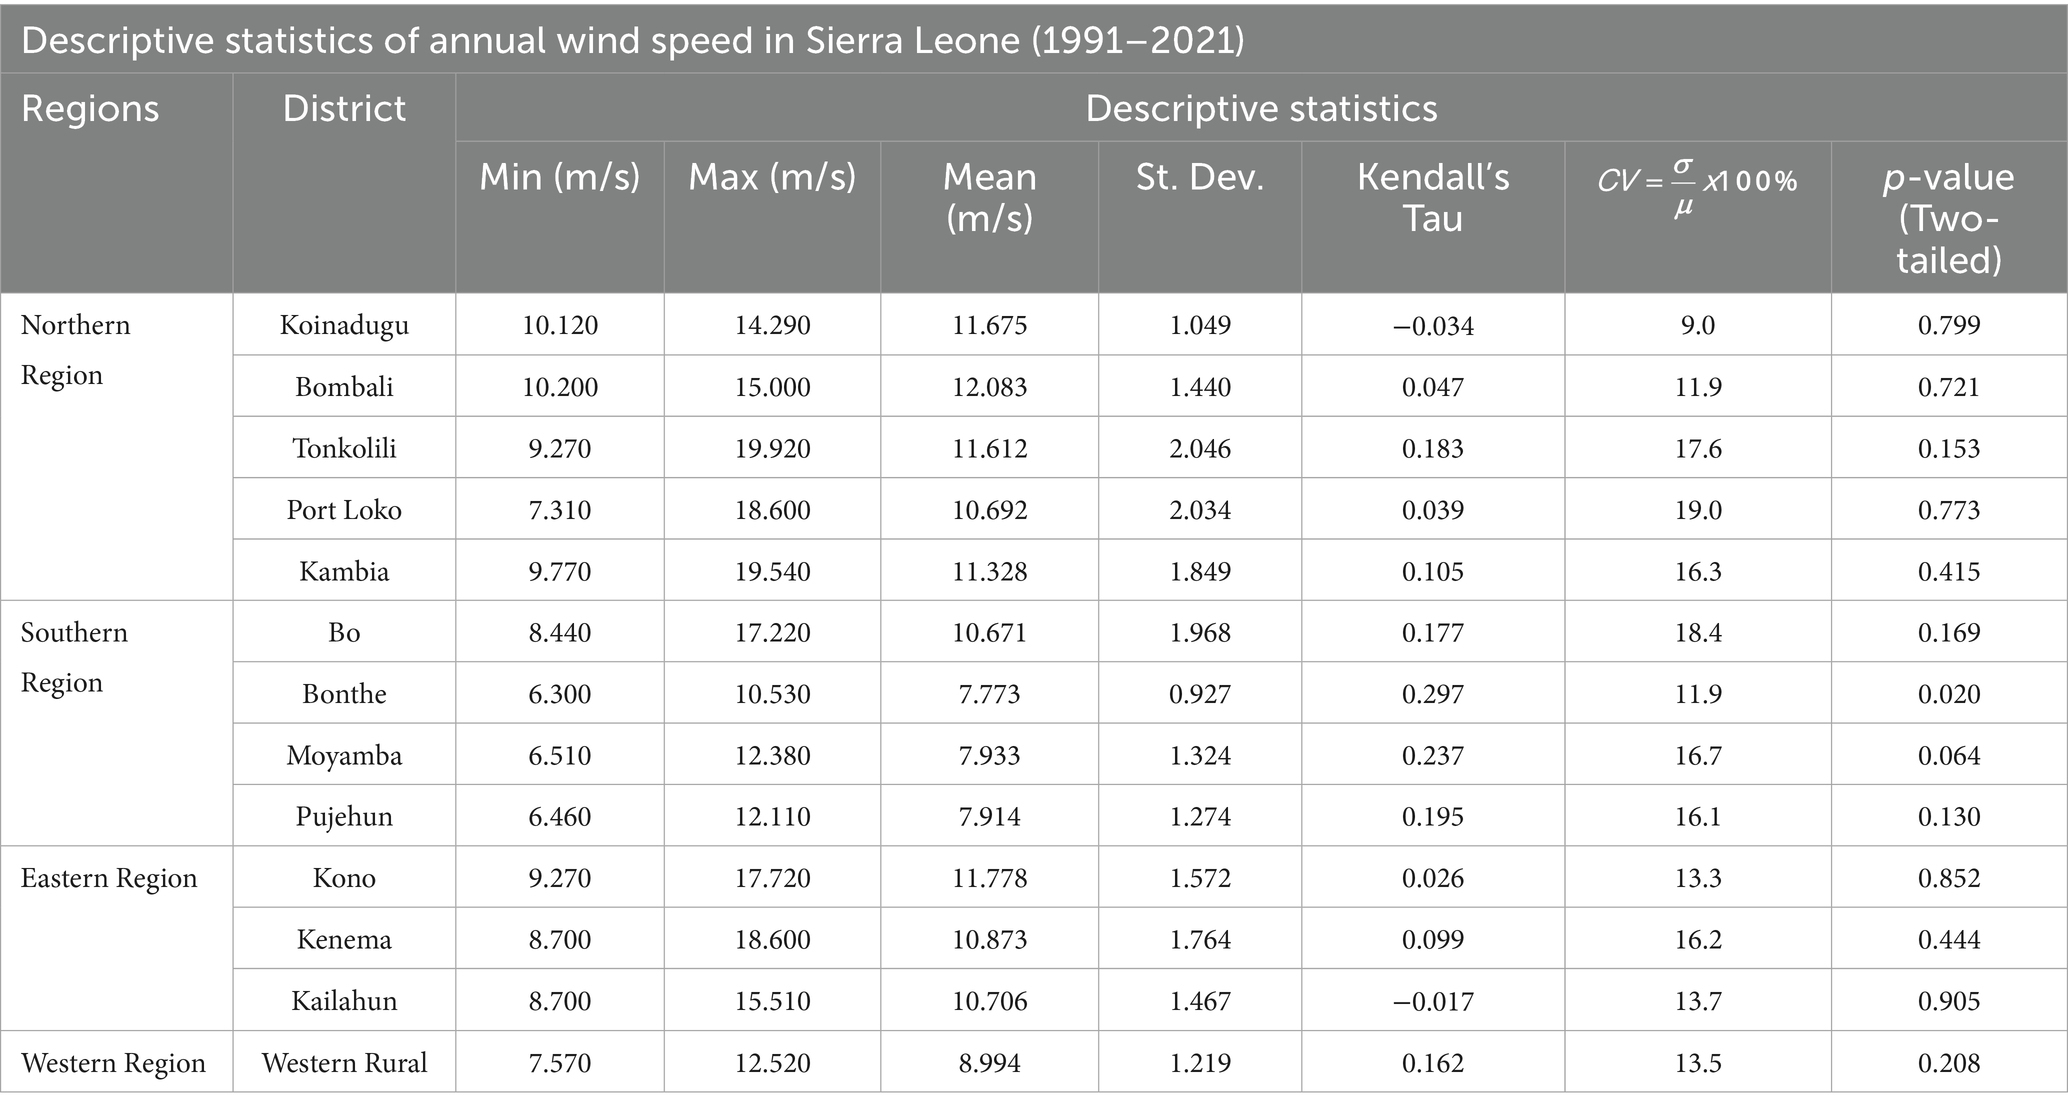
Table 6 summarizes the descriptive statistics and trend analyses of annual wind speed across Sierra Leone’s districts from 1991 to 2021. Mean wind speeds ranged from 7.77 m/s in Bonthe to 12.08 m/s in Bombali, with variability levels (SD) between 0.93 m/s and 2.05 m/s. Most districts exhibited weak and statistically insignificant trends. However, Bonthe stood out with a statistically significant increasing trend (τ = 0.297, p = 0.020), whereas other districts, such as Bo, Kenema, Port Loko, and Western Rural exhibited weak positive trends, none of which reached statistical significance.
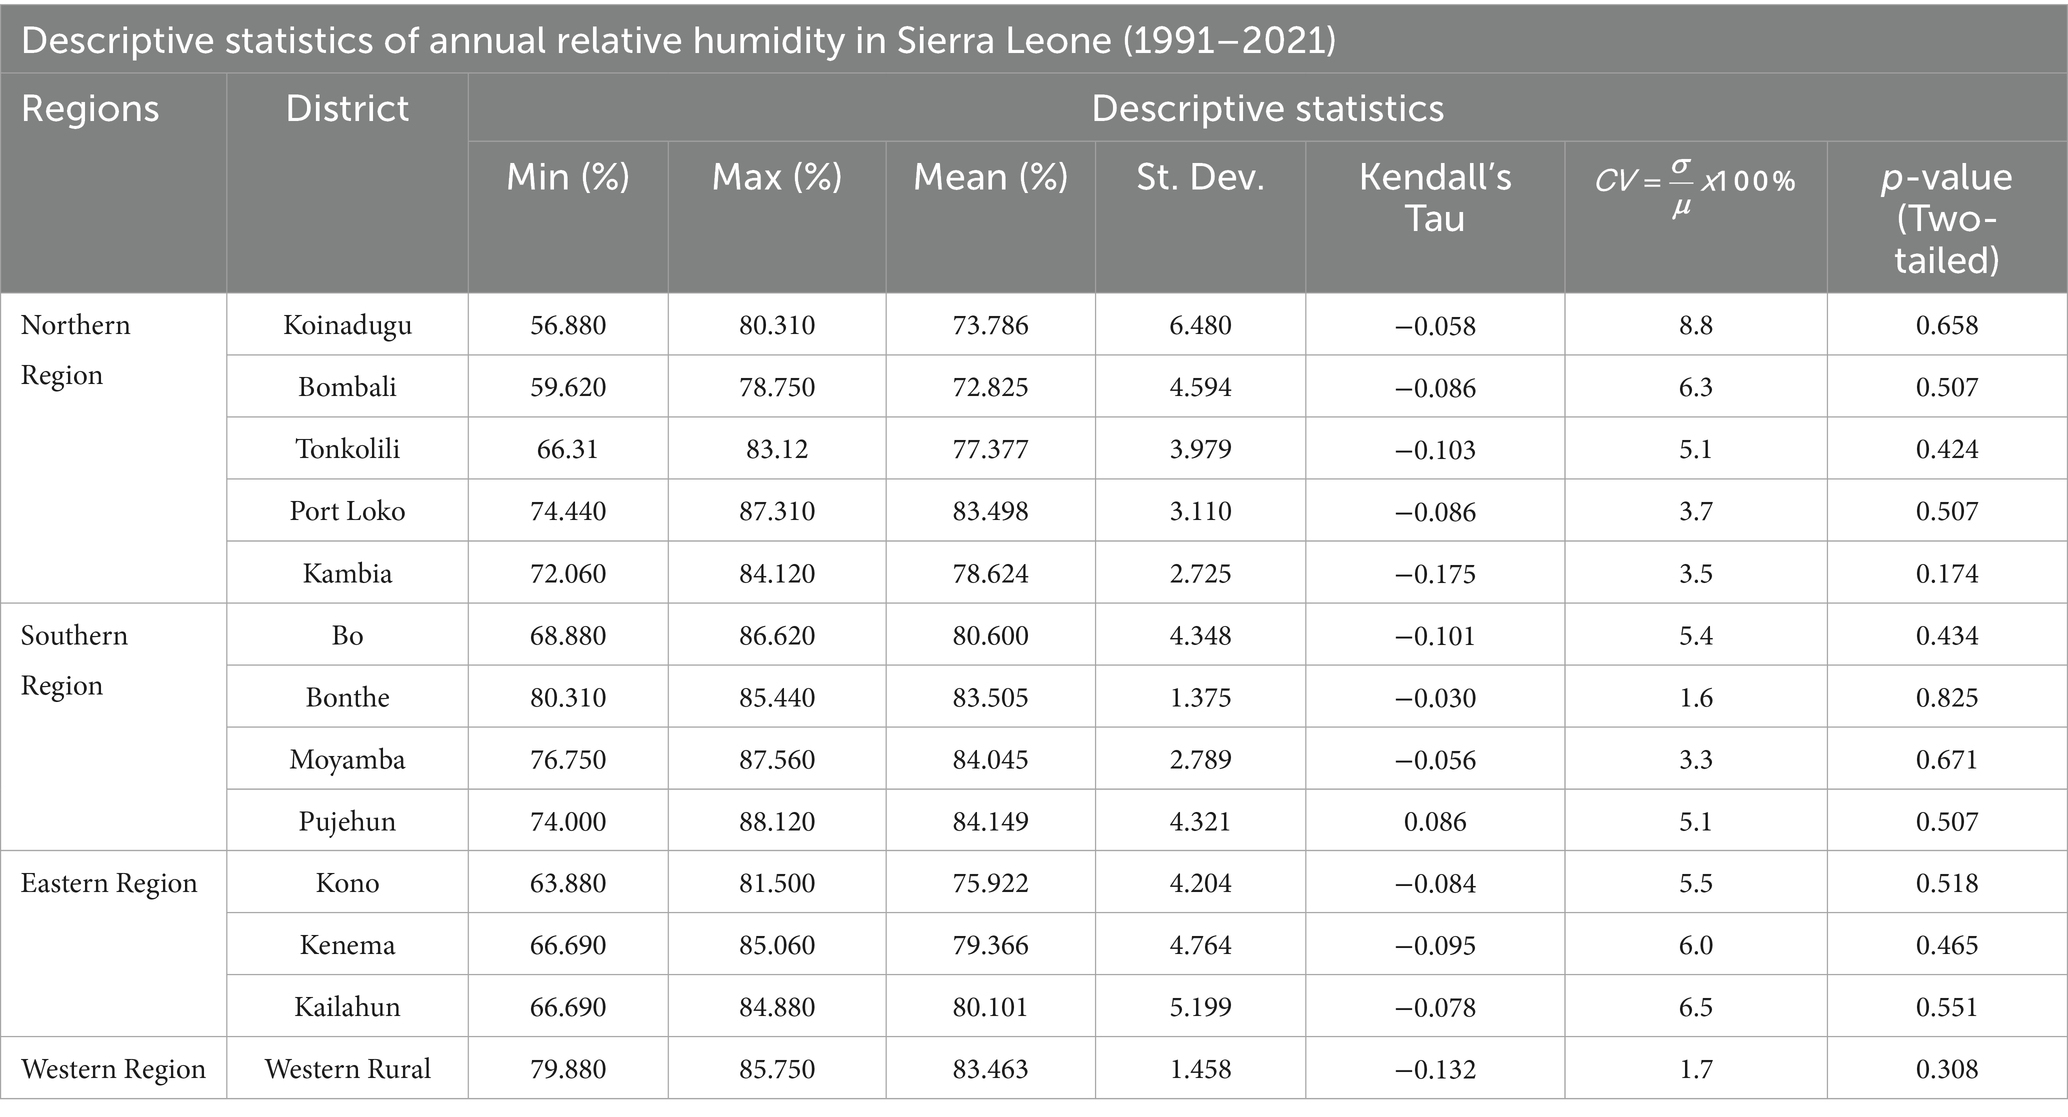
Table 7 presents descriptive statistics and trend analyses of annual relative humidity across Sierra Leone’s districts from 1991 to 2021. Mean relative humidity ranged from 72.8% in Bombali to 84.1% in Pujehun, with SDs between 1.38 and 6.48%, indicating low to moderate interannual variability. Most districts exhibited weak negative trends, suggesting slight declines in relative humidity over time. However, none of the trends were statistically significant (p > 0.05). The strongest decreasing trends were observed in Kambia (τ = −0.175, p = 0.174) and Western Rural (τ = −0.132, p = 0.308), while Pujehun was the only district to show a weak positive trend (τ = 0.086, p = 0.507). These results suggest a broadly consistent but statistically inconclusive pattern of declining humidity, with potential implications for evapotranspiration, dust generation, and overall moisture conditions relevant to road surface stability and environmental planning.
To develop a regionally responsive climate risk framework for unpaved roads, one district per region was selected based on the highest relative humidity variability: Koinadugu (North, SD = 6.48%), Pujehun (South, 4.32%), Kailahun (East, 5.20%), and Western Rural (West, 1.46%). These districts show the largest interannual humidity fluctuations (1991–2021), reflecting potential moisture stress across ecological zones. Kendall’s tau trend analysis revealed weak, statistically insignificant changes, with negative values in Koinadugu, Kailahun, and Western Rural and a slight positive trend in Pujehun (τ = 0.086, p = 0.507). Though not significant, selecting these districts captures spatial variability critical for assessing moisture-related vulnerability in unpaved roads. Mean relative humidity in the selected districts ranged from 73.8% (Koinadugu) to 84.1% (Pujehun), generally sufficient to support soil moisture retention. However, variability and slight declining trends, particularly in the northern and eastern districts, suggest periods of drying that can increase dust, reduce surface cohesion, and accelerate road deterioration. These results highlight relative humidity as a critical factor in climate vulnerability assessments for unpaved roads.
5.3 Results of predicted climate change and variability (exposure analysis)
This section presents the results of the forecast exposure to climate change and variability experienced by unpaved secondary roads in Sierra Leone. The exposure analysis of identified climate hazards under future climatic conditions was conducted using statistical time series ARIMA modeling for near-term point forecasts. The forecast covered 10 years and considered the economic outlook and the design life of unpaved secondary. The results are presented in Tables 8–11 for a forecasted period of 2021 to 2031.
As presented in Table 8, the 10-year ARIMA rainfall forecasts (2021–2031) for the selected vulnerable districts Port Loko, Pujehun, Kenema, and Western Rural revealed marked spatial variability and significant uncertainty, particularly in Western Rural, which is projected to receive the highest mean annual rainfall (4,118.82 mm) with an exceptionally wide 95% confidence interval (CI) of 896.13–13,160.13 mm, signaling a high likelihood of extreme rainfall events. In addition, the other districts, Port Loko (3,786.89 mm), Pujehun (3,418.58 mm), and Kenema (3,380.88 mm), exhibited considerable interannual fluctuations, with forecast ranges showing early-year peaks gradually stabilizing toward 2031. These rainfall projections feed directly into the unpaved road vulnerability assessment framework by identifying districts most exposed to climate-induced stressors such as erosion, surface degradation, and drainage failure. The incorporation of forecast trends and uncertainty enabled more region-specific and forward-looking adaptation strategies for enhancing the resilience of road infrastructure under future climate variability.
As shown in Table 9, the 10-year ARIMA temperature forecasts (2021–2031) for Port Loko, Pujehun, Kenema, and Western Rural revealed modest spatial variability, which was less pronounced than that for rainfall. Port Loko shows the greatest fluctuation, with projected temperatures ranging from 36.43°C to 38.09°C, above its baseline of 36.47°C. Pujehun ranged from 34.58°C to 35.51°C (baseline: 35.58°C), whereas Kenema’s forecast narrowed to 36.07°C–36.11°C, slightly below its 36.16°C baseline. Western Rural remained stable at 34.16°C, slightly lower than its 34.18°C baseline, suggesting minimal change or slight cooling. These projections, with 95% CIs, inform the vulnerability assessment by identifying potential temperature-related impacts, such as cracking and material degradation, on unpaved roads. The overall trend indicates a gradual increase in mean surface temperatures across the country, supported by both observational and model-forecasted data, which aligns with increased temperature projections for West African regions (USAID, 2017; Stoerk et al., 2018).
As shown in Table 10, the 10-year ARIMA wind speed forecasts (2021–2031) for Port Loko, Pujehun, Kenema, and Western Rural indicated relatively low spatial variability compared to that of rainfall and temperature. In Port Loko (Northern region), projected mean annual wind speeds fluctuated around 10.40 m/s, which is slightly below the historical baseline of 10.69 m/s. Pujehun (Southern region) forecasts ranged near 7.77 m/s, which is marginally lower than the baseline of 7.91 m/s. Kenema (Eastern region) showed a projected mean of 11.36 m/s, slightly above its historical baseline of 10.87 m/s. In Western Rural, the forecast stabilized at 8.86 m/s, which is nearly equal to the 8.90 m/s baseline. As with the rainfall and temperature models, the ARIMA wind speed forecasts included 95% CIs for various return periods. These projections are critical for the road vulnerability assessment framework, particularly in evaluating the potential influence of wind-driven erosion, dust dispersion, and structural impacts on exposed road surfaces and drainage systems.
As presented in Table 11, the 10-year ARIMA relative humidity forecasts (2021–2031) for Port Loko, Bo, Kailahun, and Western Area show minimal spatial variability compared to that of the other climate parameters. In Port Loko (Northern region), the projected mean annual relative humidity was approximately 73.75%, closely aligning with the historical baseline of 73.79%. Bo (Southern region) exhibited forecasts ranging from 80.43 to 81.33%, which was similar to the baseline mean of 80.60%. In Kailahun (Eastern region), the projected values ranged from 80.02 to 82.73%, which were slightly above the baseline of 80.10%. For the Western Area, the forecasts remained stable between 83.46 and 83.63%, consistent with the baseline of 83.46%. As with the temperature, rainfall, and wind speed models, the ARIMA relative humidity forecasts included 95% CIs across various return periods. These projections are vital for informing the road vulnerability assessment framework, particularly in evaluating moisture-related impacts such as subgrade weakening, surface slipperiness, and the potential for material degradation in high-humidity environments.
6 Discussion
As presented in Table 3, the consistent occurrence of at least 23 weather-related disasters per decade underscores the frequency and intensity of climatic events in Sierra Leone and presents significant implications for the resilience of unpaved roads. Rainfall, particularly in terms of duration and intensity, is a primary driver of road surface erosion (Zhao et al., 2021). Over the past four decades, the rise in intense single-day rainfall events has led to frequent flooding—most notably in the Western and Southern regions, which recorded 18 and 14 flood events respectively, likely accelerating the degradation of unpaved roads. Soil erosion is influenced by factors such as soil type, clay content, plasticity, particle size distribution, surface compaction, traffic load, and speed (Ngezahayo et al., 2019). However, due to logistical and data limitations, detailed soil attribute data for the study area were unavailable, necessitating the use of proxy indicators. The underlying geology, dominated by weathered granitic, metamorphic, and sedimentary rocks, has a high erodibility potential (Jalloh et al., 2013), and when combined with unbound road surfaces, unlined drainage, and vulnerable geometry, the erosion risk reaches a high level. Increased precipitation-related hazards such as flooding and storms further exacerbate this risk. Observed data indicate that rainfall has increased across all regions of Sierra Leone, a trend that may be linked to the ENSO phenomenon, which shifts the ITCZ and alters rainfall distribution patterns (Timmermann et al., 2018). For the road sector, higher rainfall levels intensify erosion and sedimentation, washing away surface materials and embankments, narrowing and lowering roadways, and depositing debris in drainage systems, thereby reducing their capacity and increasing flood risks (Zhang et al., 2019). In addition, such increases weaken the strength and stiffness of supporting soil layers, making roads more susceptible to deformation, rutting, cracking, and potholing under traffic loads. These impacts reduce ride quality, safety, and service life while increasing the frequency and cost of maintenance interventions.
The trend analysis of 30-year meteorological rainfall data and 10-year forecasted rainfall, as revealed by the Mann-Kendall trend tests and statistical time series ARIMA modeling (Tables 4, 8, respectively), revealed an overall pattern of increasing rainfall variability across all regions. These findings are consistent with previous research conducted in other Sub-Saharan African (SSA) regions, such as by Shongwe et al. (2011) and Endris et al. (2013). Shongwe et al. (2011) utilized RCM simulations to evaluate future changes in rainfall and temperature across southern Africa. They projected a 5 to 20% decrease in annual mean rainfall by the end of the 21st century, with particularly pronounced decreases in the Western and Southern regions, accompanied by increased rainfall variability and extremes, leading to more frequent and intense droughts and floods. Similarly, Endris et al. (2013) employed statistical downscaling techniques to analyze future changes in rainfall and temperature over East Africa using global climate model outputs. They forecasted a 10 to 15% decline in annual mean rainfall by the end of the 21st century, primarily in the northern and eastern regions, alongside alterations in rainfall seasonality and variability, resulting in more erratic and unpredictable patterns. The forecasted increase in rainfall variability, combined with more frequent and intense rain events, poses significant challenges for unpaved roads, leading to accelerated erosion, higher flood risks, and road surface deterioration. These issues heighten safety concerns, escalate maintenance expenses, impede access to essential services, and threaten the long-term viability of unpaved road networks, underscoring the importance of proactive resilience-building strategies and infrastructure investments.
In the case of temperature, the observed upward trends across Sierra Leone, as indicated in Table 5, are consistent with regional climate dynamics reported by Solomon et al. (2022) in their study on the Mano River Union (MRU) sub-region, which may have significant implications for unpaved secondary roads, which are constructed with unbound granular materials. Similar findings from the literature indicate that elevated temperatures contribute to increased evaporation rates, which reduce the moisture content essential for maintaining the cohesion and structural integrity of such road surfaces (de Abreu et al., 2022; Solomon et al., 2022). As a result, roads become increasingly dusty, brittle, and prone to raveling and surface erosion under both climatic stress and traffic loading. The drying out of surface layers also weakens the bearing capacity of the road, making it vulnerable to deformation, cracking, and accelerated deterioration. These temperature-induced vulnerabilities underscore the need for adaptive design standards and improved maintenance strategies to ensure the resilience of rural road networks in Sierra Leone and across the MRU region in the face of rising climate stressors.
The 10-year forecasts, as shown in Table 9, indicate an increase in temperature across all the regions in the country, which is consistent with Solomon et al. (2022), who identified Sierra Leone as experiencing significant climatic variability within the Mano River Region. The forecast results are also consistent with continental projections. James and Washington (2013) predicted a 1.5°C to 5°C rise in mean annual temperature across Africa by the end of the century, with the greatest warming in the north and south and more frequent extremes. Engelbrecht et al. (2015) projected a 2°C to 6°C increase in southern Africa, particularly in interior and Western regions, with changes in seasonality. Lennard et al. (2018) estimated a 1.5°C to 4.5°C rise in East Africa, with peak warming in northern and eastern areas and a longer, earlier warm season. Such trends underscore the need to integrate climate forecasts into infrastructure planning, particularly for climate-sensitive sectors such as transport. Elevated temperatures pose substantial risks to unpaved road infrastructure in Sierra Leone by accelerating surface degradation through increased evaporation, reduced soil moisture, dust generation, and heightened vulnerability to erosion and siltation during heavy rainfall (Le Roux et al., 2019b; Le Roux et al., 2019a). These impacts are likely to increase maintenance demands, compromise structural integrity, disrupt transport services, and contribute to environmental degradation (Mark Partington et al., 2018). Therefore, incorporating forecasted climate variables such as temperature into a vulnerability assessment framework is essential for identifying high-risk road segments and informing the design, maintenance, and adaptation of resilient road infrastructure under changing climate conditions.
For wind speed, the trend analysis (Table 6) revealed a weak to moderate increase across all the districts over the observed period, with Western Rural exhibiting the strongest signal (τ = 0.162, p = 0.208). Although the trends were not statistically significant, their inclusion was critical for capturing spatial differences in wind-related climate stress, reducing intra-regional redundancy, and improving the framework’s sensitivity to localized climatic dynamics. Mean wind speeds across the selected districts ranged from 8 m/s to over 12 m/s, indicating moderate to strong conditions on the Beaufort scale, sufficient to sway branches and raise dust as reported by Suomi and Vihma (2018). These findings underscore wind exposure as a relevant stressor, enhancing the climate vulnerability framework for unpaved road planning and resilience. Additionally, the findings align with those of similar studies in sub-Saharan Africa. For example, Libanda (2023) observed seasonal wind speed variations in Zambia, with peak values in August–September, whereas Moses and Parida (2016) reported consistently strong wind speeds (13.80–21.69 m/s) in Botswana, supporting the variability of wind energy in the region. These comparisons suggest that observed wind speed patterns in Sierra Leone are consistent with broader regional trends. The increasing variability in wind speed over time may be linked to factors such as climate change, topography, and land use changes. Shifts in sea surface temperatures and atmospheric pressure gradients (Hayes et al., 1989). Sierra Leone’s diverse terrain, including coastal marsh, interior plain, plateau and mountainous areas, also contributes to localized variations in wind speed and direction (Amara et al., 2020). Moreover, land cover changes, particularly deforestation and urban expansion, may have reduced surface roughness and altered wind flow dynamics (Gbanie et al., 2018). These changes have practical implications for unpaved roads, as stronger winds can accelerate surface erosion, displace loose materials, increase maintenance demands, reduce visibility, and pose safety and health risks due to dust dispersion (Cardozo and Sánchez, 2019; de Abreu et al., 2022).
The 10-year forecasts show strong winds and moderate gales can cause significant damage to the ecosystem, aligning with findings from other studies, such as Suomi and Vihma (2018). These forecasts are consistent with the findings of Solomon et al. (2022), who investigated climatic variabilities in the MRU regions and their implications on socioeconomic development sectors. The heightened forecasted wind speed, particularly exceeding thresholds for wind erosion in all regions, poses significant ramifications for unpaved roads. High wind speeds elevate erosion risk, potentially leading to surface instability and degradation, while also increasing dust generation, creating hazardous driving conditions and health risks for nearby communities. These challenges necessitate proactive measures, including erosion control, improved road design, and regular maintenance, to mitigate adverse impacts and enhance road resilience.
For relative humidity, the observed decline in trends (Table 7) is consistent with prior studies in sub-Saharan Africa. Ndebele-Murisa et al. (2011) reported a decrease of 0.8% per decade over Lake Kariba, alongside increased evaporation, while Nicholson et al. (2018) found a continental decline of 0.4% per decade, particularly pronounced in the Sahel and Southern Africa. These regional trends mirror the slight but consistent decreases in relative humidity seen in Sierra Leone over the observed period. This decline is likely driven by changes in atmospheric circulation, moisture transport, and land surface feedbacks (Nicholson et al., 2018), although it could be driven by variations in temperature, wind speed, and cloud cover (Ndebele-murisa et al., 2011). Reduced humidity has direct implications for unpaved roads: lower moisture levels decrease cohesion in unbound granular materials such as gravel and sand, leading to increased dust emission, surface erosion, and deterioration (Lera and Kuleno, 2020). Soils in unpaved roads may also dry, contract, and crack, undermining load-bearing capacity and increasing vulnerability to deformation under traffic. These findings emphasize the importance of incorporating relative humidity trends into vulnerability assessments for unpaved road infrastructure.
The forecast from the statistical time series ARIMA-based model (Table 11) is consistent with regional climate studies across the MRU. Solomon et al. (2022) observed significant climatic variability within the MRU region, highlighting shifts in relative humidity as a key concern for Sierra Leone’s climate future. These projections are further supported by Abatan et al. (2016), who used global and regional climate models to estimate a 0.5–2.5% increase in annual mean relative humidity across West Africa by the end of the 21st century, particularly in coastal and central zones, driven by evolving monsoon circulation, moisture convergence, and land-atmosphere feedbacks. In Sierra Leone, the near-term ARIMA forecasts reveal modest variability in relative humidity, which may significantly affect unpaved road infrastructure. Humidity fluctuations can reduce surface cohesion, intensify erosion, and accelerate material degradation. These findings highlight the importance of incorporating relative humidity projections into road vulnerability assessments and maintenance planning frameworks to enhance the climate resilience of unpaved roads.
The climate trend analysis (1991–2021) revealed significant spatial and temporal variability in rainfall, temperature, wind speed, and relative humidity across Sierra Leone, with the most climate-variable districts Port Loko, Pujehun, Kailahun, and Western Rural facing critical stressors, such as erosion, soil drying, and dust generation that undermine unpaved road performance. Building on this data-driven foundation, the proposed stakeholder-centered framework actively engages communities along the road and other key stakeholders to capture their perspectives on climate change and variability, as well as the implications for unpaved roads in their areas. This inclusive approach enriches the technical analysis with local knowledge, ensuring that adaptation strategies reflect on-the-ground realities. The framework assesses the current vulnerability of selected unpaved secondary roads, indicating high risks of accelerated deterioration without targeted adaptation. The 10-year climate forecast further projects an increase in the frequency and intensity of these stressors, heightening the urgency for proactive measures. Uniquely in Sub-Saharan Africa, this study connects climate variability to geotechnical failure mechanisms, attributing observed and projected changes to drivers such as ENSO, topography, and land use. The resulting cost-effective, user-friendly tool integrates historical trends, forecasted climate data, engineering insights, and community perspectives to support regionally responsive adaptation and maintenance strategies for building climate-resilient unpaved road networks.
7 Conclusion
7.1 Practical implications
This research addresses limitations of existing climate risk assessment frameworks, such as those by the FHWA, Asian Development Bank, and World Bank, which often rely on proprietary software and high-end computing infrastructure, making them suitable for Sierra Leone’s data-scarce, capacity-limited, and topographically complex environment. In response, a pioneering, IPCC-endorsed, five-phase climate vulnerability assessment framework was developed, tailored to unpaved secondary roads in resource-constrained settings. The framework integrates environmental, infrastructural, socioeconomic, and community perception indicators and combines GPS-enabled field data collection, spatial analysis, and short-term climate forecasting using open-source tools, including QGIS, QField, KoBoToolbox, and Microsoft Power BI. Analysis of historical, current, and projected climate conditions highlighted significant regional disparities in the hazards, with vulnerability indices for four assessed roads ranging from 3 to 4, indicating high susceptibility to climate impacts. Visualization through maps, charts, and dashboards strengthens decision-making, while the case studies confirm the framework’s practicality and scalability. By embedding community perspectives, applying statistical methods such as ARIMA and Mann-Kendall tests, and linking climate variability to geotechnical failure mechanisms, the framework offers a cost-effective, participatory, and transferable approach for prioritizing maintenance, guiding targeted adaptation, and advancing climate-resilient infrastructure planning in Sierra Leone and similar contexts across the Global South.
7.2 Policy implications
This research recommends that the SLRA adopt the proposed climate risk and vulnerability assessment framework to strengthen the resilience of the country’s unpaved secondary roads. The framework is practical, cost-effective, and adaptable to Sierra Leone’s diverse terrains, and it also addresses capacity gaps, enhances data collection, and fosters community participation to support informed decision-making and adaptation planning. Aligned with the National Adaptation Plan, Nationally Determined Contributions, and SDGs 9, 11, and 13, the framework enables policymakers to design climate-resilient road networks that safeguard rural connectivity, economic activity, and disaster preparedness. Beyond Sierra Leone, the framework offers a scalable and replicable model for the Global South, particularly sub-Saharan Africa, where similar climatic, infrastructural, and capacity challenges exist. By integrating scientific analysis with community knowledge and policy priorities, it provides a transferable template for embedding locally grounded climate considerations into transport strategies, advancing resilient infrastructure, promoting equitable climate adaptation, and supporting sustainable economic development.
7.3 Strengths and weaknesses
This study presents a flexible and practical framework for assessing climate risk and vulnerability in Sierra Leone’s unpaved secondary roads. Key strengths include its real-world applicability, as demonstrated through case studies; alignment with national policy priorities; cost-effectiveness through the use of open-source technologies; and holistic approach that integrates technical, environmental, and socio-economic factors. Its scalability further positions it as a potential model for application in similar global contexts. However, this study also acknowledges several limitations, including the absence of direct stakeholder validation, challenges in data accessibility, resource constraints, a narrow focus limited to four case studies, limited community engagement, and untested scalability. Future research should address these gaps by incorporating stakeholder validation, enhancing community involvement, testing scalability across diverse terrains, and improving data availability and resource support.
Data availability statement
The original contributions presented in the study are included in the article/supplementary material, further inquiries can be directed to the corresponding author.
Author contributions
PK: Conceptualization, Data curation, Formal analysis, Investigation, Methodology, Validation, Visualization, Writing – original draft. YT: Conceptualization, Funding acquisition, Project administration, Resources, Supervision, Validation, Writing – review & editing. FB-A: Conceptualization, Data curation, Project administration, Resources, Software, Supervision, Validation, Writing – review & editing. DO: Conceptualization, Project administration, Resources, Supervision, Validation, Writing – review & editing.
Funding
The author(s) declare that financial support was received for the research and/or publication of this article. This research was funded by the Africa Centre of Excellence-Regional Transport Research and Education Centre Kumasi (ACE-TRECK) at the Kwame Nkrumah University of Science and Technology (KNUST), with support from the World Bank and the Government of Ghana.
Acknowledgments
I sincerely thank my co-authors for their invaluable contributions and, on their behalf, extend gratitude to ACE-TRECK, KNUST, for its academic and research support. We also gratefully acknowledge the Government of Ghana, with support from the World Bank, for the financial and institutional backing that has been instrumental in advancing this study.
Conflict of interest
The authors declare that this study received funding from the World Bank. The World Bank had no involvement in the study design, data collection, analysis, interpretation, writing of the article, or the decision to submit it for publication.
Generative AI statement
The author(s) declare that no Gen AI was used in the creation of this manuscript.
Any alternative text (alt text) provided alongside figures in this article has been generated by Frontiers with the support of artificial intelligence and reasonable efforts have been made to ensure accuracy, including review by the authors wherever possible. If you identify any issues, please contact us.
Publisher’s note
All claims expressed in this article are solely those of the authors and do not necessarily represent those of their affiliated organizations, or those of the publisher, the editors and the reviewers. Any product that may be evaluated in this article, or claim that may be made by its manufacturer, is not guaranteed or endorsed by the publisher.
References
Abatan, A. A., Abiodun, B. J., Lawalc, K. A., and Gutowski, W. J. (2016). Trends in extreme temperature over Nigeria from percentile-based threshold indices. Int. J. Climatol. 36, 2527–2540. doi: 10.1002/joc.4510
Adam, H. (2022). Autoregressive integrated moving average (ARIMA) prediction model. Investopedia, 1–10. Available online at: https://www.investopedia.com/terms/a/autoregressive-integrated-moving-average-arima.asp#:~:text=An autoregressive integrated moving average%2C or ARIMA%2C is a statistical,or to predict future trends
Amara, D. M. K., Ullah, K., and Yushu, Z. (2020). Rainfall erosivity estimation for Sierra Leone using non-parametric indices. Theor. Appl. Climatol. 139, 221–236. doi: 10.1007/s00704-019-02960-3
Asian Development Bank (ADB) (2011). Guidelines for climate-proofing investment in the transport sector: road infrastructure projects. doi: 10.1016/0032-0633(95)90014-4
Bech Padrosa, S. (2009). Infrastructures in Africa: Analysis and evolution of the road network in Sierra Leone. Available online at: https://core.ac.uk/download/pdf/41802741.pdf (Retrieved May 13, 2025).
Cardozo, J. I. H., and Sánchez, D. F. P. (2019). An experimental and numerical study of air pollution near unpaved roads. Air Qual. Atmos. Health 12, 471–489. doi: 10.1007/s11869-019-00678-9
Climate Data Store (CDS) (2022). Copernicus Climate Change Service (C3S). Available online at: https://cds.climate.copernicus.eu/#!/home (Retrieved August 23, 2024).
Climate System Analysis Group (CSAG). (2020). National climate risk and vulnerability (CRV) assessment framework. University of Cape Town. Available online at: https://www.csag.uct.ac.za/wp-content/uploads/2020/10/CRV-Assessment-Framework-FINAL-08-May-2020.pdf (Retrieved June 4, 2024).
Comité Permanent Inter-états de Lutte contre la Sécheresse dans le Sahel [CILSS] (2016). Landscapes of West Africa: Window on a changing world, 1–28.
Coordinated Regional Climate Downscaling Experiment (Cordex) (2022). Global Climate Models (GCM), Regional Climate Models (RCM) and Empirical Statistical Downscaling (ESD): Regional climate change simulations for CORDEX domains. Available online at: https://cordex.org/ (Accessed August 5, 2024).
de Abreu, V. H. S., Santos, A. S., and Monteiro, T. G. M. (2022). Climate change impacts on the road transport infrastructure: a systematic review on adaptation measures. Sustainability 14:8864. doi: 10.3390/su14148864
de Sherbinin, A., Bukvic, A., Rohat, G., Gall, M., McCusker, B., Preston, B., et al. (2019). Climate vulnerability mapping: a systematic review and future prospects. Wiley Interdiscip. Rev. Clim. Chang. 10:600. doi: 10.1002/wcc.600
Delforge, V., Wathelet, V., Below, R., Sofia, C. L., and Tonnelier, M. (2023). The Emergency Events Database (EM-DAT), Centre for Research on the Epidemiology of Disasters (CRED), 0–16. Available online at: https://www.emdat.be/ (Accessed April 12 2024).
Emergency Events Database (EM-DAT). (2023). The international disaster database. Centre for Research on the Epidemiology of Disasters (CRED). Available online at: http://www.emdat.be (Retrieved November 19, 2024).
Endris, H. S., Omondi, P., Jain, S., Lennard, C., Hewitson, B., Chang’a, L., et al. (2013). Assessment of the performance of CORDEX regional climate models in simulating east African rainfall. J. Clim. 26, 8453–8475. doi: 10.1175/JCLI-D-12-00708.1
Engelbrecht, F., Adegoke, J., Bopape, M. J., Naidoo, M., Garland, R., Thatcher, M., et al. (2015). Projections of rapidly rising surface temperatures over Africa under low mitigation. Environ. Res. Lett. 10:085004. doi: 10.1088/1748-9326/10/8/085004
European Environment Agency (2022). Climate change adaptation – Europe climate adaptation platform (Climate-ADAPT). Available online at: https://climate-adapt.eea.europa.eu/ (Retrieved April 19, 2025).
Federal Highway Administrations (FHWA) (2017). Vulnerability assessment and adaptation framework (FHWA-HEP-18-020). Available online at: https://www.fhwa.dot.gov/environment/sustainability/resilience/adaptation_framework/ (Retrieved September 12, 2024).
Fleming, C. S., Regan, S. D., Freitag, A., and Burkart, H. (2023). Indicators and participatory processes: a framework for assessing integrated climate vulnerability and risk as applied in Los Angeles County, California. Nat. Hazards 115, 2069–2095. doi: 10.1007/s11069-022-05628-w
Gaarder, J. E., Hygen, H. O., Bohne, R. A., and Kvande, T. (2023). Building adaptation measures using future climate scenarios—a scoping review of uncertainty treatment and communication. Buildings 13:460. doi: 10.3390/buildings13061460
Gbanie, S. P., Griffin, A. L., and Thornton, A. (2018). Impacts on the urban environment: land cover change trajectories and landscape fragmentation in post-war Western area, Sierra Leone. Remote Sens 10:129. doi: 10.3390/rs10010129
Gebrechorkos, S. H., Hülsmann, S., and Bernhofer, C. (2019). Long-term trends in rainfall and temperature using high-resolution climate datasets in East Africa. Sci. Rep. 9:11376. doi: 10.1038/s41598-019-47933-8
Gobo, G. (2023). Mixed methods and their pragmatic approach: is there a risk of being entangled in a positivist epistemology and methodology? Limits, pitfalls and consequences of a bricolage methodology. Forum Qual. Sozialforsch. 24:4005. doi: 10.17169/fqs-24.1.4005
Haq, G., Cinderby, S., Opiyo, R., and Ngabirano, A., (2022). Using creative participatory approaches for inclusive climate-resilient transport in Africa: guidelines for practitioners. University of York. Available online at: https://www.sei.org/publications/creative-approaches-for-inclusive-transport-in-africa/ (Accessed June 4, 2023).
Hayes, S. P., McPhaden, M., Wallace, J. M., and Picaut, J. (1989). The influence of sea-surface temperature on surface wind in the equatorial Pacific Ocean 3, 1500–1506.
IMF-Climate data (2022). Climate change data | Climate change indicators dashboard. Available online at: https://climatedata.imf.org/pages/climatechange-data (Accessed September 19, 2024).
Intergovernmental Panel on Climate Change (IPCC). (2022). IPCC task group on data support for climate change assessments. Available online at: https://www.ipcc.ch/data/ (Accessed October 22, 2024).
Jalloh, A. B., Sasaki, K., Thomas, M. O., and Jalloh, Y. (2013). The Geology, Mineral Resources of Sierra Leone and how the Resources can be Used to Develop the Nation. Procedia Earth and Planetary Science 6, 131–138. doi: 10.1016/j.proeps.2013.01.018
James, R., and Washington, R. (2013). Changes in African temperature and precipitation associated with degrees of global warming. Clim. Chang. 117, 859–872. doi: 10.1007/s10584-012-0581-7
Kamara, P. M., Tuffour, Y. A., Baffour-Ata, F., and Obeng, D. A. (2025). Assessing local community perspectives on climate change and variability: implications for unpaved secondary roads in Sierra Leone. Sustain. Futures 10:100785. doi: 10.1016/j.sftr.2025.100785
Khemesh, S. (2025). Climate risk assessment using geospatial data and predictive analytics: minimizing climate migration. doi: 10.13140/RG.2.2.13926.54088
Le Roux, A., Khuluse-Makhanya, S., Arnold, K., Engelbrecht, F., Paige-Green, P., and Verhaeghe, B. (2019a). A framework for assessing the risks and impacts of rural access roads to a changing climate. Int. J. Disaster Risk Reduction 38:101175. doi: 10.1016/j.ijdrr.2019.101175
Le Roux, A., Makhanya, S., Arnold, K., and Roux, M. (2019b). Climate adaptation: risk management and resilience optimisation for vulnerable road access in Africa: ReCAP visual assessment mannual. ReCAP. Available online at: https://research4cap.org/ral/CSIR-Consortium-2017-Climate-Adaptation-Final-Report-AfCAP-GEN2014C-v270317.pdf (Accessed November 22, 2023).
Lennard, C. J., Nikulin, G., Dosio, A., and Moufouma-Okia, W. (2018). On the need for regional climate information over Africa under varying levels of global warming. Environ. Res. Lett. 13:060401. doi: 10.1088/1748-9326/aab2b4
Lera, E. Z., and Kuleno, M. M. (2020). Cause and effects of unpaved road deterioration: a review. GSJ 8, 3104–3113. Available online at: https://www.globalscientificjournal.com/researchpaper/Cause_and_Effects_of_Unpaved_Road_Deterioration_a_review.Pdf
Libanda, B. (2023). Performance assessment of CORDEX regional climate models in wind speed simulations over Zambia. Model. Earth Syst. Environ. 9, 253–262. doi: 10.1007/s40808-022-01504-5
Logistics Cluster. (2019). Sierra Leone road assessment. Logistics Cluster. Available online at: https://www.lca.logcluster.org/23-sierra-leone-road-assessment (Retrieved May 14, 2023).
Madushani, S., Sandamal, K., and Rangajeewa, T. (2024). A genetic algorithm-based decision framework to incorporate climate impact on pavement maintenance planning. Period. Polytech. Transp. Eng. 52, 120–127. doi: 10.3311/pptr.22290
Mark Partington, R. P. F., Allan Bradley, R. P. F., and Eng, P. (2018). Analysis of a British Columbia resource road’s vulnerability to climate change: Tum tum Forest Service road PIEVC case study. (Technical Report No. 35). Vancouver, Canada: Innovations. Available online at: https://www2.gov.bc.ca/assets/gov/farming-natural-resources-and-industry/natural-resource-use/resource-roads/climate-change-1388 adaptation/fpi_tumtum_pievc_report_final.pdf
Moses, O., and Parida, B. P. (2016). Statistical modelling of Botswana’s monthly maximum wind speed using a four-parameter kappa distribution. Am. J. Appl. Sci. 13, 773–778. doi: 10.3844/ajassp.2016.773.778
NASA Langley Research Center. (2023). POWER Data Access Viewer. National Aeronautics and Space Administration. Available online at: https://power.larc.nasa.gov/data-access-viewer/ (Accessed October 24, 2024).
National Disaster Management Agency, Sierra Leone. (2023). NDMA embarks on vulnerability assessment in disaster-prone communities in Freetown. Available online at: https://ndma.gov.sl/2023/08/22/3797-bxyxpy/ (Retrived June 14, 2024).
Ndebele-Murisa, M. R., Mashonjowa, E., and Hill, T. (2011). The implications of a changing climate on the Kapenta fish stocks of Lake Kariba, Zimbabwe. Trans. R. Soc. S. Afr. 66, 1–9. doi: 10.1080/0035919X.2011.600352
Nelson, A., Lindbergh, S., Stephenson, L., Halpern, J., Arroyo, F. A., Espinet, X., et al. (2019). Coupling natural hazard estimates with road network analysis to assess vulnerability and risk: Case study of Freetown (Sierra Leone). Transportation Research Record 2673, 11–24. doi: 10.1177/0361198118822272
Ngezahayo, E., Ghataora, G. S., and Burrow, M. P. (2019). “Factors affecting erosion in unpaved roads.” In Proceedings of the 4th world congress on civil, structural, and environmental engineering (CSEE’19), paper no. ICGRE (Vol. 108, pp. 10–11159).
Ngezahayo, E., Ghataora, G., and Burrow, M. (2021). Modelling the effects of soil properties, rainfall and road geometry to erosion in unpaved roads. Int. J. Civil Infrastructure 4:015. doi: 10.11159/ijci.2021.015
Nicholson, S. E., Funk, C., and Fink, A. H. (2018). Rainfall over the African continent from the 19th through the 21st century. Glob. Planet. Chang. 165, 114–127. doi: 10.1016/j.gloplacha.2017.12.014
Nunfam, V. F. (2021). Mixed methods study into social impacts of work-related heat stress on Ghanaian mining workers: a pragmatic research approach. Heliyon 7:e06918. doi: 10.1016/j.heliyon.2021.e06918
Padrosa, S. B. (2009). Infrastructures in Africa: Analysis and evolution of the road network in Sierra Leone (Working Paper). Universitat Politècnica de Catalunya. Available online at: https://upcommons.upc.edu/bitstream/handle/2099.1/8183/01.pdf (Accessed July 20, 2024).
Paige-Green, P., and Verhaeghe, B. M. (2018). Making Africa’s roads more resilient to climate change. Available online at: https://researchspace.csir.co.za/server/api/core/bitstreams (Accessed February 23, 2024).
Research for Community Access Partnership (ReCAP) (2019). Manual for low volume roads-Policy, geometric design and road safety. Available online at: https://www.research4cap.org/ (Accessed November 28, 2024).
Shongwe, M. E., van Oldenborgh, G. J., Hurk, B., and van Aalst, M. (2011). Projected changes in mean and extreme precipitation in Africa under global warming. Part II: East Africa. J. Clim. 24, 3718–3733. doi: 10.1175/2010JCLI2883.1
Solomon, M., Abiodun, O. E., Olusina, J. O., and Olaleye, J. B. (2022). The future climatic variabilities in the Ano River union, its implications on socio-economic development. Geogr. Pannon. 26, 142–151. doi: 10.5937/gp26-36677
Stackhouse, P. W., and Kusterer, J. M. (2000). NASA-POWER data access viewer. NASA Langley ASDC User Services, 1. Available online at: https://power.larc.nasa.gov/data-access-viewer/ (Accessed May 8, 2024).
Stoerk, T., Wagner, G., and Ward, R. E. T. (2018). Recommendations for improving the treatment of risk and uncertainty in economic estimates of climate impacts in the sixth intergovernmental panel on climate change assessment report. Rev. Environ. Econ. Policy 12, 371–376. doi: 10.1093/reep/rey005
Středová, H., Podhrázská, J., Chuchma, F., Středa, T., Kučera, J., Fukalová, P., et al. (2021). The road map to classify the potential risk of wind erosion. ISPRS Int. J. Geo Inf. 10:269. doi: 10.3390/ijgi10040269
Sun, L., Tian, Z., Zou, H., Shao, L., and Sun, L. (2019). An index-based assessment of perceived climate risk and vulnerability for the urban cluster in the Yangtze River Delta region of China 11:2099, 1–15. doi: 10.3390/su11072099Sustainability
Suomi, I., and Vihma, T. (2018). Wind gust measurement techniques—from traditional anemometry to new possibilities. Sensors 18:1300. doi: 10.3390/s18041300
Tayyeh, H. K., and Mohammed, R. (2023). Analysis of NASA power reanalysis products to predict temperature and precipitation in Euphrates River basin. J. Hydrol. 619:129327. doi: 10.1016/j.jhydrol.2023.129327
The European Climate Adaptation Platform Climate-ADAPT (2023). Roads for today adapted for tomorrow (ROADAPT). Available online at: https://climate-adapt.eea.europa.eu/en/metadata/adaptation-options/seawalls-and-jetties (Accessed September 12, 2024).
Timmermann, A., An, S.-I., Kug, J.-S., Jin, F.-F., Cai, W., Capotondi, A., et al. (2018). El Niño–southern oscillation complexity. Nature 559, 535–545. doi: 10.1038/s41586-018-0252-6
United Nations Development Programme. (2021). National Adaptation Plan 2019 (Initial NAP). Government of Sierra Leone https://www.undp.org/sierra-leone/publications/national-adaptation-plan-2021 (Accessed April 14, 2024).
UNCTAD. (2017). Climate risk and vulnerability assessment framework for Caribbean coastal transport infrastructure: Overview. United Nations Conference on Trade and Development. Available online at: https://unctad.org/publication/climate-risk-and-vulnerability-assessment-framework-caribbean-coastal-transport (Accessed September 12, 2024).
USAID. (2016). Landscapes of West Africa: A window on a changing world. United States Agency for International Development. Available online at: https://www.usaid.gov/landscapes-west-africa (Accessed October 30 2024).
USAID. (2017). Climate change risk profile: Senegal (Climate risk assessment report, pp. 1–5). United States Agency for International Development. Available online at: https://www.climatelinks.org/resources/climate-change-risk-profile-senegal (Accessed September 12, 2024).
Verhaeghe, B., Roux, A.le, and Anorld, K. (2020). Climate change adaptation in the African roads sector: constraints, opportunities and policy challenges. 1–23.
Wadsworth, R., Jalloh, A., and Lebbie, A. (2019). Changes in rainfall in Sierra Leone: 1981–2018. Climate 7:144. doi: 10.3390/cli7120144
World Bank. (2018a). Enhancing the climate resilience of Africa’s infrastructure. World Bank. Available online at: https://documents1.worldbank.org/curated/en/270671478809724744/pdf/110137-WP-PUBLIC-ECRAI-Transport-CLEAN-WEB.pdf
World Bank (2020). Disaster Risk Management Diagnostic Note. Available online at: http://www.harpis-sl.website/index.php/hazard-profiles/sierra-leone-hazard-
World Bank (2022). Sierra Leone–Climatology. Climate Change Knowledge Portal. Available online at: https://climateknowledgeportal.worldbank.org/country/sierra-leone/climate-data-historical
Zebisch, M., Schneiderbauer, S., Fritzsche, K., Bubeck, P., Kienberger, S., and Kahlenborn, W. (2021). The vulnerability sourcebook and climate impact chains – a standardised framework for a climate vulnerability and risk assessment. Int. J. Clim. Change Strateg. Manage. 13, 35–59. doi: 10.1108/IJCCSM-07-2019-0042
Zhang, Y., Zhao, Y., Liu, B., Wang, Z., and Zhang, S. (2019). Rill and gully erosion on unpaved roads under heavy rainfall in agricultural watersheds on China’s loess plateau. Agric. Ecosyst. Environ. 284:106580. doi: 10.1016/j.agee.2019.106580
Zhao, L., Fang, Q., Hou, R., and Wu, F. (2021). Geoderma effect of rainfall intensity and duration on soil erosion on slopes with different microrelief patterns. Geoderma 396:115085. doi: 10.1016/j.geoderma.2021.115085
Keywords: unpaved roads, climate vulnerability, Sierra Leone, framework development, open-source tools, vulnerability assessment, road infrastructure resilience, sustainability
Citation: Kamara PM, Tuffour YA, Baffour-Ata F and Obeng DA (2025) Framework for assessing the climate vulnerability of unpaved roads in Sierra Leone. Front. Clim. 7:1608176. doi: 10.3389/fclim.2025.1608176
Edited by:
Xixi Wang, Old Dominion University, United StatesReviewed by:
James Kevin Summers, U.S. Environmental Protection Agency (EPA), United StatesSadhana Nirandjan, Institute for Environmental Studies, Faculty of Science, VU Amsterdam, Netherlands
Copyright © 2025 Kamara, Tuffour, Baffour-Ata and Obeng. This is an open-access article distributed under the terms of the Creative Commons Attribution License (CC BY). The use, distribution or reproduction in other forums is permitted, provided the original author(s) and the copyright owner(s) are credited and that the original publication in this journal is cited, in accordance with accepted academic practice. No use, distribution or reproduction is permitted which does not comply with these terms.
*Correspondence: Phodie Musa Kamara, cG1rdmlubWFzQGdtYWlsLmNvbQ==
 Phodie Musa Kamara
 Yaw Adubofour Tuffour1