- 1Computer Science Department, University of New Mexico, Albuquerque, NM, United States
- 2Center for Advanced Research Computing, University of New Mexico, Albuquerque, NM, United States
- 3Department of Earth and Planetary Sciences, University of New Mexico, Albuquerque, NM, United States
- 4NV5, Albuquerque, NM, United States
- 5Department of Electrical and Computer Engineering, University of New Mexico, Albuquerque, NM, United States
- 6Biology Department, University of New Mexico, Albuquerque, NM, United States
- 7Santa Fe Institute, Santa Fe, NM, United States
We present methods for autonomous collaborative surveying of volcanic CO2 emissions using aerial robots. CO2 is a useful predictor of volcanic eruptions and an influential greenhouse gas. However, current CO2 mapping methods are hazardous and inefficient, as a result, only a small fraction of CO2 emitting volcanoes have been surveyed. We develop algorithms and a platform to measure volcanic CO2 emissions. The Dragonfly Unpiloted Aerial Vehicle (UAV) platform is capable of long-duration CO2 collection flights in harsh environments. We implement two survey algorithms on teams of Dragonfly robots and demonstrate that they effectively map gas emissions and locate the highest gas concentrations. Our experiments culminate in a successful field test of collaborative rasterization and gradient descent algorithms in a challenging real-world environment at the edge of the Valles Caldera supervolcano. Both algorithms treat multiple flocking UAVs as a distributed flexible instrument. Simultaneous sensing in multiple UAVs gives scientists greater confidence in estimates of gas concentrations and the locations of sources of those emissions. These methods are also applicable to a range of other airborne concentration mapping tasks, such as pipeline leak detection and contaminant localization.
1 Introduction
Distributed mobile sensing has many application areas, such as monitoring of industrial gas leaks, hazardous material releases, and agricultural monitoring (Rossi et al., 2014; Gomez and Purdie, 2016; Radoglou-Grammatikis et al., 2020).1 Often the materials we are interested in sensing can only be directly sampled, as the signal of CO2 emissions relative to background is low. Remote sensing methods such as satellite imaging are capable of measuring total column integrated CO2 on a global scale, but specific eruptions and volcanic plumes must be spatially and temporally targeted in order to capture events (Johnson et al., 2020). Atmospheric levels of CO2 prevent accurate satellite imaging and remote laser methods require bulky equipment and have unrealistic line-of-site requirements. But, relatively small instruments exist that can make very accurate point-measurements of CO2. This requires that the measurement instrument be moved through the area of interest. In the case of volcanic emissions, this has been done by hand-carrying the instruments into dangerous locations or by human-piloted aircraft flying through hazardous volcanic plumes. Ground surveys, in addition to the risk involved, are biased by surveyors’ inability to survey areas of unstable rock, sheer cliffs, scalding mud-pots, or (without specialized breathing equipment) areas with poisonous gas.
Several groups recently used remote-piloted aircraft to measure volcanic CO2 at Manam volcano (Liu et al., 2020). That work provided new insights into volcanic CO2 emissions but was hampered by the challenges of remote-piloting from great distances, with limited visibility, and under extremely hazardous conditions. Only a small subset of the drones deployed by the various teams involved was able to reach Manam volcano’s plume, and only one drone survived the expedition.
Here we present the first autonomous surveys of volcanic CO2. Autonomous UAVs are not restricted by line-of-sight or radio communication limitations, are not subject to hazardous ground conditions, and are immune to most poisonous gases. Autonomous UAVs can therefore survey volcanic CO2 more effectively than human-piloted drones or ground-based surveys. Additionally, autonomous drones can coordinate their flight and sensor readings and make decisions based on those readings in real-time. Autonomy allows a team of UAVs, each equipped with a point-source measurement device, to become a much larger physically disconnected and therefore re-configurable sensor. In our case, three UAVs are required to map the CO2 gradient fields required to localize CO2 sources.
We designed, built, and field-tested a small swarm of UAVs called the Volcano Co-robot with Adaptive Natural algorithms (VolCAN) swarm. The VolCAN swarm executes a variety of surveillance algorithms to estimate the gas concentrations critical to volcanic eruption forecasting. The VolCAN swarm also implements a flocking algorithm for gradient descent to navigate to the locations where CO2 is emitted from the ground. We test the swarm in simulation, in a hybrid field-simulation experiment in an open field, and ultimately perform multi-UAV atmospheric CO2 emission surveys at the Valles Caldera supervolcano in New Mexico.
Volcanic Emissions
Worldwide, there are over 50 volcanic eruptions each year. More than 500 volcanoes are thought to be atmospheric CO2 sources, yet less than 5% of those volcanoes have been surveyed (Fischer et al., 2019). Changes in the ratio of CO2 to SO2 from gas-emitting fumaroles have been observed to precede explosive volcanic eruptions (Aiuppa et al., 2010; Stix and de Moor, 2018), highlighting the potential of real-time gas measurements for eruption forecasting. Better forecasting of these eruptions is one of the three Grand Challenges recently highlighted by the National Academies because forecasting eruptions can save lives and mitigate volcanic hazards (Manga et al., 2017). Though dwarfed by anthropogenic emissions, volcanic CO2 flux is also important to a complete understanding of global volatile budget. (Fischer and Aiuppa, 2020).
Volcano surveys are hampered by the difficulty and danger of sampling gases in and around active craters. Volcanic CO2 emissions can only be measured remotely by satellite when a satellite orbit is capable of capturing a specific location during an event. The NASA Orbital Climate Observatory has a 16-day repeat cycle and a narrow sampling width (Crisp et al., 2017), making targeting specific eruptions challenging. Ground-based remote sensing involves bulky instruments which are costly and difficult to deploy in remote areas (Aiuppa et al., 2015). Volcanologists, therefore, use hand-held detectors to gather point-source measurements by collecting and analyzing CO2 concentration in-situ (Diaz et al., 2010). This is currently accomplished either by aircraft or by ground surveys (Chiodini et al., 1998), both of which are hazardous and inefficient. Our driving mission is to remove the human from these dangerous conditions while giving Volcanologists this critical data promptly.
Environmental Sensing by UAVs
We designed and built the Dragonfly UAV as shown in Figure 1 as the VolCAN swarm hardware platform. The Dragonfly is designed to meet the requirements to survey active volcanoes in real-world conditions. These requirements are informed by our experiences surveying volcanoes with manually piloted UAVs (Liu et al., 2020). Currently, the state-of-the-art for volcanic UAV surveys is manually piloted using a single, typically combustion-powered, UAVs (James et al., 2020). Combustion engines introduce organic CO2 into measurements which can be a source of significant error (Fischer and Lopez, 2016). Piloted flights introduce the possibility of human error and does not leverage the collected data in real-time. Our objective is to autonomously fly multiple UAVs to map CO2 gas concentrations automatically and act as a single collaborative instrument capable of measuring multiple CO2 reading point-sources at a time. This technique provides redundancy in gas readings, and the ability to calculate a gas concentration gradient. This follows our previous work where we developed and analyzed the Loss-tolerant Cohesive UAV Swarm (LoCUS) Ericksen et al. (2020) algorithm.
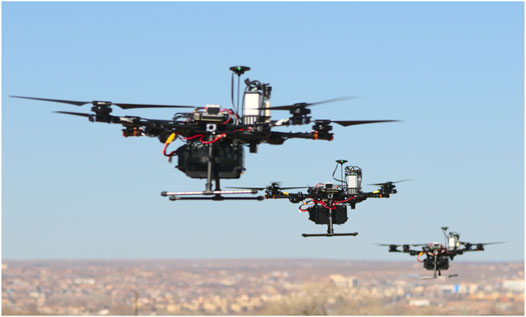
FIGURE 1. Flocking Dragonfly UAVs in formation. The flocking Dragonfly UAVs are used to survey volcanic CO2 plumes.
Our work adds to the rapidly growing literature of environmental chemical sensing with small UAVs outlined by Burgués and Marco (2020), spurred by decreasing costs of chemical sensors and commercially-available drones. For a motion planning approach using chemical-sensing drones see Bourne et al. (2020). Nano drone chemical-sensing approaches have been demonstrated (Burgués et al., 2019; Anderson et al., 2020). However short flight times make them impractical for the larger-scale volcano surveys we target. Our Gradient following technique is similar to one demonstrated by Adamek et al. (2015) in aquatic environments for collaboratively mapping a lake boundary using three aquatic drones.
Autonomous robotic systems are becoming more resilient and capable of performing monitoring tasks in degraded and hazardous environments Chung et al. (2018). Applications include volcano monitoring Wood et al. (2020), subterranean exploration Dang et al. (2020), mapping mines Weber (1995), and nuclear facilities Thakur et al. (2020), surveying penguin colonies Shah et al. (2020), and disaster relief operations Sun et al. (2020), to name just a few. The underlying requirement across all these examples is one we share; to take the human out of harm’s way, putting the risk on the expendable robotic hardware.
UAVs are an attractive solution for performing in-situ volcanic gas measurements. The Deep Carbon Observatory expedition to volcanoes in Papua New Guinea tested several remotely piloted, single-drone approaches to measuring gas plumes Liu et al. (2020). Several remote-piloted platforms were also tested at Masaya Volcano, Nicaragua Stix et al. (2018). Diaz et al. (2015) used UAVs equipped with miniature mass spectrometers to perform in-situ gas measurements the Turrialba Volcano in Costa Rica. The 2018 eruption at Kı̄lauea Neal et al. (2019) and subsequent caldera collapse was extensively monitored with UAV-based imagery. These examples highlight hand-piloted UAVs and further underscore the need for automation in this space.
Vásárhelyi et al. (2014), developed and demonstrated a decentralized autonomous multi-drone flocking algorithm that avoids collisions between drones while maintaining a cohesive flock, a specialization of the canonical Boids flocking simulation in Reynolds (1987). We apply the collision-avoidance and velocity-matching techniques described there and add our formation strategy.
The contributions of this work are as follows:
1. We develop the Dragonfly UAV platform as a versatile autonomous volcano survey tool.
2. We implement rasterization survey algorithms and extend our LoCUS algorithm to use a flocking strategy to follow gas gradients to their source.
3. We demonstrate that the hardware platform and algorithms successfully measure known simulated gas concentrations and sources in the field using hybrid simulation/hardware experiments.
4. We validate that the VolCAN swarm can detect gas emissions and locate known gas sources in the challenging field conditions at the Valles Caldera active volcano. Our field tests demonstrate the utility of distributed sensing and communication among coordinated UAVs for surveys in challenging environments.
2 Methods
This section describes the development of the VolCAN swarm hardware and software as well as testing in simulation, hybrid simulation/field experiments, and natural field conditions. Simulation experiments were performed using the Gazebo real-physics simulator (Koenig and Howard, 2004). Field experiments were conducted at two New Mexico, US sites: Balloon Fiesta Park in Albuquerque and near the Valles Caldera supervolcano.
2.1 Dragonfly Design and Mission Parameters
We designed and built the Dragonfly UAV (Figure 2) to fly with a 2 kg payload, including a CO2 sensor, for 1 h duration. We chose larger motors and propellers to provide enough thrust to be able to fly in high winds. The highest wind speed under which we successfully tested the platform was 16 m/s. During hover and under normal flight dynamics, the system uses between 15 and 20 A. The Dragonfly folds to fit in a backpack case for transportation on foot to volcanic field sites. The foldable Tarot 650 frame allows for a variety of sensor configurations and payloads mounted to the payload rails. The UAVs communicate with each other and a base station through an ad-hoc wifi network. They can operate autonomously and under the guidance of a scientist-in-the-loop (Aodha et al., 2014). The Dragonfly design is centered around the MavROS programming interface to implement autonomous control. The Dragonflies were built using commodity hardware and 3D-printed parts to reduce costs and make it possible to do common repairs on-site.
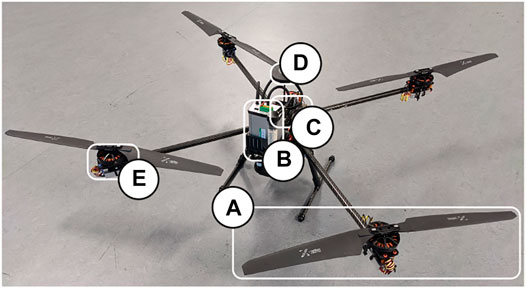
FIGURE 2. Dragonfly UAV designed for volcano monitoring with arms and landing gear unfolded in flight-ready configuration. (A) 57 cm diameter propellers (highlighted for scale reference). (B) PP-Systems SBA-5 CO2 sensor with absorber column weighing 0.5 kg. (C) Onboard flight computers and electronics, including a Raspberry Pi. (D) Hex Here2 GPS. (E) T-Motor MN6007 320 kV motors and Flame 60 A ESCs.
The laboratory-grade PP-Systems SBA-5 CO2 detection sensor was chosen to fill the requirement of CO2 gas concentration sensing because its durability, accuracy of 1–2 ppm, wide detection range, and mass of only 200 g (Stix et al., 2018). The sensor is also capable of operating at high altitudes and in a wide range of operating temperatures (Lee et al., 2016; Ilanko et al., 2019). In our initial design experiments rotor wash was a confounding factor in CO2 measurement, for scales less than 3 m; however, 3 m is below the relevant resolution for volcanic plumes.
2.2 The Dragonfly Software Platform
Dragonfly software is comprised of two main components: the Dragonfly dashboard and the onboard controller. These components integrate the ecosystem of modules to control the VolCAN swarm as a whole as depicted in Figure 3.
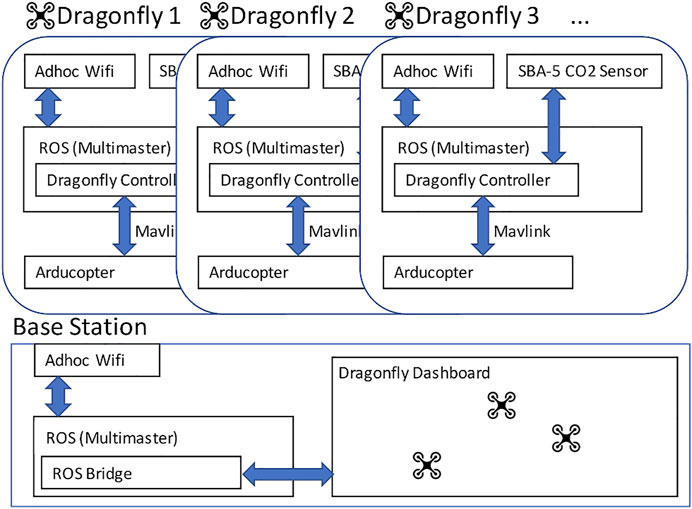
FIGURE 3. Block level diagram of the VolCAN swarm. Each Dragonfly in the swarm maintains flight using the on board Arducopter flight computer which is directed by the companion Raspberry Pi computer running the Dragonfly Controller. The Controller executes mission commands autonomously flying the Dragonfly as a virtual pilot while also communicating to other Dragonflies and the Base Station via an ad-hoc wifi network.
The Dragonfly dashboard2 is a human-friendly interface for planning missions. The dashboard provides a convenient Graphical User Interface (GUI) ground station for visualizing and managing the swarm of networked Dragonflies on a 3D map. The dashboard gives the user the ability to control and provide expert feedback to the entire swarm, a foundation of the scientist-in-the-loop goal.
The Dragonfly Controller3 acts as a virtual pilot. It is a collection of Robot Operating System (ROS) Quigley et al. (2009) melodic nodes running on the onboard companion computer. These nodes were run in a multimaster ROS environment, allowing ROS to broker communication between Dragonflies and the ground station.
The Dragonfly Controller contains the following ROS nodes.
1. CO2 ROS Sensor Node publishes data from the connected SBA-5 CO2 sensor at 10 Hz. This allows any Dragonfly to stream any other Dragonfly’s CO2 readings.
2. Data Logger records CO2 measurements and their global positioning system (GPS) coordinates.
3. Command Service provides high-level flight commands to operate the Dragonflies, including common actions like takeoff, land, return to launch (RTL), goto waypoint along with the following actions:
a. Execute DDSA or Lawnmower (Section 2.3).
b. Flock and Coordinated Gradient Descent. These two commands direct the Dragonflies to organize into a flock and follow CO2 gradients (Section 2.4).
c. Mission executes a list of actions in series on the Dragonflies but in parallel across the swarm. Mission actions included all of the command service actions along with a semaphore that acts as an execution barrier to synchronize survey algorithm execution across multiple Dragonflies.
2.3 Preplanned Survey Algorithms
To map the CO2 of a region of interest, we implement two rasterization survey algorithms: the lawnmower survey algorithm and the distributed deterministic spiral search algorithm (DDSA) (Fricke et al., 2016; Aggarwal et al., 2019) survey algorithm. Both of these algorithms create an exhaustive 2D rasterization map by visiting each area within a given radius. The lawnmower algorithm scans a polygon region by incrementally following longitudinal passes across a predefined region. We implement the lawnmower algorithm using a linear programming framework to perform boundary calculations against a user-defined polygon. This technique allows the mapping of irregularly shaped regions and avoids hazards such as trees, power lines, and sudden elevation changes which are commonplace in the target environments. The DDSA algorithm is a multi-agent spiral search algorithm that navigates multiple drones in interleaved square spiral paths. Unlike the lawnmower algorithm, the DDSA algorithm guarantees collision avoidance because the interleaved paths never cross. The output of these algorithms are waypoints which the Dragonfly autonomously navigates during a mission. GPS stamped CO2 data sets logged from these flights are ideal to create Kriging CO2 concentration maps due to their uniform region coverage.
2.4 Flocking Algorithm for Gradient Descent
While the lawnmower survey algorithm is an autonomous pre-planned algorithm, the gradient descent flocking algorithm adapts the paths of the UAVs in response to the data they sense and communicate to each other. The gradient descent algorithm goal is for the Dragonflies to navigate to an unmapped location where the gas flux is highest which would identify the location from which the gas is emitted without spending the extra time to rasterize the surrounding area. This increase in efficiency follows work by Aggarwal et al. (2019). To spatially coordinate multiple Dragonflies, we used a leader-based flocking algorithm following Vásárhelyi et al. (2014) detailed in Figure 4.
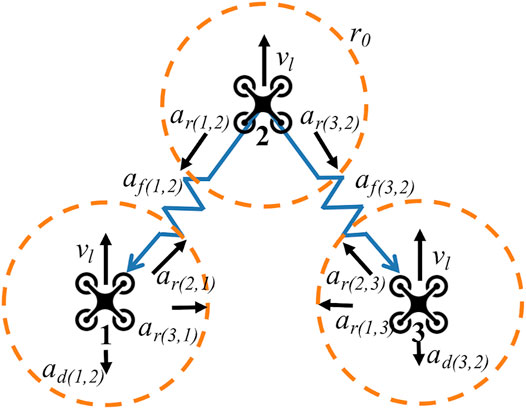
FIGURE 4. Flocking Algorithm. This diagram highlights the constituent forces acting on each Dragonfly, which are summed to produce the vi control velocity on each of the three drones flocking formation. The dotted circles represent the minimum repulsion radius r0 where ar(i,j) pushes two drones apart (see Eq. 1). The springs labeled with af(i,ℓ) are the flocking forces maintaing the drone formation in relation to Dragonfly 2 (see Eq. 2). ad(i,ℓ) is the velocity dampening force (see Eq. 3), and vℓ is the leader velocity applied to the flock (see Eq. 4).
Flocking drones avoid collisions by using a drone i, to drone j, repulsion force ar. This force acts like a virtual spring between drones within a radius ro of each other. r1 acts as a maximum repulsion force:
To maintain the formation, a potential well applies force af(i,ℓ), aligns each dragonfly at their respective positions xf(i). xf(i) is a specified offset from the leader ℓ of xℓ,i given by,
A dampening term is used to prevent overshooting the leader ℓ when matching velocities:
To achieve formation flocking each force vector is scaled by a corresponding gain term c, cf, and cd and update time Δt to give a velocity vector vi m/s:
Formation flocking is implemented in Algorithm 1. FLOCK is called on an interval, once per Δt time-step which updates the velocity of the given drone in the flock by calling the SETVELOCITY function.
In previous work, we developed the LoCUS algorithm for formation flying which used a lock-step technique to move the formation in space (Ericksen et al., 2020). We replaced this technique in LoCUS with the above flocking algorithm. This enabled the inherent dynamism of flocks to make collision avoidance more natural and, in general, made the group of UAVs more responsive to changing inputs.
Algorithm 1. Flocking Velocity Update Algorithm.
The dragonfly flock performs gradient descent by following the plume’s atmospheric dispersion gradient towards the concentration maximum at the source of the plume. The gradient is calculated by the lead drone by aggregating CO2 measurement point-sources φ and corresponding 2D spatial positions (x, y) of each agent α in the swarm at each time step. This data is fit with a linear slope b relating point-source concentration to position in the form Ab + ϵ = s, and the slope parameter b is calculated by minimizing the magnitude of the error term ϵ through least-squares approximation:
The linear fit slope b components include the vector (b [1], b [2]) which points in the direction of maximum CO2. To gradient descend in two dimensions, at least three drones are required for the linear fit. Additional drones above this minimum provide redundancy and an averaging effect across the swarm’s CO2 readings.
2.5 Simulation
To facilitate repeatable experiments under controlled conditions and to accelerate development, the Dragonfly hardware, Ardupilot flight control software, and the onboard Dragonfly Controller were implemented in the Gazebo real-physics simulation as shown in Figure 5.4 We ran the same software in simulation (also known as Simulation-in-the-Loop) as in the physical hardware which expedited algorithm prototyping and debugging before flying in a physical UAVs.
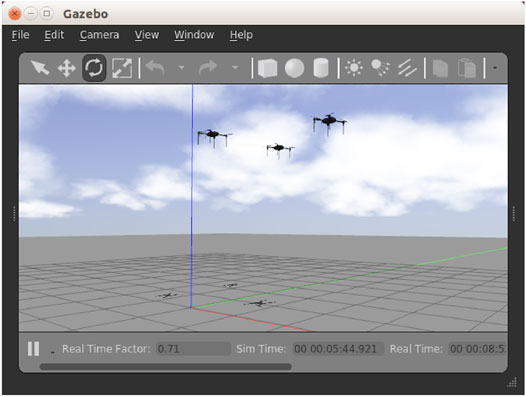
FIGURE 5. Algorithm Testing in Simulation with three simulated Dragonflies, each running their own instance of Arducopter and the Dragonfly Controller.
We define a Virtual Plume for use in Gazebo simulations and hardware/simulation hybrid experiments (described in the next section). The plume model is a horizontal 2D slice through a 3D Gaussian plume. The concentration is calculated from a x, y GPS coordinate offset with constants stack height H, wind speed u, emission rate Q, and diffusion rate K (Stockie, 2011):
3 Results
Experiments were conducted at two field sites. First, hardware Dragonflies were flown in an open field and tasked with the mission of mapping and finding the source of a virtual plume. This allowed us to evaluate how the algorithms would behave in real hardware in an outdoor environment. The virtual plume allowed us to evaluate how effectively the UAVs would map known gas concentrations and the known source location of the simulated CO2 plume.
Second, experiments were performed at a natural volcanic site to test the plume-sensing capabilities of the Dragonfly platform under real-world conditions. Previous field studies were conducted by geoscientists at the site and sites of elevated CO2 were identified in Golla (2019). This provided us with a likely location for CO2 emissions; however, CO2 emissions change frequently, and measurements are affected by wind and temperature. Thus, it is difficult to acquire accurate ground truth. Therefore, we used the simulated plume at the first field site to show the VolCAN swarm could accurately map CO2 concentrations and source location. The field study at Valles Caldera volcano demonstrated that the swarm could produce rasterized surveys and flock to a suspected source of CO2 under difficult field conditions but where there is uncertainty in true sources and concentrations of CO2. All field experiments were conducted according to US Federal Aviation Administration (FAA) Unmanned Aircraft Systems (UAS) regulations and with permission in relevant airspaces.
3.1 Open Field Experiments
Our open field site was the large flying field of Balloon Fiesta Park in Albuquerque, New Mexico. We used the Virtual Plume during field experiments to add a plume for the algorithms to map and follow. We centered the Virtual Plume at latitude 35.19465, longitude −106.59625 with parameters H = 2 m, u = 1 m/s, Q = 5 kg/s, K = 2 kg/s.
3.1.1 Rasterization Survey
To map the virtual plume a large-scale 10 m resolution rasterization survey of the field was performed using the lawnmower algorithm within a polygon outlining the designated field. The Dragonfly flew at 10 m altitude, with each longitudinal pass at 10 m spacing. We used the lawnmower survey to produce a Kriging heat map of the virtual plume seen in Figure 6.
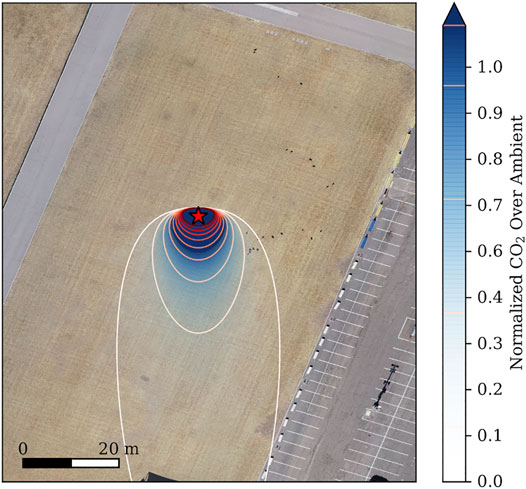
FIGURE 6. Virtual Plume Plotted on Balloon Fiesta Park. The Virtual Plume, with the source specified to be the middle of the field, is configured with a northerly wind producing the long tail. The isoconcentration lines are added to accentuate the plume’s shape at lower concentration levels.
For a fine-grained 1 m resolution survey of the virtual plume, we executed a DDSA slightly to the north of the detected plume. We used a single Dragonfly in the DDSA with spiral arms separated by 1 m spacing, and we performed 10 loops at a single altitude of 10 m. The goal was to produce a detailed Kriging heat map of the Virtual Plume.
We generated two maps to test the ability of the two sample rasterization methods to recreate the simulated plume over the open field. The ground-truth virtual plume is depicted in Figure 6. The coarse-grained map of CO2 generated from data using the lawnmower algorithm and the fine-grained map generated using the DDSA are displayed in Figure 7. The CO2 plume is visible in the center of the field, even with the limited data available from the 10 m separated longitudinal passes of the lawnmower algorithm. The DDSA map, displayed in the lower right detail, has more structure due to the finer-grained arm separation of 1 m that closely resembles the simulated plume. The fine-grained DDSA algorithm estimated the highest CO2 concentration very close to the location of the plume source (indicated by the red star). To compare the sampled maps S against the ground-truth maps G of shared dimensions (m, n), we find the mean absolute difference MD over the 2D space of these normalized data sets:
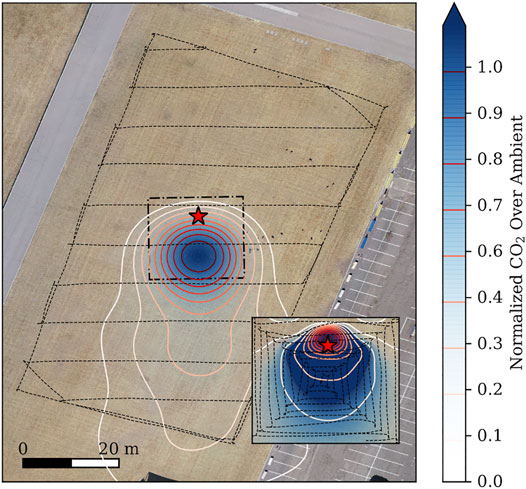
FIGURE 7. Coarse-grained lawnmower flight and more thorough survey using the DDSA (inset) flight at Balloon Fiesta Park. Each lawnmower pass across the field is separated by 10 m whereas each arm of the DDSA is separated by 1 m. Virtual plume data collected on the field is represented in the Kriging map. This map is compared with the Virtual Plume plot to see how the Kriging map represents the plume with limited information.
The coarse-grainedcourse-grained1 lawnmower mean absolute difference is 0.1306 and the fine-grained DDSA mean absolute difference is 0.0380 indicating the higher resolution of the fine-grained DDSA was able to reproduce a more accurate representation of the ground-truth data. In addition, the course-grained lawnmower estimated the source at approximately 10 m away from its actual location whereas the fine-grained DDSA estimated the source at approximately 1 m from the ground-truth source, again representing that a finer-grained map produces a more accurate representation of the ground truth.
3.1.2 Flocking and Gradient Descent
We implemented LoCUS on three Dragonflies with Dragonfly 2 as the lead UAV and Dragonfly 1 and three oriented at (x, y) offsets (−6 m,−6 m) and (6 m,−6 m), respectively. This produced a V-formation orienting Dragonfly 1 and three orthogonally via Dragonfly 2, which is ideal for detecting a 2D gradient and separating the drones to avoid collisions due to GPS accuracy. For these experiments, we flew each Dragonfly at different altitudes, separated by 1 m, as an additional safety measure to avoid mid-air collisions. To test gradient descent, Dragonfly 2 was commanded to perform gradient descent autonomous flight using CO2 readings correlated with location information from Dragonfly 1, 2, and 3. The Dragonfly flock was positioned in the plume’s tail to start with an initial signal that was used to follow the virtual CO2 plume towards the source. The goal of this experiment was for the flock to identify the source of the plume represented by the location with maximum CO2 concentration.
The purpose of flocking is to identify the location with the highest CO2 concentration using multiple UAVs close while preventing collisions. Figure 8 shows the Euclidean distances between drones during a manually piloted test flight. Dragonfly 1 and three reach a minimum and maximum distance between themselves and the lead Dragonfly 2 of 7.0 and 11 m, respectively. These distances lie within 2.3 m of the ideal configured distance of 8.5 m. Similarly, Dragonfly 1 and three stay within 2.4 m of the ideal configured distance of 12 m. All three Dragonflies fly more than 6 m away from each other, greater than the acceptable GPS error radius of 6 m. This effectively kept each drone in an orthogonal orientation which is essential for collecting a 2D sample gradient vector while avoiding collisions between members of the flock.
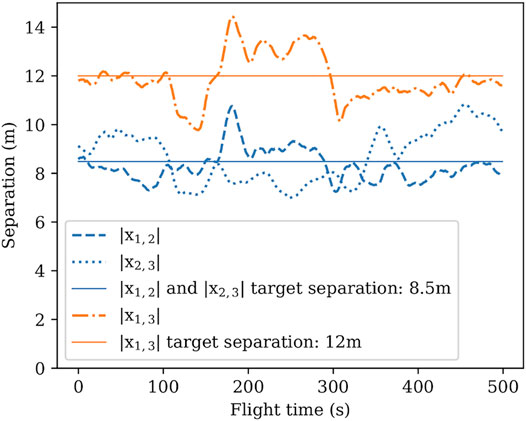
FIGURE 8. Flocking Algorithm Achieves Target Separation. The distance magnitude between Dragonfly a and b is signified
Figure 9 shows the path of the three flocking Dragonflies as they follow the gradient vector indicated by the black arrow. The arrow is a normalized representation of the (b [1], b [2]) vector described in Section 2.4. Dragonfly 2 successfully navigates into the virtual CO2 plume by following the b vector, finding the maximum CO2 value of 710 ppm. This result matches our results from Ericksen et al. (2020), where the flock can quickly and directly follow the plume’s gradient back to the source. Just as with the flocking result, we produce an accurate Kriging map from the data collected across all three drones, which produces a map similar to the one produced in Figures 7, 9.
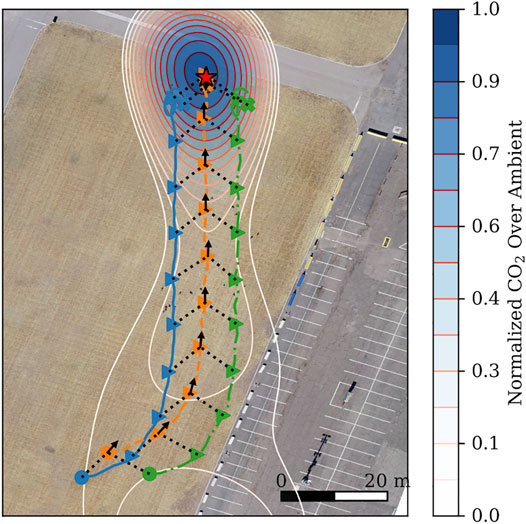
FIGURE 9. Flocking Gradient Descent in the Field mapping a virtual plume. Colored lines represent the flight paths of the Dragonfly flock in V-formation following the gradient. Dotted lines between key points in time, marked as directional triangles, indicate the network connections during flight. Arrows indicate the normalized gradient of the virtual plume, which is represented as a Kriging heat map. From the starting point, the flight path length was about 100 m and took the flock about 2 min to reach and identify the plume’s maximum concentration, which is within 0.30 m of the source. The Virtual Plume was moved up field from the previous experiments to allow for more travel distance of the flock.
3.2 Volcano Field Tests
Valles Caldera is a supervolcano in northern New Mexico (Figure 10). The caldera is more than 22 km in diameter with CO2 emissions at several sites (Goff and Janik, 2002). The field site chosen for VolCAN swarm surveys and flocking is a small canyon formed by the Jemez River. CO2 degases diffusely out of the ground on the northern side of the canyon (Golla, 2019). The location offers a challenging flight environment because of the forest and steep canyon hills on either side. This bracketed the available flight space and required extremely accurate mission planning and flight control. Our challenge was to balance flying low enough to detect the degassing CO2 emitted from the ground, high enough to clear the tallest trees, and within a boundary to not collide with the canyon hills. There was quite a bit of effort put into mission plans including sighting the treetops, creating and analyzing a topology map, reviewing CO2 data collected during the missions, and manually adjusting mission boundaries. Additionally, the design and tuning of the Dragonflies played a large component in flying accurately even in windy conditions. Despite our efforts, We experienced occasional catastrophic collisions with trees while tuning flight parameters. Unfortunately, damage to the platform significantly affects the flight characteristics of the UAVs which underscores the importance of planning flights clear of obstacles. While Valles Caldera is safe for researchers because there is no current danger of eruption, it is an ideal real-world test site for the VolCAN swarm due to its active release of gasses and its topology typical of challenges in volcanic regions.
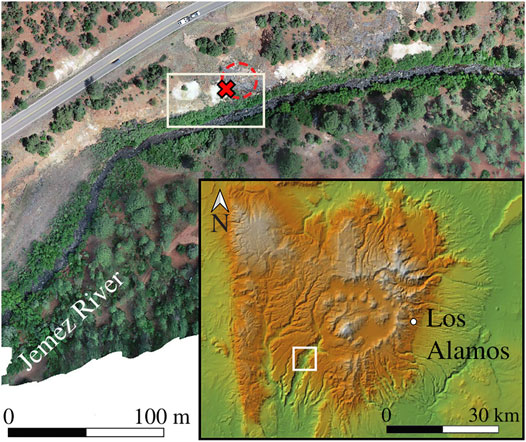
FIGURE 10. Valles Caldera Supervolcano: Overview of Field Site. A visible imagery mosaic of the field site, with an inset displaying the terrain of the Valles Caldera volcano. In previous surveys, CO2 emissions were associated with the white calcite surface deposits (Rahilly, 2020). The calcite associate with the primary CO2 source, circled in red, has been obscured by brush. The white rectangles indicates the survey site. The red × indicates the position of a fixed ground sensor.
The site was previously surveyed in Rahilly (2020) for CO2 emissions. The evidence for historical emissions is the white areas of hydrothermal alteration. A permanent ground sensor is located at the location of the highest CO2 emissions indicated by the red star in Figure 10. An example of the CO2 emissions detected from the ground sensor is shown in Figure 11 and highlights the variability of CO2 over time.
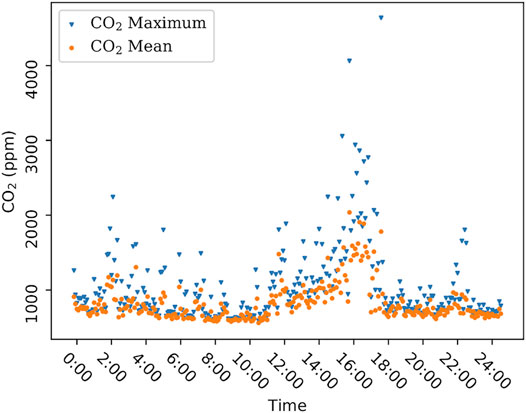
FIGURE 11. CO2 Concentrations Measured by Ground Sensor from a permanently installed multiGAS system developed at the University of New Mexico (Aiuppa et al., 2005).
3.2.1 Rasterization Survey
We executed a large-scale rasterization of the area at 50 m above the canyon floor takeoff location. Flying at this height cleared the tallest trees in the area but still was able to detect a difference in CO2. The large-scale rasterization lawnmower was executed with longitudinal passes at 5 m spacing. Additionally, we flew the lawnmower with three dragonflies in flocking v-formation with Dragonfly 1 and three oriented at (x, y) offsets (−6 m,−6 m) and (6 m,−6 m), respectively. Flocking allowed us to gather redundant data during the rasterization survey. By simultaneously collecting CO2 data from multiple nearby UAVs, we increased the volume of data collected during the mission to create more detailed maps. Additionally, this approach allowed us to compare CO2 concentrations from three different sensors to understand variation in both the environment and the sensors over the same period. CO2 concentration readings from this survey were gathered and used to generate a Kriging map of the concentration gradient against aerial photography of the region.5
Figure 12 shows the Kriging map generated from CO2 data combined from all dragonflies in the flock. The Kriging map shows a complex distribution of CO2 with the highest elevated CO2 emanating from a previously unknown source to the east, and an elevated plume above and slightly to the east of the known source indicated by the dashed red circle. Detected CO2 across the swarm and overtime is normalized to produce the percentage difference in CO2 shown in the figure. Normalization is performed by linearly scaling the data to the minimum and maximum CO2 reading over the data set. Detected CO2 readings were between 410 and 430 ppm across Dragonfly 1, 2, and 3. The total flight time to rasterize the area was 13 min 42 s.
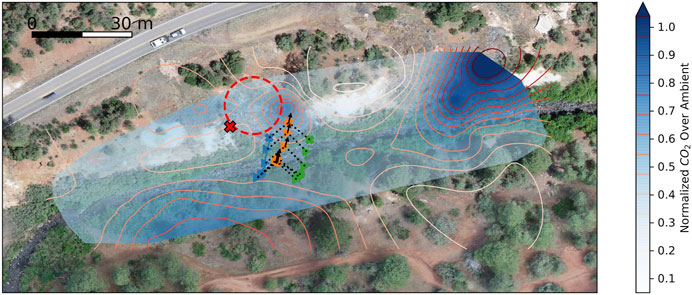
FIGURE 12. Kriging isoconcentration map produced from CO2 data collected during the flight. This map is the result of data collected using three Dragonfly drones flying the pattern in formation. Regions of note are the elevated concentration above and slightly to the east of the known source outlined in the dashed-red circle and the region in the east of the plot indicating another CO2 source plume. The path of the flock of Dragonflies is drawn as they follow the detected gradient which corresponds to the known source and previously mapped gradient.

FIGURE 13. Kriging maps of the individual component Dragonfly CO2 readings combined in Figure 12. Of note are the common elevated regions in the upper right and mid-left of each survey. These common readings confirm that there is elevated CO2 in that region of the sky.
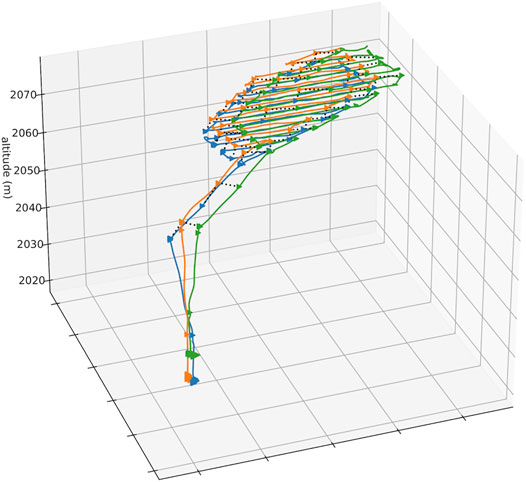
FIGURE 14. 3D flight map of the Dragonflies executing the lawnmower mission to produce the Kriging map displayed in Figure 12. The VolCAN swarm takes off and assembles in V-formation then proceeds to execute the lawnmower pattern in the predefined polygon region. The flocking flight paths overlap over time producing redundant confirmation data of the CO2 concentrations.
3.2.2 Flocking and Gradient Descent
We followed a CO2 gradient to its source by performing gradient descent with the following mission. First, we flocked Dragonflies 1, 2, and three in V-formation with Dragonfly 2 as the leader. We then navigated the flock to a waypoint position south of the known source along the Jemez River. Finally, we triggered Dragonfly 2 to follow the gradient calculated from data collected from the swarm. The goal of this experiment is to validate that gradient descent can navigate the swarm of drones using a previously identified natural source of CO2.
In addition to the Kriging map survey, Figure 12 displays the path of the Dragonfly flock following the CO2 concentration gradient using gradient descent in real-time. The path starts to the south of the known source and proceeds to move north until a maximum CO2 of 430 ppm was reached due east of the known source indicated by the dashed red circle. This path follows the gradient previously detected by the rasterized survey and shows the flock effectively using the input CO2 data to fly towards the known source plume’s highest concentration. The total flight time for the gradient descent portion of the mission was 25 s.
4 Discussion
Our results show that the Dragonfly UAV platform effectively maps aerial CO2 emissions in the challenging, real-world conditions of volcanic environments. We developed the Dragonfly UAVs platform with the navigational capabilities, flight duration, and payload capacity foundations to be able to accurately collect CO2 gasses, analyze them in-situ, and respond to the detected concentrations in real-time across multiple UAVs. This culminated in the rasterization survey of a known hot-spot in the Valles Caldera where we autonomously flew the VolCAN swarm in formation and mapped the CO2 at 50 m. This highlighted the elevated CO2 around the known source but also indicated an additional previously unknown source to the northeast. Additionally, we executed an autonomous gradient descent that successfully navigated into the elevated CO2 near the known source in the area. These field tests demonstrate the utility of the VolCAN swarm in mapping and navigating CO2 gradients in real-world extreme environments.
The development of the Dragonfly UAV platform took considerable efforst to meet the mission requirements. The biggest driving requirement was the flight time which dictated the overall weight of the aircraft, specifically the large battery requirements. This drove motor and propeller sizes to be able to produce enough lift with agility. To control the aircraft, we found that the flight controller PID tune was critical and only found success after hand-tuning these parameters. Tuning the PID loop to be somewhat aggressive resulted in an aircraft that would behave well in gusty high wind conditions, perform as expected around other aircraft, and mirror the aircraft’s simulation behavior.
Trials of the Dragonfly UAV in the open field helped solidify the algorithms developed in simulation in a real-world environment. Flying in the semi-controlled environment with a virtual plume ensured that we could map a CO2 plume and represent it with a level of confidence. Our results show that the coarse-grainedcourse-grained1 rasterization produced a map with a mean absolute difference of 13% to ground truth, with a smaller mean absolute difference of 3% for the fine-grained rasterization. Flocking the Dragonflies and following the virtual plume gradient demonstrated that we could identify the source of the plume, represented by the highest CO2 concentration in the gradient.
Mapping the known sources around the Jemez river in the Valles Caldera offered a chance to test the VolCAN swarm against real CO2 sources. To map the overall region we had to fly at a high elevation above ground level to avoid the tree canopy obstructions. This resulted in a relatively low CO2 signal compared with ground measurements. However, due to the accuracy of the SBA-5, we were still able to detect differences on the order of 1 ppm making the collection missions still effective. This further highlights the efficacy of our technique in mapping and responding to the aerial CO2 signal.
The missions at the Valles Caldera highlighted the survey speeds. During the same day as the aerial surveys, a ground survey team was gathering CO2 groud flux and concentration readings using portable CO2 fluxmeters. Their survey of a region similar to the lawnmower survey took 8 h to complete. In comparison, the lawnmower survey took less than 15 min and the gradient descent took less than 30 s, each an order of magnitude faster than the previous.
Our survey methods are also applicable to a variety of other environmental monitoring tasks that require in-situ measurements and efficient localization, such as detecting gas line leaks and environmental monitoring.
4.1 Caveats and Future Work
With any data collection task, especially one of such a dynamic process, the challenge is to tie the data back to known ground truth. In our case, the data and Kriging maps demonstrate a high correlation to the virtual plume in the open field environment. This ensures that data collection missions in the field represent a facsimile of what is truly occurring. That being said, the data represented by flying high above the ground and known sources in Jemez Springs should be interpreted with caution. The low CO2 readings did correlate to the known source on the ground, and indicate another source to the northeast, but a slight breeze can easily shift the location of these gasses. We propose that mapping larger regions, on the order of 100 m will help in localizing gas sources or taking into account wind direction and speed to produce an offset.
Upon inspection of the data used for gradient descent, it is feasible that the low CO2 concentrations and proximity of each drone to each other that differences in sensor temperatures and calibration played a factor in the detected gradient. The bottom line is that the drones did respond to the gradient and future work will be dedicated to determining the spacing of the flock to best gather and follow gradients.
With the development of the VolCAN swarm including the Dragonfly platform and the algorithms to map and follow gradients, the next step is to further automate the swarm’s behavior. This includes handing over decisions when and where to perform a survey and at what resolution, where to perform gradient descent to find the source of emissions, and utilizing battery life to maximize the investigation of a region. Also, automating the initial setup and mission parameters like the elevation to clear obstacles, and the overall flight boundaries would help speed the overall mission.
Data Availability Statement
The original contributions presented in the study are included in the article/Supplementary Material, further inquiries can be directed to the corresponding author.
Author Contributions
JE is the corresponding author and main contributor to the publication. GF served as the second seat, all supported by RF and MM. SN and TF provided support from Earth and Planetary Sciences perspective. JH, KR, and SW provided support on expeditions, processing data, and editing the manuscript.
Funding
JE support provided by Department of Energy’s Kansas City National Security Campus, operated by Honeywell Federal Manufacturing and Technologies, LLC under contract number DE-NA0002839. GF, SN, TF, RF, and MM support provided by the VolCAN project under National Science Foundation grant 2024520. Support was also provided by a Google CSR award. This study received funding from Google and Honeywell Federal Manufacturing and Technologies, LLC. The funder was not involved in the study design, collection, analysis, interpretation of data, the writing of this article or the decision to submit it for publication. All authors declare no other competing interests.
Conflict of Interest
Author SN was employed by the company NV5.
The remaining authors declare that the research was conducted in the absence of any commercial or financial relationships that could be construed as a potential conflict of interest.
Publisher’s Note
All claims expressed in this article are solely those of the authors and do not necessarily represent those of their affiliated organizations, or those of the publisher, the editors and the reviewers. Any product that may be evaluated in this article, or claim that may be made by its manufacturer, is not guaranteed or endorsed by the publisher.
Acknowledgments
We thank the Hummingbird Music Camp and the City of Albuquerque Parks and Recreation for their support. We thank Jarett Jones and Brian Verkaart for technical advice supporting the development of the Dragonflies.
Footnotes
1Located in Jemez Springs, NM, United States.
2Dragonfly Dashboard source code: https://github.com/BCLab-UNM/dragonfly-dashboard/tree/FRONTIERS2021.
3Dragonfly Controller source code: https://github.com/BCLab-UNM/dragonfly-controller/tree/FRONTIERS2021.
4Simulation source code: https://github.com/BCLab-UNM/dragonfly-sim/tree/FRONTIERS2021.
5Video of the survey: https://youtu.be/VVz68ZqhD8k.
References
Adamek, T., Kitts, C. A., and Mas, I. (2015). Gradient-Based Cluster Space Navigation for Autonomous Surface Vessels. Ieee/asme Trans. Mechatron. 20, 506–518. doi:10.1109/TMECH.2013.2297152
Aggarwal, A., Gupta, D., Vining, W. F., Fricke, G. M., and Moses, M. E. (2019). “Ignorance is Not Bliss: An Analysis of Central-Place Foraging Algorithms,” in 2019 IEEE/RSJ International Conference on Intelligent Robots and Systems (IROS) (IEEE), 6510–6517.
Aiuppa, A., Fiorani, L., Santoro, S., Parracino, S., Nuvoli, M., Chiodini, G., et al. (2015). New Ground-Based Lidar Enables Volcanic CO2 Flux Measurements. Sci. Rep. 5, 13614–13712. doi:10.1038/srep13614
Aiuppa, A., Burton, M., Caltabiano, T., Giudice, G., Guerrieri, S., Liuzzo, M., et al. (2010). Unusually Large Magmatic CO2gas Emissions Prior to a Basaltic Paroxysm. Geophys. Res. Lett. 37, a–n. doi:10.1029/2010GL043837
Aiuppa, A., Federico, C., Giudice, G., and Gurrieri, S. (2005). Chemical mapping of a fumarolic field: la fossa crater, vulcano island (aeolian islands, italy). Geophys. Res. Lett. 32, l023207. doi:10.1029/2005gl023207
Anderson, M. J., Sullivan, J. G., Horiuchi, T. K., Fuller, S. B., and Daniel, T. L. (2020). A Bio-Hybrid Odor-Guided Autonomous palm-sized Air Vehicle. Bioinspir. Biomim. 16, 026002. doi:10.1088/1748-3190/abbd81
Aodha, O. M., Stathopoulos, V., Brostow, G. J., Terry, M., Girolami, M., and Jones, K. E. (2014). “Putting the Scientist in the Loop -- Accelerating Scientific Progress with Interactive Machine Learning,” in Proceedings - International Conference on Pattern Recognition, Stockholm, Sweden, 24-28 Aug. 2014 (IEEE). doi:10.1109/ICPR.2014.12
Bourne, J. R., Goodell, M. N., He, X., Steiner, J. A., and Leang, K. K. (2020). Decentralized Multi-Agent Information-Theoretic Control for Target Estimation and Localization: Finding Gas Leaks. Int. J. Robotics Res. 39, 1525–1548. doi:10.1177/0278364920957090
Burgués, J., Hernández, V., Lilienthal, A., and Marco, S. (2019). Smelling Nano Aerial Vehicle for Gas Source Localization and Mapping. Sensors 19, 478. doi:10.3390/s19030478
Burgués, J., and Marco, S. (2020). Environmental Chemical Sensing Using Small Drones: A Review. Sci. Total Environ. 748, 141172. doi:10.1016/j.scitotenv.2020.141172
Chiodini, G., Cioni, R., Guidi, M., Raco, B., and Marini, L. (1998). Soil CO2 Flux Measurements in Volcanic and Geothermal Areas. Appl. Geochem. 13, 76. doi:10.1016/S0883-2927(97)00076-0
Chung, S.-J., Paranjape, A. A., Dames, P., Shen, S., and Kumar, V. (2018). A Survey on Aerial Swarm Robotics. IEEE Trans. Robot. 34, 837–855. doi:10.1109/tro.2018.2857475
Crisp, D., Pollock, H. R., Rosenberg, R., Chapsky, L., Lee, R. A. M., Oyafuso, F. A., et al. (2017). The On-Orbit Performance of the Orbiting Carbon Observatory-2 (OCO-2) Instrument and its Radiometrically Calibrated Products. Atmos. Meas. Tech. 10, 59–81. doi:10.5194/AMT-10-59-2017
Dang, T., Tranzatto, M., Khattak, S., Mascarich, F., Alexis, K., and Hutter, M. (2020). Graph‐based Subterranean Exploration Path Planning Using Aerial and Legged Robots. J. Field Robotics 37, 1363–1388. doi:10.1002/rob.21993
Diaz, J. A., Pieri, D., Arkin, C. R., Gore, E., Griffin, T. P., Fladeland, M., et al. (2010). Utilization of In Situ Airborne MS-based Instrumentation for the Study of Gaseous Emissions at Active Volcanoes. Int. J. Mass Spectrom. 295, 105–112. doi:10.1016/j.ijms.2010.04.013
Diaz, J. A., Pieri, D., Wright, K., Sorensen, P., Kline-Shoder, R., Arkin, C. R., et al. (2015). Unmanned Aerial Mass Spectrometer Systems for In-Situ Volcanic Plume Analysis. J. Am. Soc. Mass. Spectrom. 26, 292–304. doi:10.1007/S13361-014-1058-X
Ericksen, J., Aggarwal, A., Fricke, G. M., and Moses, M. E. (2020). LoCUS: A Multi-Robot Loss-Tolerant Algorithm for Surveying Volcanic Plumes. Proc. - 4th IEEE Int. Conf. Robotic Comput. IRC 2020, 113–120doi. doi:10.1109/IRC.2020.00025
Fischer, T. P., and Aiuppa, A. (2020). AGU Centennial Grand Challenge: Volcanoes and Deep Carbon Global CO 2 Emissions from Subaerial Volcanism-Recent Progress and Future Challenges. Geochem. Geophys. Geosyst. 21, 8690. doi:10.1029/2019GC008690
Fischer, T. P., Arellano, S., Carn, S., Aiuppa, A., Galle, B., Allard, P., et al. (2019). The Emissions of CO2 and Other Volatiles from the World's Subaerial Volcanoes. Sci. Rep. 9, 54682. doi:10.1038/s41598-019-54682-1
Fischer, T. P., and Lopez, T. M. (2016). First Airborne Samples of a Volcanic Plume for δ13C of CO2determinations. Geophys. Res. Lett. 43, 3272–3279. doi:10.1002/2016GL068499
Fricke, G. M., Hecker, J. P., Griego, A. D., Tran, L. T., and Moses, M. E. (2016). ”A Distributed Deterministic Spiral Search Algorithm for Swarms,” in 2016 IEEE/RSJ International Conference on Intelligent Robots and Systems (IROS) (IEEE), 4430–4436. doi:10.1109/IROS.2016.7759652
Goff, F., and Janik, C. J. (2002). Gas Geochemistry of the Valles Caldera Region, New Mexico and Comparisons with Gases at Yellowstone, Long Valley and Other Geothermal Systems. J. Volcanology Geothermal Res. 116, 222. doi:10.1016/S0377-0273(02)00222-6
Golla, J. (2019). Natural Salinization of the Jemez River, New Mexico: An Insight from Trace Element Geochemistry. Earth Planet. Sci. ETDs.
Gomez, C., and Purdie, H. (2016). UAV- Based Photogrammetry and Geocomputing for Hazards and Disaster Risk Monitoring - A Review. Geoenvironmental Disasters 3, 1–11. doi:10.1186/S40677-016-0060-Y/FIGURES/5
Ilanko, T., Fischer, T. P., Kyle, P., Curtis, A., Lee, H., and Sano, Y. (2019). Modification of Fumarolic Gases by the Ice-Covered Edifice of Erebus Volcano, Antarctica. J. Volcanology Geothermal Res. 381, 119–139. doi:10.1016/J.JVOLGEORES.2019.05.017
James, M. R., Carr, B. B., D’Arcy, F., Diefenbach, A. K., Dietterich, H. R., Fornaciai, A., et al. (2020). Volcanological Applications of Unoccupied Aircraft Systems (UAS): Developments, Strategies, and Future Challenges. Volcanica 3 67-114. doi:10.30909/vol.03.01.67114
Johnson, M. S., Schwandner, F. M., Potter, C. S., Nguyen, H. M., Bell, E., Nelson, R. R., et al. (2020). Carbon Dioxide Emissions during the 2018 Kilauea Volcano Eruption Estimated Using OCO‐2 Satellite Retrievals. Geophys. Res. Lett. 47, e2020GL090507. doi:10.1029/2020GL090507
Koenig, N., and Howard, A. (2004). “Design and Use Paradigms for Gazebo, an Open-Source Multi-Robot Simulator,” in IEEE/RSJ International Conference on Intelligent Robots and Systems (IROS), Sendai, Japan, 28 Sept.-2 Oct. 2004 (IEEE). doi:10.1109/iros.2004.13897273
Lee, H., Muirhead, J. D., Fischer, T. P., Ebinger, C. J., Kattenhorn, S. A., Sharp, Z. D., et al. (2016). Massive and Prolonged Deep Carbon Emissions Associated with continental Rifting. Nat. Geosci. 9 (2 9), 145–149. doi:10.1038/ngeo2622
Liu, E. J., Aiuppa, A., Alan, A., Arellano, S., Bitetto, M., Bobrowski, N., et al. (2020). Aerial Strategies advance Volcanic Gas Measurements at Inaccessible, Strongly Degassing Volcanoes. Sci. Adv. 6, abb9103. doi:10.1126/sciadv.abb9103
Manga, M., Carn, S. A., Cashman, K. V., Clarke, A. B., Connor, C. B., Cooper, K. M., et al. (2017). Volcanic Eruptions and Their Repose, Unrest, Precursors, and Timing. Volcanic Eruptions and Their Repose, Unrest, Precursors, and Timing 1-122, 24650. doi:10.17226/24650
Neal, C. A., Brantley, S. R., Antolik, L., Babb, J. L., Burgess, M., Calles, K., et al. (2019). The 2018 Rift Eruption and summit Collapse of Kīlauea Volcano. Science 363, 367–374. doi:10.1126/science.aav7046
Quigley, M., Conley, K., Gerkey, B., Faust, J., Foote, T., Leibs, J., et al. (2009). “ROS: an Open-Source Robot Operating System,” in ICRA workshop on open source software, Kobe, Japan 3, 5
Radoglou-Grammatikis, P., Sarigiannidis, P., Lagkas, T., and Moscholios, I. (2020). A Compilation of UAV Applications for Precision Agriculture. Computer Networks 172, 107148. doi:10.1016/J.COMNET.2020.107148
Rahilly, K. E. (2020). “Diffuse Flux and Carbon Isotope Composition of Carbon Dioxide Emitted from Valles Caldera, Yellowstone Caldera, and Southwestern Utah Geothermal Sites,”. Ph.D. thesis (Albuquerque: University of New Mexico).
Reynolds, C. W. (1987). Proceedings of the 14th Annual Conference on Computer Graphics and Interactive Techniques - SIGGRAPH '87. Proc. 14th Annu. Conf. Comput. graphics interactive Tech. - SIGGRAPH ’87, 21. doi:10.1145/37401
Rossi, M., Brunelli, D., Adami, A., Lorenzelli, L., Menna, F., and Remondino, F. (2014). “Gas-drone: Portable Gas Sensing System on UAVs for Gas Leakage Localization,” in SENSORS, 2014 IEEE (IEEE), 1431–1434. doi:10.1109/icsens.2014.6985282
Shah, K., Ballard, G., Schmidt, A., and Schwager, M. (2020). Multidrone Aerial Surveys of Penguin Colonies in Antarctica. Sci. Robot. 5, 3000. doi:10.1126/SCIROBOTICS.ABC3000
Stix, J., de Moor, J. M., Rüdiger, J., Alan, A., Corrales, E., D'Arcy, F., et al. (2018). Using Drones and Miniaturized Instrumentation to Study Degassing at Turrialba and Masaya Volcanoes, Central America. J. Geophys. Res. Solid Earth 123, 6501–6520. doi:10.1029/2018JB015655
Stix, J., and de Moor, J. M. (2018). Understanding and Forecasting Phreatic Eruptions Driven by Magmatic Degassing. Earth Planets Space 70, 855. doi:10.1186/s40623-018-0855-z
Stockie, J. M. (2011). The Mathematics of Atmospheric Dispersion Modeling. SIAM Rev. 53, 349–372. doi:10.1137/10080991X
Sun, X., Ansari, N., and Fierro, R. (2020). Jointly Optimized 3D Drone Mounted Base Station Deployment and User Association in Drone Assisted Mobile Access Networks. IEEE Trans. Vehicular Technol. 69. doi:10.1109/tvt.2019.2961086
Thakur, D., Loianno, G., Liu, W., and Kumar, V. (2020). “Nuclear Environments Inspection with Micro Aerial Vehicles: Algorithms and Experiments,” in Springer Proceedings in Advanced Robotics (Springer). doi:10.1007/978-3-030-33950-0_1711
Vásárhelyi, G., Virágh, C., Somorjai, G., Tarcai, N., Szörényi, T., Nepusz, T., et al. (2014). “Outdoor Flocking and Formation Flight with Autonomous Aerial Robots,” in IEEE International Conference on Intelligent Robots and Systems, Chicago, IL, USA, 4-18 Sept. 2014. doi:10.1109/IROS.2014.6943105
Weber, T. R. (1995). An Analysis of Lemmings: A Swarming Approach to Mine Countermeasures in the VSW/SZ/BZ. Tech. rep., DTIC Document.
Keywords: coverage, flocking, robotics, unmanned aerial vehicle, CO2, volcanic
Citation: Ericksen J, Fricke GM, Nowicki S, Fischer TP, Hayes JC, Rosenberger K, Wolf SR, Fierro R and Moses ME (2022) Aerial Survey Robotics in Extreme Environments: Mapping Volcanic CO2 Emissions With Flocking UAVs. Front. Control. Eng. 3:836720. doi: 10.3389/fcteg.2022.836720
Received: 15 December 2021; Accepted: 31 January 2022;
Published: 15 March 2022.
Edited by:
Jonghoek Kim, Hongik University, South KoreaReviewed by:
Chunyan Zhang, Nankai University, ChinaRan Dai, Purdue University, United States
David M. Pyle, University of Oxford, United Kingdom
Copyright © 2022 Ericksen, Fricke, Nowicki, Fischer, Hayes, Rosenberger, Wolf, Fierro and Moses. This is an open-access article distributed under the terms of the Creative Commons Attribution License (CC BY). The use, distribution or reproduction in other forums is permitted, provided the original author(s) and the copyright owner(s) are credited and that the original publication in this journal is cited, in accordance with accepted academic practice. No use, distribution or reproduction is permitted which does not comply with these terms.
*Correspondence: John Ericksen, am9obmNhcmxAdW5tLmVkdQ==
 John Ericksen
 G. Matthew Fricke
 Scott Nowicki
 Tobias P. Fischer
 Julie C. Hayes1
 Karissa Rosenberger
 Samantha R. Wolf
 Rafael Fierro
 Melanie E. Moses