 Asaad AlZubaidi1
 Vikram Pandit
 Vivekanand Jawale
 Madhu Gupta
 Dattatray Late
- 1Medical Instruments Techniques Engineering Department, Al-bayan University Technical College of Engineering, Baghdad, Iraq
- 2Department of Chemistry, Haribhai V. Desai College of Arts, Science and Commerce (Autonomous), Pune, India
- 3Department of Chemistry, P.E. S’s Modern College of Engineering, Pune, India
- 4Department of Pharmaceutics, School of Pharmaceutical Sciences, Delhi Pharmaceutical Sciences and Research University (DPSRU), New Delhi, India
- 5Department of Physics, Federal University of Lavras, Campus Universitário, Lavras, Minas Gerais, Brazil
This study presents the synthesis and characterization of AgxFe2-xO3 nanoparticles as highly efficient photocatalysts and excellent antimicrobial agents. AgxFe2-xO3 nanoparticle synthesis was carried out through the sol–gel auto-combustion method. It was extensively characterized using X-ray diffraction (XRD), which confirmed the formation of crystalline α-Fe2O3 nanoparticles with a crystallite size of 22.23 nm. Ag-doped Fe2O3 has an average crystallite size of 23.08 nm. Fourier transform infrared (FTIR) spectroscopy provided insights about metal oxide bond formation and constant force for octahedral and tetrahedral sites, which suggest the location of the cation and anion. Scanning electron microscopy (SEM) and transmission electron microscopy (TEM) revealed rhombohedral Ag-doped Fe2O3 nanomaterials with a uniform particle size around 20–50 nm, which matches the XRD results. UV–vis spectroscopy shows absorption shifting toward visible light for the AgxFe2-xO3 compared to pristine Fe2O3, indicating the utilization of the maximum light spectrum for efficient light harvesting in the visible region. AgxFe2-xO3 exhibited excellent stability and reusability for visible-light-driven photocatalytic dye degradation with a rate constant of 1.27 × 10⁻² min−1, which is two-fold more than that of the pristine Fe2O3 (0.51 × 10⁻² min−1). AgxFe2-xO3 was also found to be more efficient in inhibiting the growth of Proteus mirabilis with a 16 mm zone of inhibition.

1 Introduction
The discharge of organic dyes from industrial processes into water bodies is a significant environmental concern due to their harmful effects on ecosystems and human health (Tkaczyk et al., 2020; Al-Tohamy et al., 2022; Belkhedkar et al., 2016; Mehra et al., 2021). These dyes, such as methylene blue, rhodamine, eosin yellow, crystal violet, etc., have been extensively used in textile, paper, leather, and cosmetic industries, and such dyes remain persistent and create potential toxicity (Tkaczyk et al., 2020; Al-Tohamy et al., 2022). Conventional wastewater treatment methods, including physical, biological, and chemical treatment, often fall short of effectively removing these pollutants (Piaskowski et al., 2018; Donkadokula et al., 2020).
E.K. Lipp et al. and Cabral et al. separately reported that microbes are also transmitted to humans and animals through contaminated water sources, causing diseases like cholera in humans and disruption in aquatic systems (Lipp et al., 2002; Cabral, 2010). Researchers have turned to photocatalytic degradation as a promising approach for addressing this issue. E. Cabiscol et al. reported that the method involves the utilization of semiconductor nanomaterials to generate reactive oxygen species (ROS) under light, which breaks down the dye molecules into harmless by-products (Cabiscol et al., 2000; Patra et al., 2015). ROS damage microbial cell membranes, proteins, and DNA, leading to the inactivation of pathogens. Hence, the photocatalytic process enables efficient water disinfection and reduces microbial load and organic dyes, which helps protect human and aquatic life.
There are various reported organic and inorganic semiconductor photocatalysts, such as pentacene quinone (PQ) (Pandit et al., 2014), graphitic carbon nitride (g-C4N4), zinc oxide (ZnO) (Pandit et al., 2014), tin oxide (SnO2), tungsten oxide (WO3), iron oxide (Fe2O3) (Jawale et al., 2021), and titanium dioxide (TiO2) (Konstantinou and Albanis, 2004). Among these semiconductors, Fe2O3 has garnered significant attention due to its abundance, low cost, non-toxicity, and excellent chemical and thermal stability. With a bandgap of 1.8–2.0 eV (Konstantinou and Albanis, 2004; Uttam Pandit et al., 2024), Fe2O3 can absorb approximately 40% of the solar spectrum, making it a promising candidate for photocatalytic and antimicrobial applications (Dhlamini et al., 2017). However, its practical use is often limited by challenges such as poor electron conductivity, rapid electron–hole recombination, and slow oxygen evolution kinetics (Uttam Pandit et al., 2024). To overcome these limitations, researchers have explored functionalized strategies, such as doping, heterostructure formation, and plasmonic enhancement to improve the photocatalytic and antimicrobial performance of Fe2O3 (Shinde et al., 2011; Mishra and Chun, 2015). These functionalization strategies not only enhance photocatalytic activity under visible light but also confer desirable characteristic such as stability, cost effectiveness, and non-toxicity.
Doping of Fe2O3 with transition metals such as Cu (Gao et al., 2012; Sun et al., 2021), Ti (Shams et al., 2019; Reveendran and Khadar, 2018), and Zn (Nikolic et al., 2013) has been shown to enhance its optical absorbance, electrical conductivity, and charge separation efficiency. Plasmonic loading is an effective strategy to further improve the photocatalytic performance of Fe2O3 under visible light. Various plasmonic-based photocatalysts include gold (Au), silver (Ag), palladium (Pd), and chromium (Cr). Au nanoparticles possess excellent plasmonic properties, but their abundance is low, and they are more expensive than Ag. Ag nanoparticles offer several advantages, such as cost-effectiveness and superior plasmonic efficiency in the visible light range. Ag-doped Fe2O3 nanomaterials have demonstrated impressive photocatalytic activity under visible light irradiation, particularly for the degradation of organic dyes like methylene blue (MB) (Bhowmik et al., 2020; Wang et al., 2018; Hitam and Jalil, 2020; Khalaji, 2022). V. K. Sharma et al. independently reported that Ag shows a broad spectrum of antimicrobial activity, which disrupts cell membranes, inhibits enzymatic functions, and interferes with DNA replication, leading to cell death (Araujo et al., 2021; Sharma et al., 2009). When Ag is doped with Fe2O3, it enhances the charge transfer mechanism and reduces the electron activity to reduce microbial infections. The incorporation of Ag nanoparticles expands the absorption range of Fe2O3 into the visible region and promotes the effective generation and separation of electron-hole pairs, thereby enhancing overall photocatalytic and antimicrobial activity.
There are several reported methods for the synthesis of Ag-doped Fe2O3, such as hydrothermal, microwave-assisted synthesis, electrochemical deposition, sonochemical synthesis, and the sol–gel auto-combustion method (Bera et al., 2014; Park et al., 2018). The sol-gel auto-combustion method gained popularity for synthesizing Ag-doped Fe2O3-based nanomaterial due to its simplicity, cost-effectiveness, and ability to produce materials with controlled size, shape, and porosity. Additionally, this method allows the incorporation of doping and plasmonic materials, which enables the fabrication of advanced photocatalysts with enhanced Fe2O3 properties. For instance, Ag-doped Fe2O3 nanostructures have demonstrated remarkable applications in antibacterial, gas sensing, energy storage, water purification, biomedical, solar cell, and corrosion protection.
The present study focuses on the synthesis and characterization of AgxFe2-xO3 (X = 0.0000, 0.0025, 0.0075, and 0.0125) nanostructures using the sol–gel auto-combustion method, which shows excellent photocatalytic and antimicrobial activity. The photocatalytic degradation of methylene blue (MB) under visible light irradiation revealed that the Ag-doped 0.0125 sample exhibits the highest degradation up to 75% in 1 h, with a rate constant 1.270 × 10⁻² min−1, which is nearly twice that of pristine Fe2O3 (0.515 × 10⁻² min−1). The antimicrobial activity of AgxFe2-xO3 nanoparticles was evaluated against various bacteria and fungi strains, where X = 0.0125 demonstrates a significant inhibition zone of 16 mm for Proteus mirabilis, 14.8 mm for E.coli, 13.6 mm for Candida, 13.6 mm for Bacillus subtilis, and 13.8 mm for Aspergillus niger and Staphylococcus aureus. The AgxFe2-xO3 nanoparticles exhibit superior antibacterial efficiency against both Gram-positive and Gram-negative bacteria compared to fungal strains.
This work presents key advancements beyond existing Ag/Fe2O3 systems as the optimal Ag concentration (Ag 0.0125 in AgxFe2-xO3), maximizing both activities. It also provides a deeper mechanistic insight into the synergy of Ag SPR-enhanced visible light absorption, efficient charge separation at the Ag/Fe2O3 interface, and ROS generation for exceptional combined performance (>95% MB degradation in 60 min plus significant antimicrobial efficacy) under optimized conditions, surpassing systems focused on single applications. We believe that combining this system with our other earlier reported photocatalyst materials will surely enhance photocatalytic activities (Pandit et al., 2025; Kumar Singh et al., 2024; Daphal et al., 2025; Pandit V. U. et al., 2022; Pandit V. U. et al., 2022; Pandit, 2022; Grouli et al., 2023; VRU Pandit, 2022; Jawale et al., 2022; Nevase et al., 2015).
2 Experimental methods
2.1 Chemicals used in the synthesis method
AgxFe2-xO3 were (X: 0.0000, 0.0025, 0.0075, and 0.0125) synthesized using the sol–gel auto-combustion method. The starting materials used in the synthesis were of pure and analytical grade, and no additional purification was performed. Ferric nitrate nonahydrate (Fe(NO3)3.9H2O) was obtained from Himedia Laboratory LLC, USA (98.0%). Silver nitrate AgNO3 was purchased from Loba Chemie PVT, Ltd. (99.9%). Citric acid (C6H8O7) was purchased from Research Lab Fine Chem Industries, India (99.0%). An ammonia solution of 25% extra pure NH4OH was obtained from Loba Chemicals, PVT. Double-distilled water served as the solvent for the synthesis process.
2.2 Synthesis process
The Supplementary Figure S1 illustrates the detailed synthesis of AgxFe2-xO3, which was carried out through a previously reported method (Uttam Pandit et al., 2024). The calculated amounts of ferric nitrate nonahydrate (Fe (NO3)3.9H2O), silver nitrate (AgNO3), citric acid (C6H8O7), and ethylene glycol (CH2OH)2 were dissolved in deionized water. The pH of the resulting solution was adjusted to 9 by gradually adding ammonia solution. Once the pH reached 9, the solution was heated at a temperature of 80 °C–90 °C with continuous stirring. As a result, the solution transformed into a dried gel, which then underwent self-propagation to form a fluffy powder. The synthesized material was subsequently subjected to calcination at 550 °C. The yield of the product was around 89%. After calcination, the material underwent characterization using advanced instrumental techniques to analyze its properties. The calcinated material was employed for photocatalytic and antimicrobial applications.
2.3 Material characterizations
The synthesized samples were examined using various advanced analytical techniques. The crystallite size, X-ray density, and dislocation density were analyzed using a powder X-ray diffractometer (Rigaku Ultima IV) with a Cu–Kα radiation source (λ = 1.54 Å), scanning in the 2θ range of 20°–80° at a rate of 5°/min. The functional group and bonding characteristics were identified through Fourier transform infrared (FTIR) spectroscopy using a Bruker Platinum ATR spectrometer. The optical properties, including the absorbance of the dye solution, were studied using a UV–visible spectrophotometer (Shimadzu UV-3600 and Shimadzu UV-800). The surface morphology was examined through scanning electron microscopy (SEM) using a Hitachi S3400N, and transmission electron microscopy (TEM) was performed using a JEOL JEM 2100 Plus instrument. Elemental composition was determined using energy-dispersion X-ray analysis (EDAX) integrated with the SEM.
2.4 Photocatalytic activity study
The photocatalytic activity of synthesized AgxFe2-xO3 (X: 0.0000, 0.0025, 0.0075, and 0.0125) was studied through monitoring the degradation of MB dye as a function of time. In the experiment, 10 mg of the catalyst was dispersed in the reaction flask containing 100 mL of 10 ppm MB dye solution. To establish adsorption-desorption equilibrium between the dye and the catalyst, the mixture was stirred initially in the dark for 15 min. After equilibrium was achieved, the sample was exposed to sunlight while being continuously stirred with a magnetic stirrer to maintain homogeneity. After a fixed time interval, 2 mL of the sample was withdrawn and centrifuged for about 15 min at 6,000 rpm to separate the catalyst particles. The supernatant liquid was analyzed using a UV-3,600 Shimadzu UV–visible spectrophotometer by monitoring the change in concentration. The absorbance value was recorded at 526 nm and was used to determine the percentage of dye degradation.
The percentage of MB degradation was calculated using the following equation:
where C0 is the initial concentration of MB, and Ct is the concentration at irradiation time t.
2.5 Antimicrobial activity study
The agar well diffusion method was employed to determine the antimicrobial activity of the synthesized AgxFe2-xO3 (X: 0.0000, 0.0025, 0.0075, 0.0125) nanoparticles. Strains viz., Candida albicans (NCIM 3100), E.coli (NCIM2065), A. niger (ATCC504), S. aureus (NCIM2178), B. subtilis (NCIM2063), and P. mirabilis (NCIM2388 were used to assess the antibacterial activity. Here, 100 µL of inoculum (106 CFU/mL) was swabbed onto Muller–Hinton agar (Himedia) plates using a sterilized cotton bud. Five wells were bored in each plate with a sterile cork borer. Stock solutions of AgxFe2-xO3 and streptomycin (control) were prepared at a concentration of 1 mg/mL, and DMSO was used as a negative control. Aliquots (80–90 µL) of these samples were added to each well. The plates were incubated at 37 C for 24–48 h. The minimum inhibition concentration (MIC) of the AgxFe2-xO3 was observed by the broth dilution technique in the concentration range of 1,000 μg/mL, 500 μg/mL, 125 μg/mL, 62.5 μg/mL, and 31.25 μg/mL, respectively.
3 Results and discussions
3.1 X-ray diffraction analysis
The XRD analysis (Figure 1) was carried out with Cu–Kα radiation (λ = 1.54182 Å) in the 2θ range of 20°–80°, which provides detailed insights into the structural properties of the materials. XRD revealed the distinct peaks corresponding crystallographic planes, (012), (104), (110), (113), (024), (116), (122), (214), (300), (119), and (220), which confirmed the rhombohedral crystal structure of α-Fe2O3 (JCPDS NO. 79–174) (Zhao et al., 2021). Additionally, the presence of (111) and (200) peaks confirms the doping of Ag in the Fe2O3 lattice, which aligns with the standard reference (JCPDS NO. 89–3722) (Karunakaran et al., 2013). The XRD pattern for α-Fe2O3 is similar to that of Ag-doped Fe2O3 (0.0025, 0.0075, 0.0125), except for the appearance of Ag-related peaks. No peaks correspond to other phases, indicating the formation of a highly pure rhombohedral Ag-doped Fe2O3.
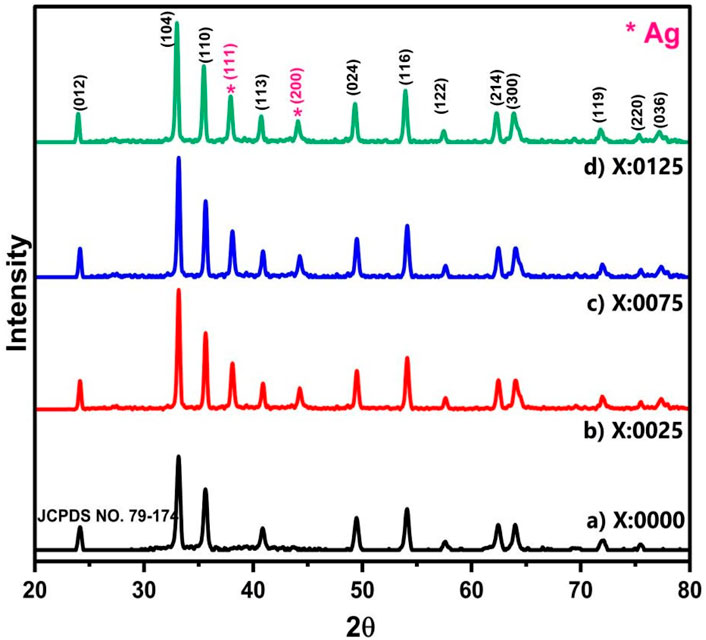
Figure 1. The X-ray diffraction (XRD) analyses of AgxFe2-xO3 for X: (a) 0.0000, (b) 0.0025, (c) 0.0075, and (d) 0.0125.
The changes in lattice parameters, crystallite size, X-ray density, and dislocation density are documented in Table 1. Krejcikova et al. reported that crystallite size was calculated with the Debye–Scherrer formula (Equation 1). Initially, it increases with 0.0025 Ag doping (23.22 nm–22.99 nm), due to the stabilization of Ag+ ions in the Fe2O3 lattice, which reduces defects and promotes crystal growth (Krejčíková et al., 2012).
However, at the 0.0075 Ag and 0.0125 Ag concentrations, the crystallite size decreases, as the introduction of Ag+ ions, which introduces strain and defects into the lattice, inhibits further crystal growth and leads to a smaller crystallite size, which is documented in Supplementary Figure S2a. The lattice parameters were calculated with Equation 2. They increased from an initially low Ag doping of the material (8.9321 Å to 8.9694 Å) because the substitution of Fe3+ ions (ionic radius ∼0.64 Å) by larger Ag+ ions (ionic radius ∼1.15 Å) causes lattice expansion. However, at higher Ag (0.0075, 0.0125) concentrations, the lattice parameters decrease slightly (8.9347 Å to 8.9321 Å), which may be attributed to the saturation of Ag+ ions in the lattice or the formation of Ag clusters on the surface, reducing the overall strain on the α-Fe2O3 lattice, as recorded in Supplementary Figure S2b.

Table 1. The crystallographic parameters: lattice parameters, crystalline size, X-ray density, and dislocation density of AgxFe2-xO3, where X: 0.0000, 0.0025, 0.0075, and 0.0125.
The X-ray density was calculated with Equation 3. It increases with Ag (0.0025) doping due to the higher atomic weight of Ag (107.87 g/mol) compared to Fe (55.85 g/mol), which increases the overall density of the material. However, at higher Ag concentrations (0.0075, 0.0125), the X-ray density alters slightly, which may be due to the change in lattice packing efficiency or the formation of an Ag cluster on the surface documented in Supplementary Figure S2c. Equation 4 helps calculate dislocation density. It decreases initially with low Ag (0.0025) concentration, as Ag+ ions occupy interstitial sites or substitute Fe3+ ions, reducing lattice strain and defects. However, at higher Ag (0.0075, 0.0125) concentrations, the dislocation density increases (Supplementary Figure S2d), likely due to the introduction of additional strain and defects caused by the higher concentration of Ag+ ions, which disrupts the lattice structure.
3.2 FTIR and UV–visible analysis of Ag-doped Fe2O3 samples
Figure 2a reveals the FTIR spectra of Ag-doped Fe2O3 samples (X: 0.0025, 0.0075, 0.0125) and gives significant insights into structural modification induced by the incorporation of Ag ions in the lattice. The vibrational bonds corresponding to the octahedral site and tetrahedral site were calculated using Equations 5–8 and are documented in Table 2. A slight (194,171.88–197,082.58) change was observed in the octahedral bond (v2) with an increase in Ag concentration (X = 0 to X = 0.0125). It suggests a change in the bond length and local symmetry around the octahedral sites, which may be due to the substitution of Fe3+ by Ag ions. Additionally, the force constant for tetrahedral sites (v2) increases (119,192.71–121,499.32) with increasing Ag concentrations (X = 0 to X = 0.0125).
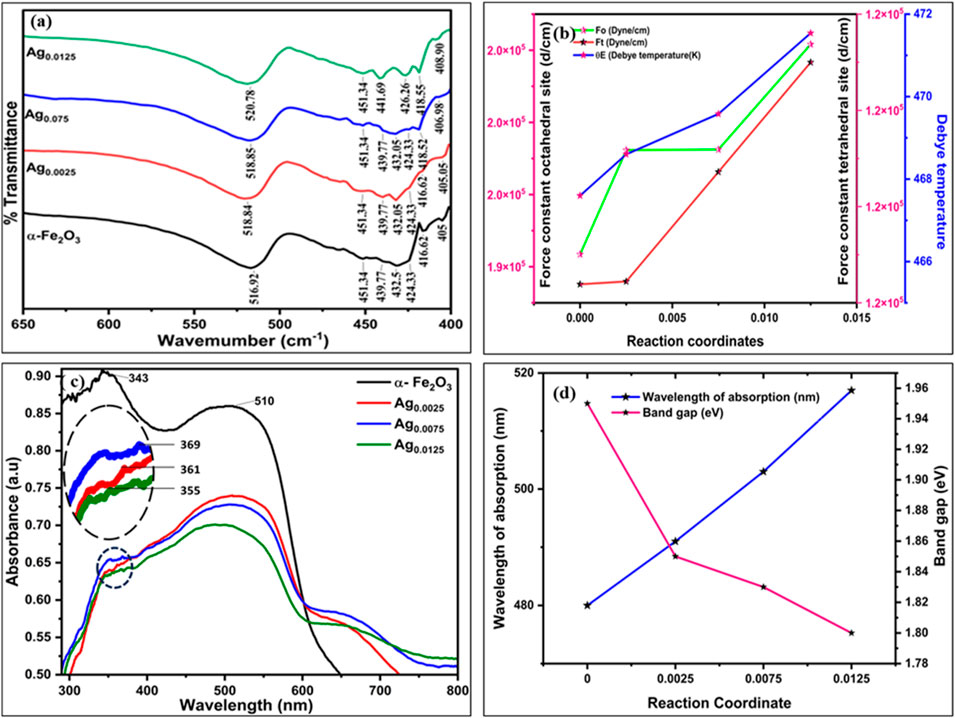
Figure 2. (a) FTIR spectra of AgxFe2-xO3, where X: 0, 0.0025, 0.0075, 0.0125 and (b) variation in the force constant at the octahedral sites (F0), tetrahedral sites (Ft), and Debye temperature θE. (c) UV–visible spectra of AgxFe2-xO3, where X: 0, 0.0025, 0.0075, 0.0125 (inset of (c) is the zoom image of the UV–visible spectrum of AgxFe2-xO3, where X: 0, 0.0025, 0.0075, 0.0125) and (d) wavelength of absorption and band gap vs. Ag concentrations.

Table 2. FTIR spectral data variation in the force constant at the octahedral sites (F0), tetrahedral sites (Ft), and Debye temperature θE for AgxFe2-xO3, where X: 0, 0.0025, 0.0075, 0.0125.
This indicates stronger cation-oxygen bonding with higher Ag concentrations, which impacts reduced bond length and enhances electrostatic interaction at tetrahedral sites. This is further supported by the rise in the Debye temperature (θE), which was calculated by Equation 7. As concentration increases from X = 0 to X = 0.0125, the Debye temperature increases from 462.60 K to 471.54 K, which may increase lattice vibrations and improve thermal stability. Figure 2b findings suggest that the incorporation of Ag ions into the Fe2O3 lattice not only modifies the local structural environment but also influences the vibrational and thermal properties of the materials, which could have implications for catalytic behavior.
The UV–visible absorption spectra of AgxFe2-xO3 (X: 0, 0.0025, 0.0075, 0.0125) are presented in Figure 2c. A systematic bathochromic shift in the absorption edge was observed with increasing Ag doping concentration. Undoped α-Fe2O3 exhibits an absorption edge at 480 nm, corresponding to a band gap of 1.85 eV. Upon Ag incorporation, the absorption edge progressively red-shifted to 491 nm (X = 0.0025), 503 nm (X = 0.0075), and 517 nm (X = 0.0125), indicating band gap narrowing. Synchronously, a distinct absorption emerged in the UV region, centered near 369 nm for X = 0.0025. This peak shows a hypsochromic shift to 361 nm (X = 0.0075) and 355 nm (X = 0.0125) with higher Ag loading (inset of Figure 2c is the zoom image of the UV- visible spectrum of AgxFe2-xO3, where X: 0, 0.0025, 0.0075, 0.0125). Khurana et al. reported the same trend and attributed it to electronic interactions between the Ag species and the Fe2O3 matrix, likely arising from localized surface plasmon resonance (LSPR) of metallic Ag nanoparticles (Khurana and Jaggi, 2021).
Ag loading on Fe2O3 nanoparticles can influence the shifting of the band gap from 1.85 eV to 1.70 eV. This may depend on various factors such as quantum confinement effects and charge transfer between Ag and Fe2O3, providing insights into the electronic structure and the potential for light absorption. Additionally, Ag doping in AgxFe2-xO3 exhibits a surface plasmonic resonance (SPR) effect due to the presence of Ag nanoparticles on the surface. SPR shows the collective oscillation of conducting electrons in Ag and Fe2O3 nanoparticles when exposed to light, leading to strong absorption in the visible region. This is analyzed in Figure 2c through the shifting of peaks in the 350–500 nm region. It is concluded that AgxFe2-xO3 shows extended absorbance in the visible region and captures more photons, which impacts high SPR and leads to increased photocatalytic and antimicrobial activity.
The band gap values of the corresponding materials were calculated using Equation 8 and documented as shown in Figure 2d.
The calculated values of band gaps 1.85 eV, 1.75 eV, 1.71 eV, and 1.70 eV are reported in Table 3 (Supplementary Figure S3). This reduction in band gap may be attributed to the incorporation of Ag ions into the Fe2O3 lattice, which introduces localized electronic states near the conduction and valence bands. The interaction occurs due to sp-d exchange and d-d transitions. It modifies the electronic structure effectively, which extends the light absorption in the visible region.

Table 3. (a) UV-visible spectra of AgxFe2-xO3, where X: 0, 0.0025, 0.0075, 0.0125 and (b) wavelength of absorption and band gap with respect to Ag concentrations.
3.3 Scanning electron microscopy (SEM)
Figures 3a,b present the FESEM sheet-like micrograph of Fe2O3 nanoparticles, revealing the formation of fine, asymmetrically shaped particles with dimensions ranging from 50 nm to 70 nm.
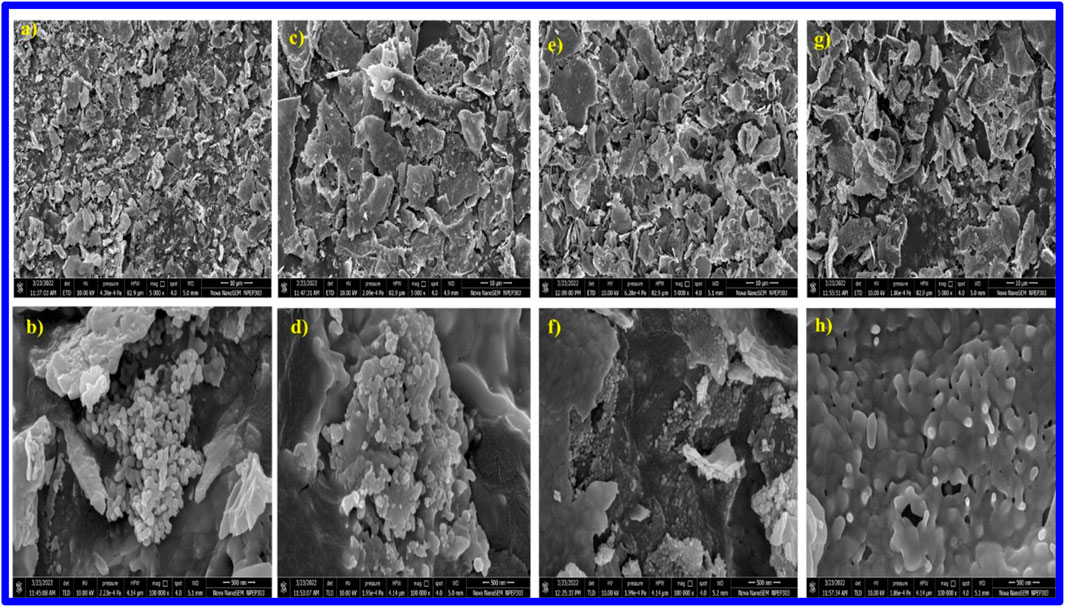
Figure 3. Field emission scanning electron microscopic (FESEM) analysis of AgxFe2-xO3, where X = (a,b) 0.0000, (c,d) 0.0025, (e,f) 0.0075, (g,h) 0.0125.
Ag nanoparticles were well dispersed in different concentrations from 0.0025, 0.0075, and 0.01253, as shown in Figures 3c–h, respectively, which provide valuable information about the dispersion of Ag nanoparticles on the Fe2O3 surface and their distribution within the material. Herein, silver appears as smaller, separate entities on the surface of the α-Fe2O3 particles (Figures 3a–h). The SEM images a-c-e-g portray irregularly shaped particles or aggregates that make 2–3-micron-sized sheets with spikes on the surface, due to the dispersion of Ag nanoparticles onto the Fe2O3 material. Ag nanoparticles were well dispersed and appeared as smaller grooves from the sheet’s separate entities on the surface of the Fe2O3 particles.
The energy-dispersive X-ray spectroscopy (EDS) analysis confirms the presence of oxygen (O), iron (Fe), and silver (Ag) within the Ag-doped samples. Quantitative elemental composition data for the representative composition AgxFe2-xO3 (X = 0.0125) are summarized in Table 4. The measured weight percentages are 27.5% (O), 69.0% (Fe), and 3.5% (Ag), confirming the successful incorporation of Ag into the Fe2O3 matrix. The full EDS spectra are provided in Figure 4.

Table 4. Elemental analysis with weight for AgxFe2-xO3, where X: 0.0125%.
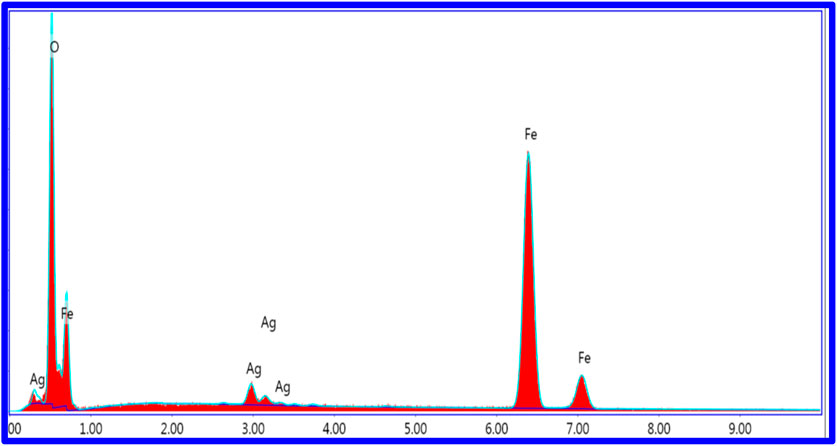
Figure 4. Elemental analysis for AgxFe2-xO3, where X: 0.0125 with respect to Ag concentrations.
3.4 Transmittance electron microscopy
Figures 5a–e illustrate TEM images at a concentration of 0.0125 AgxFe2-xO3. It can be seen that the morphology of Fe2O3 particles is a tiny rod-like morphology of 30–50 nm. The images 5a-d clearly reveal that Ag nanoparticles are highly dispersed on the surface of the Fe2O3. Figures 5e,f is a high-resolution TEM image that shows lattice fringes with a spacing of approximately 0.236 nm. A statistical histogram of the diameter distribution of Ag NPs in 0.0125 AgxFe2-xO3 (He et al., 2022) is shown in the inset of Figure 5e.
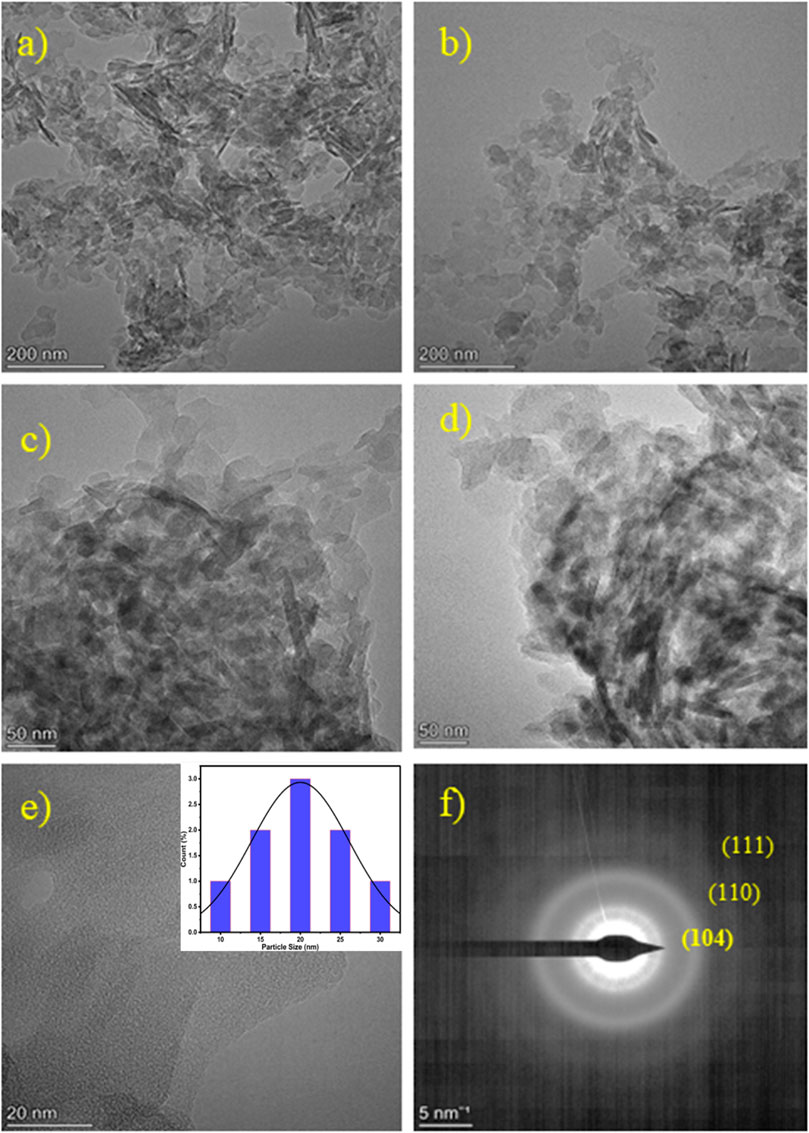
Figure 5. (a–e) Transmission Electron Microscopic (TEM) analysis of 0.0125 AgxFe2-xO3. Inset of (e) is particle size distribution (histogram) and (f) SAED pattern of 0.0125 AgxFe2-xO3.
This spacing corresponds to the Ag (111) plane, indicating the crystal structure of the Ag nanoparticles. Moreover, the size distribution of Ag NPs is narrow, with an average size of 10.63 nm, as depicted in the figure. This indicates that the present method used demonstrates effective control over the size of Ag nanoparticles. Overall, the TEM analysis demonstrates that Ag nanoparticles are well dispersed on the Fe2O3 nanorods, with a consistent crystal structure and narrow size distribution (Pandit V. U. et al., 2022).
3.5 Photocatalytic activity for AgxFe2-xO3
Figure 6a shows the proposed mechanism for photocatalytic degradation of MB dye using AgxFe2-xO3. Figures 6b,c show the kinetic and percentage dye degradation study for 10 ppm MB dye degradation using AgxFe2-xO3, where X: 0.0000, 0.0025, 0.0075, 0.0125. Figure 6d shows a recycle study of up to five cycles for x: 0.0125 AgxFe2-xO3. The photocatalytic degradation mechanism for MB dye using AgxFe2-xO3 (X: 0, 0.0025, 0.0075, 0.0125), documented in Figure 6a, may be significantly enhanced under visible light irradiation due to the improved charge carrier separation and surface plasmonic resonance effect of Ag. When Fe2O3 was exposed to visible light, it generated the electron–hole pair (e−/h+), initiating redox reactions. The Fe2+ atom in the catalyst reacts with H2O to generate Fe3+ and produces hydroxyl radicals (•OH), which are highly reactive and contribute to breaking down the MB dye molecules. The Ag nanoparticles play a crucial role in increasing the photocatalytic activity of Fe2O3 compared to previous reports (Supplementary Table 2). Ag nanoparticles act as electron acceptors, effectively trapping photogenerated electrons from the conduction band of Fe2O3. This electron transfer prevents recombination with photogenerated holes, thereby prolonging the lifetime of charge carriers. Additionally, the trapped electrons react with oxygen molecules to generate superoxide radical anions (O2−), which further contribute to the degradation of MB dye. The plasmonic effect of Ag nanoparticles also increases light absorption, promoting more efficient excitation of charge carriers and accelerating the photocatalytic process.
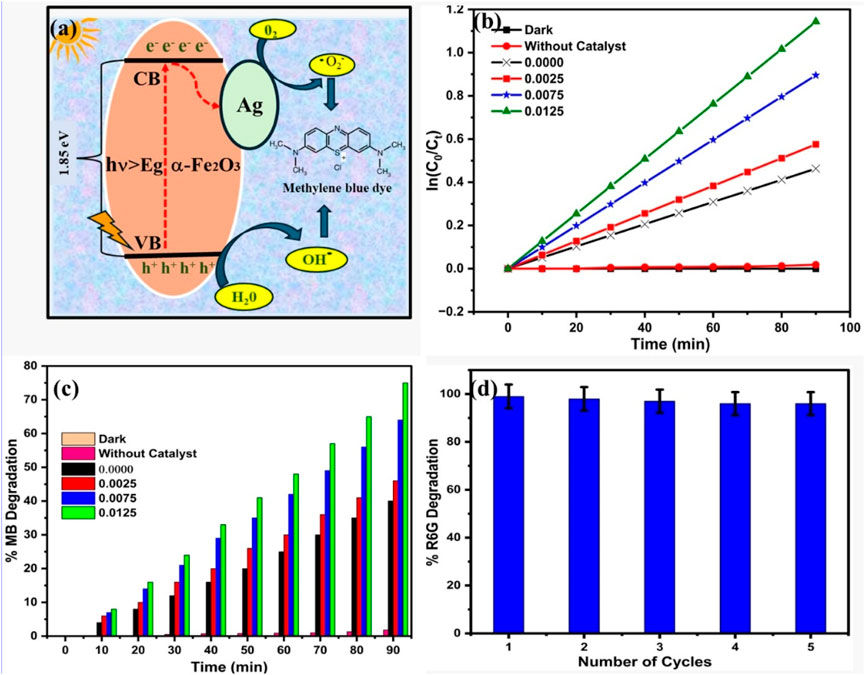
Figure 6. (a) Photocatalysis mechanism, (b) kinetic plot of dye degradation, (c) % dye degradation, and (d) recycle study for the dye degradation.
3.5.1 Reaction kinetics for the degradation of MB
The reaction kinetics data also support the enhanced photocatalytic performance of AgxFe2xO3, as shown in Table 5.

Table 5. Photocatalytic degradation of MB dye in the dark, without catalyst, and with AgxFe2-xO3 catalyst where X: 0, 0.0025, 0.0075, 0.0125.
The rate constant (Kapp) increases with increasing Ag concentrations. Pure Fe2O3 exhibits a rate constant of 0.515 × 10⁻² min−1, while the highest photocatalytic activity was observed for 0.0125 with a rate constant of 1.270 × 10⁻² min−1, which is almost 2.5 times higher than pure Fe2O3. We have compared the rate of MB degradation with P25 TiO2 as a representative catalyst candidate and concluded that the Ag dopant materials are moving towards the TiO2 results, and there is a scope for the exact optimization of the Ag-doped Fe2O3 study.
3.5.2 Recycling study
The reusability potential of AgxFe2-xO3 for MB dye degradation was evaluated up to five consecutive cycles for x = 0.0125, illustrated in Figure 6d, as it shows the highest activity. After each batch of reactions, the catalyst was recovered via centrifugation, washed thoroughly with deionized (DI) water, and dried before reuse. The catalyst shows excellent stability and high photocatalytic degradation efficiency, attributed to the sustained generation of •OH radicals. The integrity of the catalyst was confirmed through XRD and FTIR analysis conducted after the photocatalytic experiment. The result indicates no significant changes in the crystal structure or functional group, further highlighting the stability and reusability of the material.
3.6 Antimicrobial activity for AgxFe2-xO3
The antimicrobial activity of nanoparticles (100 μg/mL) and the commercial antibiotic (50 μg/mL) has been examined, and significant zones of inhibition (ZOIs) were observed, as shown in Figures 7a,b. The antibacterial activity of AgxFe2-xO3 was tested against Candida albicans (NCIM 3100), E.coli (NCIM 2065), Aspergillus niger (ATCC504), Staphylococcus aureus (NCIM 2178), Bacillus subtilis (NCIM 2063), and Proteus mirabilis (NCIM2388) using the agar well diffusion method. From the ZOI values, AgxFe2-xO3 compounds are more efficient in inhibiting the growth of Proteus mirabilis for X: 0.0125, as a maximum ZOI of 16 mm has been observed (Supplementary Table 1). The zone of inhibition for X: 0.0125 against C. albicans was 13.6 mm, E. coli was 14.8 mm, Aspergillus niger was 13.8 mm, S. aureus was 13.8 mm, B. subtilis was 13.6 mm, and Proteus mirabilis was 16 mm. AgFNPs were found to be more efficient against Gram-positive and Gram-negative strains than against the fungal strains.

Figure 7. (a) The antimicrobial study bar graphs for AgxFe2-xO3 (X: 0.0000, 0.0025, 0.0075, 0.0125, 0.0125) nanoparticles. Strains viz., Candida albicans (NCIM 3100), E. coli (NCIM2065), Aspergillus niger (ATCC504), Staphylococcus aureus (NCIM2178), Bacillus subtilis (NCIM2063), and Proteus mirabilis (NCIM2388) were used to assess the antibacterial activity. (b) Photographs of test AgxFe2-xO3, X: 0.000 Petri plates.
These results were compared to commercial antibiotic streptomycin, which have zones of inhibition of 20 mm, 28 mm, 30 mm, 26 mm, 25 mm, and 30.00 mm for Bacillus subtilis, Staphylococcus aureus, E. coli, Proteus mirabilis, Candida albicans, and Aspergillus niger, respectively, illustrated in photographs of the test and control of AgxFe2-xO3 on petri plates (Supplementary Figure S5). Possible mechanisms for the reduced effects of AgFe2O3 against Gram-positive or Gram-negative bacteria may be that, because these AgFe2O3 are highly stable in the ambient environment, there is less contribution of metal ion release for antibacterial activity. In contrast, reactive oxygen species may be generated from Fe2O3 when exposed to visible light. The created electron-hole pairs can contribute to the generation of reactive oxygen species such as superoxide radical anions (O2−), hydroxyl radicals (OH.), etc. The generated species result in membrane desorption, leading to the death of the bacteria (Supplementary Table 4). Various interactions like electrostatic, dipole–dipole, hydrogen bond, hydrophobic, and van der Waals interactions are responsible for disruption of cellular function and disruption and disorganization of membranes.
4 Conclusion
In conclusion, AgxFe2-xO3 nanoparticles were synthesized successfully using the simple sol–gel auto-combustion method. An increase in the Ag content resulted in a decrease in the crystallite size of α-Fe2O3 to 22.26 nm. As Ag concentration increased from X = 0.0000 to X = 0.0125, the octahedral bond (V1) slightly changed, indicating alterations in bond length and symmetry due to Fe3+ ions being replaced by Ag+ ions. Additionally, the force constant for tetrahedral sites (V2) increased, which suggests the formation of a ferrite structure. The band gap decreased progressively with increasing Ag content, which is significant for photocatalytic and antimicrobial applications. The FESEM images revealed a sheet-like morphology. TEM analysis of 0.0125% Ag-incorporated Fe2O3 revealed a rod-like morphology with lengths ranging from 30 to 50 nm. The incorporation of plasmonic Ag nanoparticles into AgxFe2-xO3 showed excellent photocatalytic degradation of MB dyes, achieving a rate constant of 1.97 × 10⁻² min-1, nearly double that of Fe2O3 (0.515 × 10⁻² min−1). AgxFe2-xO3 also exhibited greater efficacy against Gram-positive and Gram-negative strains than against fungal strains. At X = 0.0125, AgxFe2-xO3 showed the highest inhibition against P. mirabilis, with a maximum zone of inhibition (ZOI) of 16 mm.
Data availability statement
The original contributions presented in the study are included in the article/Supplementary Material, further inquiries can be directed to the corresponding authors.
Author contributions
AA: Formal Analysis, Data curation, Methodology, Resources, Investigation, Writing – review and editing. VP: Methodology, Writing – review and editing, Formal Analysis, Data curation, Resources, Investigation. VJ: Data curation, Resources, Formal Analysis, Methodology, Writing – review and editing, Investigation. MG: Writing – review and editing, Methodology, Conceptualization, Investigation, Formal Analysis, Resources, Data curation. DL: Writing – review and editing, Conceptualization, Writing – original draft, Formal Analysis, Visualization, Project administration, Resources.
Funding
The author(s) declare that no financial support was received for the research and/or publication of this article.
Acknowledgments
The authors would like to thank the principal of H. V. Desai College and Modern College of Engineering, Pune, for use of their lab facilities.
Conflict of interest
The authors declare that the research was conducted in the absence of any commercial or financial relationships that could be construed as a potential conflict of interest.
Generative AI statement
The author(s) declare that no Generative AI was used in the creation of this manuscript.
Any alternative text (alt text) provided alongside figures in this article has been generated by Frontiers with the support of artificial intelligence and reasonable efforts have been made to ensure accuracy, including review by the authors wherever possible. If you identify any issues, please contact us.
Publisher’s note
All claims expressed in this article are solely those of the authors and do not necessarily represent those of their affiliated organizations, or those of the publisher, the editors and the reviewers. Any product that may be evaluated in this article, or claim that may be made by its manufacturer, is not guaranteed or endorsed by the publisher.
Supplementary material
The Supplementary Material for this article can be found online at: https://www.frontiersin.org/articles/10.3389/fctls.2025.1655324/full#supplementary-material
References
Al-Tohamy, R., Ali, S. S., Li, F., Okasha, K. M., Mahmoud, Y. A. G., Elsamahy, T., et al. (2022). A critical review on the treatment of dye-containing wastewater: ecotoxicological and health concerns of textile dyes and possible remediation approaches for environmental safety. Ecotoxicol. Environ. Saf. 231, 113160. doi:10.1016/j.ecoenv.2021.113160
Araujo, R. N., Nascimento, E. P., Firmino, H. C. T., Macedo, D. A., Neves, G. A., Morales, M. A., et al. (2021). α-Fe2O3 fibers: an efficient photocatalyst for dye degradation under visible light. J. Alloys Compd. 882, 160683. doi:10.1016/j.jallcom.2021.160683
Belkhedkar, M. R., Ubale, A. U., Sakhare, Y. S., Zubair, N., Musaddique, M., and Assoc, J. (2016). Characterization and antibacterial activity of nanocrystalline Mn doped Fe2O3 thin films grown by successive ionic layer adsorption and reaction method. Arab. Univ. Basic Appl. Sci. 21, 38–44. doi:10.1016/j.jaubas.2015.03.001
Bera, R. K., Mandal, S. M., and Raj, C. R. (2014). Antimicrobial activity of fluorescent Ag nanoparticles. Lett. Appl. Microbiol. 58, 520–526. doi:10.1111/lam.12222
Bhowmik, R. N., Mitra, P., Choudhury, R. J., and Reddy, V. R. (2020). Substrate effect on the structural phase formation and magnetic properties of α-Fe2O3 and Ti doped α-Fe2O3 thin films. Appl. Surf. Sci. 501, 144224. doi:10.1016/j.apsusc.2019.144224
Cabiscol, E., Tamarit, J., and Ros, J. (2000). Oxidative stress in bacteria and protein damage by reactive oxygen species. Int. Microbiol. 3, 3–8.
Cabral, J. P. S. (2010). Water microbiology. Bacterial pathogens and water. Int. J. Environ. Res. Public Health 7, 3657–3703. doi:10.3390/ijerph7103657
Dhlamini, M. S., Noto, L. L., Mothudi, B. M., Chithambo, M., and Mathevula, L. E. (2017). Structural and optical properties of sol-gel derived α-Fe2O3 nanoparticles. J. Lumin. 192, 879–887. doi:10.1016/j.jlumin.2017.07.055
Donkadokula, N. Y., Kola, A. K., Naz, I., and Saroj, D. (2020). A review on advanced physico-chemical and biological textile dye wastewater treatment techniques. Rev. Environ. Sci. Biotechnol. 19, 543–560. doi:10.1007/s11157-020-09543-z
Gao, H., Liu, C., Jeong, H. E., and Yang, P. (2012). Plasmon-enhanced photocatalytic activity of iron oxide on gold nanopillars. ACS Nano 6, 234–240. doi:10.1021/nn203457a
Grouli, A., Bachra, Y., Damiri, F., Pandit, V. U., and Berrada, M. (2023). Biointerface Res. Appl. Chem. 13, 438–443.
Hitam, C. N. C., and Jalil, A. A. (2020). A review on exploration of Fe2O3 photocatalyst towards degradation of dyes and organic contaminants. J. Environ. Manage. 258, 110050. doi:10.1016/j.jenvman.2019.110050
Jawale, V., Gugale, G., Chaskar, M., Pandit, S., Pawar, R., Suryawanshi, S., et al. (2021). Two- and three-dimensional zinc oxide nanostructures and its photocatalytic dye degradation performance study. J. Mater. Res. 36, 1573–1583. doi:10.1557/s43578-021-00174-w
Jawale, V., Al-fahdawi, A., Salve, S., Pandit, S., Dawange, G., Gugale, G., et al. (2022). 6, 13-pentacenequinone/zinc oxide nanocomposites for organic dye degradation. Mater. Today Proc. 52, 17–20. doi:10.1016/j.matpr.2021.10.098
Karunakaran, C., Sakthiraadha, S., and Gomathisankar, P. (2013). Photocatalytic and bactericidal activities of hydrothermally and sonochemically prepared Fe2O3–SnO2 nanoparticles. Mater. Sci. Semicond. process. 16, 818–824. doi:10.1016/j.mssp.2012.12.030
Khurana, K., and Jaggi, N. (2021). Localized Surface Plasmonic Properties of Au and Ag Nanoparticles for Sensors: a Review. Plasmonics 16, 981–999. doi:10.1007/s11468-021-01381-1
Konstantinou, I. K., and Albanis, T. A. (2004). TiO2-assisted photocatalytic degradation of azo dyes in aqueous solution: kinetic and mechanistic investigations. Appl. Catal. B Environ. 49, 1–14. doi:10.1016/j.apcatb.2003.11.010
Krejčíková, S., Matějová, L., Kočí, K., Obalová, L., Matěj, Z., Čapek, L., et al. (2012). Appl. Catal. B Environ. 111–112, 119–125.
Kumar Singh, A., Pandit, V. U., and Sonawane, S. L. (2024). Bio-derived carbon nanostructures. Elsevier, 25–63.
Lipp, E. K., Huq, A., and Colwell, R. R. (2002). Effects of global climate on infectious disease: the cholera model. Clin. Microbiol. Rev. 15, 757–770. doi:10.1128/cmr.15.4.757-770.2002
Mehra, S., Singh, M., and Chadha, P. (2021). Adverse impact of textile dyes on the aquatic environment as well as on human beings. Toxicol. Int. 28, 165–176. doi:10.18311/ti/2021/v28i2/26798
Mishra, M., and Chun, D. M. (2015). α-Fe 2 O 3 as a photocatalytic material: a review. Appl. Catal. A Gen. 498, 126–141. doi:10.1016/j.apcata.2015.03.023
Nevase, K. A., Arbuj, S. S., Pandit, V. U., Ambekar, J. D., and Rane, S. B. (2015). Synthesis, characterization and photocatalytic activity of tungsten oxide nanostructures. J. Nanoeng. Nanomanufacturing 5, 221–226. doi:10.1166/jnan.2015.1249
Nikolic, M. V., Sekulic, D. L., Nikolic, N., Slankamenac, M. P., Aleksic, O. S., Danninger, H., et al. (2013). Structural and electrical properties of Ti doped α-Fe2O3. Sci. Sinter. 45, 281–292. doi:10.2298/sos1303281n
Pandit, V. (2022). Synthesis of metal sulfides using Lawesson’s reagent for photocatalytic hydrogen production. Mater. Today Proc. 53, 6–9. doi:10.1016/j.matpr.2021.12.183
Pandit, V. U., Arbuj, S. S., Mulik, U. P., and Kale, B. B. (2014). Novel functionality of organic 6,13-Pentacenequinone as a photocatalyst for hydrogen production under solar light. Environ. Sci. Technol. 48, 4178–4183. doi:10.1021/es405150p
Pandit, V. U., Pandit, S., Dawange, G., Al-Fahdawi, A., and Bakranov, N. (2022a). IntechOpen. doi:10.5772/intechopen.107008
Pandit, V. U., Arbuj, S. S., and Pandit, S. S. (2022b). Photocatalytic hydrogen production reactor system. HK Gaikwad - MRS Commun. 12, 1190–1196. doi:10.1557/s43579-022-00292-4
Park, K., Hong, H. Y., Jung, G. W., Kim, D. H., Hakeem, D. A., and Iqbal, A. (2018). Structural and thermoelectric properties of hydrothermal-processed Ag-doped Fe2O3. Ceram. Int. 44, 15024–15034. doi:10.1016/j.ceramint.2018.05.132
Patra, P., Roy, S., Sarkar, S., Mitra, S., Pradhan, S., Debnath, N., et al. (2015). Appl. Nanosci. 5, 857–866.
Reveendran, R., and Khadar, M. A. (2018). Structural, optical and electrical properties of Cu doped α-Fe2O3 nanoparticles. Mater. Chem. Phys. 219, 142–154. doi:10.1016/j.matchemphys.2018.08.016
Shams, S., Khan, A. U., Yuan, Q., Ahmad, W., Wei, Y., Khan, Z. U. H., et al. (2019). Facile and eco-benign synthesis of Au@Fe2O3 nanocomposite: efficient photocatalytic, antibacterial and antioxidant agent. J. Photochem. Photobiol. B Biol. 199, 111632. doi:10.1016/j.jphotobiol.2019.111632
Sharma, V. K., Yngard, R., and Lin, Y. (2009). Silver nanoparticles: green synthesis and their antimicrobial activities. Adv. Colloid Interface Sci. 145, 83–96. doi:10.1016/j.cis.2008.09.002
Sun, Q., Hou, P., Wu, S., Yu, L., and Dong, L. (2021). Colloids surfaces A physicochem. Eng. Asp. 628, 127304.
Tkaczyk, A., Mitrowska, K., and Posyniak, A. (2020). Synthetic organic dyes as contaminants of the aquatic environment and their implications for ecosystems: a review. Sci. Total Environ. 717, 137222. doi:10.1016/j.scitotenv.2020.137222
Uttam Pandit, V. R., Parshuram Jadhav, G. K., Sakharam Jawale, V. M., Dubepatil, R., Gurao, R., and Late, D. J. (2024). Synthesis and characterization of micro-/nano-α-Fe2O3 for photocatalytic dye degradation. RSC Adv. 14, 29099–29105. doi:10.1039/d4ra04575k
Wang, D., Pillai, S. C., Ho, S. H., Zeng, J., Li, Y., and Dionysiou, D. D. (2018). Plasmonic-based nanomaterials for environmental remediation. Appl. Catal. B Environ. 237, 721–741. doi:10.1016/j.apcatb.2018.05.094
Keywords: silver, photocatalysis, methylene blue, antimicrobial, plasmon, dyes
Citation: AlZubaidi A, Pandit V, Jawale V, Gupta M and Late D (2025) Ag-Fe2O3 nanohybrids for photocatalytic degradation and antibacterial activity. Front. Catal. 5:1655324. doi: 10.3389/fctls.2025.1655324
Received: 27 June 2025; Accepted: 18 August 2025;
Published: 17 September 2025.
Edited by:
Yiteng Zheng, Princeton University, United StatesReviewed by:
Haibin Tang, Chinese Academy of Sciences (CAS), ChinaShuyue He, Croda Inc., United States
Copyright © 2025 AlZubaidi, Pandit, Jawale, Gupta and Late. This is an open-access article distributed under the terms of the Creative Commons Attribution License (CC BY). The use, distribution or reproduction in other forums is permitted, provided the original author(s) and the copyright owner(s) are credited and that the original publication in this journal is cited, in accordance with accepted academic practice. No use, distribution or reproduction is permitted which does not comply with these terms.
*Correspondence: Vikram Pandit, dmlrcmFtdXBhbmRpdEBnbWFpbC5jb20=; Vivekanand Jawale, dml2ZWtqYXdhbGUyNUBnbWFpbC5jb20=; Dattatray Late, ZGF0dGEwOTlAZ21haWwuY29t