 Xiaofan Guo1Zhao Li1Ying Zhou1Shasha Yu1Hongmei Yang1Guozhe Sun1Liqiang Zheng2Byron K. Lee3Mark J. Pletcher4
 Yingxian Sun1*
- 1Department of Cardiology, The First Hospital of China Medical University, Shenyang, China
- 2Department of Clinical Epidemiology, Library, Shengjing Hospital of China Medical University, Shenyang, China
- 3Division of Cardiology, Department of Medicine, University of California, San Francisco, San Francisco, CA, United States
- 4Department of Epidemiology and Biostatistics, University of California, San Francisco, San Francisco, CA, United States
Background: Prolonged heart rate-corrected QT (QTc) interval has been associated with incident cardiovascular diseases (CVD) in general Western populations. However, this association is unclear in Asian population. We aim to estimate the association between QTc interval and incident CVD in a general Chinese population.
Methods: We analyzed 8,867 participants age ≥35 years and free of CVD at baseline in the Northeast China Rural Cardiovascular Health Study. A resting 12-lead electrocardiogram was performed on all participants, and QTc interval computed using the Framingham formula. Cox proportional hazards models were used to calculate hazard ratios (HRs) with 95% confidence intervals (CIs) for associations between QTc interval and incident stroke, coronary heart disease, and combined CVD events.
Results: Over a median follow-up of 4.66 years, a total of 439 CVD events occurred (298 stroke cases and 152 CHD cases). After full adjustment, prolonged QTc defined by a sex-specific cutoff was associated with increased risk of developing stroke (HR: 1.82, 95% CI 1.20–2.75, P = 0.004) and combined CVD (HR: 1.52, 95% CI 1.05–2.19, P = 0.026). Spline analyses demonstrated no clear thresholds; when modeled as a linear relationship, each 10 ms increase of QTc interval was associated with an HR of 1.12 (95% CI 1.06–1.19, P < 0.001) for stroke and an HR of 1.10 (95% CI 1.05–1.15, P < 0.001) for combined CVD. Baseline QTc interval was not associated with incident CHD with either modeling strategy.
Conclusions: Baseline QTc interval is associated with incident stroke and CVD in adults without prior CVD from a general Chinese population.
Introduction
In China, cardiovascular disease (CVD) is still the leading cause of death, although the epidemiological features are changing over time (1). The number of CVD deaths per year increased from 2.51 million in 1990 to 3.97 million in 2016, with coronary heart disease, ischemic stroke, and hemorrhagic stroke the top three causes (2). It is estimated that ~290 million patients presently suffer from CVD in China, most prominently in rural areas where CVD mortality has exceeded the rate in urban centers (3). Given the continuously rising health burden, CVD remains the most crucial public health issue in China.
Several studies have associated heart rate-corrected QT (QTc) interval with stroke (4, 5), with coronary heart disease (6), and with CVD on a general population level (7–10), suggesting the prognostic value of QTc interval for primary prevention of CVD. However, the evidence is inconsistent and largely from Western populations (4, 6, 9, 10). It has been suggested that there are race-specific differences in QTc interval and its association with CVD risk (6, 11, 12), but evidence from Asian populations is scarce.
The Northeast China Rural Cardiovascular Health Study (NCRCHS) provides a unique opportunity to address this knowledge gap. NCRCHS collected baseline risk CVD risk factors, electrocardiograms, and CVD events over time in a large general Chinese population. It is comparable to recent large cohorts conducted in Western populations in study design, sample size, method used for QTc interval calculation and the variables adjusted. We thus used NCRCHS to estimate the association between QTc interval and incident CVD.
Methods
Study Population
NCRCHS is a community-based prospective cohort study carried out in rural areas of Northeast China. The design and inclusion criteria of the study have been described previously (13, 14). In brief, a total of 11,956 participants aged ≥35 years were recruited from Dawa, Zhangwu, and Liaoyang counties in Liaoning province between 2012 and 2013, using a multi-stage, randomly stratified cluster-sampling scheme. Detailed information was collected at baseline for each participant. In 2015 and 2017, participants were invited to attend a follow-up study. Of the 11,956 subjects, 10,700 participants consented and were qualified for our follow-up study. A total of 10,349 participants completed at least one follow-up visit. The study was approved by the Ethics Committee of China Medical University (Shenyang, China), and written informed consent was obtained from all participants.
In the current analyses, we excluded participants with CVD at baseline (n = 821), participants with an electrocardiogram (ECG) unsuitable for QT interval measurement (n = 292), including QRS duration ≥120 ms, bundle branch blocks, second and third degree AV-blocks, pacemaker or implantable cardioverter-defibrillator implantation, multiple premature ventricular complexes, multiple premature atrial complexes, WPW syndrome and poor quality ECG data, and participants with missing or abnormal data (n = 369). Data were therefore available for 8,867 qualifying participants.
Study Variables
At baseline, detailed information on demographic characteristics, dietary and lifestyle factors, and medical history were obtained by interview with a standardized questionnaire. Smoking status was defined as current use. History of stroke and coronary heart disease (CHD) at baseline was defined as self-reported and confirmed by medical records. Current use of aspirin, antihypertensive medications, statins, warfarin, and QT-prolonging medications was self-reported. We defined QT-prolonging medications according to previous literature (9, 15). Weight and height were measured with participants in lightweight clothing and without shoes. Waist circumference (WC) was measured at the umbilicus using a non-elastic tape. Body mass index (BMI) was computed as weight in kilograms divided by the square of height in meters. Obesity was defined as BMI ≥ 28 kg/m2 (16). Blood pressure was assessed three times with participants seated after at least 5 min of rest using a standardized automatic electronic sphygmomanometer (HEM-907; Omron, Tokyo, Japan). Hypertension was defined as systolic blood pressure (SBP) ≥ 140 mm Hg and/or diastolic blood pressure (DBP) ≥ 90 mm Hg, and/or use of antihypertensive medications (17). Fasting blood samples were collected in the morning from participants who had fasted at least 12 h. Fasting plasma glucose (FPG), total cholesterol (TC), low-density lipoprotein cholesterol (LDL-C), high-density lipoprotein cholesterol (HDL-C), triglyceride (TG), serum creatinine, and other routine blood biochemical indexes were analyzed enzymatically. Diabetes mellitus was defined as FPG ≥ 7 mmol/L (126 mg/dl) and/or being on medication for diabetes (18). Metabolic syndrome (MS) was defined by meeting three or more of the following component risk factors: (1) WC ≥ 90 cm for males and ≥80 cm for females, (2) BP ≥ 130/85 mm Hg or current use of antihypertensive drugs, (3) serum glucose level ≥ 5.6 mmol/L or current use of antihyperglycemic agents, (4) serum TGs ≥ 1.7 mmol/L, and (5) HDL-C <1.0 mmol/L for males and <1.3 mmol/L for females, according to the Adult Treatment Panel-III (ATP-III) modified criteria (19). Estimated glomerular filtration rate (eGFR) was calculated using the Chronic Kidney Disease Epidemiology Collaboration (CKD-EPI) formula (20).
Electrocardiography
Twelve-lead ECGs (resting, 10 s) were performed on all participants by well-trained cardiologists at baseline using a MAC 5500 (GE Healthcare; Little Chalfont, Buckinghamshire, UK) at 10 mm/mV calibration and speed of 25 mm/s, and analyzed automatically by the MUSE Cardiology Information System, version 7.0.0 (GE Healthcare). ECG parameters including QT interval were measured automatically with QT interval corrected for heart rate using the Framingham formula (21), a linear-scaled correction formula. Prolonged QTc was defined as QTc ≥ 460 ms for females and ≥450 ms for males (22). Atrial fibrillation (AF) was diagnosed based on previous history diagnosed by a physician or ECG findings. Electrocardiographic left ventricular hypertrophy (LVH) was defined per Sokolow–Lyon criteria (23).
Adjudication of Endpoints
Median follow-up was 4.66 years. In the present study, an incident CVD event was defined as a composite of new onset Stroke or CHD during the follow-up period. The specific incidences of stroke and CHD were also determined. For all participants reporting possible diagnoses or death, all available clinical information was collected including medical records and death certificates. All materials were independently reviewed and adjudicated by the end-point assessment committee. Stroke was defined per WHO Multinational Monitoring of Trends and Determinants in Cardiovascular Disease (MONICA) criteria (24, 25) as rapidly developing signs of focal or global disturbance of cerebral function, lasting more than 24 h (unless interrupted by surgery or death), with no apparent non-vascular cause. Transient ischemic attack and chronic cerebral vascular disease were excluded. CHD was defined as a diagnosis of hospitalized angina, hospitalized myocardial infarction, CHD death, or any revascularization procedure (26).
Statistical Analysis
Descriptive statistics were calculated for all variables, including continuous variables (reported as mean values and standard deviations) and categorical variables (reported as numbers and percentages). Differences among categories were evaluated using t-test, non-parameter test, or χ2-test as appropriate. Kaplan-Meier methods were used to estimate the cumulative incidence of stroke, CHD, and combined CVD in participants with and without prolonged QTc interval, and log-rank testing used to compare differences in estimates. Cox proportional hazards models were used to estimate adjusted associations between QTc interval and the risk of CHD, stroke, and combined CVD incidence with hazard ratios (HRs) and 95% confidence intervals (CIs) calculated. We constructed four models with sequential adjustment. Model 1 is adjusted for age, sex and ethnicity. Model 2 is further adjusted for current smoking, family history of coronary heart disease, BMI, SBP, antihypertensive medications, FPG, LDL-C, TG, HDL-C, TC, and eGFR. Model 3 is adjusted for the previous factors as well as QT-prolonging medications, statin use, warfarin use, and aspirin use. And Model 4 is adjusted for the full range of Model 3 covariates plus AF and ECG-LVH. We also modeled QTc with restricted cubic splines to illustrate the linearity of the dose-response relationship between QTc interval and each endpoint. In spline analyses, we used the 50th percentile of the QTc distribution as the reference value. In addition, we evaluated the association between QTc interval and cardiovascular events stratified by age, sex, smoking status, hypertension, obesity, diabetes, and MS, and calculated nominal interaction p-values with and without adjustment for multiple comparisons via Bonferroni correction. All statistical analyses were performed using Stata version 14.0 and SPSS version 17.0 software, and P < 0.05 were considered statistically significant.
Results
The characteristics of the study participants stratified by prolonged QTc interval are shown in Table 1. The average QTc duration was 417.9 ± 19.9 ms. A total of 284 (3.2%) participants exhibited a prolonged QTc interval, and these participants were more likely to be of older age and have higher proportions of hypertension, diabetes and LVH.
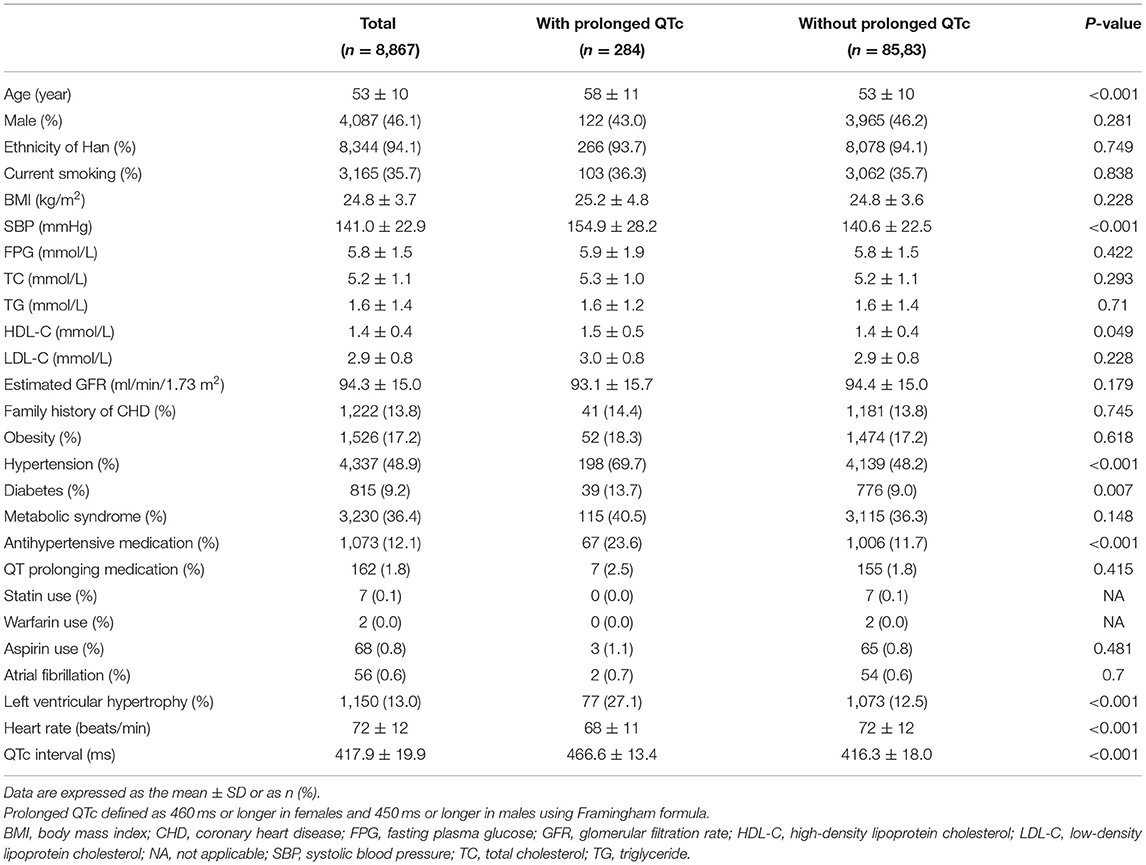
Table 1. Baseline characteristics of the included participants by prolonged QTc interval.
During follow-up, a total of 439 CVD events were documented (298 stroke cases and 152 CHD cases). The Kaplan-Meier curves for each endpoint in participants with and without prolonged QTc interval are shown in Figure 1. Higher cumulative incidences of stroke and total CVD events (but only insignificantly higher incidence of CHD) were observed among all participants with prolonged QTc interval.
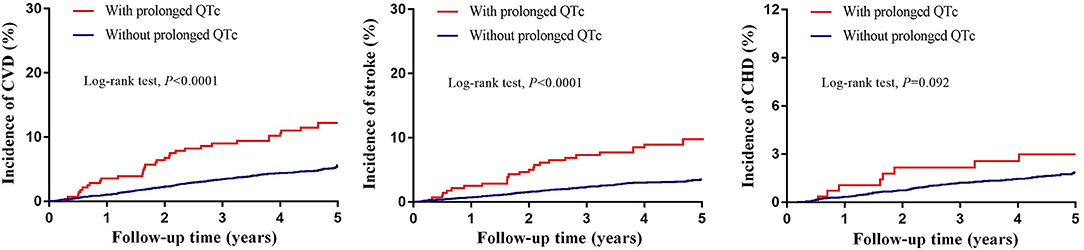
Figure 1. Unadjusted Kaplan–Meier curves for incident cardiovascular events stratified by prolonged QTc interval. CHD, coronary heart disease; CVD, cardiovascular disease. Prolonged QTc interval defined as 460 ms or longer in females and 450 ms or longer in males using Framingham formula.
Table 2 presents the adjusted associations of baseline QTc interval with incident CVD events over the follow-up period. Prolonged QTc was associated with increased risk of developing stroke (HR: 1.82, 95% CI 1.20–2.75, P = 0.004) and combined CVD (HR: 1.52, 95% CI 1.05–2.19, P = 0.026) even after full adjustment for all covariates including AF and ECG-LVH (Models 1–4). Each 10 ms increase of QTc interval was associated with an HR of 1.12 (95% CI 1.06–1.19, P < 0.001) for stroke and an HR of 1.10 (95% CI 1.05–1.15, P < 0.001) for combined CVD after full adjustment. Baseline QTc interval was not associated with incident CHD either in dichotomous or continuous models.
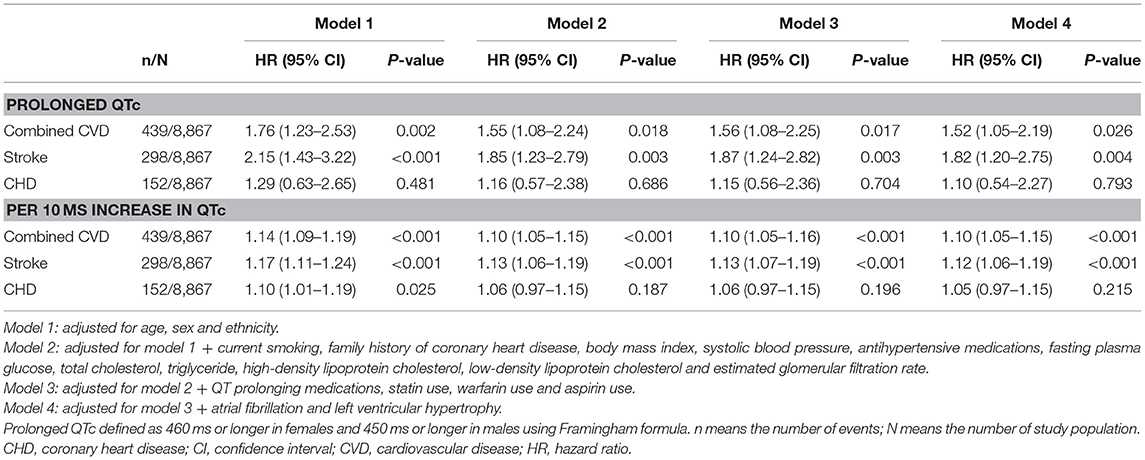
Table 2. Multivariate-adjusted hazard ratios for combined cardiovascular disease, stroke, and coronary heart disease associated with QTc interval.
We then used restricted cubic splines to provide a detailed analysis of the dose-response relationship of the QTc with incident CVDs. We found no clear evidence of a threshold effect in adjusted associations modeled via restricted cubic splines. The risk of stroke and combined CVD progressively increased with increasing QTc intervals (Figure 2).
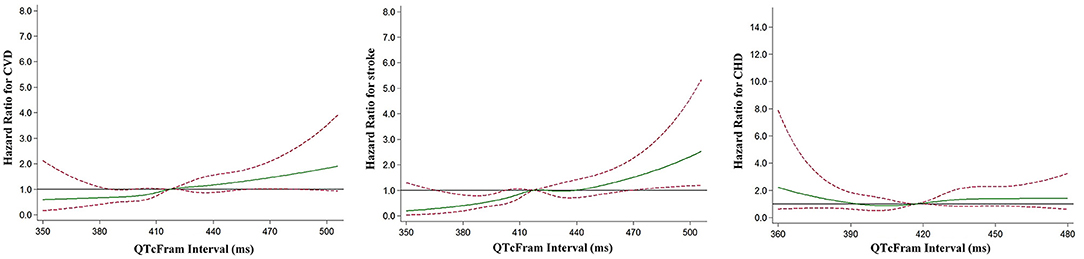
Figure 2. Multivariable-adjusted restricted cubic spline analysis for the hazard ratio of cardiovascular events as a function of the QTc interval. The green solid line indicates multivariable-adjusted hazard ratios for cardiovascular events, and the red dashed lines indicate the upper and lower 95% confidence intervals. The horizontal black line indicates a hazard ratio of 1. Adjustment factors are as Model 4 in Table 2. CHD, coronary heart disease; CVD, cardiovascular disease.
Figure 3 shows the multivariable-adjusted HRs, per 10 ms increase of QTc interval, across subgroups. We found borderline nominal interactions with stronger associations for stroke in older persons (>65 years, interaction P = 0.011) and non-smokers (P = 0.02), and for CHD in males (P = 0.046). These interactions were not significant with adjustment for multiple comparisons.
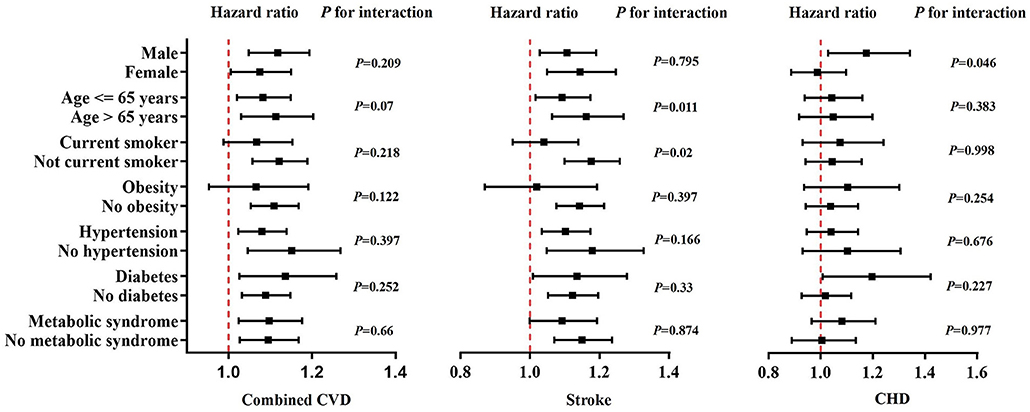
Figure 3. Multivariate-adjusted hazard ratios for cardiovascular events associated with each 10 ms increase of QTc interval within subgroups of the study participants. Black squares in the graph represent the hazard ratio and lines represent the 95% confidence interval. The vertical red line indicates a hazard ratio of 1. Adjustment factors are as Model 4 in Table 2. CHD, coronary heart disease; CVD, cardiovascular disease.
Discussion
In this large general Chinese population, we found that baseline QTc interval was significantly associated with a higher risk of incident stroke and CVD. This association was independent of established CVD risk factors, atrial fibrillation, left ventricular hypertrophy, and estimated glomerular filtration rate (Figure 4). These findings add further evidence regarding the significance of QTc interval prolongation in a specific population (China) with a distinct pattern of CVD.
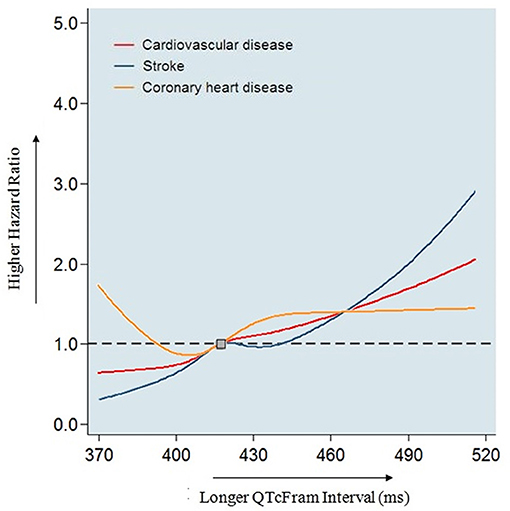
Figure 4. Association of baseline QTc interval with coronary heart disease, stroke, and combined cardiovascular disease in 8,867 Chinese participants. Models adjusted for age, sex, ethnicity, current smoking, family history of coronary heart disease, body mass index, systolic blood pressure, antihypertensive medications, fasting plasma glucose, total cholesterol, triglyceride, high-density lipoprotein cholesterol, low-density lipoprotein cholesterol and estimated glomerular filtration rate, QT prolonging medications, statin use, warfarin use and aspirin use, atrial fibrillation and left ventricular hypertrophy. In this study, we found prolonged QTc interval was associated with incident stroke and combined cardiovascular disease, but not coronary heart disease in adults without prior cardiovascular disease in a general Chinese population.
Prolonged QTc interval reflects prolonged ventricular repolarization, which can lead to ventricular fibrillation and sudden death. Very recently, QTc interval has been proposed as an emerging vital sign (27), but its predictive value in the general Chinese population remains unknown. Although there is considerable evidence for the link between QTc interval and CVD events in the literature, the results are inconsistent. For example, a review of seven prospective cohort studies found that prolonged QTc interval was not associated with increased risks of total or CVD mortality and sudden death in patients without established CVD (8). However, a meta-analysis found consistent associations between prolonged QT interval and increased risk of these outcomes, although retrospective and nested-case cohort studies were included (28). Two studies conducted in the general Japanese population found positive links between QTc interval and CVD risk, but both adopted Bazett's formula (29, 30) and this method is known to potentially overestimate the number of patients with prolonged QTc interval and its association with outcomes (31, 32). Therefore, in the present study we used the Framingham formula, a linear regression method, to adjust the QT interval for heart rate, which has been recommended in recent guidelines (22).
Studies on the relationship between QTc interval and CVD risk have continued to emerge in recent years, and the dust has not yet settled. A MESA study found that QTc interval was associated with incident cardiovascular events in adults age 45 or older who were free of CVD at baseline (10). Nielsen et al. observed pronounced associations between QTc interval and risk of CVD in the elderly and in those with prior CVD from a large primary care population (9). In the REGARDS study, Soliman et al. reported a strong association between QTc interval and incident stroke after adjustment for traditional stroke risk factors among 27,411 participants (4). Comparable to these studies conducted in Western populations, our study confirmed the impact of prolonged QTc interval on CVD outcomes in an Asian population. Most recently, it was found that ECG-LVH and prolonged QTc interval were both independent markers of poor prognosis, and the combination was associated with higher risk (5, 33, 34). We therefore additionally adjusted for ECG-LVH in the present study, which is different from most earlier studies of the QTc interval. Studies demonstrated that QTc interval was associated with intima-media thickness of carotid artery (35, 36), which was an established marker for subclinical atherosclerosis. This may in part explain the higher CVD risk associated with prolonged QTc interval. Studies aimed to further clarify the underling mechanisms are needed.
Previous studies showed race-specific differences in the QT interval and its association with CVD outcomes (6, 11), including prominent race differences in QTc intervals between Whites and Asians (12). Seyerle et al. found the presence of considerable heterogeneity in multiple genetic loci that influence QT interval among racial or ethnic groups, which potentially contributes to these race-specific differences (37). Up to now, the predictive value of QTc interval for future CVD events in Asians has been unclear, highlighting the necessity of our present study conducted in a large general Chinese population.
We and other colleagues previously found that chronic kidney disease was associated with prolonged QTc interval (38–40). Similar with ECG-LVH, the combination of chronic kidney disease and QTc prolongation resulted in a higher risk of mortality compared with either condition alone (39). As such, we also adjusted for eGFR in the regression model of the present study, and still found a positive relationship between QTc interval and CVD outcomes.
Our study has several limitations. First, we evaluated the association of only a single automated measurement of QTc interval at baseline with incident CVD events. However, previous studies used the same measurement and found it feasible. Second, data on use of QT-prolonging and other medications were self-reported. In the studied rural population, the use of these specific medications is extremely low due to lack of health consciousness and poor economic conditions, and these medications are rare enough that they would likely be remembered accurately, which should minimize the effects on results. Finally, we focus on a Chinese population, and thus our result may not be generalizable to all Asians.
In conclusion, we observed an increased risk of incident stroke and CVD with QTc interval at baseline, providing evidence from a large general Chinese population for the first time. The effect of QTc prolongation on CVD events differed across subgroups. Our study suggests that QTc measurement has important predictive value and could potentially serve as a vital sign in Chinese adults.
Data Availability Statement
The raw data supporting the conclusions of this article is currently not available. Please direct any queries to Xiaofan Guo, Z3VveGlhb2ZhbjE5ODZAaG90bWFpbC5jb20=.
Ethics Statement
The studies involving human participants were reviewed and approved by the Ethics Committee of China Medical University (Shenyang, China). The patients/participants provided their written informed consent to participate in this study.
Author Contributions
ZL and YS contributed to the conception or design of the work. XG, YZ, SY, HY, GS, and LZ contributed to the acquisition, analysis, or interpretation of data for the work. XG drafted the manuscript. BL and MP critically revised the manuscript. All gave final approval to the manuscript.
Funding
This work was supported by the National Natural Science Foundation of China (Grant Number 81800361) and National Key Research and Development Program from the Ministry of Science and Technology of China (Grant Number 2017YFC1307600 and Grant Number 2018YFC1312400).
Conflict of Interest
The authors declare that the research was conducted in the absence of any commercial or financial relationships that could be construed as a potential conflict of interest.
References
1. Zhao D, Liu J, Wang M, Zhang X, Zhou M. Epidemiology of cardiovascular disease in China: current features and implications. Nat Rev Cardiol. (2019) 16:203–12. doi: 10.1038/s41569-018-0119-4
2. Liu S, Li Y, Zeng X, Wang H, Yin P, Wang L, et al. Burden of cardiovascular diseases in china, 1990-2016: findings from the 2016. Global burden of disease study. JAMA Cardiol. (2019) 4:342–52. doi: 10.1001/jamacardio.2019.0295
3. Ma LY, Chen WW, Gao RL, Liu LS, Zhu ML, Wang YJ, et al. China cardiovascular diseases report 2018: an updated summary. J Geriatr Cardiol. (2020) 17:1−8. doi: 10.11909/j.issn.1671-5411.2020.01.001
4. Soliman EZ, Howard G, Cushman M, Kissela B, Kleindorfer D, Le A, et al. Prolongation of qTc and risk of stroke: the REGARDS (REasons for geographic and racial differences in stroke) study. J Am Coll Cardiol. (2012) 59:1460–7. doi: 10.1016/j.jacc.2012.01.025
5. Ishikawa J, Ishikawa S, Kario K. Prolonged corrected QT interval is predictive of future stroke events even in subjects without ECG-diagnosed left ventricular hypertrophy. Hypertension. (2015) 65:554–60. doi: 10.1161/HYPERTENSIONAHA.114.04722
6. Dekker JM, Crow RS, Hannan PJ, Schouten EG, Folsom AR, ARIC Study. Heart rate-corrected QT interval prolongation predicts risk of coronary heart disease in black and white middle-aged men and women: the ARIC study. J Am Coll Cardiol. (2004) 43:565–71. doi: 10.1016/j.jacc.2003.09.040
7. Elming H, Holm E, Jun L, Torp-Pedersen C, Køber L, Kircshoff M, et al. The prognostic value of the QT interval and QT interval dispersion in all-cause and cardiac mortality and morbidity in a population of Danish citizens. Eur Heart J. (1998) 19:1391–400. doi: 10.1053/euhj.1998.1094
8. Montanez A, Ruskin JN, Hebert PR, Lamas GA, Hennekens CH. Prolonged QTc interval and risks of total and cardiovascular mortality and sudden death in the general population: a review and qualitative overview of the prospective cohort studies. Arch Intern Med. (2004) 164:943–8. doi: 10.1001/archinte.164.9.943
9. Nielsen JB, Graff C, Rasmussen PV, Pietersen A, Lind B, Olesen MS, et al. Risk prediction of cardiovascular death based on the QTc interval: evaluating age and gender differences in a large primary care population. Eur Heart J. (2014) 35:1335–44. doi: 10.1093/eurheartj/ehu081
10. Beinart R, Zhang Y, Lima JA, Bluemke DA, Soliman EZ, Heckbert SR, et al. The QT interval is associated with incident cardiovascular events: the MESA study. J Am Coll Cardiol. (2014) 64:2111–9. doi: 10.1016/j.jacc.2014.08.039
11. Williams ES, Thomas KL, Broderick S, Shaw LK, Velazquez EJ, Al-Khatib SM, et al. Race and gender variation in the QT interval and its association with mortality in patients with coronary artery disease: results from the duke databank for cardiovascular disease (DDCD). Am Heart J. (2012) 164:434–41. doi: 10.1016/j.ahj.2012.05.024
12. Santhanakrishnan R, Wang N, Larson MG, Magnani JW, Vasan RS, Wang TJ, et al. Racial differences in electrocardiographic characteristics and prognostic significance in whites versus asians. J Am Heart Assoc. (2016) 5:e002956. doi: 10.1161/JAHA.116.002058
13. Li Z, Guo X, Zheng L, Sun Z, Yang H, Sun G, et al. Prehypertension in rural northeastern china: results from the northeast China rural cardiovascular health study. J Clin Hypertens (Greenwich). (2014) 16:664–670. doi: 10.1111/jch.12378
14. Li Z, Guo X, Zheng L, Yang H, Sun Y. Grim status of hypertension in rural China: results from northeast china rural cardiovascular health study (2013). J Am Soc Hypertens. (2015) 9:358–64. doi: 10.1016/j.jash.2015.02.014
15. Woosley RL, Heise CW, Gallo T, Tate J, Woosley D, Romero KA. QTdrugs List. Available online at: https://crediblemeds.org/ (accessed March 24, 2020).
16. World Health Organization, International Association for the study of Obesity, International Obesity TaskForce. The Asia-Pacific Perspective: Redefining Obesity and Its Treatment. Available online at: https://apps.who.int/iris/bitstream/handle/10665/206936/0957708211_eng.pdf (accessed March 22, 2020).
17. Chobanian AV, Bakris GL, Black HR, Cushman WC, Green LA, Izzo JL Jr, et al. National heart, lung, and blood institute joint national committee on prevention, detection, evaluation, and treatment of high blood pressure; national high blood pressure education program coordinating committee. the seventh report of the joint national committee on prevention, detection, evaluation, and treatment of high blood pressure: the JNC 7 report. JAMA. (2003) 289:2560–72. doi: 10.1161/01.HYP.0000107251.49515.c2
18. World Health Organization and International Diabetes Fedaration. Definition and Diagnosis of Diabetes Mellitus and Intermediate Hyperglycemia: Report of a WHO/IDF Consultation. Available online at: https://www.who.int/diabetes/publications/Definition%20and%20diagnosis%20of%20diabetes_new.pdf (accessed March 24, 2020).
19. Grundy SM, Cleeman JI, Daniels SR, Donato KA, Eckel RH, Franklin BA, et al. Diagnosis and management of the metabolic syndrome: an american heart association/national heart, lung, and blood institute scientific statement. Circulation. (2005) 112:2735–52. doi: 10.1161/CIRCULATIONAHA.105.169404
20. Levey AS, Stevens LA, Schmid CH, Zhang YL, Castro AF III, Feldman HI, et al. A new equation to estimate glomerular filtration rate. Ann Intern Med. (2009) 150:604–12. doi: 10.7326/0003-4819-150-9-200905050-00006
21. Sagie A, Larson MG, Goldberg RJ, Bengtson JR, Levy D. An improved method for adjusting the QT interval for heart rate (the framingham heart study). Am J Cardiol. (1992) 70:797–801. doi: 10.1016/0002-9149(92)90562-D
22. Rautaharju PM, Surawicz B, Gettes LS, Bailey JJ, Childers R, Deal BJ, et al. AHA/ACCF/HRS recommendations for the standardization and interpretation of the electrocardiogram: part IV: the ST segment, T and U waves, and the QT interval: a scientific statement from the American Heart Association Electrocardiography and Arrhythmias Committee, Council on Clinical Cardiology; the American College of Cardiology Foundation; and the Heart Rhythm Society. Endorsed by the International Society for Computerized Electrocardiology. J Am Coll Cardiol. (2009) 53:982–91. doi: 10.1161/CIRCULATIONAHA.108.191096
23. Sokolow M, Lyon TP. The ventricular complex in left ventricular hypertrophy as obtained by unipolar precordial and limb leads. Am Heart J. (1949) 37:161–86. doi: 10.1016/0002-8703(49)90562-1
24. World Health Organization. WHO MONICA project MONICA Manual. Available online at: https://www.thl.fi/publications/monica/manual/index.htm (accessed March 24, 2020).
25. Zhao D, Liu J, Wang W, Zeng Z, Cheng J, Liu J, et al. Epidemiological transition of stroke in china: twenty-one-year observational study from the sino-MONICA-Beijing project. Stroke. (2008) 39:1668–74. doi: 10.1161/STROKEAHA.107.502807
26. Gaye B, Canonico M, Perier MC, Samieri C, Berr C, Dartigues JF, et al. Ideal cardiovascular health, mortality, and vascular events in elderly subjects: the three-City study. J Am Coll Cardiol. (2017) 69:3015–26. doi: 10.1016/j.jacc.2017.05.011
27. Giudicessi JR, Noseworthy PA, Ackerman MJ. The qT interval. Circulation. (2019) 139:2711–3. doi: 10.1161/CIRCULATIONAHA.119.039598
28. Zhang Y, Post WS, Blasco-Colmenares E, Dalal D, Tomaselli GF, Guallar E. Electrocardiographic QT interval and mortality: a meta-analysis. Epidemiology. (2011) 22:660–70. doi: 10.1097/EDE.0b013e318225768b
29. Maebuchi D, Arima H, Doi Y, Ninomiya T, Yonemoto K, Tanizaki Y, et al. QT interval prolongation and the risks of stroke and coronary heart disease in a general Japanese population: the Hisayama study. Hypertens Res. (2010) 33:916–21. doi: 10.1038/hr.2010.88
30. Ishikawa J, Ishikawa S, Kario K, JMS Cohort Study Investigator Group. Relationships between the QTc interval and cardiovascular, stroke, or sudden cardiac mortality in the general Japanese population. J Cardiol. (2015) 65:237–42. doi: 10.1016/j.jjcc.2014.05.008
31. Vandenberk B, Vandael E, Robyns T, Vandenberghe J, Garweg C, Foulon V, et al. Which QT correction formulae to use for QT monitoring? J Am Heart Assoc. (2016) 5:e003264. doi: 10.1161/JAHA.116.003264
32. Noseworthy PA, Peloso GM, Hwang SJ, Larson MG, Levy D, O'Donnell CJ, et al. QT interval and long-term mortality risk in the framingham heart study. Ann Noninvasive Electrocardiol. (2012) 17:340–348. doi: 10.1111/j.1542-474X.2012.00535.x
33. Soliman EZ, Shah AJ, Boerkircher A, Li Y, Rautaharju PM. Inter-relationship between electrocardiographic left ventricular hypertrophy and QT prolongation as predictors of increased risk of mortality in the general population. Circ Arrhythm Electrophysiol. (2014) 7:400–6. doi: 10.1161/CIRCEP.113.001396
34. O'Neal WT, Howard VJ, Kleindorfer D, Kissela B, Judd SE, McClure LA, et al. Interrelationship between electrocardiographic left ventricular hypertrophy, qT prolongation, and ischaemic stroke: the reasons for geographic and racial differences in stroke study. Europace. (2016) 18:767–72. doi: 10.1093/europace/euv232
35. Strohmer B, Pichler M, Iglseder B, Paulweber B. Relationship of QT interval duration with carotid intima media thickness in a clinically healthy population undergoing cardiovascular risk screening. J Intern Med. (2005) 257:238–46. doi: 10.1111/j.1365-2796.2004.01436.x
36. Festa A, D'Agostino R Jr, Rautaharju P, O'Leary DH, Rewers M, Mykkänen L, et al. Is QT interval a marker of subclinical atherosclerosis in nondiabetic subjects? The Insulin Resistance Atherosclerosis Study (IRAS). Stroke. (1999) 30:1566–71. doi: 10.1161/01.STR.30.8.1566
37. Seyerle AA, Young AM, Jeff JM, Melton PE, Jorgensen NW, Lin Y, et al. Evidence of heterogeneity by race/ethnicity in genetic determinants of QT interval. Epidemiology. (2014) 25:790–8. doi: 10.1097/EDE.0000000000000168
38. Li Z, Guo X, Guo L, Zheng L, Yu S, Yang H, et al. Sex differences in association between decreased glomerular filtration rate and prolongation of corrected QT interval in general Chinese population. Eur J Intern Med. (2017) 43:e33–5. doi: 10.1016/j.ejim.2017.05.011
39. Malik R, Waheed S, Parashara D, Perez J, Waheed S. Association of QT interval with mortality by kidney function: results from the national health and nutrition examination survey (NHANES). Open Heart. (2017) 4:e000683. doi: 10.1136/openhrt-2017-000683
Keywords: QTc interval, electrocardiogram, cardiovascular disease, stroke, coronary heart disease
Citation: Guo X, Li Z, Zhou Y, Yu S, Yang H, Sun G, Zheng L, Lee BK, Pletcher MJ and Sun Y (2021) Corrected QT Interval Is Associated With Stroke but Not Coronary Heart Disease: Insights From a General Chinese Population. Front. Cardiovasc. Med. 8:605774. doi: 10.3389/fcvm.2021.605774
Received: 22 March 2021; Accepted: 18 June 2021;
Published: 21 July 2021.
Edited by:
Marcel van der Heyden, University Medical Center Utrecht, NetherlandsReviewed by:
Tobias Opthof, Academic Medical Center, NetherlandsRobert Kass, Columbia University, United States
Copyright © 2021 Guo, Li, Zhou, Yu, Yang, Sun, Zheng, Lee, Pletcher and Sun. This is an open-access article distributed under the terms of the Creative Commons Attribution License (CC BY). The use, distribution or reproduction in other forums is permitted, provided the original author(s) and the copyright owner(s) are credited and that the original publication in this journal is cited, in accordance with accepted academic practice. No use, distribution or reproduction is permitted which does not comply with these terms.
*Correspondence: Yingxian Sun, eXhzdW5AY211LmVkdS5jbg==