 Man-Kit Lei
 Steven R. H. Beach
 Ronald L. Simons3
 Kaixiong Ye
- 1Department of Sociology, University of Georgia, Athens, GA, United States
- 2Department of Psychology, Center for Family Research, University of Georgia, Athens, GA, United States
- 3Department of Sociology, University of Georgia, Athens, GA, United States
- 4Department of Genetics, University of Georgia, Athens, GA, United States
Objective: We examined the association of prospectively assessed harsh parenting during adolescence with body mass index (BMI) in young adulthood among African American youth. We also assessed the role of methylation of obesity-related genes and gene expression markers of obesity as mediators of this association, providing a pathway for the biological embedding of early harsh parenting and its long-term impact on young adult health.
Methods: Hypotheses were tested with a sample of 362 African American youth for whom harsh parenting was assessed at ages 10–15, BMI was assessed at age 10 and 29, and both DNA methylation (DNAm) and gene expression of obesity genes were assessed at age 29. Mediational analyses were conducted using bootstrap methods to generate confidence intervals.
Results: Controlling for genetic risk for obesity and health-related covariates, harsh parenting across childhood and adolescence was associated with change in BMI (Δ BMI) from ages 10–29. In addition, we found that the indirect effect of harsh parenting on Δ BMI was mediated through obesity-related DNAm and accounted for 45.3% of the total effect. Further, obesity-related DNAm mediated the effect of harsh parenting on gene expression of obesity-related genes (GEOG), and GEOG, in turn, mediated the impact of obesity-related DNAm on ΔBMI. This pathway accounted for 3.4% of the total effect. There were no gender differences in the magnitude of this indirect effect.
Conclusions: The results suggest that alterations in methylation and gene expression mediate the impact of harsh parenting on change in obesity from childhood to young adulthood, illustrating plausible biological pathways from harsh parenting to obesity and bolstering the hypothesis that harsh parenting in childhood and adolescence can become biologically embedded and contribute to obesity.
Introduction
The prevalence of obesity has increased dramatically during several decades in the United States and other developed countries (1). This concerning development has particular relevance for the health of Black Americans, who experience a greater prevalence of obesity relative to non-Hispanic Whites at every age (2). Given that obesity confers increased health risks across many chronic diseases of aging (3–5), especially cardiovascular diseases (CVD) (6–8), body mass index (BMI), a widely used indicator of obesity, is a key outcome. BMI is a predictor of cardiometabolic risk and has strong associations with both morbidity and mortality (9). Prospective studies suggest that every 5 kg/m2 increase in BMI is associated with a 30% increase in the risk of all-cause mortality (10). Obesity is, therefore, a major public health threat and a contributor to health disparities.
Recent studies suggest that early family environments, especially those that are stressful for youth, may play a significant role in the development of obesity in adulthood (6, 11–13). The risky family model provides a theoretical account of the way that early family stress carries forward over the life course to have an impact on health (14). This model assumes that some family environments put youth at risk for later health problems by creating emotionally unsupportive rearing climates, this is thought to result from harsh parenting practices (15). Such harsh family environments are hypothesized to trigger the development of the physiological stress response systems, calibrating how individuals respond to threats throughout the life span (16). When these stresses evoke perceptions of threat, they have the potential to activate the hypothalamic-pituitary-adrenal (HPA) axis, causing alterations in a range of tissues. Chronic and recurrent activation of these changes can have long-term consequences for adult health outcomes (11) via multiple mechanisms, including alterations in fat deposition contributing to increased weight gain. Currently unknown is the extent to which sources of family stress may exert their effect by influencing methylation and gene expression mechanisms. If so, identifying mediators of the impact of harsh parenting during adolescence on adult BMI has the potential to strengthen and expand current models of social adversity on obesity, and identify new points of intervention.
Deoxyribonucleic acid methylation (DNAm), one of the major epigenetic mechanisms, may provide a biological pathway connecting parenting practices with obesity and well-being, and potentially account for long-lasting effects. DNAm occurs when “a methyl group attaches to a segment of DNA at a CpG site (i.e., a DNA region where a cytosine nucleotide is positioned next to a guanine nucleotide separated by one phosphate)” (17, 18). In recent years there has been significant progress in the use of DNAm to identify markers of health and aging (19). Yet, only recently have researchers have identified obesity-related methylation changes among African Americans. Wang et al. (20) identified five CpG sites (cg18181703, cg09349128, cg06178669, cg21585138, and cg03257930) associated with obesity among African Americans that survived extensive controls and were also associated with gene expression. These five CpG sites can be used to create a DNAm index of obesity that should also predict gene expression associated with obesity.
Although broad patterns of DNAm are established during early embryonic and fetal life, several lines of research demonstrate that methylation also can be influenced by environmental factors throughout the life span (21), perhaps especially during some periods of rapid developmental change, such as adolescence. Thus, it is possible for adverse experiences in adolescence to influence methylation of obesity-related genes (turned them on via hypomethylation or off via hypermethylation). Building upon research showing that harsh parenting can impact epigenetic effects (22), we hypothesized that exposure to harsh parenting in adolescence would foster obesity-related DNAm. This change in methylation, in turn, was expected to be related to obesity in adulthood.
Further, based on the prior findings of Wang et al. (20), individual differences in obesity-related DNAm were expected to predict individual differences in gene expression (23) for the five genes represented on the index. Given that DNAm can be influenced by social environments and influence “the genome to express (either up-regulate or down-regulate) particular genes” (21, 24), several lines of research converge to support the hypothesis that changes in gene expression related to changes in DNAm may be influenced by family environment (20, 25–27). However, we are aware of only one study that has investigated the association between DNA methylation, gene expression, and obesity. Using an African American sample, Wang et al. (20) provided evidence that the gene expression levels of five genes (SOCS3, CISH, PIM3, KLF4, and HRASLS2) were significantly associated with BMI and obesity-related DNAm. Accordingly, one way in which harsh parenting may influence obesity in adulthood is by acting on gene expression via DNA methylation change.
Using a multiple wave prospective research design that spanned 20 years, we tested the general model shown in Figure 1. Consistent with the risky family model, we first hypothesized that harsh parenting in adolescence would forecast significantly greater increases in BMI from ages 10–29 (Δ BMI) (Pathway a). Then, we expected that much of the effect of harsh parenting on BMI would be mediated DNAm-based obesity (ORDM) index. Finally (Pathway b and c), we added gene expression of obesity-related genes (GEOG) as an additional mediator and hypothesized that the ORDM would mediate the effect of harsh parenting on GEOG, and GEOG, in turn, would mediate the link between ORDM and Δ BMI (Pathway b, d, and e).
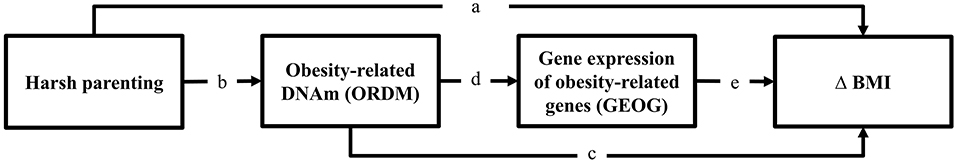
Figure 1. Theoretical model showing hypothesized indirect pathways from harsh parenting in adolescence to change in BMI through obesity-related DNAm and gene expression of obesity-related genes. Δ = change in BMI from ages 10 (wave 1) to 29 (wave 7).
Materials and Methods
Subjects
We tested the hypotheses using data from the seven waves of the Family and Community Health Study (FACHS). At the first wave (1997–1998), the FACHS sample consisted of 889 African American fifth-grade children (28). Their mean age was 10.56 years (SD = 0.631; range 9–13). The second, third, fourth, fifth, and sixth waves of data were collected in 1999–2000, 2002–2004, 2005–2007, 2008–2009, and 2010–2011, capturing information when youth were mean ages 12.5, 15.7, 18.8, 21.5, and 23.5, respectively. In 2015–2016 the 7th Wave of data collection was completed that included blood draws. The mean ages were about 29 years (SD = 0.803; range 28–32). Given the logistics of scheduling home visits by phlebotomists, only members of the sample residing in Georgia, Iowa, or a contiguous state were identified as eligible. After also excluding persons who were deceased, incarcerated, or otherwise unreachable, we were left with a pool of 556 individuals, 470 (86%) of whom agreed to provide blood. In the current study, analyses are based on the 362 respondents (131 men and 231 women) who reported BMI at age 29 and who were successfully assayed for genotypes, methylation, and gene expression. Comparisons of this subsample (n = 362) with those who were not included in the analysis (n = 527) did not reveal any significant differences with regard to harsh parenting, BMI, family income, and parental education at wave 1 (see online Supplementary Table 1). The complete data set for the current study can be downloaded from Supplementary Materials.
Procedures
The protocol and all study procedures were approved by the University of Georgia Institutional Review Board (Title: FACHS weathering-Targets, Study approval number 00006152). Computer-assisted interviews were administered in the respondent's home and took on average about 2 h to complete. The instruments were presented on laptop computers. Questions appeared in sequence on the screen, which both the researcher and participant could see. The researcher read each question aloud, and the participant entered an anonymous response using a separate keypad. Participants were also asked to provide a blood sample at age 29. The phlebotomist drew four tubes of blood (30 mL) from each participant; these were shipped on the same day to a laboratory for preparation. Whole blood DNA was prepared using cold protein precipitation, quantified with a NanoDrop photometer (Thermofisher, 168 Third Avenue Waltham, MA, USA), and stored at −20°C until use (Lahiri & Nurnberger Jr, 1991). To obtain mRNA values, blood samples were collected in a PAXgene tube and frozen and stored at −80°C until use.
Measures
Harsh Parenting
At waves 1–3, respondents answered 14 questions regarding how often during the preceding year the primary caregiver engaged in behaviors such as shouting, criticizing, lecturing, and physical aggression (29). Response categories ranged from 1 = never to 4 = always. Harsh parenting was coded so that higher scores indicated greater hostility and aggression. Coefficient alpha was 0.690 at wave 1, 0.780 at wave 2, and 0.814 at wave 3. Scores were standardized and then averaged across waves to form a composite measure of persistent exposure to harsh parenting.
Body Mass Index
At age 10 (wave 1), children's height and weight were reported to the interviewer. At age 29 (wave 4), the respondent's height and weight were measured at the time of the home visit. The Center for Disease Control calculator (https://www.cdc.gov/healthyweight/assessing/bmi/adult_bmi/english_bmi_calculator/bmi_calculator.html) was used to calculate BMI as weight in kilograms divided by the square of height in meters. We formulated a measure of change in BMI (Δ BMI) using the unstandardized residuals from the regression of BMI at wave 7 (age 10) on BMI at wave 1 (age 10).
Obesity-Related DNA Methylation
The Illumina Infinium HumanMethylationEPIC 850 BeadChip was used to assay genome-wide DNA methylation. This array contains 865,918 probes recognizing CpG positions of known transcripts, potential transcripts or CpG islands. Participants were randomly assigned to 16 sample “slides/chips” with groups of eight slides being bisulfite converted in a single plate, resulting in two “batches/plates.” A replicated sample of DNA was included in each plate to aid in assessment of batch variation and to ensure correct handling of specimens. The replicate sample was examined for average correlation of beta values between plates and was found to be >0.99. Quantile normalization methods were used, with separate normalization of Type I and Type II assays. This approach has been found to produce marked improvement for the Illumina array in detecting relationships by correcting distributional problems inherent in the manufacturer's default method for calculating the beta value. The beta value at each CpG locus was calculated as the ratio of the intensity of the methylated probe to the sum of intensities of the methylated and unmethylated probes. Finally, beta values after quantile normalization were used. We assessed DNAm-based obesity (ORDM) using a five CpG index (cg18181703, cg09349128, cg06178669, cg21585138, and cg03257930) developed by Wang et al. (20) for African Americans. The composite index of ORDM was calculated by averaging the beta values of the five CpGs. The mean was 0.366.
Gene Expression of Obesity-Related Genes
All available young adult PAXgene tube samples were sent to the Rutgers repository. The viable samples were processed using the Illumina HumanHT-12 v4 BeadChip. In each case, 200 ng of total RNA was processed according to the protocol supplied by Illumina. All samples were randomized prior to array hybridization using either two or three technical replicates. After background subtraction, raw Illumina probe data were exported using Illumina GenomeStudio v2011.1 software. The microarray data set of 47,323 probes was filtered by removing probes with detection threshold of p < 0.05, and probes with fewer than three beads present were also excluded, leaving 44,846 probes for analysis. Then, robust multiarray average normalized data were log2 transformed after quantile normalization and the quality of the microarray images was inspected visually using the ArrayAnalysis quality control pipeline (www.arrayanalysis.org). The results showed that there were no significant batch effects after quantile normalization.
GEOG was calculated for each participant based on the five transcripts of the obesity-related genes identified by Wang et al. (20): four genes (SOCS3, PIM3, CISH, and KLF4) were weighted +1 as positive indicators of BMI, and HRASLS2 was weighted −1 as an inverse indicator of obesity (20). The composite index of GEOG was calculated by averaging the log2 transformed values of the five transcripts of obesity-related genes.
Genetic Risk Score for Obesity Index
To examine and control the impact of background genetic variation on obesity, analyses were controlled for GRSO index developed by Monda et al. (30). The index of GRSO has been shown to associate with obesity, measured by BMI. In this study, blood was genotyped using the Illumina Infinium Multi- Ethnic Genotyping Array (MEGA). The eight SNPs included were located on eight different genes (rs543874 on SEC16B; rs6545800 on ADCY3; rs348495 on GNPDA2; rs7708584 on GALNT10; rs974417 on KLHL32; rs10261878 on MIR148A-NFE2L3; rs17817964 on FTO; and rs6567160 on MC4R). All SNPs were found to be in Hardy–Weinberg equilibrium. The weighted risk score weights the number of risk alleles present at each SNP (0, 1, 2) by its corresponding effect size estimated using previous study. Details regarding measuring of GRSO is described by Beach et al. (31).
Covariates
To account for variables that could provide plausible rival explanations, we controlled for gender, income, unhealthy diet, exercise, and C-reactive protein (CRP) at the last wave (age 29, wave 7). We also employed the last observation carried forward approach for imputing missing values at wave 7. Income was assessed by asking participants to report their income in the past year. Unhealthy diet was measured using a three-item scale that asked respondents to report how often in the past seven days (1 = none; 6 = more than once every day) they: (1) ate starchy foods like potatoes, peas, corn, rice, or noodles; (2) ate sweets such as candy bars, cake, cookies, or sugar-sweetened soda; and (3) ate fatty food like potato chips, corn chips, French fries, has browns, or Tater Tots. Scores on the three items were averaged to form the unhealthy diet measure. Exercise was measured with two items (e.g., on how many of the past 7 days did you exercise or participate in physical activity for at least 30 min that made you breathe hard such as running or riding a bicycle hard?) The response categories ranged from 1 (0 days) to 5 (all 7 days). Scores on the two items were averaged to form the exercise measure. C-reactive protein (CRP), a biomarker of vascular and systemic inflammation from a blood sample, was measured at Wave 7. Because CRP displayed a skewed distribution, it was transformed using log transformation to meet the assumption of linearity for inclusion in ordinary least squares regression.
Analytic Strategy
All analyses were run using Mplus 8.1. We used regression analyses to examine associations between harsh parenting in adolescence and change in BMI. We first checked for potential multicollinearity among variables. VIF scores ranged between 1.00 for harsh parenting and 1.06 for exercise, indicating no evidence of multicollinearity (VIF <10) among the study variables. Then, we used path modeling with maximum likelihood estimation to test our mediating hypothesized models. In the path models, we controlled for genetic risk score for obesity (GRSO) index and sociodemographic covariates. To assess goodness-of-fit of the model, we used Steiger's root-mean-square error of approximation (RMSEA < 0.05) and the comparative fit index (CFI > 0.90). The 95% confidence interval (CI) estimated with bias-corrected and accelerated bootstrapping with 1,000 resamples was used to assess the significance of hypothesized indirect effects (32). Finally, to address the robustness of our results, we tested for differences between the models for males and females using the multiple group analysis.
To test our hypotheses, variables were entered in the models in the following steps: (a) the main effect model, which tested the effects of harsh parenting (ages 10–15) on Δ BMI form age 10–29 (Hypothesis 1); (b) the indirect effect model with obesity-related obesity (ORDM) as a mediator, which was used to test an indirect effect of harsh parenting on Δ BMI through ORDM (Hypothesis 2); (c) the indirect effect model with ORDM and gene expression of obesity-related genes (GEOG) as mediators, which were used to test the pathway: harsh parenting → ORDM → GEOG → Δ BMI aging (Hypothesis 3).
Results
Initial Findings
Mean BMI was 21.776 (SD = 5.746) at Wave 1 (age 10) and 31.281 (SD = 8.181) at Wave 7 (age 29). At Wave 7 about 47% of participants had a BMI >30, which is considered obese. Correlations, means, and standard deviations for all study variables are displayed in Table 1. As expected, there were significant correlations of harsh parenting with change in BMI (Δ BMI) from ages 10–29 (r = 0.115, p = 0.029) and obesity-related DNAm (ORDM) (r = −0.185, p < 0.001). Further, ORDM was significantly related to gene expression of obesity-related genes (GEOG) (r = −0.178, p < 0.001) and Δ BMI (r = −0.374, p < 0.001). Finally, GEOG was significantly and positively associated with Δ BMI (r = 0.286, p < 0.001). Because all elements of potential mediation emerged, we proceeded with a formal test of our mediating hypotheses.
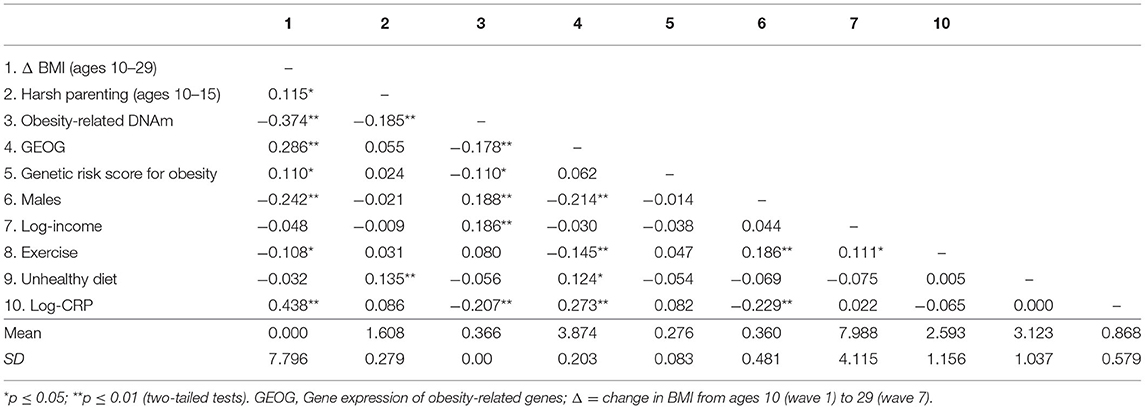
Table 1. Correlations, means, and standard deviations among study variables (N = 362).
We first checked for evidence of gene-environment correlation (rGE). As presented in Table 1, there was no significant direct association of genotype with harsh parenting (r = 0.024, ns), suggesting that there was no evidence of an rGE whereby elevated genetic risk for obesity led to increased exposure to harsh parenting. In addition, gender, income, exercise, and genetic risk score for obesity showed association with either dependent variables or mediators. The results suggest the value of suggesting the value of retaining them as controls in the analyses.
Hypothesis 1: Effect of Harsh Parenting on Change in BMI
Table 2 presents the effect of harsh parenting on Δ BMI. Consonant with the correlation matrix, harsh parenting in adolescence was significantly associated with Δ BMI (β = 0.115, p < 0.029). Next, as hypothesized, Model 2 shows that this association (β = 0.117, p < 0.022) was maintained after controlling for gender, income, exercise, and genetic risk score for obesity. Consistent with prior research (31), the beta coefficients for genetic risk score for obesity was positively related to Δ BMI, and being male was also significantly associated with Δ BMI (b = −3.695, p < 0.001).
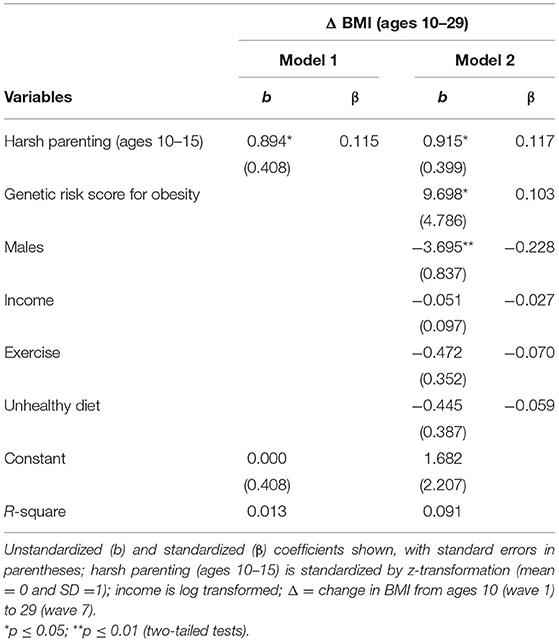
Table 2. Regression models examining harsh parenting as a predictor of change in body mass index (N = 362).
Hypothesis 2: Obesity-Related DNAm Mediates the Effect of Harsh Parenting on Change in BMI
To test the hypothesis that ORDM mediates the impact of harsh parenting on change in BMI, we examined mediation using path modeling. As can be seen in Figure 2, fit indices indicate that the model fits the data well (χ2 = 0.512, df = 2, p = 0.774; CFI = 1.000; RMSEA = 0.000). Controlling for gender, income, exercise, unhealthy diet, and genetic risk score for obesity, the model shows that harsh parenting in adolescence was related to ORDM (β = −0.177, p < 0.000), which in turn, was related to change in BMI across adolescence and young adulthood (β = −0.326, p < 0.001). In addition, the previously significant effect of harsh parenting on Δ BMI was no longer significant when ORDM was included in the model (β = 0.060, ns). To better explicate the relative strength of the direct and indirect effects from harsh parenting to Δ BMI, we used the approach outlined by Preacher et al. (32) to compute indirect effects. Using a bootstrapping method with 1,000 replications, corrected for non-normality and asymmetrical confidence intervals, we found that the indirect effect of harsh parenting in adolescence on change in BMI from ages 10–29 was significant (indirect effect = 0.058, 95% CI [0.025, 0.093]). To compute the proportion of the total effect accounted for by the mediator, we calculated the amount the direct effect was reduced due to the introduction of the mediator, and divided by the total effect (33). Therefore, controlling for sociodemographic covariates and genetic risk score for obesity previously found to be associated with BMI among African Americans, ORDM accounted for about 53.2% of the total effect in Δ BMI explained by harsh parenting in adolescence. The second hypothesis was supported.
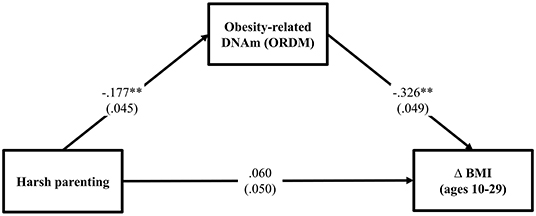
Figure 2. Methylation of obesity-related genes mediates the impact of harsh parenting on change in body mass index (N = 362). Chi-square = 0.512, df = 2, p = 0.774; CFI = 1.000; RMSEA = 0.000. Values are standardized parameter estimates and standard errors are in parentheses. Genetic risk score for obesity, males, income, exercise, unhealthy diet are controlled in these analyses. Δ = change in BMI from ages 10 (wave 1) to 29 (wave 7). **p ≤ 0.01; *p ≤ 0.05 (two-tailed tests).
Hypothesis 3: The Effect of Harsh Parenting on Change in BMI Through Obesity-Related DNAm and Gene Expression of Obesity-Related Genes
Turning to the third hypothesis, GEOG was added into the path between ORDM and Δ BMI. As can be seen in Figure 3, the fit indexes were good for this model (χ2 = 0.721, df = 2, p = 0.698; CFI = 1.000; RMSEA = 0.000). As expected, harsh parenting in adolescence predicted demethylated ORDM (β = −0.175, p < 0.000) that in turn predicted both GEOG (β = −0.124, p = 0.021) and Δ BMI (β = −0.301, p < 0.001). Further, GEOG was significantly related to Δ BMI (β = 0.202, p < 0.001). Table 3 summarizes the results using the bootstrapping method with 1,000 replications to test the significance of direct and indirect effects. The table shows that two indirect pathways are significant. This includes the path harsh parenting → ORDM → GEOG → Δ BMI (indirect effect = 0.004, 95% CI [0.001, 0.012], with a small-medium effect size 0.034), as well as harsh parenting → ORDM → Δ BMI (indirect effect = 0.053, 95% CI [0.024, 0.089], with a large effect size 0.453). Overall, the results provide support for the hypothesized model, but do not indicate that all effects of obesity-related DNAm on BMI are mediated by the expression of the genes in the ORDM index.
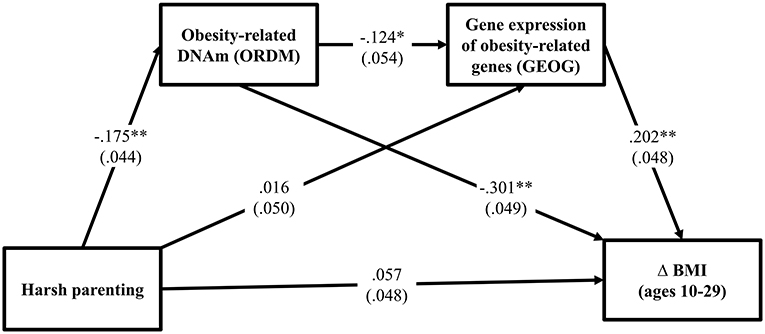
Figure 3. Methylation and gene expression of obesity-related genes mediates the impact of harsh parenting on change in body mass index (N = 362). Chi-square = 0.721, df = 2, p = 0.698; CFI = 1.000; RMSEA = 0.000. Values are standardized parameter estimates and standard errors are in parentheses. Genetic risk score for obesity, males, income, and unhealthy diet are controlled in these analyses. Δ = change in BMI from ages 10 (wave 1) to 29 (wave 7). **p ≤ 0.01; *p ≤ 0.05 (two-tailed tests).
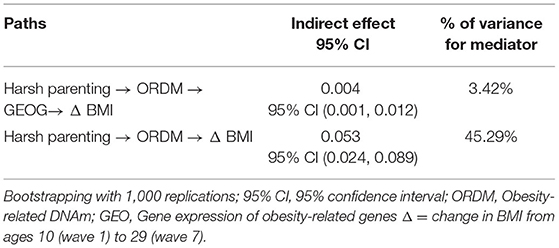
Table 3. Summary of indirect effects.
Sensitivity Analysis
To address the robustness of our findings, we tested for differences between the models for women and men using multiple group analyses. We began by estimating a model that constrained the paths for women and men to be equal. Next, we estimated a model that freed the paths to vary by gender. The chi-square difference between the models was significant, indicating structural non-invariance. That is, the model fit was significantly worse when the paths were constrained to be equal for men and women. To determine which paths were different, we freed one path in the constrained model at a time and compared it with the constrained model's chi-square with 1 degree of freedom. Table 4 shows that there was no gender difference in various paths [harsh parenting → ORDM: = 0.149, p = 0.699; ORDM → GEOG: = 3.336, p = 0.068; GEOG → Δ BMI: = 0.002, p = 0.964, respectively]. Finally, to test our assumption that ORDM led to GEOG and not vice versa, we tested this possibility directly. As shown in online Supplementary Figure 1, the alternative model, that GEOG led to ORDM was not supported because harsh parenting was not associated with gene expression of obesity-related genes (GEOG). Finally, given that healthy and unhealthy obesity may be differently involved in physiological processes (34), we repeated the analysis presented in Figure 3 controlling for C-reactive protein (CRP), a marker of chronic inflammation associated with obesity that may have effects on DNA methylation and gene expression values. As presented in Supplementary Figure 2, the pattern of results was identical to that depicted in Figure 3.
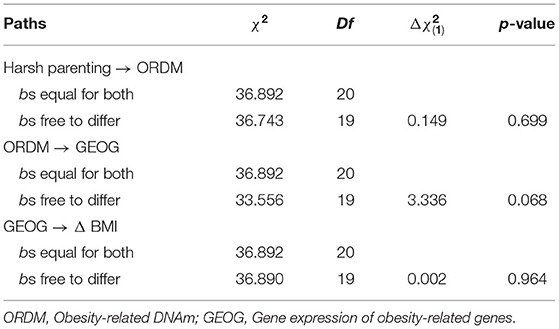
Table 4. Multiple group comparison between females and males.
Discussion
The current study examined a plausible mediational model linking harsh parenting in adolescence with BMI in young adulthood via changes in DMA methylation and gene expression for genes known to be related to BMI among African Americans. Whereas, most studies have been cross-sectional and have used retrospective reports of early adversity (35), we used longitudinal data to examine prospective associations between harsh parenting across childhood and adolescence to examine their association with change in BMI from childhood to young adulthood. Confirming prior retrospective research, prospectively reported adolescent harsh parenting was associated with the change in BMI from childhood to young adulthood, even after controlling for health-related covariates and genetic effects. It should be noted that our results indicated that an unhealthy diet shows no effect on obesity. Indeed, research on the association between nutrients and obesity/health has produced mixed results (18, 36), especially self-reported measures. This is due, in part, to known limitations of self-reported measures of diet such as forgetting, biases, and distortions common to all recall measures (7, 37). Accordingly, our findings are consistent with prior studies indicating that early stress experiences “get under the skin” and influence physiological processes through the life course (11, 12).
Previous studies have documented the effects of early childhood life stress on subsequent biological and genomic functioning (38), whereas our results suggest that harsh parenting during adolescence also exerts an influence on genomic functioning in young adults. To the best of our knowledge, this is the first study to examine whether obesity-related patterns of methylation might be responsive to family stress and help explain the link between harsh parenting experienced during adolescence and BMI in young adulthood. Given that the levels of DNA methylation vary depending on environmental influences, we posited that harsh parenting in adolescence would be associated with obesity-related DNAm; and that the level of obesity-related DNAm would be associated with the change in BMI from childhood to young adulthood. These predicted associations were all significant using the current sample of African Americans, net of the contribution of genetic variability, gender, income, and exercise. Hence methylation might be seen providing the biological underpinnings for linking between environments and phenotypes.
In addition, DNA methylation plays a significant role in regulating gene expression (20). An integrated model that incorporates social factors, DNA methylation, and gene expression provides a more nuanced understanding of the potential biosocial mechanisms that may link relevant social context to health outcomes. The present study shows that obesity-related DNAm mediates the effect of harsh parenting on increased gene expression of obesity-related genes which, in turn, partially accounts for the development of obesity. Therefore, one important finding from the current study was that methylation and gene expression emerged as plausible biological mediators, and strengthened the case for social policies and interventions to enhance family environments during childhood and adolescence as one component of a multi-pronged effort to address the obesity epidemic (39).
It is important to acknowledge that many different types of positive and negative childhood adversities and stressors have been implicated as potential precursors of obesity—and these factors have a strong tendency to co-occur (40–42). Moreover, the role of structural racism creates toxic ecological environments that undermine the health of Black Americans by limiting their access to various resources (43, 44) and exposing them to childrearing failure (45). Indeed, the social marginality and economically adverse that characterize many Black neighborhoods (46) has been shown to increase harsh parenting and harm various health problems through various social and biological pathways (47). Accordingly, it is possible that an assessment of cumulative stresses across childhood and youth, including adversities arising inside the family, within the neighborhood, within school settings, or within the broader society, might better predict adult obesity and health outcomes than does harsh parenting alone (40). Similarly, it is important to acknowledge complexity in the assessment of family environment for African American youth. Although some studies have suggested an increased likelihood of African Americans experiencing reported childhood maltreatment (48, 49). Acceptability of corporal punishment among African Americans may result in greater reports of “harsh parenting” that reflect some mixture of no nonsense parenting as well as exposure to abusive parenting (50). Poverty and stressful neighborhood characteristics are also associated with relatively harsher parenting strategies (51), increasing the likelihood of exposure to physical abuse among those raised in low-income communities (52). No nonsense parenting involves physical punishment and the use of physical restraint but occurs within the context of warmth and affection (53). It should also be noted that poverty and stressful neighborhood characteristics are associated with relatively harsher parenting strategies (54), and these factors may also contribute indirectly to the development of obesity. Accordingly, although reports of harsh parenting likely reflect higher stress environments, it cannot be assumed they reflect abusive parenting or even inappropriate parenting for some difficult contexts.
Limitations of the current study also should be noted. First, these findings, which are based on an African American sample and await replication with other ethnicities. It is possible that different social processes may emerge as central for other ethnic groups. Further, it should also be noted that the timing of methylation and gene expression assessments relative to the assessment of young adult BMI does not allow us to rule out causal effects from BMI to methylation and gene expression. Accordingly, future work with multiple assessments, preferably including assessment in late childhood as well as early adulthood, will be necessary to better examine direction of effects between methylation, gene expression, early harsh parenting practices, and change in BMI. Third, gene regulation may contribute to other aspects of health outcomes beyond obesity, suggesting the importance of testing for potential associations with other aspects of cardiometabolic health as youth reach the age of increased risk. This may help explicate why African American adults are twice as likely as European American adults to die of heart disease and diabetes (55) and how this disparity comes to be rooted in childhood experiences associated with economic stress and early deprivation (56). Finally, our results suggest a biosocial mechanism that links the early family environment to long-term obesity problems mediated by epigenetic pathways. However, our findings do not rule out potential additional mechanisms linking harsh parenting and obesity. Obesity is known to increase the chances of developing dyslipidemia, characterized by elevated plasma triglycerides, reduced high-density lipoprotein (HDL) cholesterol, and elevated apoB concentration (57). Further, the change of dyslipidemia also, in turn, affects DNA methylation and induces changes in gene expression profiles (58, 59), suggesting additional mechanistic pathways to examine. In particular, although BMI is strongly related to both subcutaneous and visceral adipose tissues (60), changes in these tissues may have different effects on metabolic disorders. Therefore, future research that can better distinguish changes in subcutaneous and visceral adipose tissues will be needed to better understand the association of harsh parenting to each.
Given that obesity is assoicated with earlier onset of cardiovascular disease (31), the current results suggest that one way in which harsh parenting in adolescence may influence long-term health outcomes such as obesity is by acting on gene regulation. Identifying the mechanisms linking early experiences with later health consequences can inform the development of new preventive interventions by identifying potential boundary conditions for program efficacy and providing enhanced measurement strategies for detecting positive change. From a social policy standpoint, the current results suggest that modifiable family influences may exert an effect on obesity. In turn, this suggests that programs to promote healthy family interaction can improve long-term health outcomes by reducing propensity toward obesity. Future research should examine whether some of the apparent impacts of epigenetic change on BMI may result from associations with cognitive and behavioral changes that act in concert with biological pathways to obesity. Explication of biological effects on earlier behavioral phenotypes (e.g., lifestyles) may enhance the forecasting of outcomes in young adulthood, leading to the identification of additional preventive intervention targets and clarifying relevant developmental processes conferring risk. In particular, research identifying relevant stress proliferation processes may be useful in expanding the current model. It will also be important to examine additional epigenetic mechanisms given the many genes potentially relevant to obesity.
Data Availability Statement
The original contributions presented in the study are included in the article/Supplementary Materials, further inquiries can be directed to the corresponding author.
Ethics Statement
The studies involving human participants were reviewed and approved by FACHS weathering-Targets, Study approval number 00006152. Written informed consent to participate in this study was provided by the participants' legal guardian/next of kin.
Author Contributions
M-KL led design and analysis, participated in the construction of measures, and drafted the manuscript. SB participated in the study's design and drafting of the manuscript. RS and KY conceived of the study and made substantive contributions to the manuscript regarding the interpretation of findings. All authors contributed to the article and approved the submitted version.
Funding
This research was supported by Award Number R01 HL8045 from the National Heart, Lung, and Blood Institute, R01 HD080749 from the National Institute of Child Health and Human Development, R01 AG055393 from the National Institute on Aging, and R01 CA220254 from the National Cancer Institute.
Conflict of Interest
The authors declare that the research was conducted in the absence of any commercial or financial relationships that could be construed as a potential conflict of interest.
Publisher's Note
All claims expressed in this article are solely those of the authors and do not necessarily represent those of their affiliated organizations, or those of the publisher, the editors and the reviewers. Any product that may be evaluated in this article, or claim that may be made by its manufacturer, is not guaranteed or endorsed by the publisher.
Supplementary Material
The Supplementary Material for this article can be found online at: https://www.frontiersin.org/articles/10.3389/fcvm.2021.755458/full#supplementary-material
References
1. Hales CM, Fryar CD, Carroll MD, Freedman DS, Aoki Y, Ogden CL. Differences in obesity prevalence by demographic characteristics and urbanization level among adults in the United States, 2013-2016. JAMA. (2018) 319:2419–29. doi: 10.1001/jama.2018.7270
2. Ogden CL, Carroll MD, Kit BK, Flegal KM. Prevalence of childhood and adult obesity in the United States, 2011-2012. JAMA. (2014) 311:806–14. doi: 10.1001/jama.2014.732
3. Must A, Spadano J, Coakley EH, Field AE, Colditz G, Dietz WH. The disease burden associated with overweight and obesity. JAMA. (1999) 282:1523–9. doi: 10.1001/jama.282.16.1523
4. McCrindle BW. Cardiovascular consequences of childhood obesity. Can J Cardiol. (2015) 31 124–30. doi: 10.1016/j.cjca.2014.08.017
5. Reuser M, Bonneux LG, Willekens FJ. Smoking kills, obesity disables: a multistate approach of the US Health and Retirement Survey. Obesity. (2009) 17:783–9. doi: 10.1038/oby.2008.640
6. Lei MK, Beach SRH, Simons RL. Childhood trauma, pubertal timing, and cardiovascular risk in adulthood. Health Psychol. (2018) 37:613–7. doi: 10.1037/hea0000609
7. Lei MK, Berg MT, Simons RL, Simons LG, Beach SR. Childhood adversity and cardiovascular disease risk: an appraisal of recall methods with a focus on stress-buffering processes in childhood and adulthood. Soc Sci Med. (2020) 246:112794. doi: 10.1016/j.socscimed.2020.112794
8. Piché ME, Tchernof A, Després JP. Obesity phenotypes, diabetes, and cardiovascular diseases. Circ Res. (2020) 126:1477–500. doi: 10.1161/CIRCRESAHA.120.316101
9. D'Agostino RB, Pencina MJ, Massaro JM, Coady S. Cardiovascular disease risk assessment: insights from framingham. Glob Heart. (2013) 8:11–23. doi: 10.1016/j.gheart.2013.01.001
10. Whitlock G, Lewington S, Sherliker P, Clarke R, Emberson J, Halsey J, et al. Body-mass index and cause-specific mortality in 900 000 adults: collaborative analyses of 57 prospective studies. Lancet. (2009) 373:1083–96. doi: 10.1016/S0140-6736(09)60318-4
11. Johnson WF, Huelsnitz CO, Carlson EA, Roisman GI, Englund MM, Miller GE, et al. Childhood abuse and neglect and physical health at midlife: prospective, longitudinal evidence. Dev Psychopathol. (2017) 29:1935–46. doi: 10.1017/S095457941700150X
12. MillerGE, Chen E, Parker KJ. Psychological stress in childhood and susceptibility to the chronic diseases of aging: moving toward a model of behavioral and biological mechanisms. Psychol Bull. (2011) 137:959–97. doi: 10.1037/a0024768
13. Zhou JL, Zhang LJ, Xuan P, Fan Y, Yang LS, Hu CQ, et al. The relationship between famine exposure during early life and body mass index in adulthood: a systematic review and meta-analysis. PLoS ONE. (2018) 13:e0192212. doi: 10.1371/journal.pone.0192212
14. Repetti RL, Taylor SE, Seeman TE. Risky families: family social environments and the mental and physical health of offspring. Psychol Bull. (2002) 128:330–66. doi: 10.1037/0033-2909.128.2.330
15. Brody GH, Yu T, Chen E, Kobor M, Beach SR, Lei MK, et al. Risky family climates presage increased cellular aging in young adulthood. Psychoneuroendocrinology. (2021) 130:105256. doi: 10.1016/j.psyneuen.2021.105256
16. Repetti RL, Robles TF, Reynolds B. Allostatic processes in the family. Dev Psychopathol. (2011) 23:921–38. doi: 10.1017/S095457941100040X
17. Simons RL, Lei MK, Beach SR, Philibert RA, Cutrona CE, Gibbons FX, et al. Economic hardship and biological weathering: the epigenetics of aging in a US sample of black women. Soc Sci Med. (2016) 150:192–200. doi: 10.1016/j.socscimed.2015.12.001
18. Simons RL, Lei MK, Klopack E, Beach SR, Gibbons FX, Philibert RA. The effects of social adversity, discrimination, and health risk behaviors on the accelerated aging of African Americans: further support for the weathering hypothesis. Soc Sci Med. (2021) 282:113169. doi: 10.1016/j.socscimed.2020.113169
19. Horvath S, Raj K. DNA methylation-based biomarkers and the epigenetic clock theory of ageing. Nat Rev Genet. (2018) 19:371–84. doi: 10.1038/s41576-018-0004-3
20. Wang X, Pan Y, Zhu H, Hao G, Huang Y, Barnes V, et al. An epigenome-wide study of obesity in African American youth and young adults: novel findings, replication in neutrophils, and relationship with gene expression. Clin Epigenetics. (2018) 10:1–9. doi: 10.1186/s13148-017-0435-2
21. Lei MK, Beach SR, Simons RL, Philibert RA. Neighborhood crime and depressive symptoms among African American women: genetic moderation and epigenetic mediation of effects. Soc Sci Med. (2015) 146:120–8. doi: 10.1016/j.socscimed.2015.10.035
22. Beach SR, Lei MK, Brody GH, Kim S, Barton AW, Dogan MV, et al. Parenting, socioeconomic status risk, and later young adult health: exploration of opposing indirect effects via DNA methylation. Child Dev. (2016) 87:111–21. doi: 10.1111/cdev.12486
23. Plume JM, Beach S, Brody GH, Philibert RA. A cross-platform genome-wide comparison of the relationship of promoter DNA methylation to gene expression. Front Genet. (2012) 3:12. doi: 10.3389/fgene.2012.00012
24. Dowen RH, Pelizzola M, Schmitz RJ, Lister R, Dowen JM, Nery JR, et al. Widespread dynamic DNA methylation in response to biotic stress. Proc Natl Acad Sci USA. (2012) 109:E2183–91. doi: 10.1073/pnas.1209329109
25. Cole SW, Conti G, Arevalo JMG, Ruggiero AM, Heckman JJ, Suomi SJ. Transcriptional modulation of the developing immune system by early life social adversity. Proc Natl Acad Sci USA. (2012) 109:20578–83. doi: 10.1073/pnas.1218253109
26. Mitchell C, Schneper LM, Notterman DA. DNA methylation, early life environment, and health outcomes. Pediatr Res. (2016) 79:212–9. doi: 10.1038/pr.2015.193
27. Schwaiger M, Grinberg M, Moser D, Zang JCS, Heinrichs M, Hengstler JG, et al. Altered stress-induced regulation of genes in monocytes in adults with a history of childhood adversity. Neuropsychopharmacology. (2016) 41:2530–40. doi: 10.1038/npp.2016.57
28. Beach SRH, Lei MK, Simons RL, Barr AB, Simons LG, Cutrona CE, et al. Perceived relationship support moderates the association of contextual stress with inflammation among African Americans. J Fam Psychol. (2019) 33:338–48. doi: 10.1037/fam0000509
29. Simons RL, Simons LG, Lei MK, Landor AM. Relational schemas, hostile romantic relationships, and beliefs about marriage among young African American adults. J Soc Pers Relat. (2012) 29:77–101. doi: 10.1177/0265407511406897
30. Monda KL, Chen GK, Taylor KC, Palmer C, Edwards TL, Lange LA, et al. A meta-analysis identifies new loci associated with body mass index in individuals of African ancestry. Nat Genet. (2013) 45:690–6. doi: 10.1038/ng.2608
31. Beach SR, Ong ML, Lei MK, Klopack E, Carter SE, Simons RL, et al. Childhood adversity is linked to adult health among African Americans via adolescent weight gain and effects are genetically moderated. Dev Psychopathol. (2021) 33:803–20. doi: 10.1017/S0954579420000061
32. Preacher KJ, Rucker DD, Hayes AF. Addressing moderated mediation hypotheses: theory, methods, and prescriptions. Multivariate Behav Res. (2007) 42:185–227. doi: 10.1080/00273170701341316
33. Lee S, Lei MK, Brody GH. Constructing confidence intervals for effect size measures of an indirect effect. Multivariate Behav Res. (2015) 50:600–13. doi: 10.1080/00273171.2015.1040542
34. Guo F, Garvey WT. Cardiometabolic disease risk in metabolically healthy and unhealthy obesity: stability of metabolic health status in adults. Obesity. (2016) 24:516–25. doi: 10.1002/oby.21344
35. Suglia SF, Koenen KC, Boynton-Jarrett R, Chan PS, Clark CJ, Danese A, et al. Childhood and adolescent adversity and cardiometabolic outcomes: a scientific statement from the American Heart Association. Circulation. (2018) 137:e15–28. doi: 10.1161/CIR.0000000000000536
36. Do WL, Whitsel EA, Costeira R, Masachs OM, Le Roy CI, Bell JT, et al. Epigenome-wide association study of diet quality in the Women's Health Initiative and TwinsUK cohort. Int J Epidemiol. (2021) 50:675–84. doi: 10.1093/ije/dyaa215
37. Widom CS. Are retrospective self-reports accurate representations or existential recollections? JAMA Psychiatry. (2019) 76:567–8. doi: 10.1001/jamapsychiatry.2018.4599
38. Essex MJ, Thomas Boyce W, Hertzman C, Lam LL, Armstrong JM, Neumann SM, et al. Epigenetic vestiges of early developmental adversity: childhood stress exposure and DNA methylation in adolescence. Child Dev. (2013) 84:58–75. doi: 10.1111/j.1467-8624.2011.01641.x
39. Brody GH, Yu T, Miller GE, Ehrlich KB, Chen E. Preventive parenting intervention during childhood and young black adults' unhealthful behaviors: a randomized controlled trial. J Child Psychol Psychiatry. (2019) 60:63–71. doi: 10.1111/jcpp.12968
40. Dong M, Anda RF, Felitti VJ, Dube SR, Williamson DF, Thompson TJ, et al. The interrelatedness of multiple forms of childhood abuse, neglect, and household dysfunction. Child Abuse Negl. (2004) 28:771–84. doi: 10.1016/j.chiabu.2004.01.008
41. Radford L, Corral S, Bradley C, Fisher HL. The prevalence and impact of child maltreatment and other types of victimization in the UK: findings from a population survey of caregivers, children and young people and young adults. Child Abuse Negl. (2013) 37:801–13. doi: 10.1016/j.chiabu.2013.02.004
42. Slopen N, Chen Y, Guida JL, Albert MA, Williams DR. Positive childhood experiences and ideal cardiovascular health in midlife: associations and mediators. Prev Med. (2017) 97:72–79. doi: 10.1016/j.ypmed.2017.01.002
43. Phelan JC, Link BG. Is racism a fundamental cause of inequalities in health? Ann Rev Soc. (2015) 41:311–30. doi: 10.1146/annurev-soc-073014-112305
44. Powell-Wiley TM. Disentangling ancestry from social determinants of health in hypertension disparities-an important step forward. JAMA Cardiol. (2021) 6:398–99. doi: 10.1001/jamacardio.2020.6573
45. Brody GH, Lei MK, Chae DH, Yu T, Kogan SM, Beach SR. Perceived discrimination among African American adolescents and allostatic load: a longitudinal analysis with buffering effects. Child Dev. (2014) 85:989–1002. doi: 10.1111/cdev.12213
46. Peterson RD, Krivo LJ. Divergent Social Worlds: Neighborhood Crime and the Racial-Spatial Divide. New York, NY: Russell Sage Foundation (2010).
47. Hyde LW, Gard AM, Tomlinson RC, Burt SA, Mitchell C, Monk CS. An ecological approach to understanding the developing brain: examples linking poverty, parenting, neighborhoods, and the brain. Am Psychol. (2020) 75:1245–59. doi: 10.1037/amp0000741
48. Dakil SR, Cox M, Lin H, Flores G. Racial and ethnic disparities in physical abuse reporting and child protective services interventions in the United States. J Nat Med Assoc. (2011) 103:926–31. doi: 10.1016/S0027-9684(15)30449-1
49. Kim H, Wildeman C, Jonson-Reid M, Drake B. Lifetime prevalence of investigating child maltreatment among US children. Am J Public Health. (2017) 107:274–80. doi: 10.2105/AJPH.2016.303545
50. McLoyd VC, Cauce AM, Takeuchi D, Wilson L. Marital processes and parental socialization in families of color: a decade review of research. J Marriage Fam. (2000) 62:1070–93. doi: 10.1111/j.1741-3737.2000.01070.x
51. McLoyd VC. Poverty, parenting, and policy: meeting the support needs of poor parents. In: Fitzgerald HE, Lester BM, Zuckerman B, editors. Children of Poverty: Research, Health, and Policy Issues. New York, NY: Garland Publishing (1995). p. 269–304.
52. Lei MK, Simons RL. The association between neighborhood disorder and health: exploring the moderating role of genotype and marriage. Int J Environ Res Public Health. (2021) 18:898. doi: 10.3390/ijerph18030898
53. Brody GH, Flor DL. Maternal resources, parenting practices, and child competence in rural, single-parent African American families. Child Dev. (1998) 69:803–16. doi: 10.1111/j.1467-8624.1998.tb06244.x
54. Gard AM, McLoyd VC, Mitchell C, Hyde LW. Evaluation of a longitudinal family stress model in a population-based cohort. Soc Dev. (2020) 29:1155–75. doi: 10.1111/sode.12446
55. Lantz PM, Lynch JW, House JS, Lepkowski JM, Mero RP, Musick MA, et al. Socioeconomic disparities in health change in a longitudinal study of US adults: the role of health-risk behaviors. Soc Sci Med. (2001) 53:29–40. doi: 10.1016/S0277-9536(00)00319-1
56. Hertzman C. The biological embedding of early experience and its effects on health in adulthood. Ann N Y Acad Sci. (1999) 896:85–95. doi: 10.1111/j.1749-6632.1999.tb08107.x
57. Vekic J, Zeljkovic A, Stefanovic A, Jelic-Ivanovic Z, Spasojevic-Kalimanovska V. Obesity and dyslipidemia. Metabolism. (2019) 92:71–81. doi: 10.1016/j.metabol.2018.11.005
58. do Amaral CL, Curi R. Gene expression in dyslipidemias. In: De Caterina R, Alfredo Martinez J, Kohlmeier M, editors. Principles of Nutrigenetics and Nutrigenomics. Cambridge, MA: Academic Press (2020) p. 447–56. doi: 10.1016/B978-0-12-804572-5.00060-4
59. Pagiatakis C, Musolino E, Gornati R, Bernardini G, Papait R. Epigenetics of aging and disease: a brief overview. Aging Clin Exp Res. (2021) 33:737–45. doi: 10.1007/s40520-019-01430-0
Keywords: harsh parenting, body mass index, risky family model, obesity-related DNA methylation, gene expression of obesity, mediating pathway
Citation: Lei M-K, Beach SRH, Simons RL and Ye K (2021) The Impact of Harsh Parenting on the Development of Obesity in Adulthood: An Examination of Epigenetic/Gene Expression Mediators Among African American Youth. Front. Cardiovasc. Med. 8:755458. doi: 10.3389/fcvm.2021.755458
Received: 08 August 2021; Accepted: 18 October 2021;
Published: 05 November 2021.
Edited by:
Tiffany M. Powell-Wiley, National Institutes of Health (NIH), United StatesReviewed by:
Matti Sakari Jauhiainen, Minerva Foundation Institute for Medical Research, FinlandAlina Yu Babenko, Almazov National Medical Research Center, Russia
Copyright © 2021 Lei, Beach, Simons and Ye. This is an open-access article distributed under the terms of the Creative Commons Attribution License (CC BY). The use, distribution or reproduction in other forums is permitted, provided the original author(s) and the copyright owner(s) are credited and that the original publication in this journal is cited, in accordance with accepted academic practice. No use, distribution or reproduction is permitted which does not comply with these terms.
*Correspondence: Man-Kit Lei, a2FybG9AdWdhLmVkdQ==