Abstract
Assessment of vascular size and of its phasic changes by ultrasound is important for the management of many clinical conditions. For example, a dilated and stiff inferior vena cava reflects increased intravascular volume and identifies patients with heart failure at greater risk of an early death. However, lack of standardization and sub-optimal intra- and inter- operator reproducibility limit the use of these techniques. To overcome these limitations, we developed two image-processing algorithms that quantify phasic vascular deformation by tracking wall movements, either in long or in short axis. Prospective studies will verify the clinical applicability and utility of these methods in different settings, vessels and medical conditions.
1. Introduction
Currently, the invasive measurement of central venous pressure (CVP) to estimate right atrial pressure (RAP) is routinely used only in critically ill patients to assess cardiac hemodynamics and volume status. Medical devices that provide this information non-invasively are under development, but not routinely used yet in clinical practice (1). A widely adopted non-invasive approach to estimate RAP is based on ultrasound (US) imaging of the inferior vena cava (IVC) diameter and of its respiratory changes (2, 3). These changes can be expressed in terms of the caval index (CI), defined as the variation of the vessel diameter during a respiration cycle, relative to the maximum diameter (4). This approach is not standardized (5) [for instance, it is performed in either long (6) or short axis (7) views], is operator-dependent (8) [with an important effect of experience (9)] and prone to measurement errors (10) [e.g., due to movements (8, 11) or to irregular shape of the IVC (12)]. Therefore, a single measurement might only provide limited—and misleading—information. The following sources of variability of the standard US approach have been investigated (8): different respiration cycles (coefficient of variation, CoV=15%), specific longitudinal section (CoV=40%), inter- and intra-operator variability (CoV 35 and 28%, respectively). Furthermore, recent studies indicated that IVC collapsibility assessed with current methods is not a reliable predictor of fluid responsiveness (13) and its correlation with RAP is only modest (14, 15).
Alternative approaches to assess, non-invasively, the CVP or volemic status have been proposed. For instance, there is a good correlation between CVP with pressure measured in superficial veins at the forearm with an US probe equipped with a pressure transducer (16). Moreover, measuring with US the ratio of the internal jugular vein during a Valsalva maneuver to that at rest identifies patients with heart failure with more severe intravascular congestion at greater risk of poorer outcomes (17, 18). However these techniques are not routinely used in clinical practice, as they require a more robust validation.
The assessment of arterial wall properties is also useful to characterize the health of the cardiovascular system and can improve prediction of cardiovascular events beyond conventional risk factors (19). Measurement of aortic pulse wave velocity (PWV) is considered the current gold standard to assess arterial stiffness. It has acceptable degree of accuracy and reliability (10) and has demonstrated to predict cardiovascular events for patients with different cardiovascular risk factors or diseases (20), but requires a specialized equipment (arterial tonometry, piezoelectric sensors, photoplethysmography) and additional time and resources. Moreover, current assessment of PWV may exclude the proximal segment of the aorta and might not identify pathological segments along the arterial tree, the deformation of which could, potentially, be assessed by US if a reliable method existed (21, 22).
Recently, we have started to address some of the above mentioned issues and developed two semi-automated methods to delineate and track displacements of the IVC borders in long (4, 8, 23, 24) or short axis views (12). Our approaches could reduce the inter/intra-operator variability (8), assist in the interpretation of findings clinicians or sonographers with limited training and experience (25), and perhaps facilitate the diffusion of point-of-care US to guide clinical decisions. Our preliminary results suggest that the integration of indexes extracted by both algorithms could provide a more reliable estimation of the volemic status than using the standard IVC assessment (26) and call for extensions of research to larger databases and other vessels, like the arteries, the evaluation of which might improve cardiovascular risk stratification (27).
In this manuscript, we discuss these methods along with some possible future applications.
2. Physiological Basis of Vessel Pulsatility
Rapid changes in vascular size (irrespective of whether we deal with arteries or veins) are primarily produced by changes in transmural pressure Ptm, defined as Ptm = Pin−Pout, where Pin is the blood pressure inside and Pout the pressure outside the vessel wall (28, 29). The relation between vascular size and Ptm is generally represented by a volume-pressure (or capacitance) curve as qualitatively shown in Figure 1, whereby the vascular size, expressed in terms of vessel volume V, is shown to increase with increasing transmural pressure. This sketchy representation can be assumed to be a hypothetical experimental characterization of the vessel of interest. Ranges of volume and pressure are not indicated, as they vary widely along the cardiovascular system (30). Specifically, arteries are more rigid and exposed to larger pressure variations than veins. Pressure variations in the arteries are mainly determined by the pulsatile nature of the cardiac pump and they are also affected by peripheral resistances; whilst Ptm changes in the veins are largely influenced by a variation of the external pressure. However, this scheme is only a simplistic representation, as intrinsic vessel characteristics, circulating blood volume, medications and many other additional factors might influence intravascular pressure (31); moreover, the volume-pressure curve of a certain vessel or vascular district can be modulated by spontaneous or drug-mediated variations in vascular tone.
Figure 1
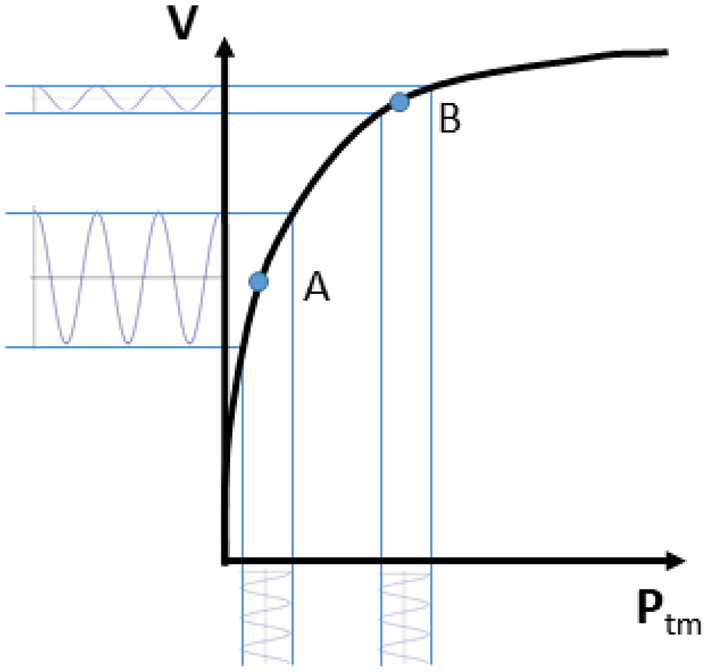
Volume-pressure curve of a venous blood vessel relating the vessel size (volume V) to the transmural pressure (Ptm). Note that an oscillatory perturbation in blood pressure results in large volume changes if Ptm is low (A; high vessel compliance) and low pulsatility if Ptm is high (B; low vessel compliance).
Coming back to the simplified representation shown in Figure 1, it can however be observed that the curve has a tendency to flatten at high Ptm. This indicates a decreasing vessel compliance, defined as
and representing the slope of the volume-pressure curve. A given perturbation of Ptm, such as a blood pressure change of cardiac or respiratory origin, would result in a corresponding vessel volume change, according to vessel compliance. As shown in Figure 1, the same change in Ptm will produce different changes in vessel size, depending on the resting (average) value of Ptm and V: if average Ptm is low (for instance, in the case of IVC, when CVP or blood volume are normal) size changes will be large, while at a higher Ptm value the vessel size will be larger and its phasic changes (that we might call “pulsatility”, for simplicity) will be smaller (for instance, when CVP is high or if there is hypervolemia).
The same considerations might apply, in theory, to the entire vascular system. Notably, Ptm is not just dependent on the inner blood pressure, but also on the outside pressure. The effect of changes in the outside pressure are particularly relevant in veins, given their low blood pressure.
It is worth to reconsider the changes in transmural pressure that take place in the (abdominal) IVC during respiration. As compared to the reference end-expiratory condition (Figure 2A), in which the IVC exhibits its maximum size, during a thoracic inspiration the IVC undergoes a slight reduction in size, due to the decrease in intrathoracic pressure which drains blood from the IVC, thus lowering blood pressure and its Ptm (Figure 2B). In addition, during inspiration, the diaphragm descends and abdominal pressure increases, with a further decrease in Ptm and IVC size (Figure 2C). The different implications of the respiratory pattern on IVC size have been evidenced experimentally during both spontaneous respiration (32) and in controlled isovolumetric respiratory efforts (33). Opposite effects, i.e., increased IVC size during inspiration, are observed during positive pressure ventilation, whereby the increase in intrathoracic pressure hinders venous return, thus increasing abdominal venous blood pressure and IVC size (Figure 2D).
Figure 2
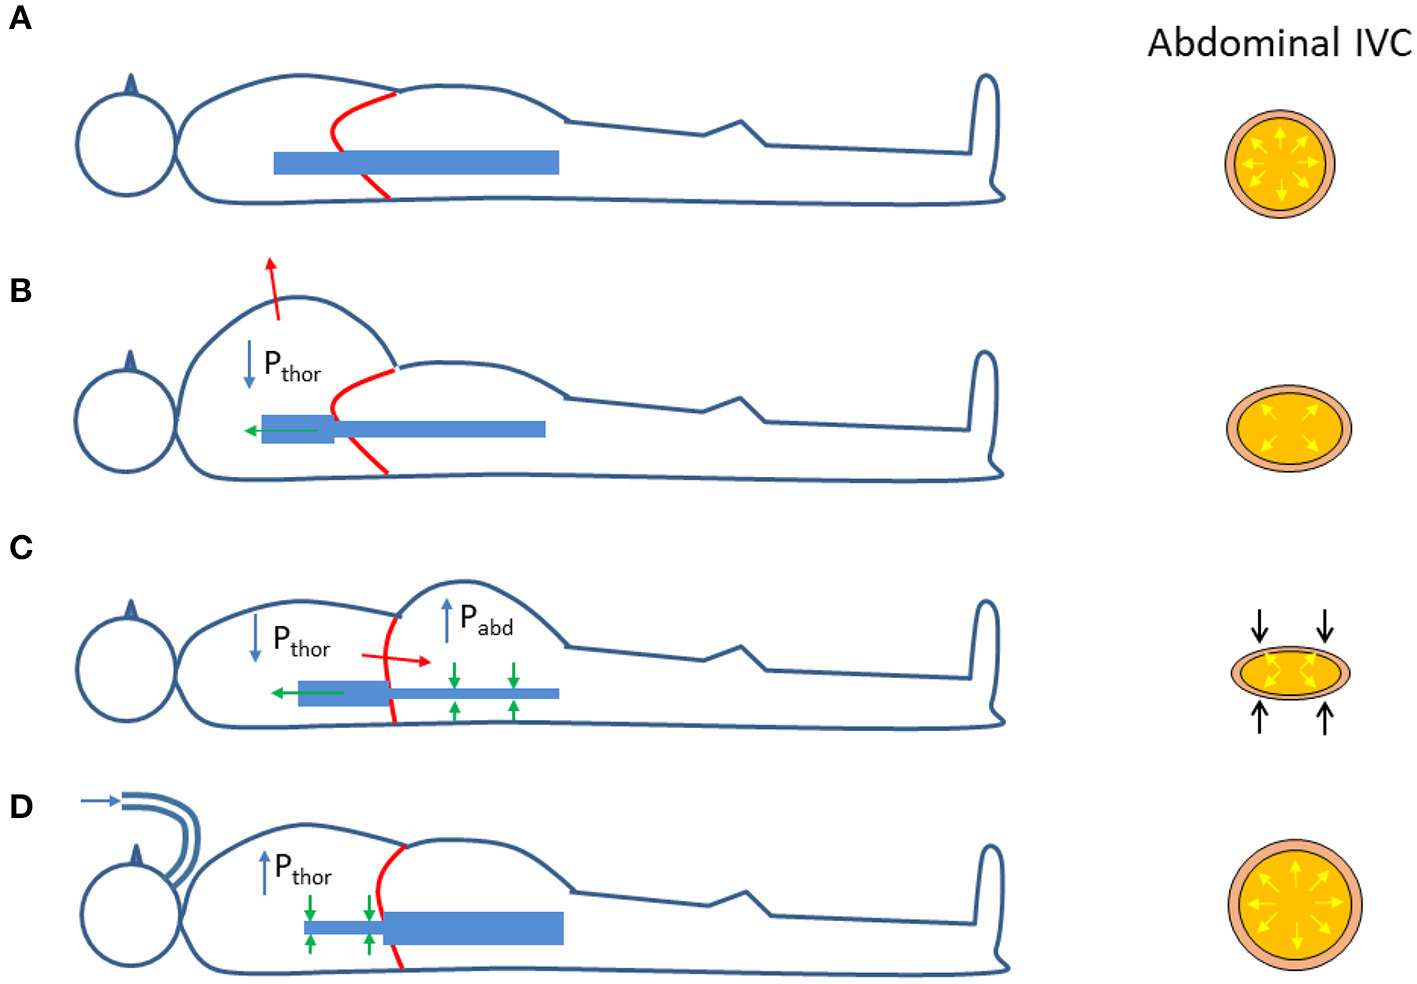
Effects of respiration on the size of the abdominal inferior vena cava (IVC); see explanation in the text. Pthor = Intrathoracic pressure; Pabd = abdominal pressure. (A) Functional residual capacity (end expiration). (B) Thoracic inspiration. (C) Abdominal (diaphragmatic) inspiration. (D) Positive pressure ventilation (inspiration).
Finally, the analysis of phasic changes of the vascular size should take in consideration an additional confounding factor: the extravascular compliance. Since blood vessels are embedded within other organs and tissues, their possibility to expand upon variations in blood pressure depends on the capacity of the extravascular tissues to accommodate such changes. In other words, when measuring vessel volume changes in response to given variations in blood pressure, we are actually assessing the total compliance (Ctot), which accounts for the vascular (Cv) and extravascular (Cev) compliances according to the formula
Ctot resulting smaller than Cv.
In summary, 1) the vessel size depends on Ptm = Pin−Pout, according to a non-linear volume-pressure curve; 2) the vessel compliance (C = ΔV/ΔPtm) generally decreases at increasing Ptm; 3) vessel phasic changes depend on vascular compliance; 4) low extravascular compliance may lead to underestimate actual vessel compliance.
3. Echography Processing
Vessels such as the IVC might have a complex geometry. In particular, as shown in Figure 3, the section of the IVC is not constant along the longitudinal axis and its cross-section is far from being like a perfect circle, with large variations across subjects and clinical conditions. Moreover, IVC is a very compliant vessel whose movements are also affected by surrounding structures to which it can be anchored. Therefore, measuring its size on a single plane might be largely inaccurate (as shown in Figure 4).
Figure 3
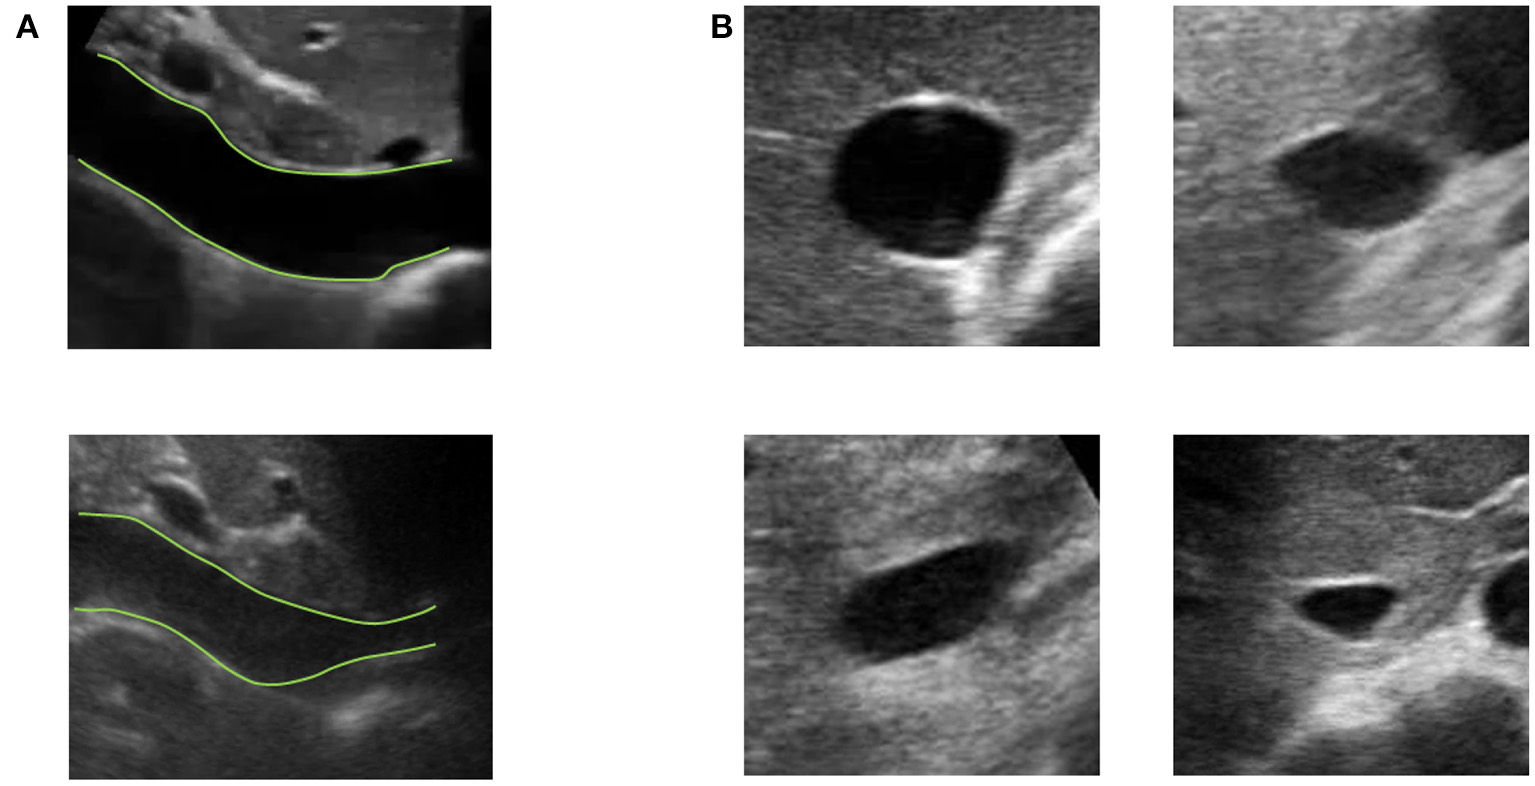
Examples of long and short axis sections of inferior vena cava (IVC) from different subjects. (A) IVC in long axis: one IVC has a stable diameter whereas the other shows great variations along the longitudinal axis. (B) Different shapes of IVC cross-sections.
Figure 4
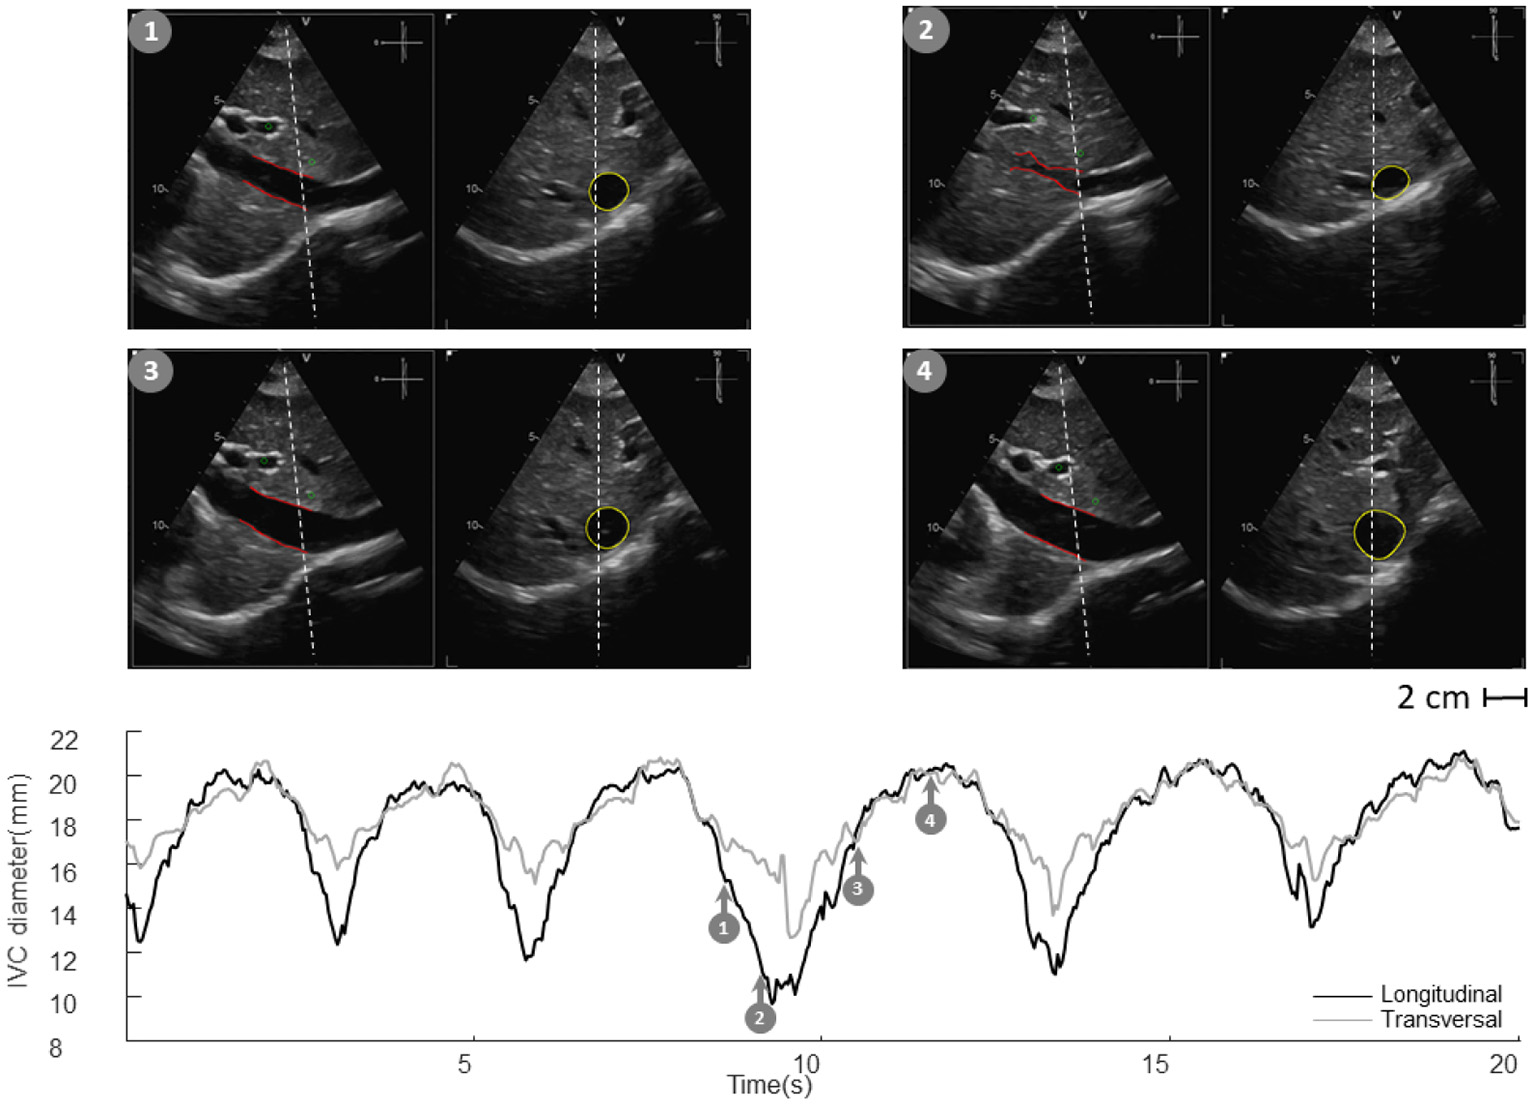
Inferior vena cava (IVC) echography in x-plane. Both long and short axis views are available in synchronous scans. The sections can be displaced with respect to the center of the vessel. Moreover, they could be not orthogonal to the IVC axis. The estimation of the diameter in a single section can be largely affected.
US scans of IVC in B-mode provide limited information on its phasic changes, which occur in a three dimensional space. With our two algorithms we can estimate the IVC edges either in long or short axis views (12, 23).
In long axis, IVC movements are estimated by tracking two reference points selected by the user. Then, the edges are estimated in an entire longitudinal portion of the vessel. The diameters of different sections are then computed in directions orthogonal to the midline of the IVC, thus compensating for possible translations and rotations in the visualized plane (23).
In the case of the short axis view, the contour of the cross-section of the IVC is estimated, finding the edges along different directions starting from its center, identified in the previous frame as the centroid of the vessel border (12).
As the edges of the IVC are estimated in each frame of the US video, a temporal series is acquired, from which different measures of IVC size can be obtained (e.g., different diameters, their average, or the cross-sectional area). In particular, two main contributions are clearly visible in IVC dynamics described by those time series: a slow oscillation of IVC size induced by respiration (due to variations of intrathoracic and abdominal pressure) and another at higher frequency induced by the heartbeats (reflecting retrograde flow induced by right atrial contraction). These two components can be measured separately (respiratory caval index, RCI, and cardiac caval index, CCI) and potentially provide complementary information (4, 8, 12, 23, 24, 26, 34).
Alternative methods to assess phasic changes of vascular size have also been applied or developed by other colleagues (35–37). Specifically, a method widely used in echocardiography is based on tracking the speckle noise (38), i.e., a random mixture of interference patterns and US reflections characterizing each region of the tissue (like as a fingerprint) that is relatively stable on consecutive frames, allowing the region to be traced from one frame to the next. Speckle tracking has been applied to study the IVC deformation in long axis view (36) or to assess aortic or carotid stiffness (39, 40). Different processing techniques have also been used to segment blood vessels: for example, Otsu's thresholding (41) was combined with active contour on multiple short axis views to estimate the carotid in 3D (42); a semi-automated modified watershed method was applied to estimate the cross-section of IVC (43); snake and template matching (the latter approach, similar to speckle tracking) were tested for IVC edge detection in short axis (44); a novel energy functional for polar active contour was applied to the segmentation of IVC in short axis (45). More recently, deep learning approaches have been applied on the segmentation of IVC in short axis, obtaining moderately good performances in predicting fluid responsiveness (46). Edge-tracking methodology might exhibit a good compromise between computational cost and accuracy (12). We are currently working on the real time implementation and rendering over the US scan of the estimated vascular edges: this can provide the operators with visual feedback and guidance to obtain and acquire good quality images; moreover, the simultaneous measurement of quantitative indexes (e.g., mean diameter and pulsatility indexes) might be a valuable add-on for research and routine clinical practice.
4. Current and Future Applications
Our methods have been applied in two pilot studies, to estimate the RAP (24, 34) and volume status (26). Representative examples are shown in Figures 5, 6.
Figure 5
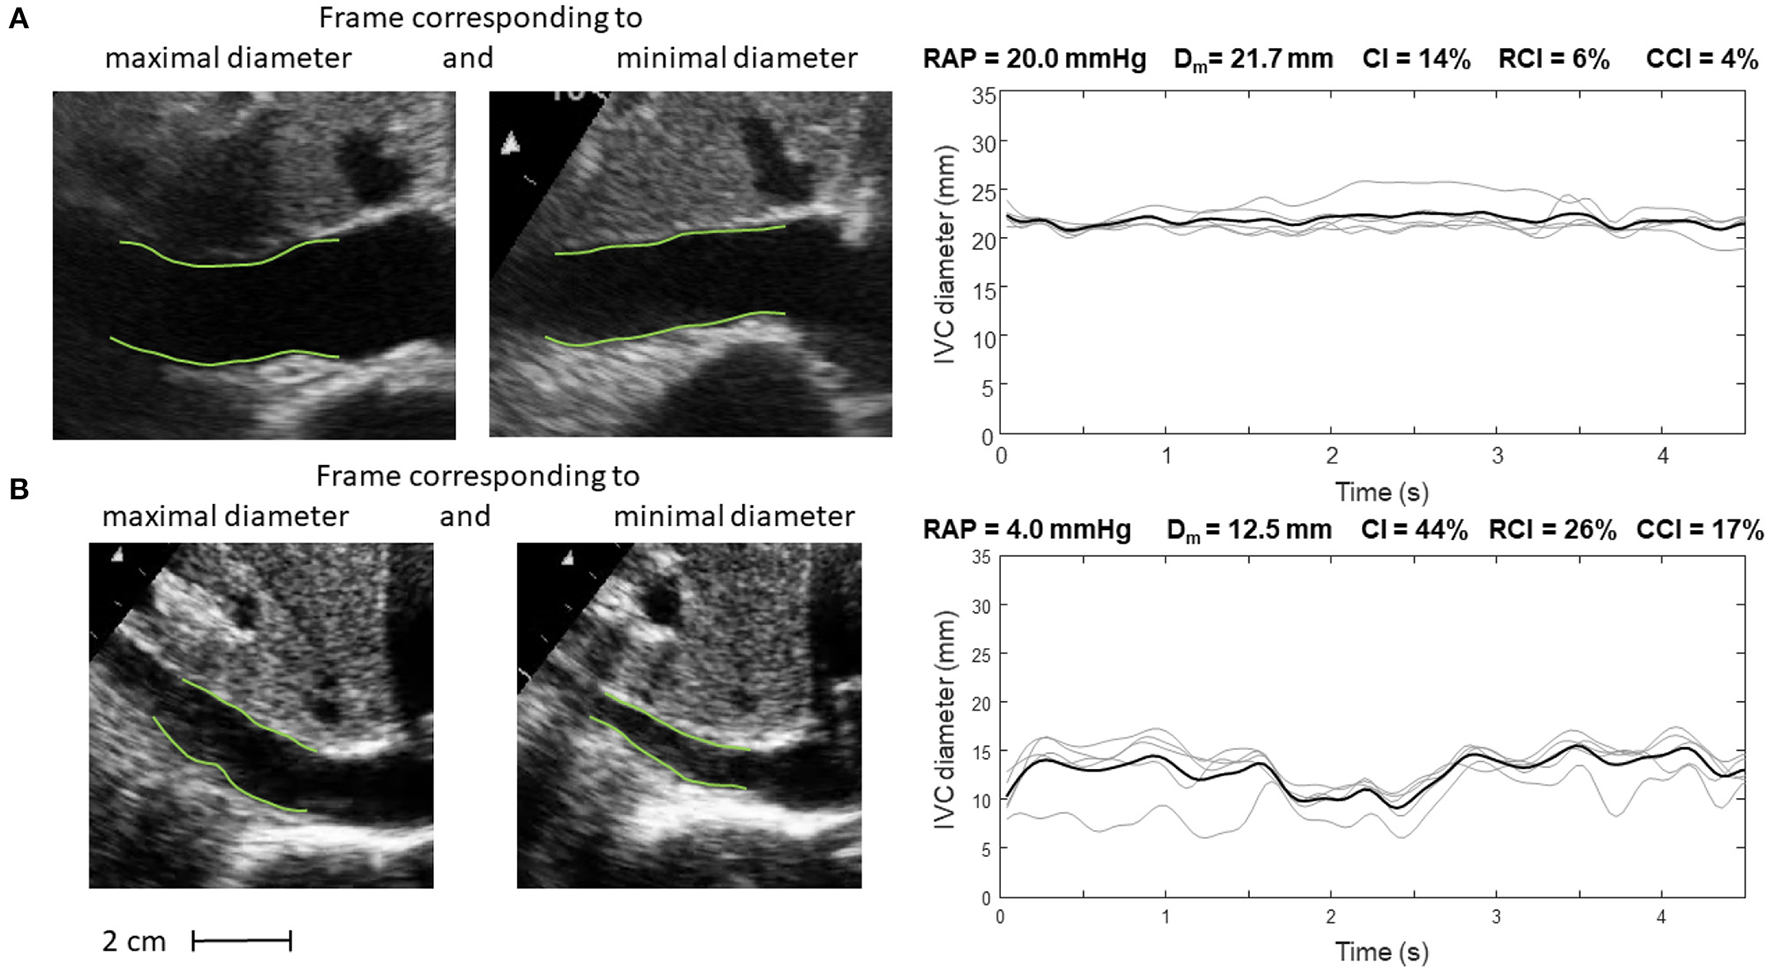
Inferior vena cava (IVC) dynamics in patients with different right atrial pressure (RAP, measured invasively). (A) Patient with high RAP. (B) Patient with low RAP. Abbreviations used: average diameter Dm, caval index CI, respiratory caval index RCI, cardiac caval index CCI.
Figure 6
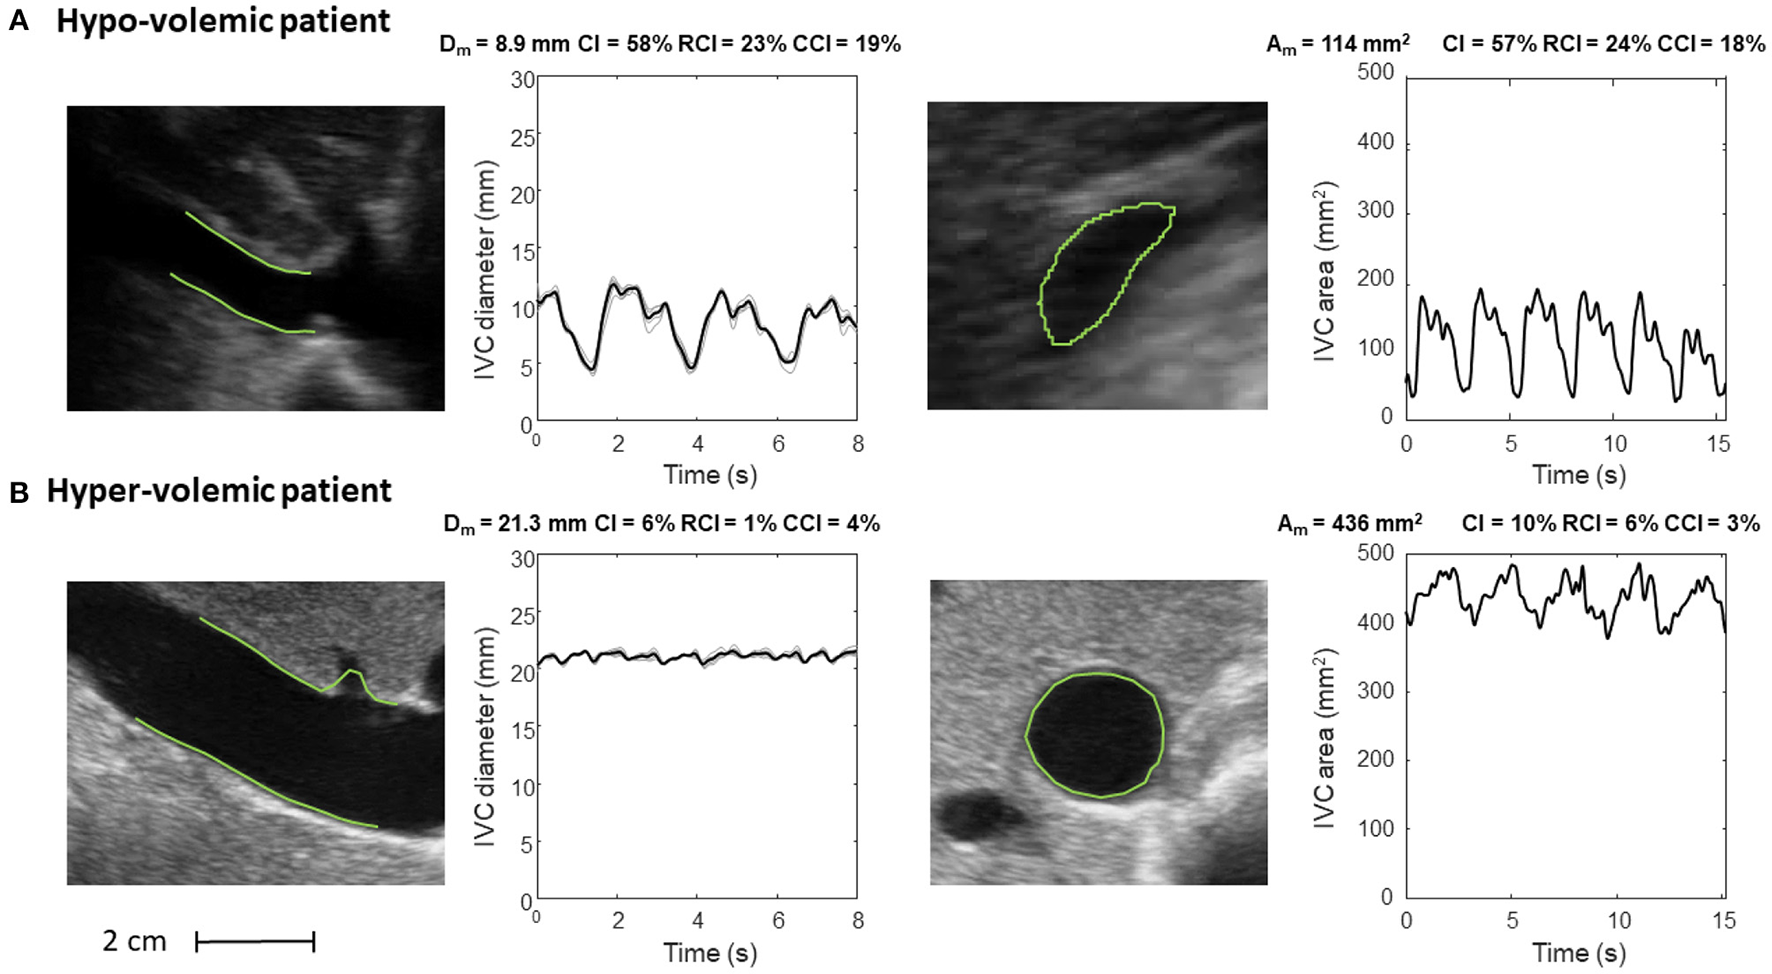
Inferior vena cava (IVC) dynamics in patients with different volume status. (A) Hypo-volemic patient. (B) Hyper-volemic patient. Abbreviations used: average diameter Dm, average cross-sectional area Am, caval index CI, respiratory caval index RCI, cardiac caval index CCI.
Specifically, Figure 5 shows frames corresponding to maximal and minimal IVC size for two patients, with invasively measured high (A) and low (B) RAP, respectively. The average size of IVC is larger in the patient with higher RAP (20 mmHg) and the IVC phasic changes are greater for the patient with lower RAP (4 mmHg): in the latter case, small variations of transmural pressure induce large changes of size in the vessel.
Figure 6 shows the long and short axis of the IVC in a hypo- (Figure 6A) and hyper- (Figure 6B) volemic patient, respectively. Compared to patients with hypervolemia, in those with hypovolemia the IVC size is smaller and the pulsatility is larger; moreover, the IVC in the cross-section view has a flattened shape, whereas it is mostly circular in conditions of fluid overload.
In addition, the features offered by the automated algorithms (i.e., size and indexes of pulsatility of the blood vessel of interest) open the way to new applications. We here briefly overview those that are of particular interest to the authors, i.e., specific studies or applications that have recently been attempted and are close to completion or that belong to the author's different working fields in basic and clinical sciences and that will be addressed in the near future. These existing and potential application of the methodology are presented in Table 1, but many other applications may possibly be envisaged.
Table 1
| Current evaluation | Potential clinical relevance |
|---|---|
| Tracking of IVC movements and | Assessment of volemic status |
| phasic deformation, longitudinally | Estimation of right atrial pressure |
| or cross-sectionally | Assessment of venous compliance and fluid redistribution |
| Tracking of peripheral veins deformation | Monitoring responses during renal dialysis, to diuretics or a fluid challenge |
| Tracking of arterial phasic deformation, longitudinally or | Evaluation of arterial stiffness |
| cross-sectionally | Assessment of cardiovascular health |
Current evaluation and potential clinical relevance of image-processing algorithms applied to vascular ultrasound.
Edge tracking algorithms can be applied to peripheral veins to investigate, by ultrasound, the mechanical response to changes in transmural pressure, e.g., by venous occlusion, for the assessment of venous compliance (47, 48) and characterize the filling condition and the expanding capacity of the peripheral reservoir, a major pathway for venous return. Assessment of venous compliance could also be used to validate another recently proposed index of peripheral vascular filling, the venous pulse wave velocity (49, 50). Combining these methods with the IVC assessment might increase the understanding of the underlying mechanisms of fluid distribution and displacements across different body regions and compartments in various clinical contexts (28, 29).
In this respect, an interesting model of acute fluid redistribution is offered by the MuVIT technique (51), a procedure used to transiently lower aortic blood flow and pressure during thoracic or abdominal vascular interventions (e.g., stent graft placements) consisting in transiently increasing alveolar pressure up to about 30 mmHg. This maneuver provokes a substantial blood volume displacement from the pulmonary and arterial compartments to the systemic venous compartment resulting in a transient venous congestion. The possibility of simultaneous tracking size changes of abdominal and peripheral veins may help to characterize the dynamic behavior of the full venous compartment.
Fluid overload, or congestion, is a key clinical feature in acute heart failure, but its management with diuretic is still very subjective (52). Controversial results have been documented in the literature about the potential utility of IVC diameter and distensibility to monitor the response to diuretics in patients with acute heart failure (53, 54). Quantifying with precision phasic IVC changes might potentially detect even small variations in intravascular fluids and possibly guide clinicians for a more objective use of diuretic therapy.
Similar considerations apply to renal failure patients undergoing dialysis, whereby automated continuous and unsupervised IVC monitoring may help to tailor the dialytic process according to the current volume status of the patient.
The possibility to detect a cardiac pulsatility of IVC in addition to the major oscillatory component of respiratory origin is still largely unexplored and many questions have to be addressed. May the cardiac pulsatility provide a more reliable index of IVC collapsibility than the classical caval index? Is cardiac pulsatility carrying additional or different information than respiratory phasic variations? Long term monitoring and correlation analysis of these oscillatory components as well as extending the investigation to specific patient groups is necessary to address these questions.
Finally, a relevant application concerns the assessment of arterial stiffness. Aortic stiffness is associated with incident cardiovascular events. In clinical practice, aortic stiffness is usually investigated indirectly in terms of the PWV. However, the PWV is usually measured from the carotid-femoral artery PWV, a global index, which does not reflect local stiffness variations. In theory, aortic stiffness could be estimated directly, by measuring with US the aorta pulsatility under a known pressure variation (systo-diastolic) (55), in different aortic segments (56). Whether segmental aortic stiffness measured by US might discriminate different patients' conditions and risk, it is worth exploring.
5. Conclusions
Rapid advances in US image processing have made now possible to obtain more objective information on the size of arteries and veins, but also to quantify their phasic changes with more precision, which can transform management of several conditions and potentially improve outcomes.
6. Patents
An instrument implementing the algorithms for IVC delineation used in this paper was patented by Politecnico di Torino and Universitá di Torino (WO 2018/134726).
Funding
Supported by the Italian Ministry of Economic Development through the Proof of Concept (PoC-Off) project Vein Image Processing for Edge Rendering–VIPER (CUP C16I20000080006).
Publisher's Note
All claims expressed in this article are solely those of the authors and do not necessarily represent those of their affiliated organizations, or those of the publisher, the editors and the reviewers. Any product that may be evaluated in this article, or claim that may be made by its manufacturer, is not guaranteed or endorsed by the publisher.
Statements
Author contributions
LM, SA, and SR: methodology and writing–original draft preparation. LM and PPo: software. SA, SR, PPa, MP, and LE: data preparation. LM, SR, and PPo: visualization. MP, GS, PPe, FA-C, and SR: supervision. All authors conceptualization, writing–review, editing, read, and agreed to the published version of the manuscript.
Conflict of interest
RB was employed by company Chirurgia Generale e Trauma Team GOM Niguarda. The remaining authors declare that the research was conducted in the absence of any commercial or financial relationships that could be construed as a potential conflict of interest.
References
1.
PellicoriPClarkALKallvikbacka-BennettAZhangJUrbinatiAMonzoLet al. Non-invasive measurement of right atrial pressure by near-infrared spectroscopy: preliminary experience. A report from the SICA-HF study. Eur J Heart Fail. (2017) 19:883–92. 10.1002/ejhf.825
2.
LangRMBadanoLPMor-AviVAfilaloJArmstrongAErnandeLet al. Recommendations for cardiac chamber quantification by echocardiography in adults: an update from the American Society of Echocardiography and the European Association of Cardiovascular Imaging. J Am Soc Echocardiogr. (2015) 28:1–39.e14. 10.1016/j.echo.2014.10.003
3.
PonikowskiPVoorsAAAnkerSDBuenoHClelandJGCoatsAJet al. 2016 ESC Guidelines for the diagnosis treatment of acute chronic heart failure: The Task Force for the diagnosis treatment of acute chronic heart failure of the European Society of Cardiology (ESC). Developed with the special contribution of the Heart Failure Association (HFA) of the ESC. Eur J Heart Fail. (2016). 18:891–975. 10.1002/ejhf.592
4.
MesinLPasqueroPAlbaniSPortaMRoattaS. Semi-automated tracking and continuous monitoring of inferior vena cava diameter in simulated and experimental ultrasound imaging. Ultrasound Med Biol. (2015) 41:845–57. 10.1016/j.ultrasmedbio.2014.09.031
5.
WallaceDJAllisonMStoneMB. Inferior vena cava percentage collapse during respiration is affected by the sampling location: an ultrasound study in healthy volunteers. Acad Emerg Med. (2010) 17:96–9. 10.1111/j.1553-2712.2009.00627.x
6.
BarbierCLoubieresYSchmitCHayonJRicomeJLJardinFet al. Respiratory changes in inferior vena cava diameter are helpful in predicting fluid responsiveness in ventilated septic patients. Intensive Care Med. (2004) 30:1740–6. 10.1007/s00134-004-2259-8
7.
BleharDJDickmanEGaspariR. Identification of congestive heart failure via respiratory variation of inferior vena cava diameter. Am J Emerg Med. (2009) 27:71–5. 10.1016/j.ajem.2008.01.002
8.
MesinLGiovinazzoTD'AlessandroSRoattaSRavioloAChiacchiariniFet al. Improved repeatability of the estimation of pulsatility of inferior vena cava. Ultrasound Med Biol. (2019) 45:2830–43. 10.1016/j.ultrasmedbio.2019.06.002
9.
CorlKAAzabNNayeemuddinMSchickALopardoTZebaFet al. Performance of a 25% inferior vena cava collapsibility in detecting fluid responsiveness when assessed by novice versus expert physician sonologists. J Intensive Care Med. (2020) 35:1520–8. 10.1177/0885066619881123
10.
TownsendRRWilkinsonIBSchiffrinELAvolioAPChirinosJACockcroftJRet al. Recommendations for improving and standardizing vascular research on arterial stiffness: a scientific statement from the American Heart Association. Hypertension. (2015) 66:698–722. 10.1161/HYP.0000000000000033
11.
BleharDResopDChinBDaynoMGaspariR. Inferior vena cava displacement during respirophasic ultrasound imaging. Crit Ultrasound J. (2012) 4:1–5. 10.1186/2036-7902-4-18
12.
MesinLPasqueroPRoattaS. Multi-directional assessment of respiratory and cardiac pulsatility of the inferior vena cava from ultrasound imaging in short axis. Ultrasound Med Biol. (2020) 46:3475–82. 10.1016/j.ultrasmedbio.2020.08.027
13.
OrsoDPaoliIPianiTCilentiFLCristianiLGuglielmoN. Accuracy of ultrasonographic measurements of inferior vena cava to determine fluid responsiveness: a systematic review and meta-analysis. J Intensive Care Med. (2020) 35:354–63. 10.1177/0885066617752308
14.
BouzatPWaltherGRuppTLevyP. Inferior vena cava diameter may be misleading in detecting central venous pressure elevation induced by acute pulmonary hypertension. Am J Respir Crit Care Med. (2014) 190:233–5. 10.1164/rccm.201403-0488LE
15.
MagninoCOmedéPAvenattiEPresuttiDIannacconeAChiarloMet al. Inaccuracy of right atrial pressure estimates through inferior vena cava indices. Am J Cardiol. (2017) 120:1667–73. 10.1016/j.amjcard.2017.07.069
16.
ThalhammerCAschwandenMOdermattABaumannUAImfeldSBilecenDet al. Noninvasive central venous pressure measurement by controlled compression sonography at the forearm. J Am Coll Cardiol. (2007) 50:1584–9. 10.1016/j.jacc.2007.07.022
17.
PellicoriPKallvikbacka-BennettADierckxRZhangJPutzuPCuthbertJet al. Prognostic significance of ultrasound-assessed jugular vein distensibility in heart failure. Heart. (2015) 101:1149–58. 10.1136/heartjnl-2015-307558
18.
PellicoriPKallvikbacka-BennettAZhangJKhalevaOWardenJClarkALet al. Revisiting a classical clinical sign: jugular venous ultrasound. Int J Cardiol. (2014) 170:364–70. 10.1016/j.ijcard.2013.11.015
19.
LaurentSCockcroftJVan BortelLBoutouyriePGiannattasioCHayozDet al. Expert consensus document on arterial stiffness: methodological issues and clinical applications. Eur Heart J. (2006) 27:2588–605. 10.1093/eurheartj/ehl254
20.
Ben-ShlomoYSpearsMBoustredCMayMAndersonSGBenjaminEJet al. Aortic pulse wave velocity improves cardiovascular event prediction: an individual participant meta-analysis of prospective observational data from 17,635 subjects. J Ame Coll Cardiol. (2014) 63:636–46. 10.1016/j.jacc.2013.09.063
21.
SalviPScaliseFRovinaMMorettiFSalviLGrilloAet al. Noninvasive estimation of aortic stiffness through different approaches: comparison with intra-aortic recordings. Hypertension. (2019) 74:117–29. 10.1161/HYPERTENSIONAHA.119.12853
22.
HicksonSSButlinMGravesMTavianiVAvolioAPMcEnieryCMet al. The relationship of age with regional aortic stiffness and diameter. JACC Cardiovasc Imaging. (2010) 3:1247–55. 10.1016/j.jcmg.2010.09.016
23.
MesinLPasqueroPRoattaS. Tracking and monitoring pulsatility of a portion of inferior vena cava from ultrasound imaging in long axis. Ultrasound Med Biol. (2019) 45:1338–43. 10.1016/j.ultrasmedbio.2018.10.024
24.
AlbaniSPinamontiBGiovinazzoTde ScordilliMFabrisEStolfoDet al. Accuracy of right atrial pressure estimation using a multi-parameter approach derived from inferior vena cava semi-automated edge-tracking echocardiography: a pilot study in patients with cardiovascular disorders. Int J Cardiovasc Imaging. (2020) 36:1213–25. 10.1007/s10554-020-01814-8
25.
MontiJ. Revolution or evolution? A proposal for the integration of point-of-care ultrasound into physician assistant clinical practice. J Physician Assist Educ. (2017) 28:127–32. 10.1097/JPA.0000000000000101
26.
MesinLPasqueroPRoattaSPortaM. Automated volume status assessment using inferior vena cava pulsatility. Electronics. (2020) 9:1671. 10.3390/electronics9101671
27.
LaurentSBoutouyriePAsmarRGautierILalouxBGuizeLet al. Aortic stiffness is an independent predictor of all-cause and cardiovascular mortality in hypertensive patients. Hypertension. (2001) 37:1236–41. 10.1161/01.HYP.37.5.1236
28.
BrengelmannGL. Venous return and the physical connection between distribution of segmental pressures and volumes. Am J Physiol Heart Circ Physiol. (2019) 317:H939–53. 10.1152/ajpheart.00381.2019
29.
GelmanS. Venous function and central venous pressure: a physiologic story. Anesthesiology. (2008) 108:735–48. 10.1097/ALN.0b013e3181672607
30.
GualaACamporealeCRidolfiLMesinL. Non-invasive aortic systolic pressure and pulse wave velocity estimation in a primary care setting: an in silico study. Med Eng Phys. (2017) 42:91–98. 10.1016/j.medengphy.2017.02.007
31.
Van BortelLMKoolMJBoudierHAStruijker BoudierHA. Effects of antihypertensive agents on local arterial distensibility and compliance. Hypertension. (1995) 26:531–4. 10.1161/01.HYP.26.3.531
32.
KimuraBDalugduganRGilcreaseGPhanJShowalterBWolfsonT. The effect of breathing manner on inferior vena caval diameter. Eur J Echocardiogr. (2011) 12:120–3. 10.1093/ejechocard/jeq157
33.
FolinoABenzoMPasqueroPLaguzziAMesin A LMesserePortaMet al. Vena cava responsiveness to controlled isovolumetric respiratory efforts. J Ultrasound Med. (2017) 36:2113–23. 10.1002/jum.14235
34.
MesinLAlbaniSSinagraG. Non-invasive estimation of right atrial pressure using the pulsatility of inferior vena cava. Ultrasound Med Biol. (2019) 45:1331–7. 10.1016/j.ultrasmedbio.2018.12.013
35.
NakamuraKQianKAndoTInokuchiRDoiKKobayashiEet al. Cardiac variation of internal jugular vein for the evaluation of hemodynamics. Ultrasound Med Biol. (2016) 42:1764–70. 10.1016/j.ultrasmedbio.2016.03.003
36.
SonooTNakamuraKAndoTSenKMaedaAKobayashiEet al. Prospective analysis of cardiac collapsibility of inferior vena cava using ultrasonography. J Crit Care. (2015) 30:945–8. 10.1016/j.jcrc.2015.04.124
37.
TokunagaKNakamuraKInokuchiRHayaseNTeradaRTomiokaYet al. Cardiac variation of internal jugular vein as a marker of volume change in hemorrhagic shock. Shock. (2020) 54:717–22. 10.1097/SHK.0000000000001548
38.
OleynikovVEGalimskayaVAKupriyanovaSNBurkoNV. Use of the speckle tracking method for determining global parameters of heart contractility in healthy individuals. MethodsX. (2018) 5:125–35. 10.1016/j.mex.2018.01.011
39.
BiesevicieneMVaskelyteJJMizarieneVKaraliuteRLesauskaiteVVerseckaiteR. Two-dimensional speckle-tracking echocardiography for evaluation of dilative ascending aorta biomechanics. BMC Cardiovasc Disord. (2017) 17:27. 10.1186/s12872-016-0434-9
40.
YangEYDokainishHViraniSSMisraAPritchettAMLakkisNet al. Segmental analysis of carotid arterial strain using speckle-tracking. J Am Soc Echocardiogr. (2011) 24:1276–1284. 10.1016/j.echo.2011.08.002
41.
OtsuN. A threshold selection method from gray-level histograms. IEEE Trans Syst Man Cybern. (1979) 9:62–6. 10.1109/TSMC.1979.4310076
42.
de RuijterJvan SambeekMvan de VosseFLopataR. Automated 3D geometry segmentation of the healthy and diseased carotid artery in free-hand, probe tracked ultrasound images. Med Phys. (2020) 47:1034–47. 10.1002/mp.13960
43.
BellowsSSmithJMcguirePSmithA. Validation of a computerized technique for automatically tracking and measuring the inferior vena cava in ultrasound imagery. Stud Health Technol Inform. (2014) 207:183–92. 10.3233/978-1-61499-474-9-183
44.
NakamuraKTomidaMAndoTSenKInokuchiRKobayashiEet al. Cardiac variation of inferior vena cava: new concept in the evaluation of intravascular blood volume. J Med Ultrason. (2013) 40:205–9. 10.1007/s10396-013-0435-6
45.
KaramiEM S ShehataMSSmithA. Estimation and tracking of AP-diameter of the inferior vena cava in ultrasound images using a novel active circle algorithm. Comput Biol Med. (2018) 98:16–25. 10.1016/j.compbiomed.2018.05.001
46.
BlaivasMBlaivasLPhilipsGMerchantRLevyMAbbasiAet al. Development of a deep learning network to classify inferior vena cava collapse to predict fluid responsiveness. J Ultrasound Med. (2021) 40:1495–504. 10.1002/jum.15527
47.
de GrootPCBleekerMWHopmanMT. Ultrasound: a reproducible method to measure conduit vein compliance. J Appl Physiol. (2005) 98:1878–83. 10.1152/japplphysiol.01166.2004
48.
LeinanIMAamotILStoylenAKarlsenTWisloffU. Upper arm venous compliance and fitness in stable coronary artery disease patients and healthy controls. Clin Physiol Funct Imaging. (2017) 37:498–506. 10.1111/cpf.12324
49.
ErminiLChiarelloNEDe BenedictisCFerraresiCRoattaS. Venous pulse wave velocity variation in response to a simulated fluid challenge in healthy subjects. Biomed Signal Proc Control. (2021) 63:102177. 10.1016/j.bspc.2020.102177
50.
ErminiLFerraresiCDe BenedictisCRoattaS. Objective assessment of venous pulse wave velocity in healthy humans. Ultrasound Med Biol. (2020) 46:849–54. 10.1016/j.ultrasmedbio.2019.11.003
51.
TsilimparisNAbichtJMStanaJKonstantinouNRantnerBBanafscheRet al. The munich valsalva implantation technique (MuVIT) for cardiac output reduction during TEVAR: vena cava occlusion with the valsalva maneuver. J Endovasc Ther. (2021) 28:7–13. 10.1177/1526602820961376
52.
PellicoriPClelandJGZhangJKallvikbacka-BennettAUrbinatiAShahPet al. Cardiac dysfunction, congestion and loop diuretics: their relationship to prognosis in heart failure. Cardiovasc Drugs Ther. (2016) 30:599–609. 10.1007/s10557-016-6697-7
53.
MillerWLLoboRGrillDEMullanBP. Diuresis-related weight loss reflects interstitial compartment decongestion with minimal impact on intravascular volume expansion or outcomes in post-acute heart failure: metrics of decongestion and volume status. J Card Fail. (2021) 27:445–52. 10.1016/j.cardfail.2020.12.006
54.
PellicoriPShahPCuthbertJUrbinatiAZhangJKallvikbacka-BennettAet al. Prevalence, pattern and clinical relevance of ultrasound indices of congestion in outpatients with heart failure. Eur J Heart Fail. (2019) 21:904–16. 10.1002/ejhf.1383
55.
KuoMMBarodkaVAbrahamTPSteppanJShoukasAAButlinMet al. Measuring ascending aortic stiffness in vivo in mice using ultrasound. J Vis Exp. (2014) 94:52200. 10.3791/52200
56.
Antonini-CanterinFPepeAStrazzantiMRivabenDNicolosiEPaglianiLet al. P1830 Single-beat aortic arch pulse wave velocity by dual-gate simultaneous Doppler technique: a novel method for arterial stiffness evaluation. Eur Heart J Cardiovasc Imaging. (2020) 21:jez319.1173. 10.1093/ehjci/jez319.1173
Summary
Keywords
inferior vena cava, arterial stiffness, ultrasound imaging, pulsatility, fluid volume assessment, right atrial pressure
Citation
Mesin L, Albani S, Policastro P, Pasquero P, Porta M, Melchiorri C, Leonardi G, Albera C, Scacciatella P, Pellicori P, Stolfo D, Grillo A, Fabris B, Bini R, Giannoni A, Pepe A, Ermini L, Seddone S, Sinagra G, Antonini-Canterin F and Roatta S (2022) Assessment of Phasic Changes of Vascular Size by Automated Edge Tracking-State of the Art and Clinical Perspectives. Front. Cardiovasc. Med. 8:775635. doi: 10.3389/fcvm.2021.775635
Received
14 September 2021
Accepted
14 December 2021
Published
21 January 2022
Volume
8 - 2021
Edited by
Stefania Paolillo, University of Naples Federico II, Italy
Reviewed by
Arturo Cesaro, University of Campania Luigi Vanvitelli, Italy; Elisabetta Salvioni, Monzino Cardiology Center, Scientific Institute for Research, Hospitalization and Healthcare (IRCCS), Italy
Updates
Copyright
© 2022 Mesin, Albani, Policastro, Pasquero, Porta, Melchiorri, Leonardi, Albera, Scacciatella, Pellicori, Stolfo, Grillo, Fabris, Bini, Giannoni, Pepe, Ermini, Seddone, Sinagra, Antonini-Canterin and Roatta.
This is an open-access article distributed under the terms of the Creative Commons Attribution License (CC BY). The use, distribution or reproduction in other forums is permitted, provided the original author(s) and the copyright owner(s) are credited and that the original publication in this journal is cited, in accordance with accepted academic practice. No use, distribution or reproduction is permitted which does not comply with these terms.
*Correspondence: Luca Mesin luca.mesin@polito.it
This article was submitted to Heart Failure and Transplantation, a section of the journal Frontiers in Cardiovascular Medicine
Disclaimer
All claims expressed in this article are solely those of the authors and do not necessarily represent those of their affiliated organizations, or those of the publisher, the editors and the reviewers. Any product that may be evaluated in this article or claim that may be made by its manufacturer is not guaranteed or endorsed by the publisher.