Abstract
Echocardiography is frequently used to evaluate cardiac function in rodent models of cardiovascular disease. Whereas methods to acquire the commonly used echocardiography parameters are well-described in published protocols or manuals, many important parameters are ill-defined and often open to subjective interpretation. Such lack of uniformity has engendered conflicting interpretations of the same parameters in published literature. In particular, parameters such as mitral regurgitation, mitral stenosis, pulmonary regurgitation, and aortic regurgitation that are required to define more esoteric etiologies in rarer mouse models often remain equivocal. The aim of this methods paper is to provide a practical guide to the acquisition and interpretation of infrequently used echocardiography parameters and set a framework for comprehensive analyses of right ventricle (RV), pulmonary artery (PA) pulmonary valve (PV), left atrium (LA), mitral valve (MV), and aortic valve (AoV) structure and function.
1 Introduction
Echocardiography is a non-invasive imaging modality and a pillar of preclinical cardiovascular research. Rodent models for human disease are routinely analyzed via a common set of parameters that are limited to <30% of those possible from modern echocardiographic instrumentation. The remaining ∼70% of parameters that are often essential for comprehensive and accurate characterization of murine cardiovascular pathology have not to our knowledge been formally standardized and the relevant procedures are absent from current protocols and manuals of rodent echocardiographic imaging technology. While there are examples of uncommon parameters being acquired to expand on a pathology, details of the acquisition procedures used for such parameter is often lacking. Here we provide an easily accessible protocol of infrequently used views and parameters that will allow for more complete analyses of the right ventricle (RV), pulmonary artery (PA), pulmonary valve (PV), left atrium (LA), mitral valve (MV), and aortic valve (AoV).
2 Materials and equipment
The images acquired in this paper were captured using Vevo 2100 and 3100 imaging systems and analysis with Vevo Lab, however, the methods described may be applicable to other multi-modal imaging systems.
2.1 Methods
Cardiac function and morphology were assessed using either Vevo 2100 or 3100 imaging systems with a high frequency transducer probe MS400 (VisualSonics, Toronto, ON, Canada). The anterior chest and abdomen of mice were depilated using Nair depilatory cream (Church and Dwight Co., Ewing, NJ, USA) 1 day before experiments (1). On the day of image acquisition, mice were anesthetized with 2.5–3.0% isoflurane at 0.8 L/min flow rate and maintained with 1–1.5% isoflurane (1). After anesthesia, mice were restrained in a supine position on a pad with heater, temperature sensor and ECG electrodes (1). Temperature and heart rate were maintained at 37°C and maximum of 500 beats per minute, respectively (1, 2).
2.1.1 Parasternal long axis view
To obtain parasternal long axis (PLAX) views, the mouse is placed in a supine position with the right side of the platform inclined at 45° counterclockwise (Figure 1A), and the transducer probe placed in the rail system oriented diagonally 30–40° clockwise from the right upper extremity to the left abdomen.
FIGURE 1
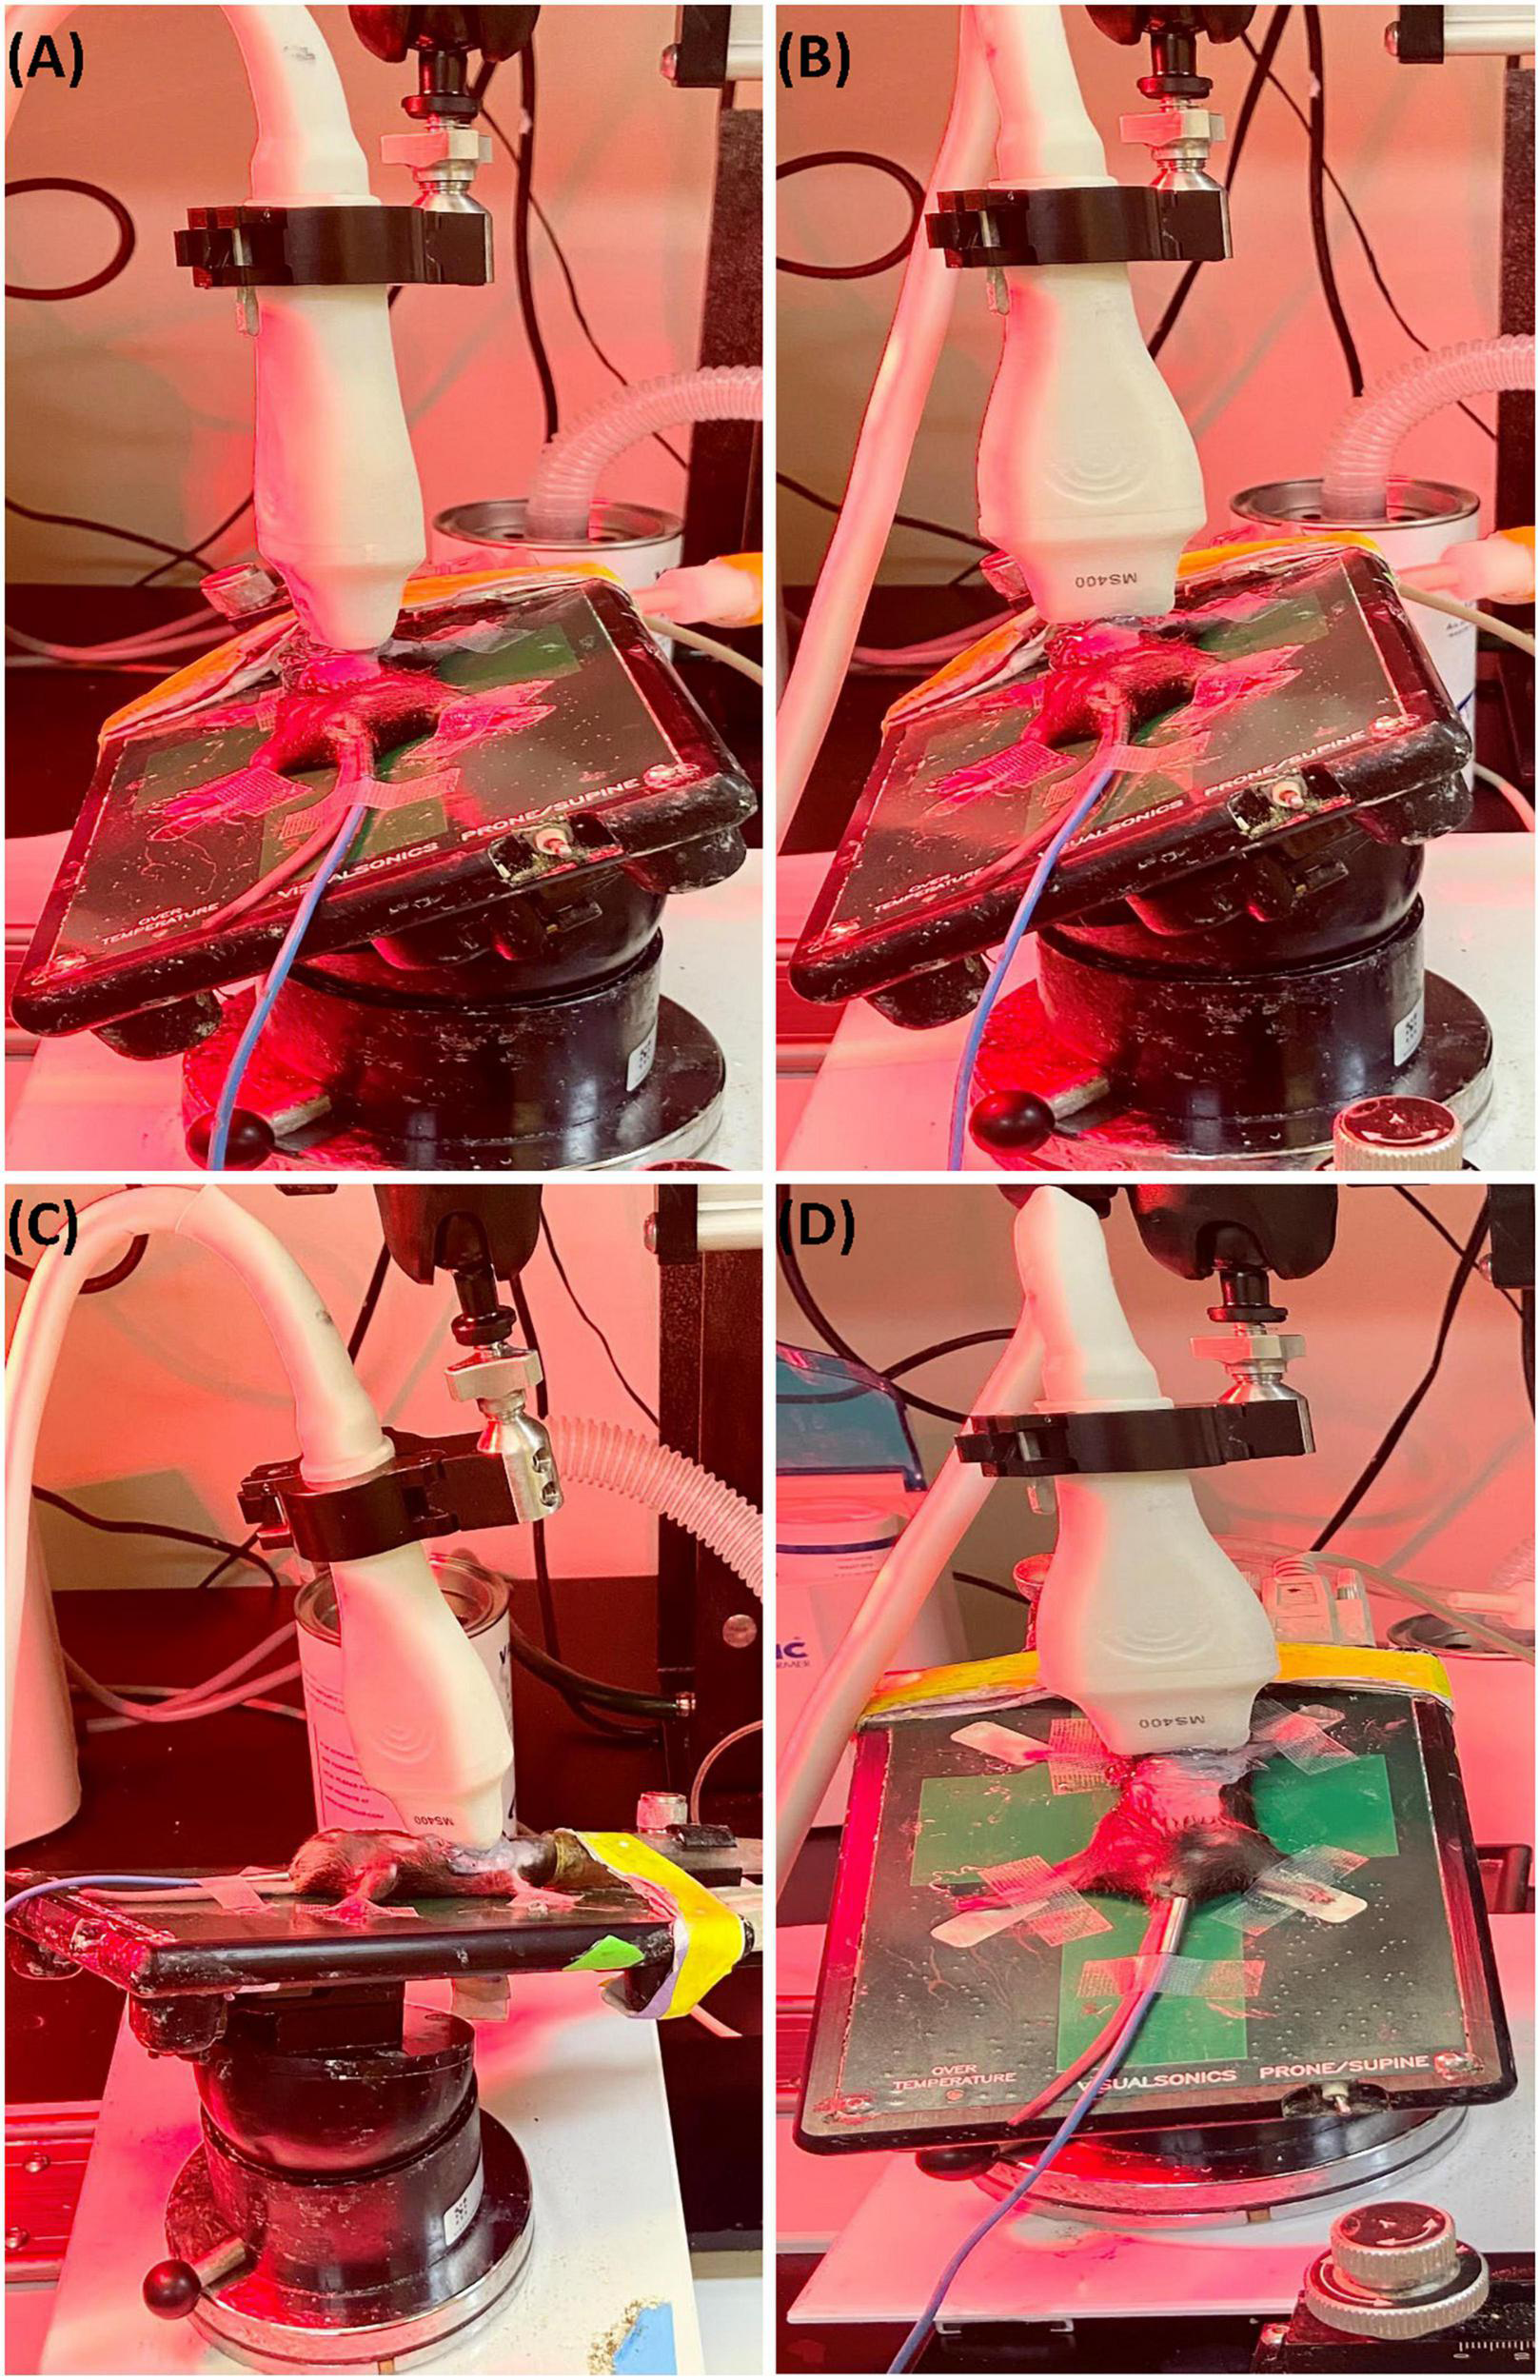
(A) Representative image showing probe positioning to obtain parasternal long axis (PLAX) views. (B) Parasternal short axis (PSAX) views are derived from the PLAX view by rotating the transducer probe in the rail system to approximately 90° clockwise. (C) To obtain apical views, the transducer probe is placed diagonally toward the head. (D) Views of the aorta can be acquired by shifting the transducer probe from the PSAX view cranially to the level of the aortic valve.
2.1.2 Parasternal short axis view
The parasternal short axis view (PSAX) is derived from the PLAX view by rotating the transducer probe in the rail system to approximately 90° clockwise (Figure 1B).
2.1.3 Apical view
To obtain apical views, the platform is placed slightly lateral with the head of the mouse pointing to the left, and the right upper side of the platform positioned 30° counterclockwise. The transducer probe is placed diagonally oriented toward the head (Figure 1C).
2.1.4 Aorta
With the anterior portion of the platform tilted 45° superiorly and slightly to the left, the transducer probe is shifted from the PSAX view cranially to the level of the aortic valve (Figure 1D).
2.2 Right-sided parameters
2.2.1 Right ventricle
Right-sided heart assessment is important for evaluating right heart failure (RHF) and pulmonary hypertension in rodent models, but the possible methodologies are underused in mice despite the availability of clinical guidelines for such imaging (2). Higher frequency, higher resolution, and smaller transducers have permitted advancement of RV imaging in mice despite difficulties related to the morphology and retrosternal position of the RV (2, 3). Given the difficulty in obtaining an apical four chamber view in mice and due to the frequent visual obstruction of the RV by the ribs and sternum in the parasternal short axis (PSAX), the parasternal long axis (PLAX) is the preferred echocardiographic window.
2.2.1.1 Right ventricular internal diameter
Right ventricular internal diameter (RVID) provides metric dimensions of the right ventricle during systole and diastole. To obtain this parameter, a PSAX or PLAX M-mode image should be captured with the M-mode line positioned over the RV. Obtaining the correct view may require repositioning the platform 45° to the right. Furthermore, skin reverberation artifacts can easily be confused with the RV, therefore flow on Doppler or movement in a B-mode image should be used to confirm that the RV is correctly identified. In PSAX or PLAX M-mode, RVID;s and RVID;d should be selected [instead of the intraventricular septum (IVS) IVS;s and IVS;d] to measure the diameter of the right ventricle (Figure 2). This parameter will also measure IVS, left ventricular internal diameter (LVID), and left ventricular pulmonary wall (LVPW). Increased RVID would be indicative of right ventricular dilation or volume overload and thus useful to evaluate RHF.
FIGURE 2
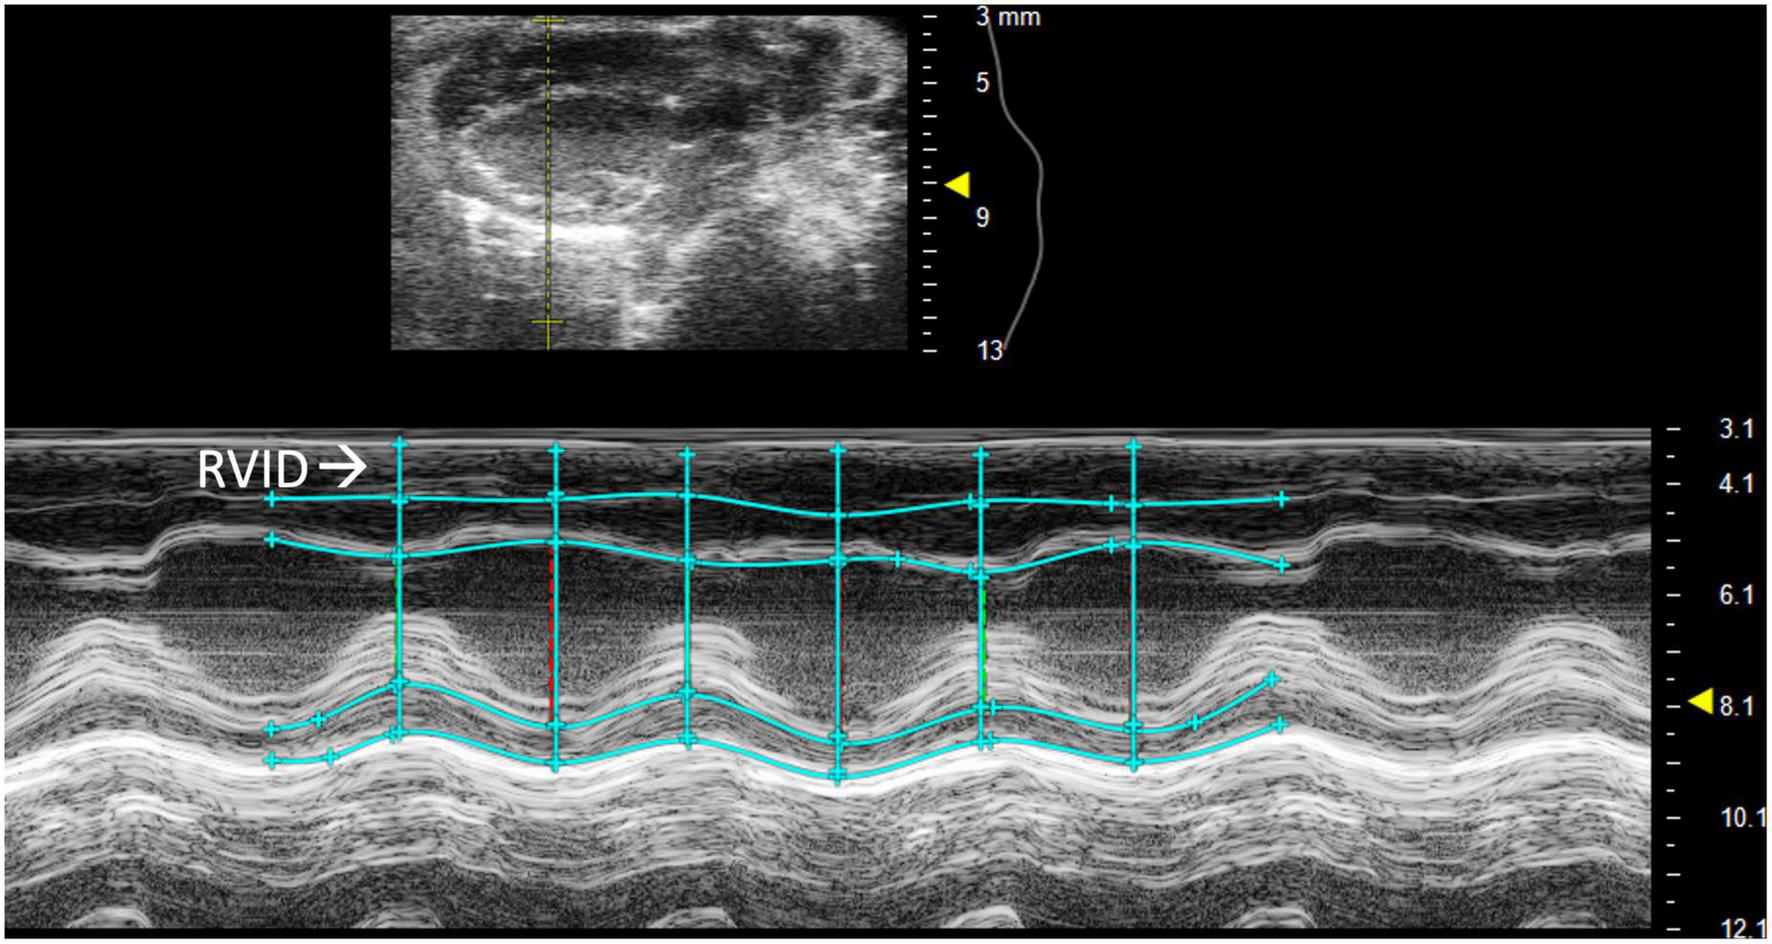
Right ventricular internal diameter (RVID), a measurement of the right ventricle during systole and diastole, is obtained by analyzing parasternal long axis (PLAX) view images in M-mode.
2.2.1.2 Right ventricular outflow tract length
Right ventricular outflow tract (RVOT) length is the measurement of the right ventricular outflow tract at end diastole. It can be measured by selecting “RVOT” in a PLAX B-mode image containing the RV (Figure 3A). The RVOT is located just proximal to the PV. RVOT is another indicator of RV size (2); a dilated RVOT suggests right ventricular volume overload.
FIGURE 3
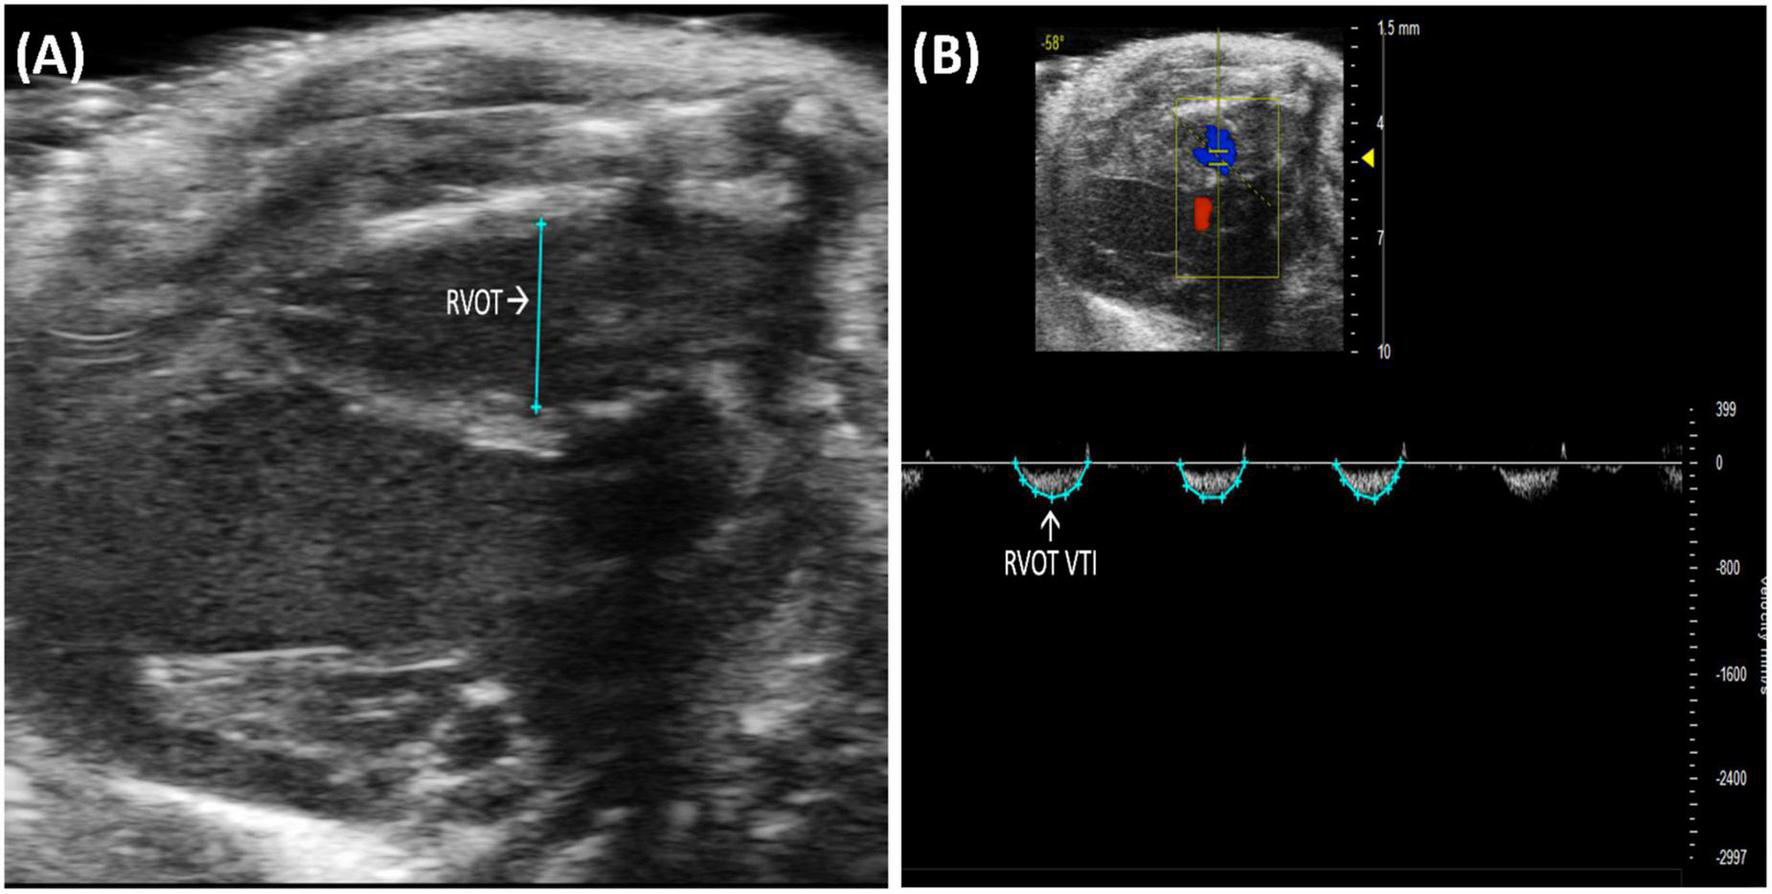
(A) Right ventricular outflow tract (RVOT) measures the size of the right ventricular outflow tract at the end of diastole and is acquired and analyzed in B-mode of the parasternal long axis (PLAX) view. (B) Right ventricular outflow tract velocity time integral (RVOT VTI) measures blood flow through the right ventricular outflow tract (RVOT) and is acquired by pulsed wave (PW) Doppler imaging of the RVOT in B-mode of the parasternal long axis (PLAX) view.
2.2.1.3 Right ventricular outflow tract velocity time integral
Right ventricular outflow tract velocity time integral (RVOT VTI) is a measurement of blood flow through the RVOT. It can be measured as the area under the curve in a pulsed wave (PW) Doppler image of PLAX with the yellow marker on the flow of the RVOT (Figure 3B). Mean velocity, mean gradient, peak velocity, and peak gradient are automatically calculated. RVOT VTI is a surrogate for RV stroke volume (SV), hence, the ratio of RVOT VTI to pulmonary artery systolic pressure represents pulmonary arterial compliance, an important measure for pulmonary arterial hypertension (PAH) (4). Right ventricular systolic pressure is equal to pulmonary artery systolic pressure (5) and can be measured by right heart catheterization in mice. RVOT and RVOT VTI can be used to calculate right ventricular SV and cardiac output (CO).
2.2.2 Pulmonary artery and valve
Pulmonary and right ventricular parameters are more informative when applied concurrently. RV dysfunction in the absence of elevated PA pressures indicates isolated RHF, while RV dysfunction concurrent with elevated PA pressures could indicate pulmonary hypertension leading to RHF or LHF leading to RHF. PA and PV measures may be incorrectly assumed to be interchangeable; however, the PA is anatomically distal to the PV in mice, and images should be captured accordingly. Measurements are made of PW Doppler mode images with the marker overlying either the PA or PV (Figures 4, 5).
FIGURE 4
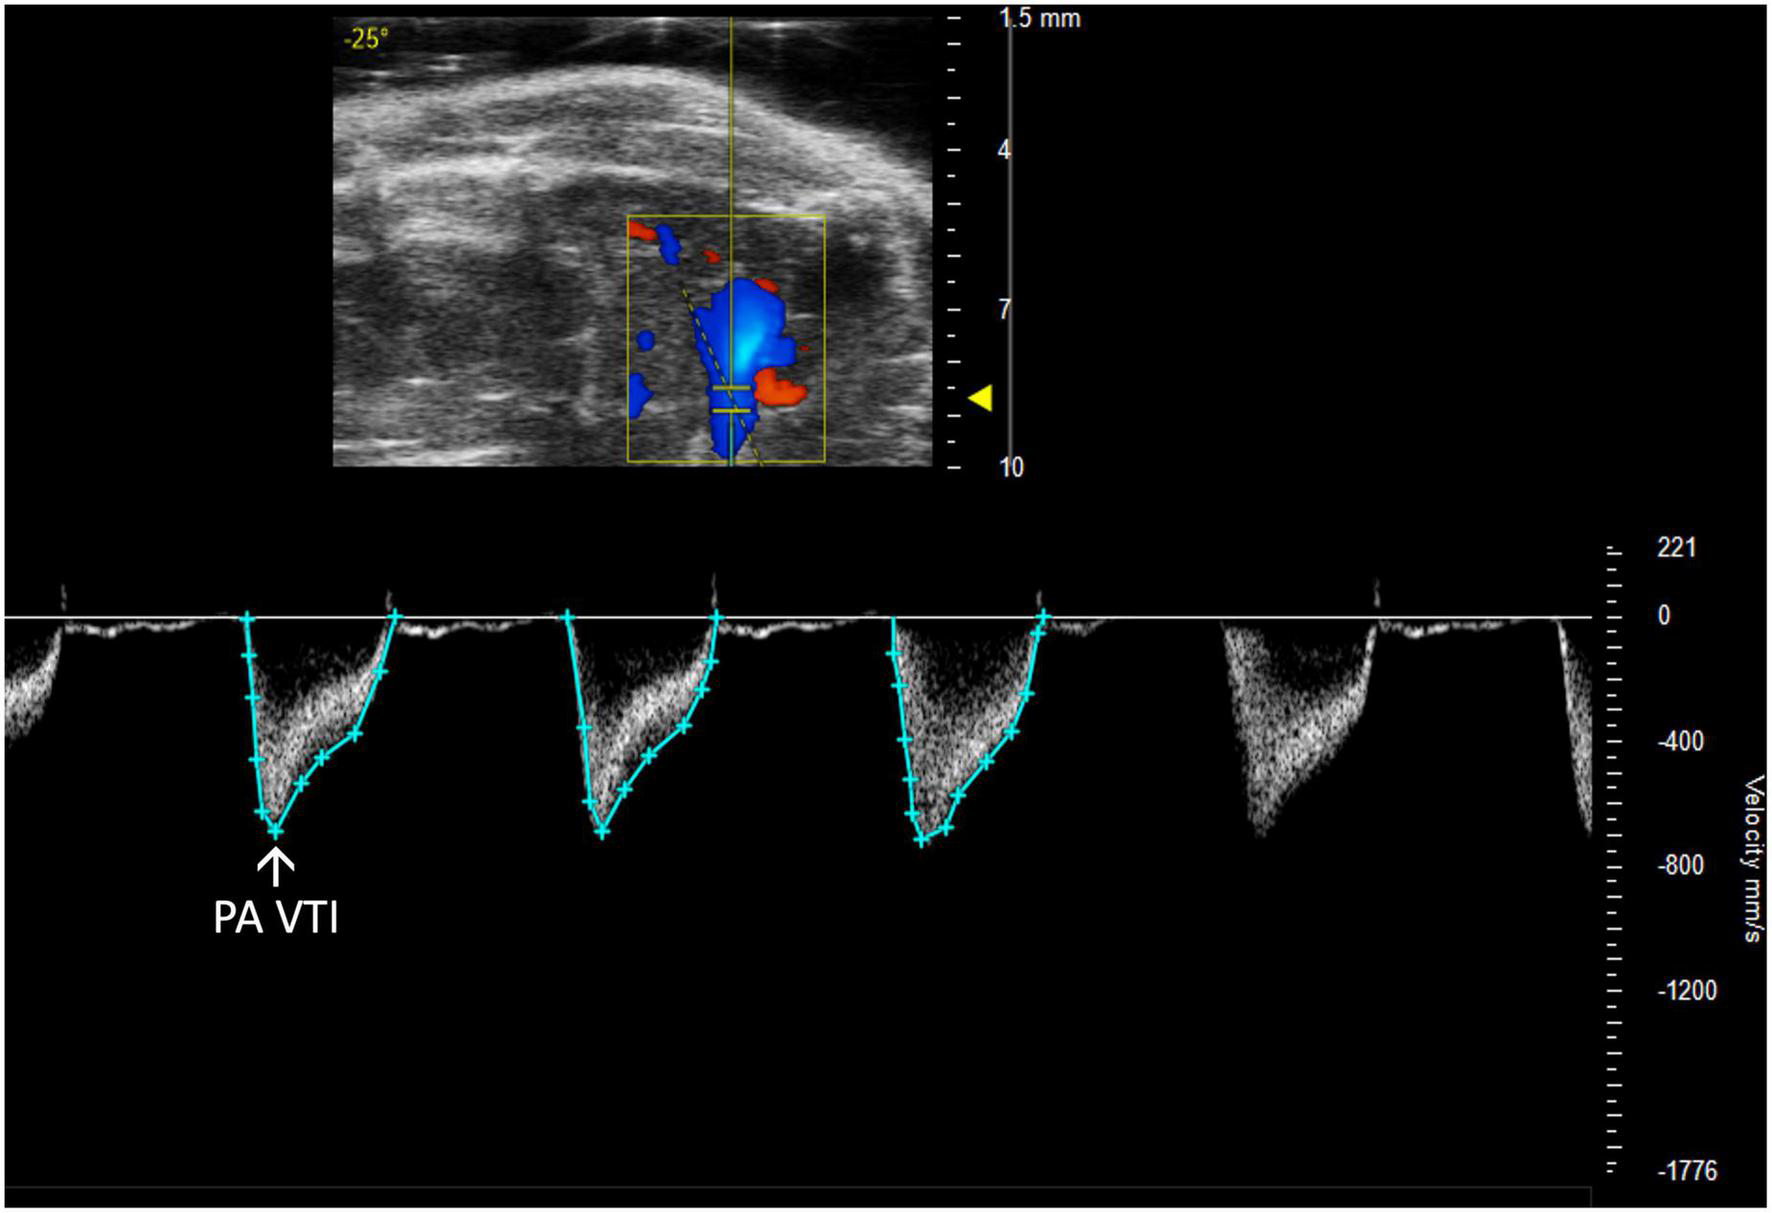
Pulmonary artery velocity time integral (PA VTI) directly measures blood flow through the pulmonary artery and is acquired as the area under the curve in pulsed wave (PW) Doppler mode of the parasternal long axis (PLAX) view.
FIGURE 5
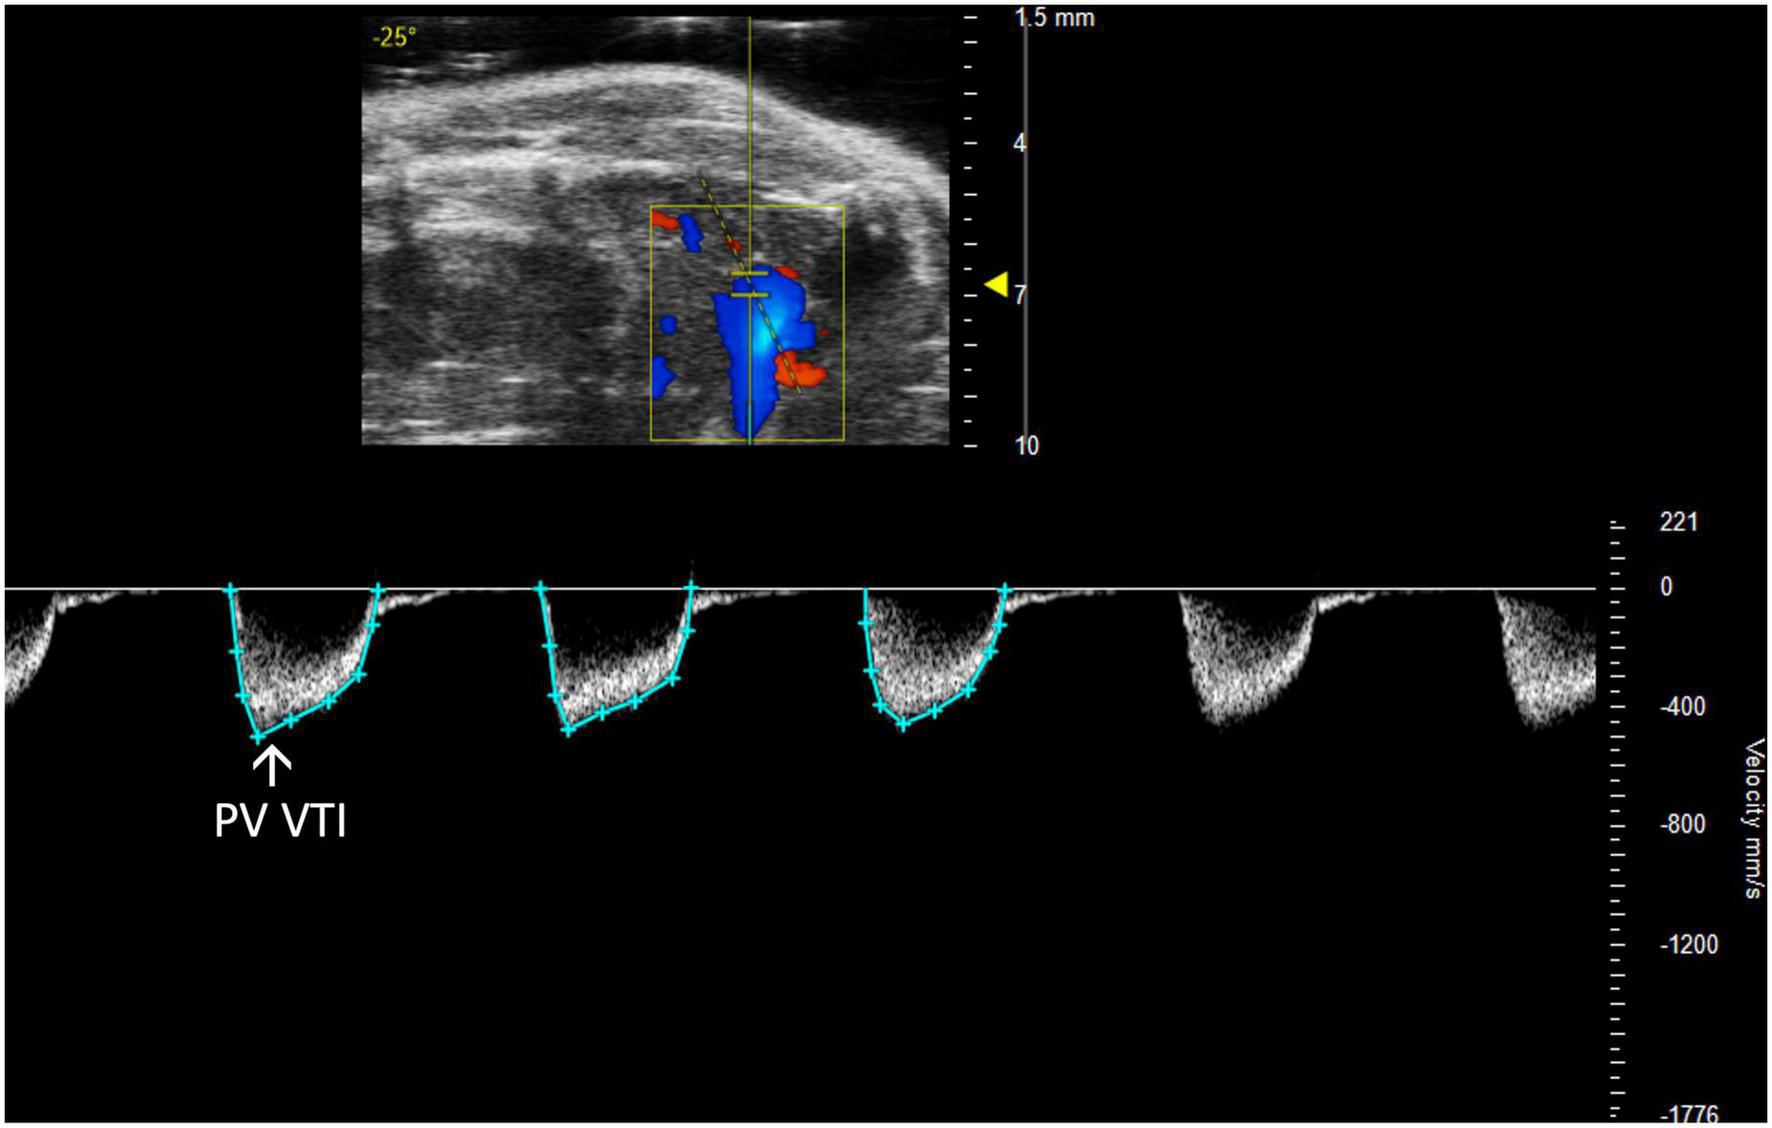
The pulmonary valve velocity time integral (PV VTI), a measure of blood flow through the pulmonary valve, is calculated by measuring the area under the curve in pulsed wave (PW) Doppler mode of the parasternal long axis view (PLAX).
2.2.2.1 Pulmonary artery velocity time integral
Pulmonary artery velocity time integral (PA VTI) is a direct measure of blood flow through the pulmonary artery. It is calculated as the area under the curve in a PW Doppler image of the PA (Figure 4). Mean velocity, mean gradient, peak velocity, and peak gradient are automatically generated. This measure can be used to evaluate PAH because increased PA flow accompanies PAH (6).
2.2.2.2 Pulmonary regurgitation peak velocity
Pulmonary regurgitation peak velocity (PR Peak Vel) relates to degrees of pulmonic regurgitation in mouse models. PR Peak Vel is the maximum velocity of the regurgitant stream. Like most other pulmonary measures it is performed with a PW Doppler mode image of pulmonary artery flow (Figure 6). This measure allows for classification of the severity of the regurgitation.
FIGURE 6
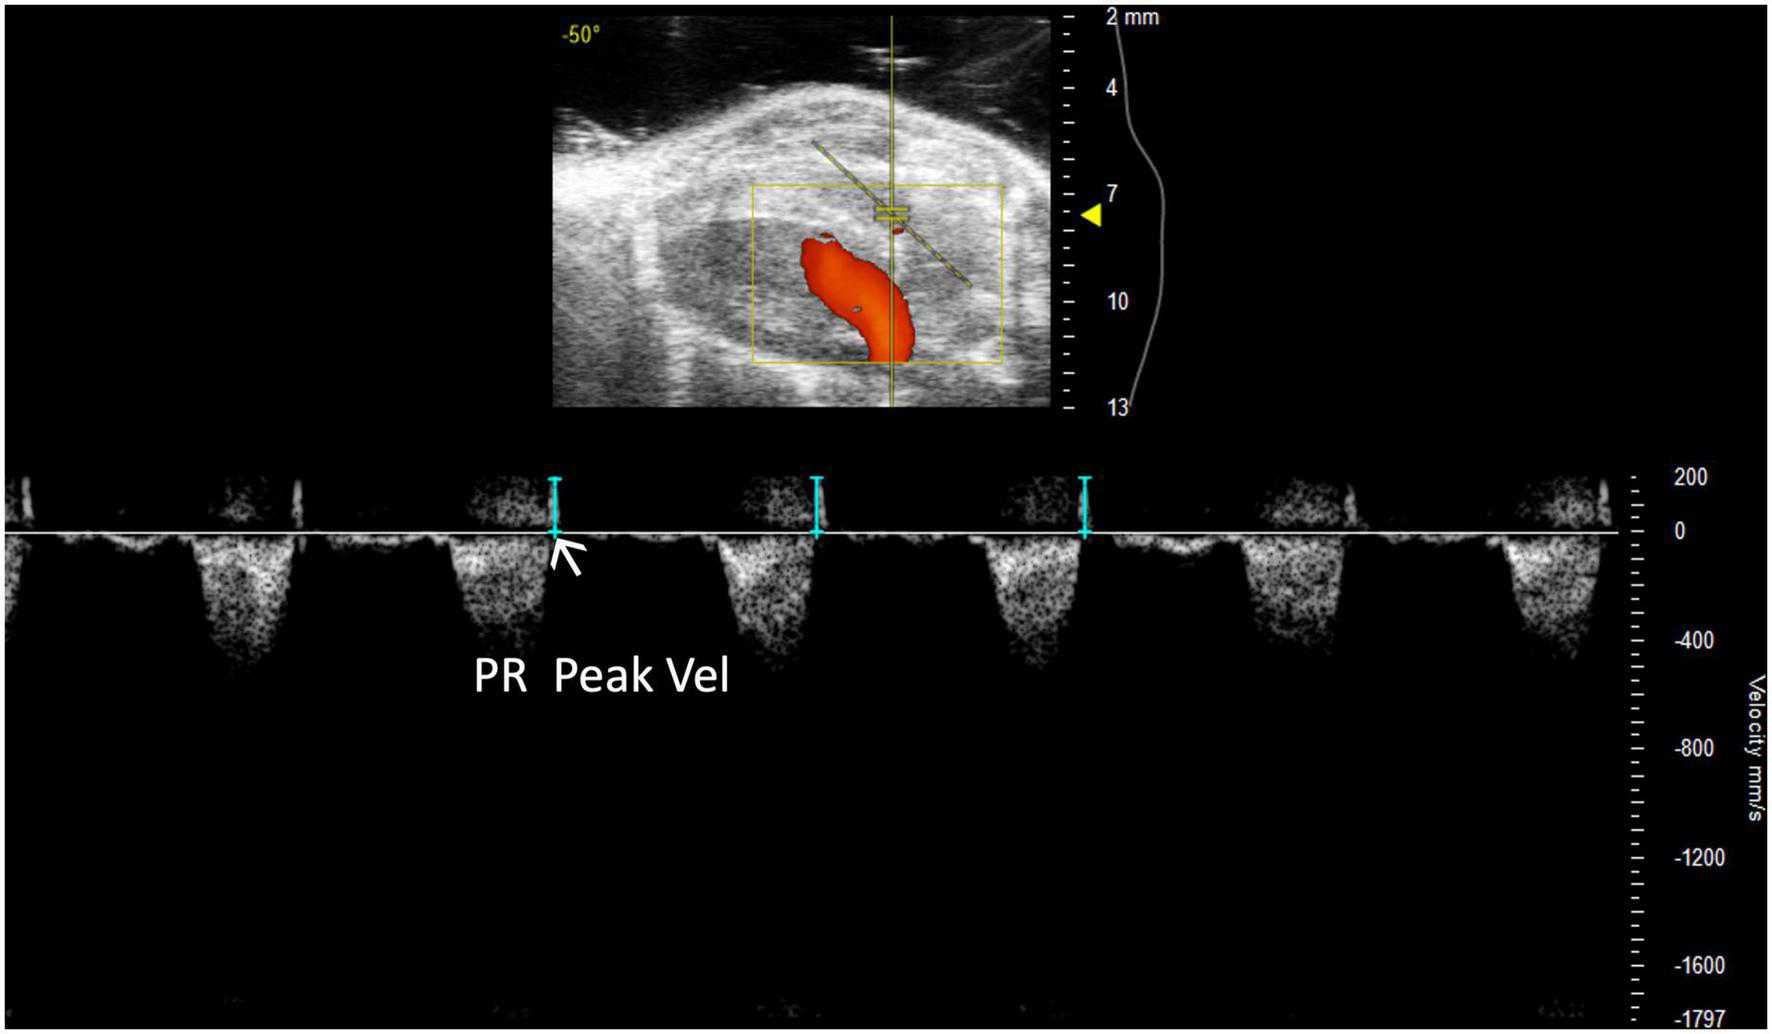
Representative image displaying pulmonary regurgitation peak velocity (PR Peak Vel), a parameter used in mouse models of pulmonic regurgitation which is acquired in pulsed wave Doppler mode of the parasternal long axis (PLAX) view.
2.2.2.3 Pulmonic valve diameter
Pulmonic valve diameter (PV diameter) measures, in millimeters, the length of the pulmonic valve. This measurement can be performed using a PLAX or PSAX view of the pulmonic valve; however, visualization is typically easier in PLAX (Figure 7). PV diameter can be used to assess whether pulmonic valve stenosis or dilation is present. The PV diameter can also be used with PV VTI to calculate PV SV and CO.
FIGURE 7
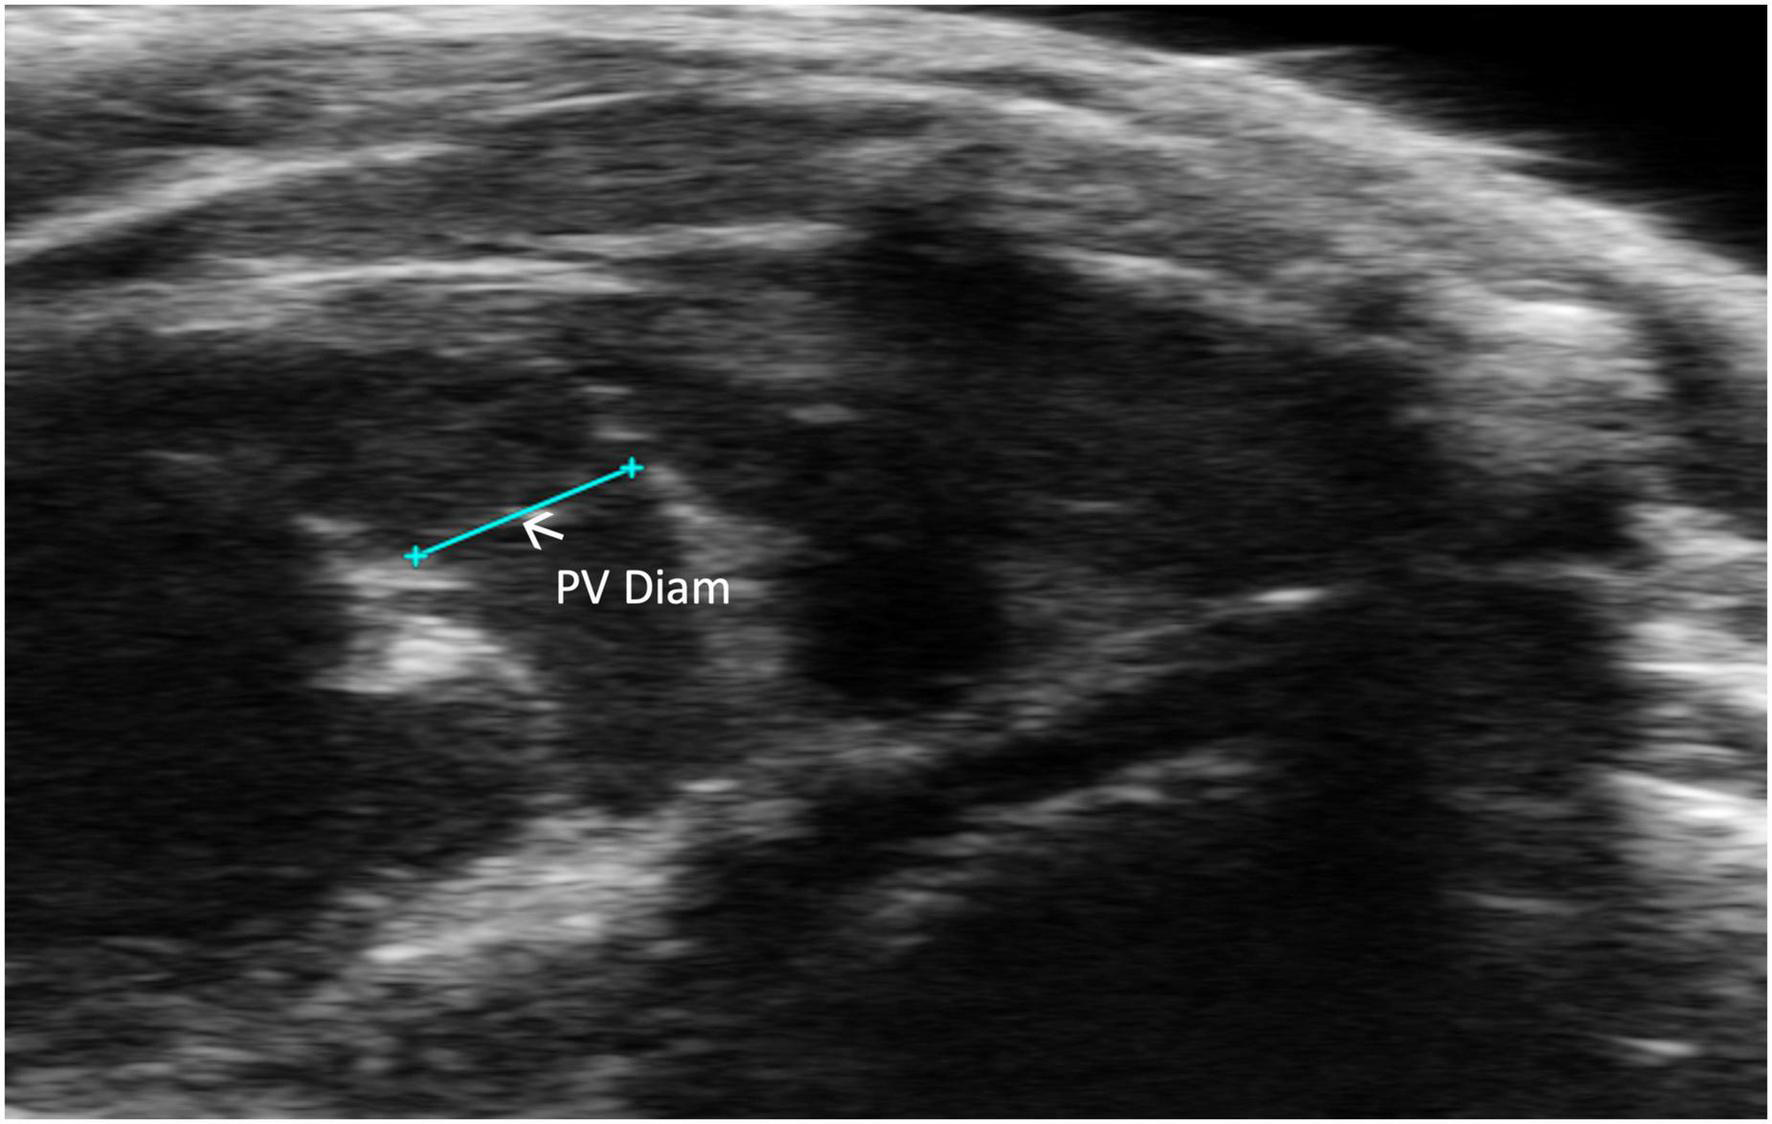
Pulmonic valve (PV) diameter is acquired and analyzed in B-mode of the parasternal long axis (PLAX) view.
2.3 Left-sided parameters
2.3.1 Left atrium
Left atrial size is rarely evaluated in small animal echocardiography despite the reciprocity between LA reservoir function and LV systolic function and thus cardiac output (7). In other words, LA pathology, leading to decreased preload affects CO and LV systolic function. Furthermore, the LA can be used as a marker of chronic LV dysfunction (8) as is influenced by elevated left ventricular end diastolic pressure (LVEDP) propagating backwards (9).
2.3.1.1 Left atrial depth
Left atrial depth can be measured vertically at end diastole. To perform this parameter, a PLAX M-mode image should be captured with the yellow line positioned over the LA, which is located inferior to the aorta (Figure 8).
FIGURE 8
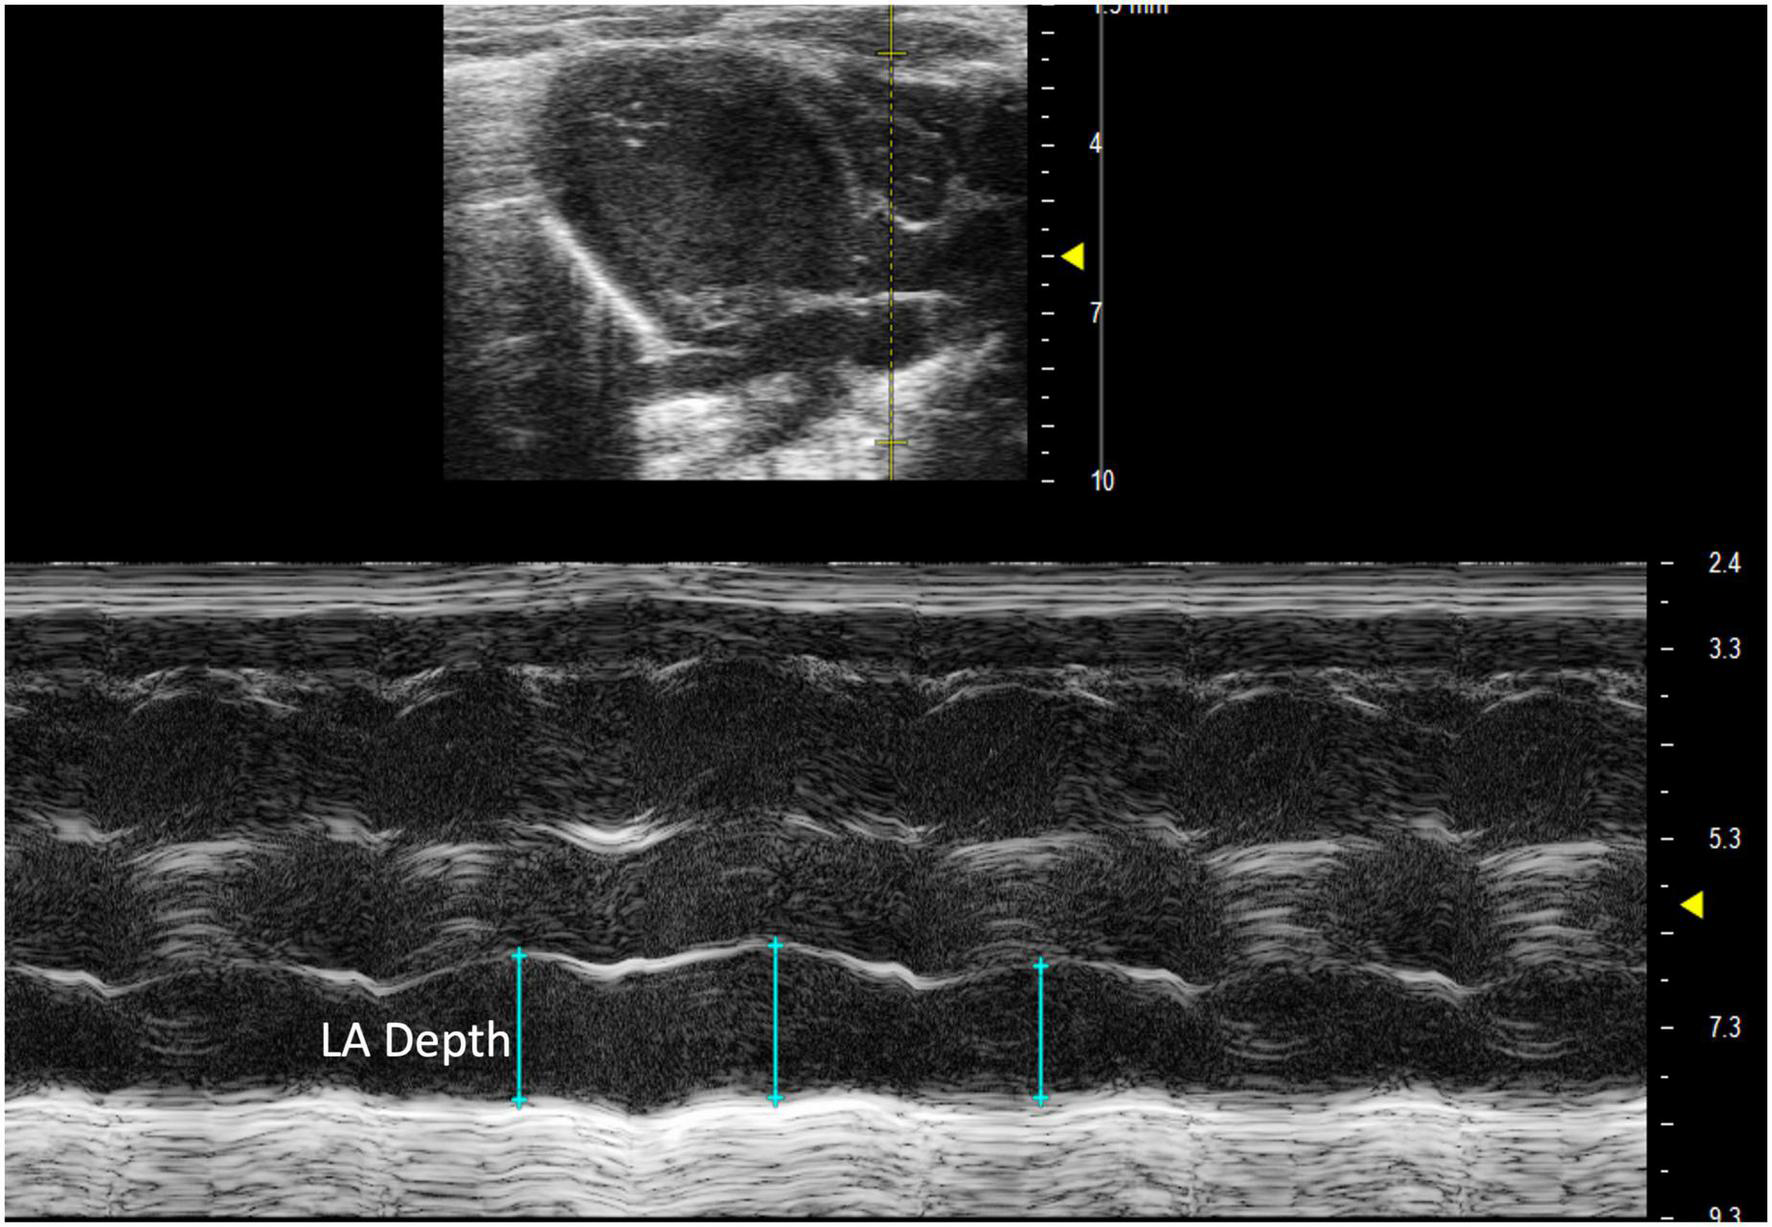
Parasternal long axis (PLAX) M-mode view displaying left atrial depth measurement just inferior to the aorta.
2.3.2 Left ventricle
Although extensively characterized because of the accessibility of imaging the LV, many parameters are inadequately described in literature.
2.3.2.1 Left ventricular outflow length
Left ventricular outflow tract length (LVOT) measures, in millimeters, the left ventricular outflow tract, just proximal to the aortic valve, at end diastole. It is measured by selecting “LVOT” under “AoV Flow” in a PLAX B-mode image containing the left ventricular outflow tract (Figure 9). LVOT would be a valuable measure for mouse models of aortic stenosis because it can be used to calculate aortic valve area (AVA) (see below).
FIGURE 9
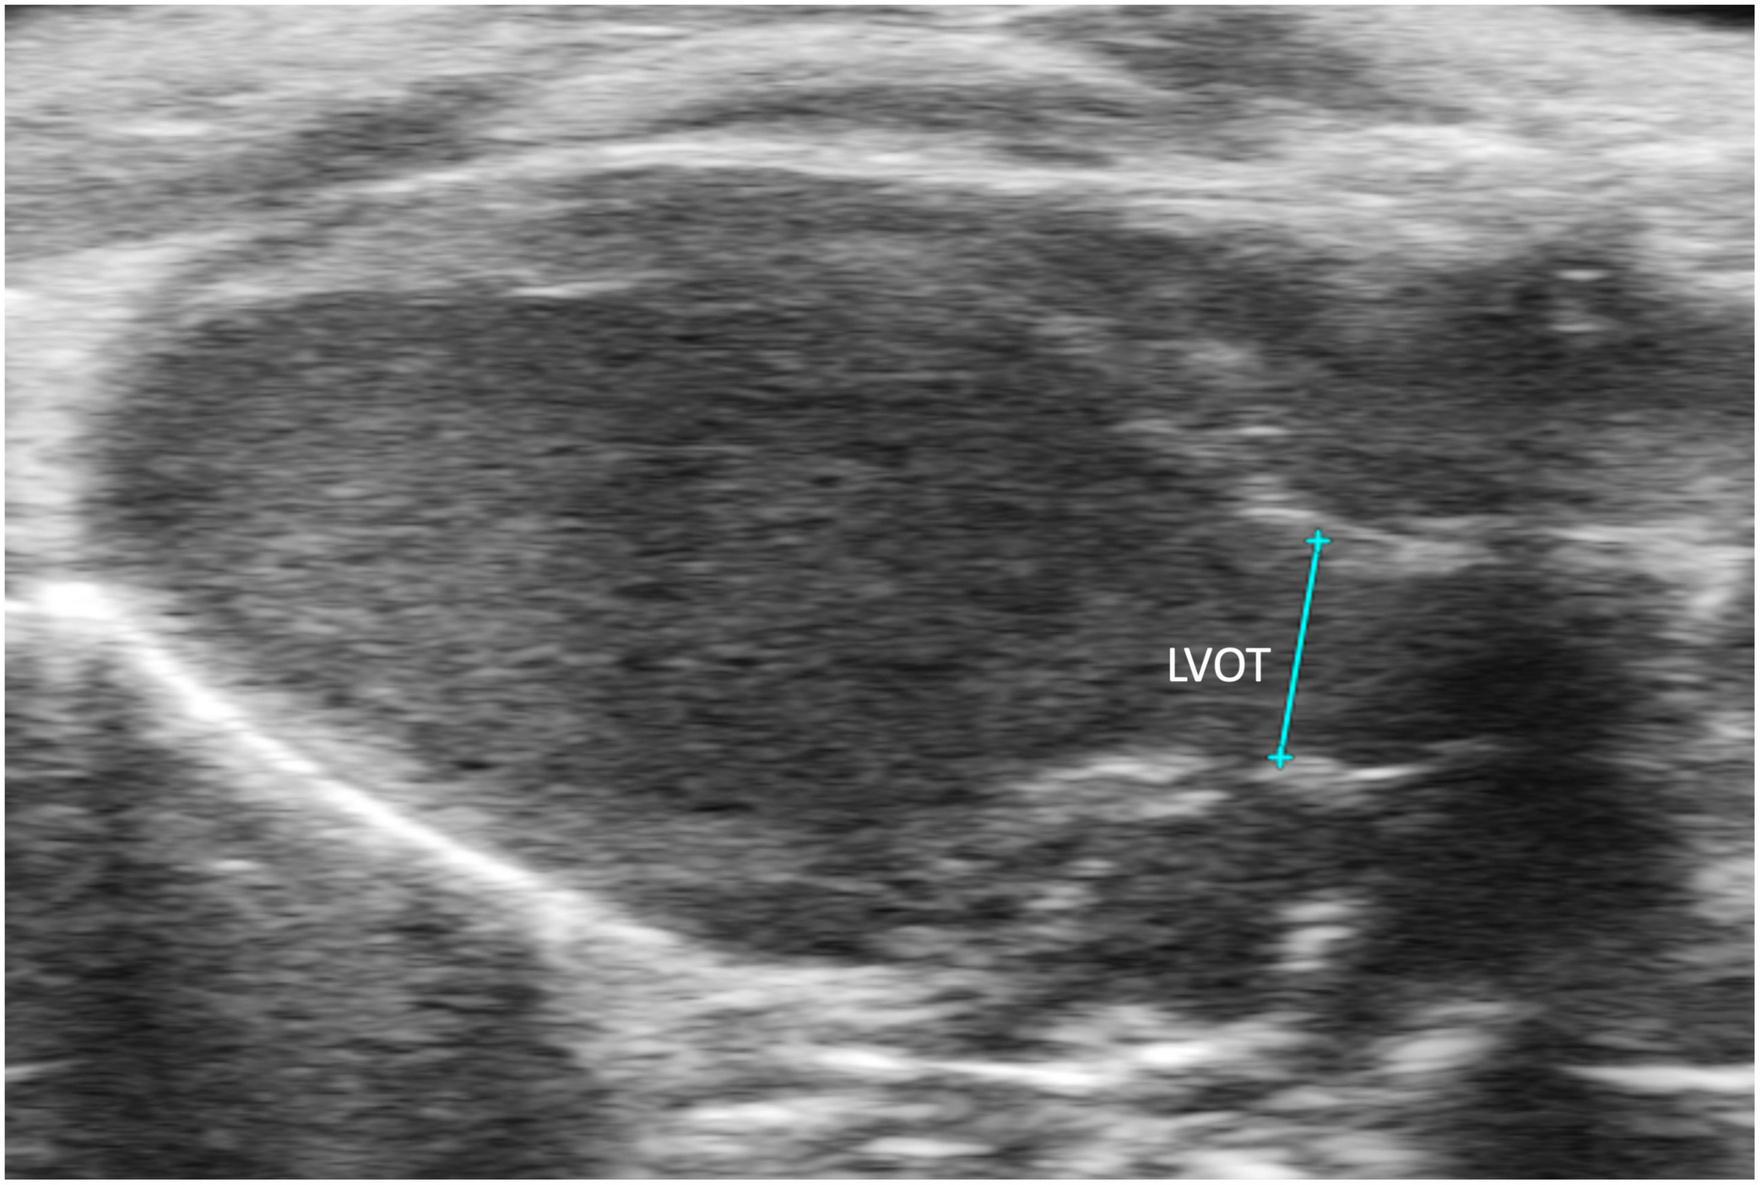
The left ventricular outflow tract (LVOT) length is acquired in the B-mode of the parasternal long axis view (PLAX).
2.3.2.2 Left ventricular outflow tract velocity time integral
Left ventricular outflow tract velocity time integral (LVOT VTI) is defined as a measurement of blood flow out of the ascending aorta. It can be measured as the area under the curve in a PLAX PW Doppler mode image with the cursor over the flow of the ascending aorta (Figure 10). LVOT VTI has been shown to be representative of CO in humans and more predictive than EF or Doppler derived CO in patients with heart failure (10). Thus, we hypothesize that LVOT VTI is an accurate measure of systolic function and CO in mice as well, but this remains an interesting area of study for future directions. LVOT and LVOT VTI can be used to calculate SV, CO, and AVA:
FIGURE 10
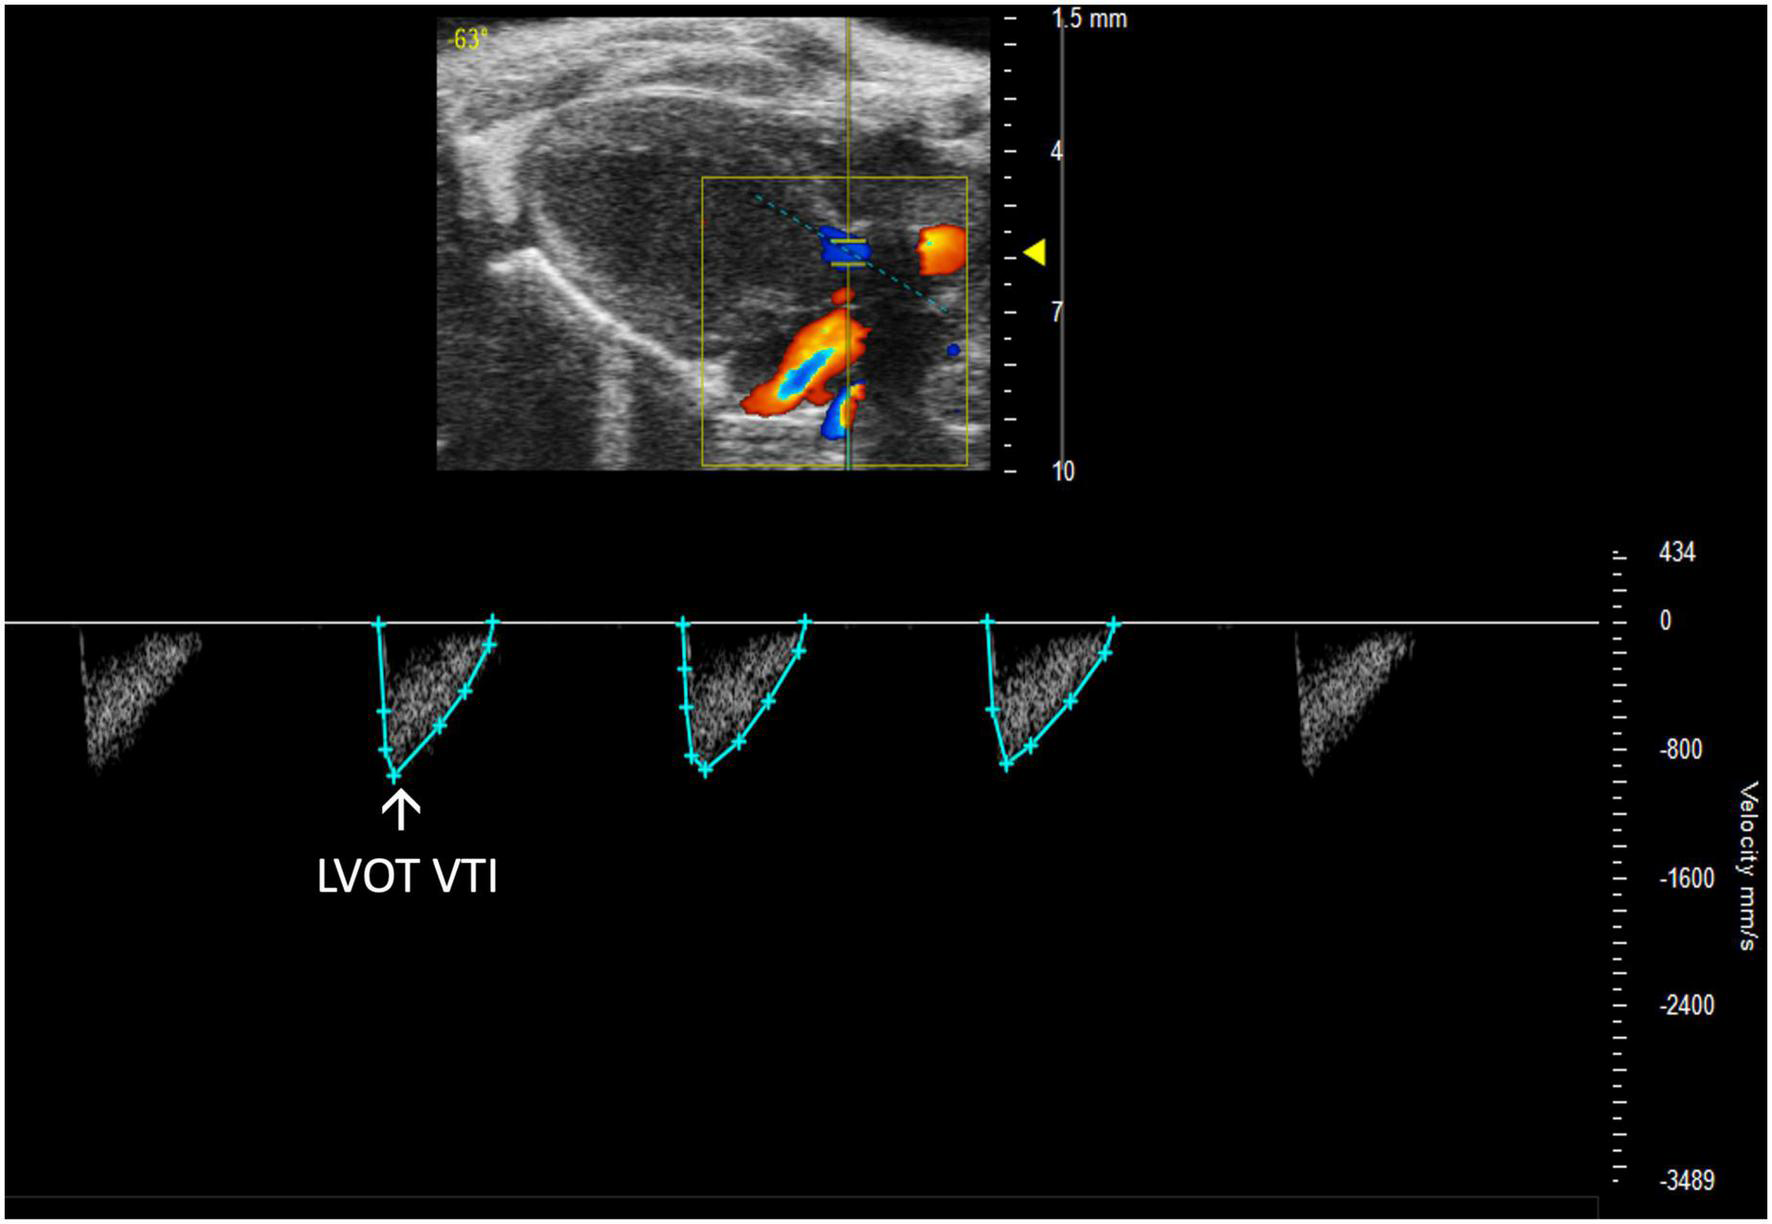
Representative image displaying left ventricular outflow tract velocity time integral (LVOT VTI), a measure of blood flow out of the ascending aorta which is obtained by calculating the area under the curve in the PW Doppler mode of the parasternal long axis view.
2.3.3 Mitral valve
2.3.3.1 Mitral regurgitation
Mitral regurgitation (MR) has not been well-described in mice because of their resistance to developing mitral valve prolapse (11). However, Li et al. recently reported the first mouse model of severe MR (Figure 11, 12). To continue development of mouse models of MR, it is important to be able to recognize the presence of mitral regurgitation, which appears as a mixed color pattern of systolic backflow from the LV to the LA on PSAX Color Doppler.
FIGURE 11
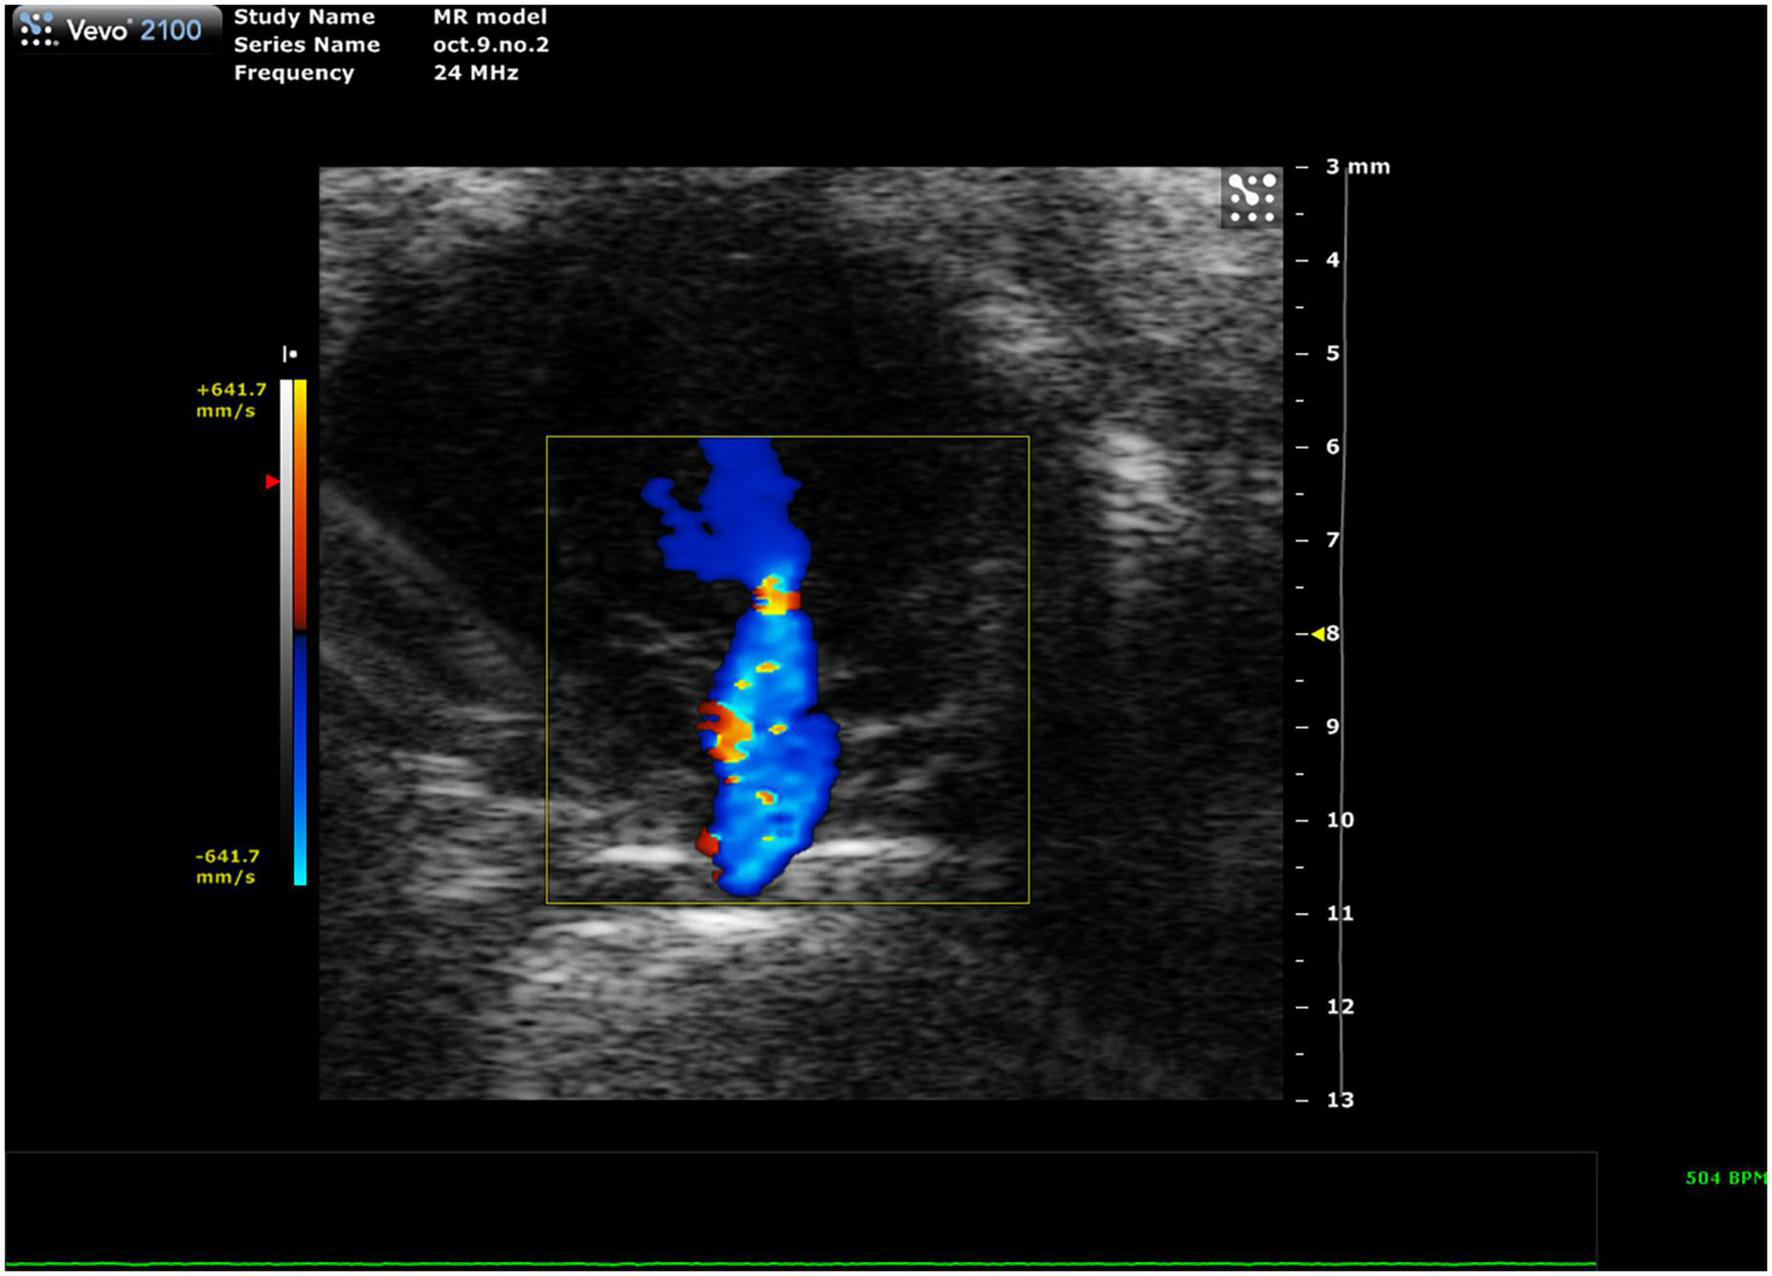
Representative image showing a mixed color pattern of systolic backflow from the left ventricle to the left atrium in severe mitral regurgitation.
2.3.3.2 Mitral valve pressure half time
Mitral stenosis is another disease that is not well-replicated in mice. However, mitral valve pressure half time (MV PHT) is a potentially useful parameter in the setting of mitral stenosis (10). MV PHT is the time interval, in milliseconds, for the maximum mitral gradient to reduce to half the maximum initial value. It is most accurately measured in a PW Doppler image of the mitral valve by measuring maximum velocity, calculating half of the maximum velocity, and dropping another velocity measurement on the mitral valve curve equal to half of the maximum velocity. Finally, the peaks of the velocity measurements are measured as MV PHT, and the velocity measurements can be deleted (Figure 12).
FIGURE 12
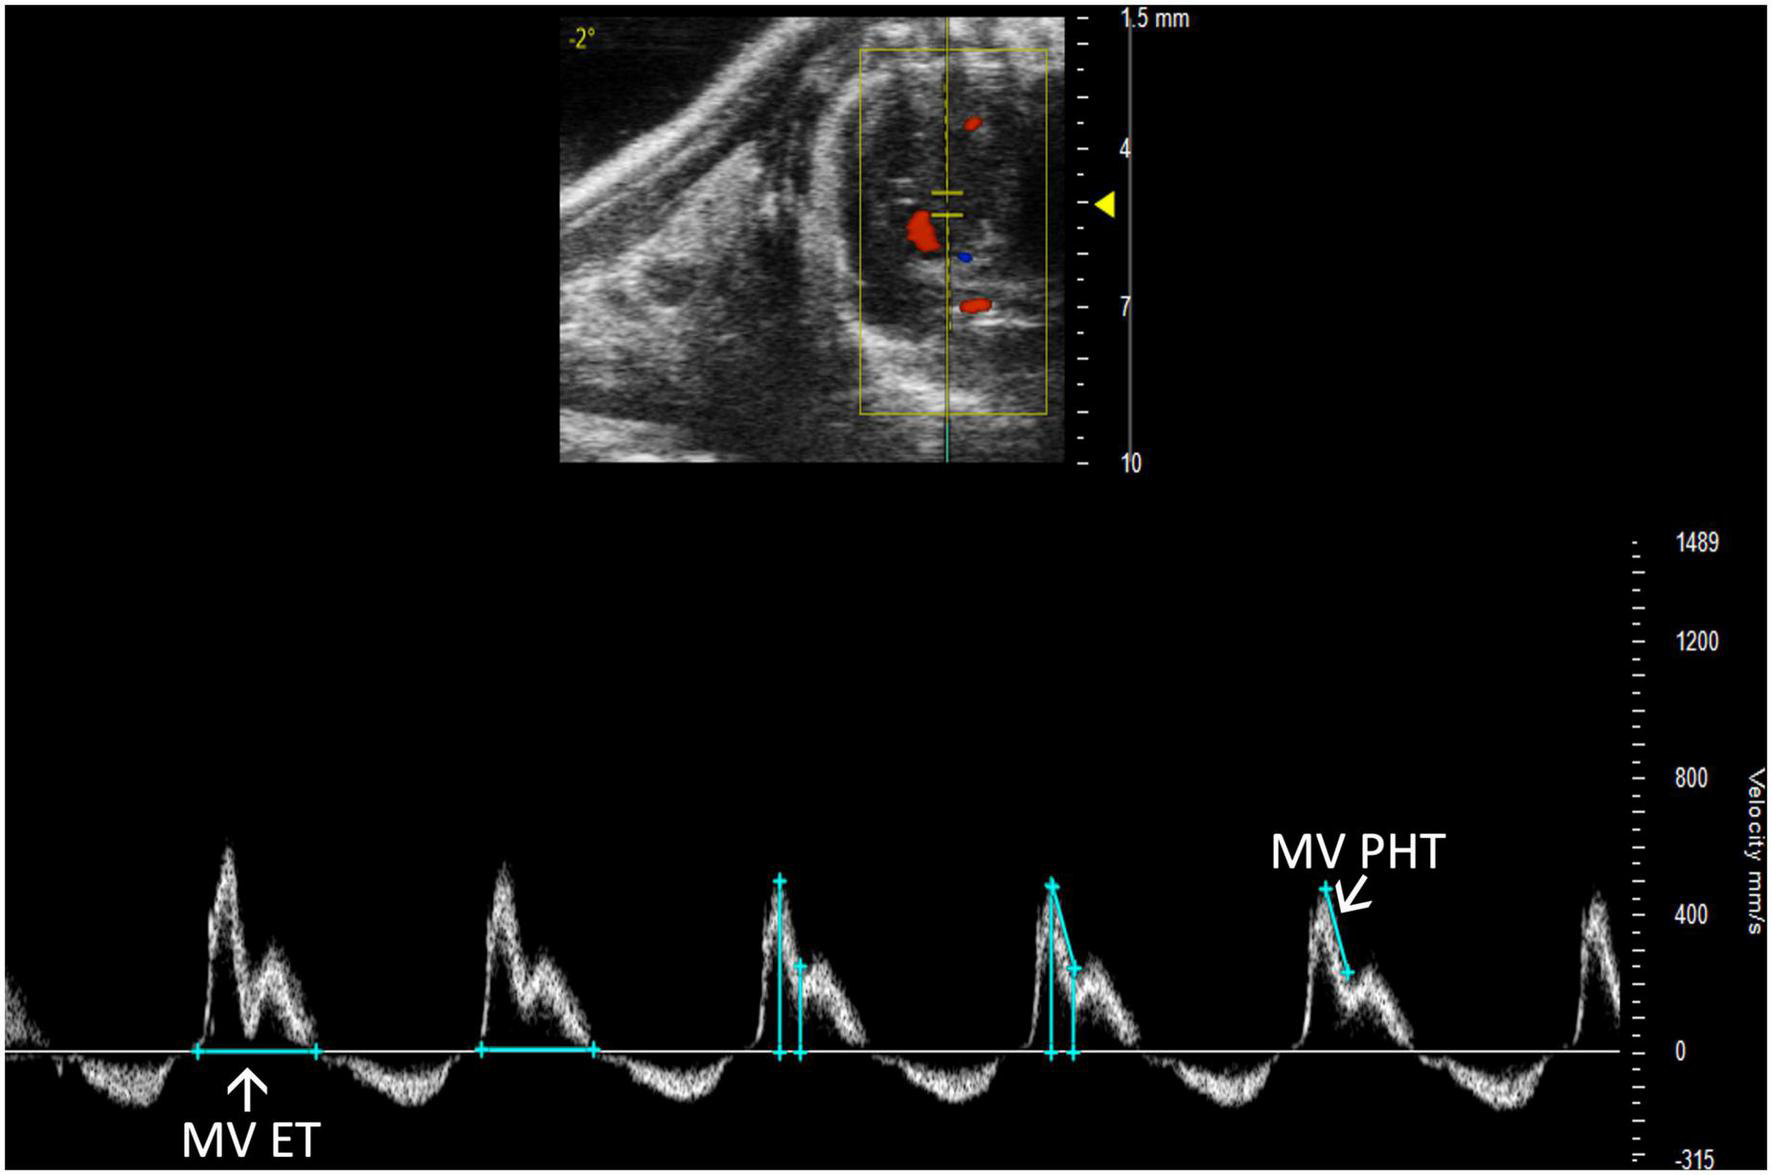
Pulsed wave (PW) Doppler mode image showing mitral valve pressure half time (MV PHT), a measure of mitral stenosis and mitral valve ejection time (MV ET), the duration of diastolic filling in the left ventricle.
2.3.3.3 Mitral valve ejection time
Mitral valve ejection time (MV ET) is equal to the duration of diastolic filling of the LV; therefore, can be used to further characterize diastolic dysfunction. MV ET is measured at the end of IVRT to the beginning of IVCT on a PW Doppler of the mitral valve (Figure 12).
2.3.4 Aortic valve
Aortic regurgitation has been seen in existing mouse models; however, methods for analysis beyond visual recognition have not been well-established.
2.3.4.1 Aortic insufficiency deceleration
Aortic insufficiency pressure half time (AI PHT) is the rate of deceleration of Doppler signal, indicating the degree of regurgitation and LVEDP (13). The same method to measure MV PHT is used to measure AI PHT in PW Doppler mode of the aortic valve (Figure 13). Aortic insufficiency half time is automatically calculated.
FIGURE 13
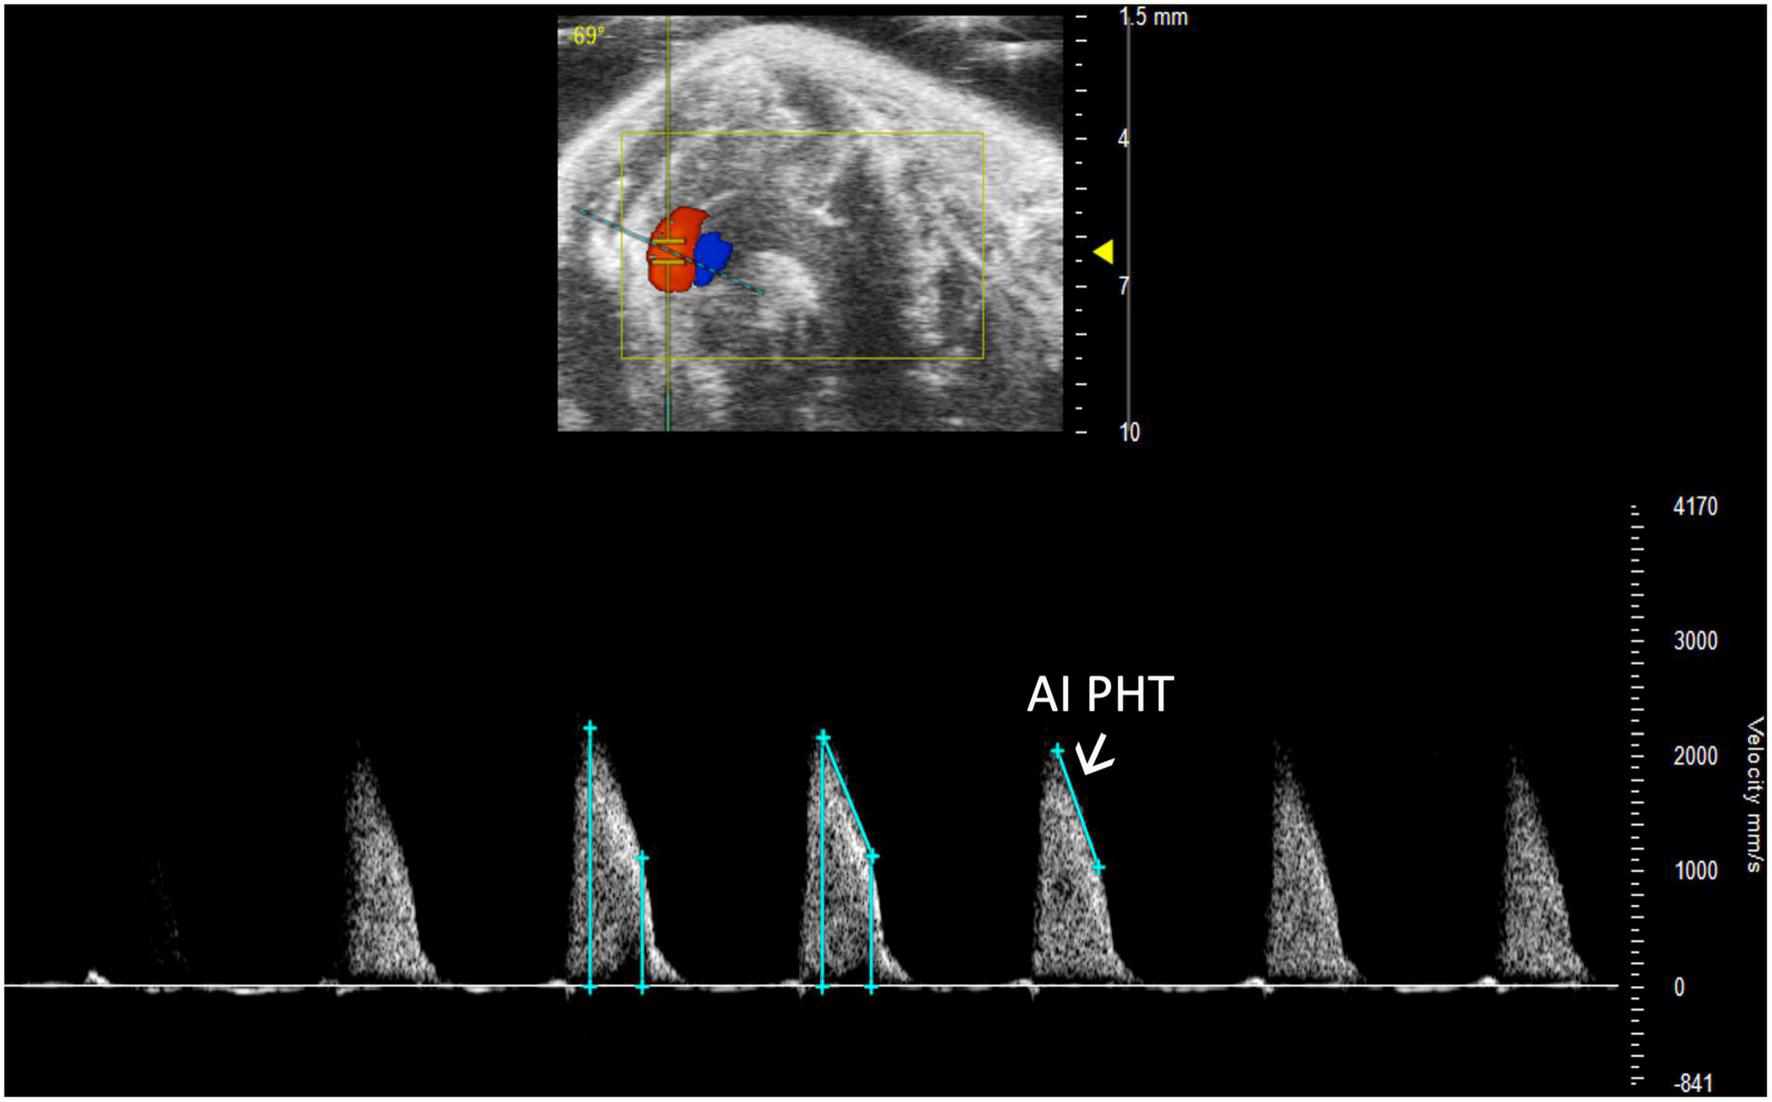
Aortic insufficiency pressure half time (AI PHT) represents the degree of regurgitation and reflects the left ventricular end diastolic pressure and is measured in pulsed wave (PW) Doppler mode of the aortic valve.
2.3.4.2 Aortic acceleration time
Aortic acceleration time (AAT) has been validated by Perez et al. to assess LV contractility in mice. It is measured in PW Doppler mode as the time to peak aortic velocity (Figure 14). Studies in humans suggest that the ratio of AAT to aortic ejection time (AET) predicts aortic stenosis severity (14), although it has not yet been evaluated in mice.
FIGURE 14
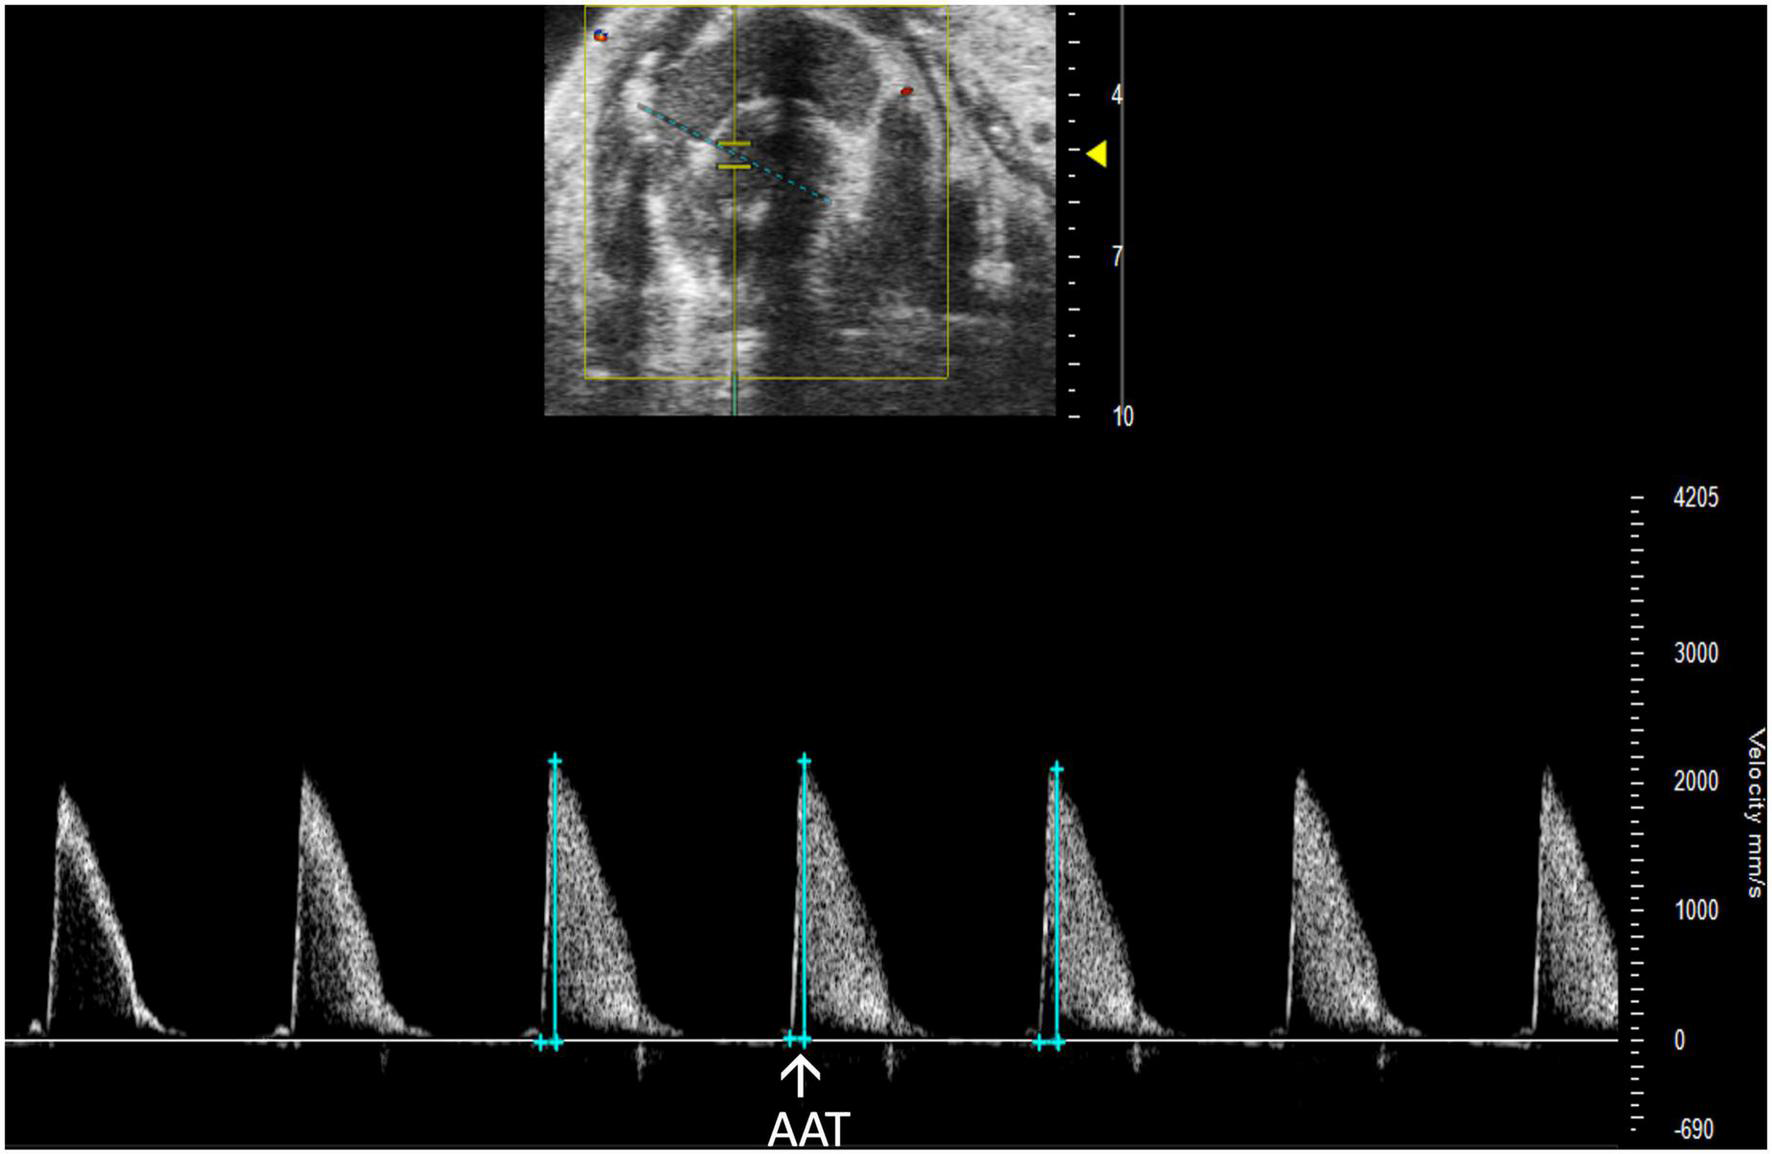
Pulsed wave (PW) Doppler mode image showing analysis of the aortic acceleration time (AAT), a measurement of left ventricular contractility in mice.
3 Anticipated results
Normalizing the acquisition and analysis of infrequently used parameters coupled with commonly used values will provide further insight into both left and right-sided cardiac function. In recent years, the importance of the right heart has become more evident but a complete understanding remains elusive. Implementing the additional parameters described here will generate a more comprehensive picture of cardiovascular disease in mouse models that can be applied to parallel human conditions.
3.1 Limitations
All analyses are limited by human error in image acquisition. The RV must be captured in PLAX M-mode in order to measure RV parameters, however, as noted by Brittain et al., sometimes the RV is only visible when dilated. If the transducer is misaligned with blood flow for Doppler modes, blood velocity will be decreased for LVOT VTI and RVOT VTI measurements and SV and CO will be falsely low (3). To obtain the most accurate readings, blood flow direction should be as vertical as possible (up or down) and the dotted line aligned with blood flow in all PW Doppler images. Another limitation is the increased training and effort required to accurately and reproducibly perform a significant number of additional parameters as well as the increased time required to capture the extra views.
4 Discussion
In our quest to improve resources, expand and optimize echocardiography parameters in rodent models, we realized a need for protocols and information to define and facilitate infrequently used parameters. Here, we present multiple parameters that are rarely used and provide a thorough description of echocardiography acquisition and analysis of these parameters. Although VisualSonics Vevo imaging systems were used to obtain these images and derive parameters, the same approaches should be applicable to other comparable imaging systems such as S-Sharp (15, 16). In a study that measured the grey scale imaging performance of 17 preclinical transducers over 10 years, all except one S-sharp transducer were Vevo transducers (17), thus, our protocol likely covers the instruments commonly available for use. A summary of these infrequently used parameters combined with common echocardiography parameters as well as data values from 10 to 12-week-old male and female mice from C57BL/6, BalbC, and 129Sv mouse strains can be found in Table 1.
TABLE 1
| Anatomic structure | Mode | Parameter | Definition | C57BL/6 (n = 11) | BalbC (n = 10) | 129Sv (n = 9) |
| Mitral valve (MV) | PW Doppler | MV E (mm/s) | Mitral valve early peak | 754.47 ± 412.82 | 939.27 ± 167.53 | 374.77 ± 126.08 |
| MV A (mm/s) | Mitral valve atrial peak | 556.38 ± 265.92 | 525.27 ± 244.75 | 258.80 ± 91.50 | ||
| IVRT (ms) | Isovolumetric relaxation time | 15.23 ± 4.81 | 13.31 ± 2.89 | 20.76 ± 8.83 | ||
| IVCT (ms) | Isovolumetric contraction time | 10.58 ± 4.37 | 9.69 ± 2.73 | 19.24 ± 9.34 | ||
| MV VTI (mm) | Velocity time interval of mitral valve inflow | 23.10 ± 13.19 | 32.63 ± 5.69 | 11.95 ± 4.74 | ||
| NFT (ms) | No flow time | 71.82 ± 12.79 | 83.28 ± 9.07 | 90.61 ± 11.63 | ||
| AET (ms) | Aortic ejection time | 45.15 ± 7.23 | 62.64 ± 4.17 | 49.41 ± 10.39 | ||
| MV PHT (ms) | Mitral valve pressure half time | 4.31 ± 2.30 | 7.24 ± 2.32 | 4.12 ± 0.70 | ||
| MV ET (ms) | Mitral valve ejection time | 55.74 ± 14.25 | 72.28 ± 13.02 | 56.25 ± 9.26 | ||
| PW tissue Doppler | E’ (mm/s) | Mitral valve early peak | −18.72 ± 7.47 | −22.51 ± 3.95 | −18.64 ± 3.47 | |
| A’ (mm/s) | Mitral valve atrial peak | −23.11 ± 12.05 | −19.62 ± 5.69 | −20.11 ± 3.48 | ||
| Aortic valve (AoV) | PW Doppler | AV peak (mm/s) | Peak velocity of blood flow through the aortic valve | 2537.54 ± 870.16 | 1024.86 ± 134.84 | 2265.77 ± 1453.38 |
| AET (ms) | Aortic ejection time | 56.16 ± 13.11 | 62.64 ± 4.17 | 49.41 ± 6.46 | ||
| AI PHT (ms) | Aortic insufficiency pressure half time | 22.65 ± 3.35 | 30.31 ± 4.84 | 20.70 ± 4.42 | ||
| AAT (ms) | Aortic acceleration time | 11.76 ± 2.70 | 15.24 ± 2.63 | 10.80 ± 3.17 | ||
| Pulmonary artery (PA) and valve (PV) | PW Doppler | PV peak (mm/s) | Peak velocity of blood flow through the pulmonic valve | −640.94 ± 164.23 | −682.15 ± 141.19 | −632.16 ± 240.09 |
| PAT (ms) | Pulmonic valve acceleration time | 18.69 ± 4.25 | 24.83 ± 4.96 | 25.46 ± 4.07 | ||
| PET (ms) | Pulmonic valve ejection time | 58.45 ± 6.95 | 63.89 ± 4.50 | 62.64 ± 6.01 | ||
| PV VTI (mm) | Velocity time interval of blood through the pulmonic valve | 26.20 ± 5.36 | 32.29 ± 7.04 | 27.29 ± 12.43 | ||
| PR Peak Vel (mm/s) | Maximum velocity of regurgitant stream through the pulmonic valve | 149.18 ± 40.46 | 206.17 ± 135.15 | 117.32 ± 42.55 | ||
| PA VTI (mm) | Velocity time interval of blood flow through the pulmonary artery | 29.95 ± 6.65 | 32.29 ± 7.04 | 28.24 ± 6.10 | ||
| PSLAX B-mode | PV diameter (mm) | Length of the pulmonic valve | 1.38 ± 0.18 | 1.16 ± 0.25 | 1.42 ± 0.09 | |
| Left atrium (LA) | PSLAX M-mode | LA (mm) | Depth of the left atrium | 2.04 ± 0.44 | 1.29 ± 0.34 | 2.98 ± 0.69 |
| Left ventricle (LV) | PSLAX B-mode | ENDOmajr;s/d (mm) | Length of the LV endocardium during systole and diastole | 6.35 ± 0.81/7.28 ± 0.90 | 6.58 ± 0.68/7.26 ± 0.72 | 5.88 ± 0.52/6.81 ± 0.53 |
| EPImajr;s/d (mm) | Length of the LV epicardium during systole and diastole | 7.24 ± 0.73/7.94 ± 0.84 | 7.02 ± 0.71/7.76 ± 0.74 | 6.68 ± 0.48/7.45 ± 0.58 | ||
| LVOT (mm) | Left ventricular outflow tract length | 1.58 ± 0.26 | 1.51 ± 0.10 | 1.77 ± 0.18 | ||
| PSAX B-mode | ENDOarea;s/d (mm) | Area of the LV endocardium during systole and diastole | 5.48 ± 3.46/12.40 ± 4.15 | 7.24 ± 1.72/13.03 ± 2.02 | 3.94 ± 1.62/9.12 ± 1.56 | |
| EPIarea;s/d (mm) | Area of the LV epicardium during systole and diastole | 18.98 ± 5.14/24.76 ± 6.57 | 17.66 ± 2.64/23.02 ± 3.09 | 19.06 ± 2.40/22.68 ± 3.31 | ||
| PSLAX M-mode | IVS;s/d (mm) | Intraventricular septum during systole and diastole | 1.27 ± 0.25/0.81 ± 0.14 | 0.96 ± 0.16/0.61 ± 0.10 | 1.19 ± 0.13/0.90 ± 0.16 | |
| LVID;s/d (mm) | Left ventricular internal diameter during systole and diastole | 2.35 ± 0.43/3.67 ± 0.31 | 2.98 ± 0.51/3.91 ± 0.46 | 1.58 ± 0.22/2.36 ± 0.42 | ||
| LVPW;s/d (mm) | Left ventricular posterior wall during systole and diastole | 1.21 ± 0.36/0.89 ± 0.32 | 0.76 ± 0.16/0.65 ± 0.10 | 1.00 ± 0.14/0.72 ± 0.08 | ||
| PSAX M-mode | LVAW;s/d (mm) | Left ventricular anterior wall during systole and diastole | 1.52 ± 0.27/0.97 ± 0.18 | 1.08 ± 0.15/0.69 ± 0.09 | 1.52 ± 0.40/1.03 ± 0.32 | |
| LVID;s/d (mm) | Left ventricular internal diameter during systole and diastole | 2.45 ± 0.70/3.85 ± 0.47 | 2.99 ± 0.48/3.95 ± 0.39 | 2.12 ± 0.55/3.37 ± 0.38 | ||
| LVPW;s/d (mm) | Left ventricular posterior wall during systole and diastole | 1.13 ± 0.22/0.77 ± 0.13 | 0.75 ± 0.13/0.65 ± 0.11 | 1.11 ± 0.22/0.80 ± 0.18 | ||
| PSLAX PW Doppler | LVOT VTI (mm) | Left ventricular outflow tract velocity time integral | 22.27 ± 9.66 | 16.19 ± 3.08 | 37.10 ± 18.93 | |
| Right ventricle (RV) | PSLAX M-mode | RVID;s/d (mm) | Right ventricular internal diameter during systole and diastole | 0.79 ± 0.15 /1.16 ± 0.11 | 0.99 ± 0.31/1.23 ± 0.31 | 0.86 ± 0.30 /1.20 ± 0.45 |
| PSLAX B-mode | RVOT (mm) | Right ventricular outflow tract length | 1.46 ± 0.23 | 1.47 ± 0.20 | 1.60 ± 0.14 | |
| PSLAX PW Doppler | RVOT VTI (mm) | Right ventricular outflow tract length velocity time integral | 18.05 ± 9.83 | 16.10 ± 7.54 | 15.38 ± 6.55 |
Anatomic structures, modes, definitions, and reference values of both common and infrequently used parameters for the C57BL/6, BalbC, and 129Sv mouse strains.
Infrequently used parameters are highlighted in gray. Male and female mice at the age of 10–12 weeks of age were used. Data are Mean ± SD.
Previously, the importance of the right heart was underestimated (18). Within the last decade, significant progress has been made in our understanding of the mechanisms involved in acute and chronic right heart failure as well as the role of the pulmonary system (19). However, complete understanding of right heart and pulmonary circuit function remains elusive (18). Exploring right heart and pulmonary function by echocardiography acquisition and analysis of infrequently used parameters such as RVID, RVOT, RVOT VTI, PA VTI, PV Diameter, and PR Peak Velocity in various mouse models may provide more insight into right heart and pulmonary valve dysfunction.
In contrast, left-sided parameters are frequently characterized due to ease of accessibility to the left ventricle during echocardiography acquisition. Despite accessibility, some left-sided parameters including, LA size and depth, LVOT, LVOT VTI, visual assessment of MR and AR, MV PHT, MV ET, AI PHT, and AAT are rarely acquired and analyzed. These values, coupled with frequently used left and right heart parameters, may provide further insight into cardiac function.
This manuscript serves as a guide to understanding the acquisition and analysis of infrequently used echocardiography parameters. With the continued development of mouse models that mimic human cardiac disease it is imperative to define and integrate a complete repertoire of echocardiography parameters to maximize data yields and avoid overlooking elements of unique pathologies.
Statements
Data availability statement
The raw data supporting the conclusions of this article will be made available by the authors, without undue reservation.
Ethics statement
The animal study was reviewed and approved by IACUC.
Author contributions
ET, MW, and LS perceived the project. MW and AK acquired the images. ET, MW, AK, and MR analyzed the images. ET and MW drafted the manuscript. All authors revised the manuscript, approved the final version of the manuscript, and agreed to be accountable for all aspects of the work.
Funding
This work was supported by the following grants to LS: National Institute of Health (1R01HL140468) and the Miami Heart Research Institute and the American Heart Association (965480). MW was a recipient of NIH Diversity Supplement Award.
Acknowledgments
We would like to thank Laurie Rich from VisualSonics for confirming the accuracy of our description about the technical details of image acquisition using their system. We would also like to thank Hesham Sadek from University of Texas Southwestern Medical Center for providing the MR image, and Keith Webster from Baylor College of Medicine for reading the manuscript and providing feedback.
Conflict of interest
The authors declare that the research was conducted in the absence of any commercial or financial relationships that could be construed as a potential conflict of interest.
Publisher’s note
All claims expressed in this article are solely those of the authors and do not necessarily represent those of their affiliated organizations, or those of the publisher, the editors and the reviewers. Any product that may be evaluated in this article, or claim that may be made by its manufacturer, is not guaranteed or endorsed by the publisher.
References
1.
IrionCIWilliamsMCapchaJCEisenbergTLambertGTakeuchiLMet alCol4a3(–/–) Mice on Balb/C background have less severe cardiorespiratory phenotype and SGLT2 over-expression compared to 129x1/SvJ and C57Bl/6 backgrounds.Int J Mol Sci. (2022) 23:6674. 10.3390/ijms23126674
2.
KohutAPatelNSinghH. Comprehensive echocardiographic assessment of the right ventricle in murine models.J Cardiovasc Ultrasound. (2016) 24:229–38. 10.4250/jcu.2016.24.3.229
3.
BrittainEPennerNLWestJHemnesA. Echocardiographic assessment of the right heart in mice.J Vis Exp. (2013) 81:50912. 10.3791/50912
4.
BhattacharyaPTTroutmanGSMaoFFoxALTannaMSZamaniPet alRight ventricular outflow tract velocity time integral-to-pulmonary artery systolic pressure ratio: a non-invasive metric of pulmonary arterial compliance differs across the spectrum of pulmonary hypertension.Pulm Circ. (2019) 9:2045894019841978. 10.1177/2045894019841978
5.
ThibaultHBKurtzBRaherMJShaikRSWaxmanADerumeauxGet alNoninvasive assessment of murine pulmonary arterial pressure: validation and application to models of pulmonary hypertension.Circ Cardiovasc Imaging. (2010) 3:157–63. 10.1161/CIRCIMAGING.109.887109
6.
ShahMPhillipsMRQuintanaMStuppGMcLeanSE. Echocardiography allows for analysis of pulmonary arterial flow in mice with congenital diaphragmatic hernia.J Surg Res. (2018) 221:35–42. 10.1016/j.jss.2017.06.080
7.
BarbierPSolomonSBSchillerNBGlantzSA. Left atrial relaxation and left ventricular systolic function determine left atrial reservoir function.Circulation. (1999) 100:427–36. 10.1161/01.CIR.100.4.427
8.
ColazzoFCastiglioniLSironiLFontanaLNobiliEFranzosiMet alMurine left atrium and left atrial appendage structure and function: echocardiographic and morphologic evaluation.PLoS One. (2015) 10:e0125541. 10.1371/journal.pone.0125541
9.
MedranoGHermosillo-RodriguezJPhamTGranilloAHartleyCJReddyAet alLeft atrial volume and pulmonary artery diameter are noninvasive measures of age-related diastolic dysfunction in mice.J Gerontol A Biol Sci Med Sci. (2016) 71:1141–50. 10.1093/gerona/glv143
10.
TanCRubensonDSrivastavaAMohanRSmithMRBillickKet alLeft ventricular outflow tract velocity time integral outperforms ejection fraction and Doppler-derived cardiac output for predicting outcomes in a select advanced heart failure cohort.Cardiovasc Ultrasound. (2017) 15:18. 10.1186/s12947-017-0109-4
11.
PerezJETOrtiz-UrbinaJHerediaCPPhamTTMadalaSHartleyCJet alAortic acceleration as a noninvasive index of left ventricular contractility in the mouse.Sci Rep. (2021) 11:536. 10.1038/s41598-020-79866-y
12.
LiSNguyenNUNXiaoFMenendez-MontesINakadaYTanWLWet alMechanism of eccentric cardiomyocyte hypertrophy secondary to severe mitral regurgitation.Circulation. (2020) 141:1787–99. 10.1161/CIRCULATIONAHA.119.043939
13.
SallachSReimoldS. Echocardiographic Evaluation of Aortic Regurgitation. In: SolomonSDBulwerBeditors. Essential Echocardiography: Contemporary Cardiology.Totowa, NJ: Humana Press (2007).
14.
Gamaza-ChulianSDiaz-RetaminoECamacho-FreireSRuiz-FernandezDGutierrez-BarriosAOneto-OteroJ. Acceleration time and ratio of acceleration time to ejection time in aortic stenosis: new echocardiographic diagnostic parameters.J Am Soc Echocardiogr. (2017) 30:947–55. 10.1016/j.echo.2017.06.001
15.
YamashitaSSuzukiTIguchiKSakamotoTTomitaKYokooHet alCardioprotective and functional effects of levosimendan and milrinone in mice with cecal ligation and puncture-induced sepsis.Naunyn Schmiedebergs Arch Pharmacol. (2018) 391:1021–32. 10.1007/s00210-018-1527-z
16.
HsuWTTsengYHJuiHYKuoCCWuKKLeeCM. 5-Methoxytryptophan attenuates postinfarct cardiac injury by controlling oxidative stress and immune activation.J Mol Cell Cardiol. (2021) 158:101–14. 10.1016/j.yjmcc.2021.05.014
17.
MoranCMInglisSMcBrideKMcLeodCPyeSD. The imaging performance of diagnostic ultrasound scanners using the edinburgh pipe phantom to measure the resolution integral – 15 years of experience.Ultraschall Med. (2022) 43:393–402. 10.1055/a-1194-3818
18.
El HajjMCVirayMCTedfordRJ. Right heart failure: a hemodynamic review.Cardiol Clin. (2020) 38:161–73. 10.1016/j.ccl.2020.01.001
19.
ThandavarayanRAChitturiKRGuhaA. Pathophysiology of acute and chronic right heart failure.Cardiol Clin. (2020) 38:149–60. 10.1016/j.ccl.2020.01.009
Summary
Keywords
echocardiography, mitral regurgitation, mitral stenosis, pulmonary regurgitation, aortic regurgitation, cardiovascular disease, left ventricular outflow tract, right ventricular outflow tract
Citation
Todd EA, Williams M, Kamiar A, Rasmussen MA and Shehadeh LA (2022) Echocardiography protocol: A tool for infrequently used parameters in mice. Front. Cardiovasc. Med. 9:1038385. doi: 10.3389/fcvm.2022.1038385
Received
07 September 2022
Accepted
29 November 2022
Published
21 December 2022
Volume
9 - 2022
Edited by
Ryo Torii, University College London, United Kingdom
Reviewed by
Alexis Théron, Assistance Publique - Hôpitaux de Marseille, France; Marius Keller, Tübingen University Hospital, Germany
Updates
Copyright
© 2022 Todd, Williams, Kamiar, Rasmussen and Shehadeh.
This is an open-access article distributed under the terms of the Creative Commons Attribution License (CC BY). The use, distribution or reproduction in other forums is permitted, provided the original author(s) and the copyright owner(s) are credited and that the original publication in this journal is cited, in accordance with accepted academic practice. No use, distribution or reproduction is permitted which does not comply with these terms.
*Correspondence: Lina A. Shehadeh, lshehadeh@med.miami.edu
†These authors have contributed equally to this work
This article was submitted to Cardiovascular Imaging, a section of the journal Frontiers in Cardiovascular Medicine
Disclaimer
All claims expressed in this article are solely those of the authors and do not necessarily represent those of their affiliated organizations, or those of the publisher, the editors and the reviewers. Any product that may be evaluated in this article or claim that may be made by its manufacturer is not guaranteed or endorsed by the publisher.