 Xiao Bi1†‡
 Baixuan Xu1*‡
 Jiajin Liu1†
 Guanyun Wang1†
 Jing An2
 Xiaojun Zhang1
 Ruimin Wang1
 Wei Dong3*†
 Zhiwei Guan1,4*
- 1Department of Nuclear Medicine, The First Medical Centre, Chinese PLA General Hospital, Beijing, China
- 2Department of Cardiology, The Sixth Medical Centre, Chinese PLA General Hospital, Beijing, China
- 3Siemens Healthcare Ltd., Guangdong, China
- 4National Clinical Research Center for Geriatric Diseases, Chinese PLA General Hospital, Beijing, China
Background: The thioflavin T derivative, 11C-Pittsburgh-B (PIB), is used for Alzheimer's disease imaging because it specifically binds to β-amyloid protein deposits in the brain. The aim of this study was to estimate the diagnostic value of combined 11C-PIB positron emission tomography/magnetic resonance (PET/MR) in cardiac amyloidosis (CA).
Methods: We enrolled 23 heart failure patients with suspected CA based on echocardiographic and electrocardiograph findings. All patients underwent cardiac 11C-PIB PET/MR and non-cardiac biopsy within one week. We also enrolled eight healthy volunteers that underwent cardiac 11C-PIB PET/MR as a control group. The cardiac magnetic resonance (CMR) protocol included cine imaging, late gadolinium enhancement (LGE), and native and post-contrast T1 mapping. Extracellular volume (ECV) was measured using pre- and post-contrast T1 mapping images. LVEF, IVSD, LVPW, LVmass, LVESV, LVEDV, native T1 value, ECV, and maximum uptake of myocardial tissue-to-blood background ratio (TBR) values were obtained from PET/MR images in all patients and healthy subjects.
Results: Thirteen out of twenty-three heart failure patients were clinically diagnosed with CA. The remaining 10 patients were CA-negative (non-CA patient group). Twelve of the thirteen CA patients showed diffuse transmural LGE patterns, whereas LGE was either absent or patchy in the non-CA patients. The diagnostic sensitivity and specificity of TBRmax were 92.3 and 100%, respectively, at a cut-off value of 1.09. Several CMR imaging parameters (LVEF, IVSD, LVmass, LVEDV, LVESV, LVPW, native T1 value and ECV) and TBR showed significant differences between CA patients, non-CA patients, and healthy controls (P < 0.05). Native T1 mapping values positively correlated with TBRmax values in CA and non-CA patients (r = 0.38, P = 0.0004).
Conclusions: 11C-PIB PET/MRI is a valuable tool for the accurate and non-invasive diagnosis of CA because it distinguishes CA patients from non-CA patients and healthy subjects with high specificity and sensitivity. Moreover, native T1 mapping values positively correlated with TBRmax values in CA and non-CA patients. In the future, larger cohort studies are necessary to confirm our findings.
Introduction
Amyloidosis refers to a group of systemic diseases caused by extracellular and/or intracellular accumulation of insoluble misfolded amyloid protein fibrils, which progressively damage the structure and function of related organs (1). Cardiac amyloidosis (CA) is a type of restrictive cardiomyopathy caused by the accumulation of misfolded amyloid protein deposits in the myocardium (2). Heart failure is the main cause of death and morbidity in CA patients, which manifests either as a primary disease or as part of systemic amyloidosis (3). Endocardial biopsy (EB) is the current gold standard for the clinical diagnosis of myocardial amyloidosis (4). However, EB is an invasive procedure that cannot be performed routinely. EB is also associated with high false-negative biopsy interpretation rates. Moreover, it does not provide sufficient clinical information regarding the status of the disease and is not effective for determining prognosis or response to treatment.
Cardiovascular magnetic resonance (CMR) imaging with late gadolinium enhancement (LGE) is the most commonly performed non-invasive technique for characterizing myocardial tissue abnormalities in a wide spectrum of cardiomyopathies (5). Although multiple LGE distributions have been described for cardiac amyloidosis, sub-endocardial and transmural LGE patterns are most commonly observed in cardiac amyloidosis and serve as diagnostic markers (6). However, LGE-CMR is not amenable for the early recognition of mild myocardial amyloidosis during differential diagnosis (7, 8). LGE-CMR is also not suitable for suspected CA patients with severe renal impairment (9, 10). Non-contrast T1 mapping is performed before administering contrast agents to quantify the direct signal from the myocardium (11). Several studies have shown that native T1 values are slightly elevated in focal and diffuse fibrosis (12, 13), edema, and inflammation (14). Boomen et al. reported that myocardial T1 values were significantly higher for patients with amyloidosis, including those without any confirmed cardiac involvement through biopsy or decreased cardiac function (15). However, a major disadvantage of native T1 mapping is that the results can vary significantly based on the type of scanners and magnetic field intensities (1.5T vs. 3T) used for the analysis. ECV (extracellular volume) is another early marker of cardiac involvement in patients with amyloidosis (confirmed by biopsy) and is more reproducible than absolute T1 values (16). However, in the absence of biopsy confirmation, ECV values may overlap with other cardiomyopathy pathologies and limit the specificity of ECV in the early detection of amyloidosis (8).
The thioflavin-T derivate, 11C-Pittsburgh B (PIB), is used for the diagnostic imaging of patients with Alzheimer's disease because it binds with high-affinity to fibrillar β-amyloid protein deposits in the brain (17). Amyloid positron emission tomography (PET) imaging can be used for quantitative analysis of cardiac amyloidosis because it shows high sensitivity and specificity for amyloid protein deposits (18). This feature can be useful for the early diagnosis of CA.
The aim of this study was to assess the diagnostic accuracy of combined 11C-PIB positron emission tomography/magnetic resonance (PET/MR) in a cohort of patients with heart failure and suspected cardiac amyloidosis.
Materials and Methods
Patients
Twenty-three patients with heart failure and suspected CA diagnosed with echocardiography and electrocardiograph were enrolled in this retrospective study at the First Medical Center of PLA General Hospital between May 1, 2017 and December 31, 2019. Diagnostic criteria included the thickening of the wall of the ventricular septum plus any two of the following criteria: (a) Ultrasound showed characteristic enhanced echo, such as Granular echo, Speckled echo or Ground glass echo; (b) Unexplained low voltage <0.5 mV in the limb leads of the 12-lead electrocardiogram; (c) Left ventricular diastolic function decreased; (d) or Left atrium enlarged. A series of 11C-PIB PET/MR, echocardiography, extra-cardiac biopsy, and laboratory tests were performed. Eight healthy volunteers without any signs or symptoms of cardiac disease were also enrolled (5 males and 3 females; age range: 41–65 y). The non-CA patients and healthy subjects were considered as the control group. We compared 11C-PIB uptake in the myocardium and the values of several CMR imaging parameters between the patients with CA and control subjects to establish cutoff values. Written informed consent was obtained from all patients prior to recruitment. This study was approved by the Human Ethics Committee of the Chinese PLA General Hospital.
11C-PIB PET/MR Scanning Parameters
Simultaneous 11C-PIB PET and CMR of the heart were performed using a 3T hybrid PET/MR system (Biograph mMR, Siemens Healthineers, Erlangen, Germany). All study subjects were injected with 555 MBq of 11C-PIB through the antecubital vein, and PET data was acquired in list mode using a 20 min table time. The acquisition was started 30 mins after the administration of 11C-PIB. PET images were reconstructed with a 256 × 256 matrix with the ordered-subset expectation maximization method (4 iterations, 8 subsets), and post-smoothing was performed using a 4 mm Gaussian filter. PET images of 5 mm slice thicknesses were then displayed along the transversal, coronal, and sagittal planes. Attenuation correction was performed using the respiratory-gated 2-point Dixon sequence, which was acquired before injection of the gadolinium contrast medium. The Dixon imaging parameters were as follows: repetition time (TR) = 3.6 ms; echo time (TE)1 = 1.23 ms; TE2 = 2.46 ms; field-of-view = 500 × 500 mm; and flip angle (FA) = 10°.
Each CMR series was acquired during the expiratory phase with breath holding. The heart was localized by first acquiring two-dimensional (2D) scout images in the transversal, coronal, and sagittal planes. CMR cine images were acquired using ECG-gated 2D-segmented balanced steady-state free precession (bSSFP) sequence. Two-, three-, and four-chamber long-axis and 10–12 short-axis slices covering the LV were acquired to evaluate cardiac motion and function. The key parameters were as follows: TR/TE = 3.3/1.43; FA = 55°–70°; voxel size = 1.6 × 1.6 × 6.0 mm3; temporal resolution = 45.6 ms; bandwidth = 962 Hz/pixel. The 5(3)3 and 4(1)3(1)2 MOLLI sequence acquisition schemes were used for native T1 and post-contrast T1 mapping, respectively. Identical images were obtained from the basal, mid, and apical short axis slices of the ventricle and the 4-chamber long-axis slices (19, 20). The parameters were as follows: TR/TE = 2.7/1.12 ms; FA = 35°; voxel size = 1.4 × 1.4 × 8.0 mm3. LGE images were generated using a 2D phase-sensitive inversion-recovery (PSIR) gradient-echo pulse sequence with the following parameters: TR/TE = 5.2/1.96 ms FA = 20°; voxel size = 1.4 × 1.4 × 8.03 mm.
PET/MRI Analysis
PET activity was measured within the LV myocardium by analyzing fused and co-registered PET and LGE-MR images. Myocardial PET uptake was quantified using standard uptake values (SUV) and target-to-background ratio (TBR) after correcting for the blood-pool activity in the descending thoracic aorta. The standard uptake value (SUV) of the myocardium was measured by drawing the contour of the whole LV at an approximate thickness of 10 mm from base to apex. Maximal SUV (SUVmax) was defined as the voxel with the highest uptake among all the volumes of interest (VOIs) analyzed. Mean SUV (SUVmean) was defined as the average SUV of the total voxels in the VOI. The maximal myocardium to blood cavity ratio (TBRmax) was defined as the maximal SUV of the myocardial VOI divided by the mean SUV of the descending thoracic aorta VOI.
CMR functional parameters, native T1, and ECV were measured semi-automatically using a dedicated CMR software, cvi42 version 5.3 (Circle Cardiovascular Imaging, Calgary, Canada) (5). LV ejection fraction (LVEF) and standard parameters of the cardiac structure such as LV mass, ventricle volume, inter-ventricular septum thickness (IVSD), and left ventricular posterior wall thickness (LVPW) were measured by tracing the endocardial and epicardial borders in the long-axis and short axis cine images at the end-systolic and end-diastolic timepoints. T1 values of global LV were obtained by drawing contours around the endocardium and epicardium as well as indicating the inter-ventricular septum on pre-contrast T1 mapping images with indexing for the hematocrit. Native T1 and ECV of global LV were measured by drawing contours around the endocardium and epicardium as well as indicating the inter-ventricular septum on pre-contrast and post-contrast T1 mapping images with indexing for the hematocrit. Global LV native T1 and ECV values were used for further analyses. All 11C-PIB PET/MR images were analyzed independently by two experienced investigators in nuclear medicine independently. All disagreements were resolved in consultation with a third investigator.
Statistical Analysis
The continuous variables are presented as means ± SD and compared between control and CA patient groups using the Mann–Whitney U test. Receiver operating characteristic (ROC) curves were used to determine the diagnostic TBRmax and native T1 values for CA. Spearman's correlation analysis was performed to determine the degree of association (Spearman's r value) between native T1 value and TBRmax. P < 0.05 was considered statistically significant. All statistical analyses were performed using the R 4.0.1 Statistical Package (the R foundation for Statistical Computing, Vienna, Austria) and SPSS software v.24.0 (Statistical Package for Social Science; IBM, Chicago, IL, USA).
Results
Baseline Characteristics
Among the 23 enrolled patients with heart-failure suspected of having CA, thirteen patients were diagnosed with CA. Ten patients with CA were diagnosed by typical non-invasive detection of cardiac involvement by CMR LGEs and positive Congo-red staining of abdominal fat pad biopsies and bone marrow; 2 patients with CA were diagnosed by diffuse sub-endocardial or transmural LGEs and at least one of the monoclonal protein tests being reported as abnormal (21); 1 patient with CA was diagnosed by a positive abdominal fat pad biopsy, positive genetic test for amyloid, and typical echocardiography patterns, including >12 mm thick left ventricular wall and the appearance of grain scintillation in the myocardial wall. The remaining 10 cases were diagnosed as different types of cardiomyopathy: dilated cardiomyopathy (DCM, n = 2), rheumatic heart disease (RHD, n = 1), valvular heart disease (VHD, n = 1), hypertensive heart disease (HHD, n = 3), and hypertrophic cardiomyopathy (HCM, n = 3). The baseline characteristics of the enrolled patients are summarized in Table 1.
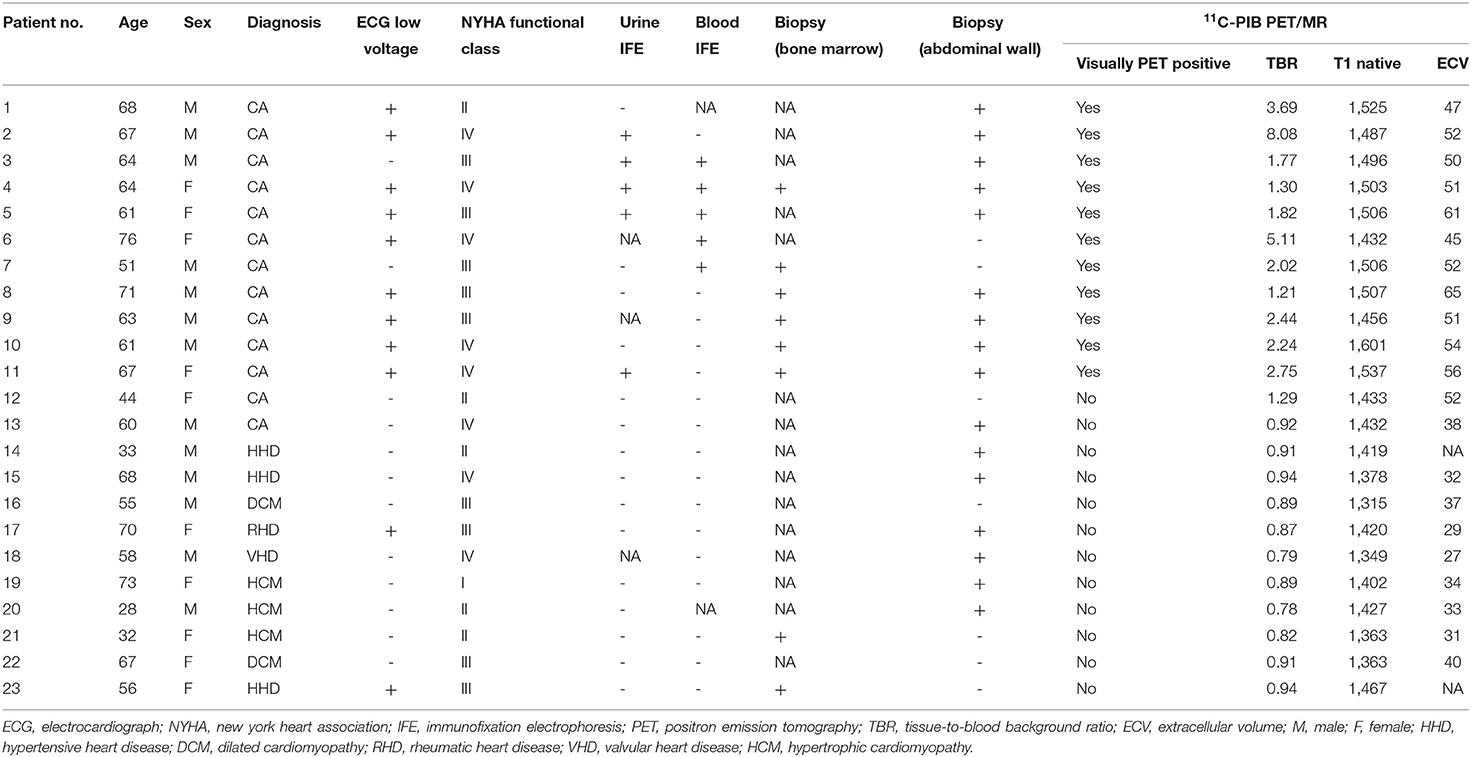
Table 1. Comparison of the baseline clinical data and 11C-PIB PET/MR parameters between patients with and without cardiac amyloidosis (CA).
Comparison of Clinical and Biochemical Biomarkers Between CA and Non-CA Patients
We did not observe any significant differences in age between CA patients, non-CA patients, and healthy subjects (P > 0.05). The BMI values of non-CA patients were significantly higher compared with the CA patients and healthy subjects (P = 0.033). We also did not observe any significant differences in the serum cardiac troponin-I (cTnI), calcium, and creatinine values between CA patients and non-CA patients (P > 0.05). CA patients showed significantly higher levels of NT-proBNP (13011.46 ± 11726.99 pg/mL vs. 4709.30 ± 5428.82 pg/mL, P = 0.036) and blood-free light chain kappa/lambda (1.88 ± 5.77 vs. 0.85 ± 0.31 mg/dL, P = 0.021) compared with the non-CA patients. The 13 CA patients were classified under NYHA classification I (n = 0), II (n = 2), III (n = 5), and IV (n = 6), respectively (Table 2).
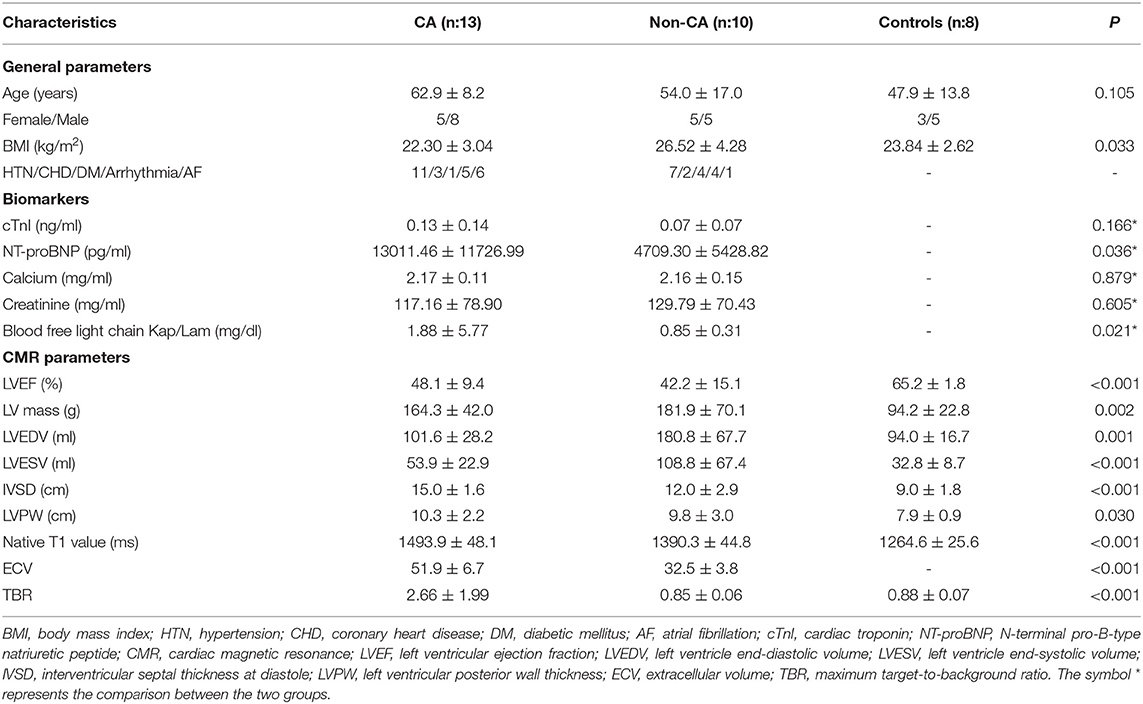
Table 2. Baseline clinical characteristics of patients with cardiac amyloidosis (CA), those without CA (non-CA), and healthy control subjects.
The Echocardiography Diagnositic Parameters and PET/MR Structural and Functional Parameters
The echocardiography data for CA patients and non-CA patients are summarized in Table 3. There were no differences in the echocardiographic parameters between the CA patients and the non-CA patients, except for a significant difference in the LV end-diastolic volume (83.2 ± 28.4 vs. 134.4 ± 44.0 ml, P < 0.05). We observed significant differences among several CMR parameters (LVEF, IVSD, LVmass, LVEDV, LVESV, LVPW, native T1 value, and ECV) and TBR between CA patients, non-CA patients, and healthy subjects (P < 0.05; Table 2). PET data showed that the maximal myocardial 11C-PiB uptake was significantly higher in the CA patients compared with the non-CA patients and healthy subjects (0.88 ± 0.07) (2.66 ± 1.99 vs. 0.85 ± 0.06 vs. 0.88 ± 0.07; P < 0.05; Figure 1A). The native T1 values were significantly higher in the CA patients compared with the non-CA and healthy subjects (1493.9 ± 48.1 vs. 1390.3 ± 44.8 vs. 1264.6 ± 25.6; P < 0.05; Figure 1B). The ECV values were significantly higher for the CA patients compared with the non-CA patients (51.9 ± 6.7 vs. 32.9 ± 4.2; P < 0.05; Figure 1C).
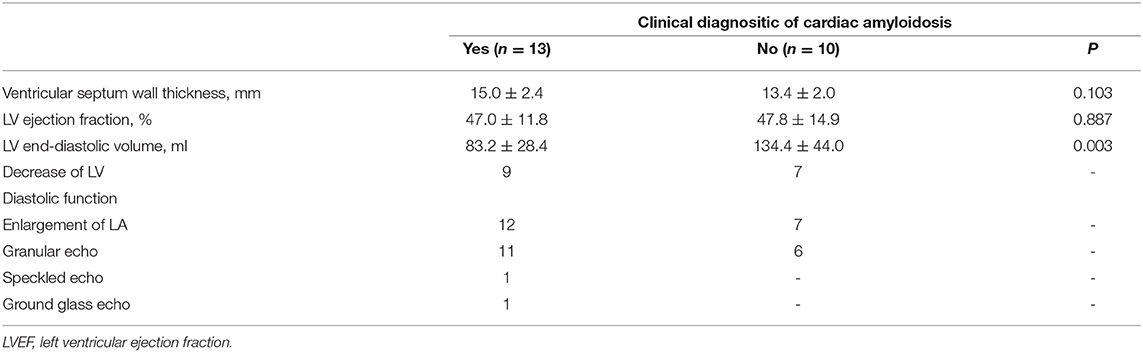
Table 3. Echocardiography data from CA patients and non-CA patients.

Figure 1. Comparison of (A) TBR, (B) T1 mapping, and (C) ECV values between CA patients, non-CA patients, and healthy control subjects. CA, cardiac amyloidosis; TBR, maximum target-to-background ratio; ECV, extracellular volume. (A) PET data showed that the TBR was significantly higher in the CA patients compared with the non-CA patients and healthy subjects (2.66 ± 1.99 vs. 0.85 ± 0.06 vs. 0.88 ± 0.07; P < 0.05). (B) The native T1 values were significantly higher in the CA patients compared with the non-CA and healthy subjects (1493.9 ± 48.1 vs. 1390.3 ± 44.8 vs. 1264.6 ± 25.6; P < 0.05). (C) The ECV values were significantly higher for the CA patients compared with the non-CA patients (51.9 ± 6.7 vs. 32.9 ± 4.2; P < 0.05).
Twelve of the thirteen CA patients showed characteristic LGE patterns including diffuse transmural myocardial enhancement, typical subendocardial ring enhancement, and heterogeneous transmural LGE pattern. Only one patient did not show any characteristic LGE pattern. Gadolinium-enhanced CMR was not performed in 2 non-CA patients because of significant azotemia (creatinine clearance < 30 ml/kg/min). In the remaining 8 non-CA patients, we observed patchy LGE enhancement patterns including discrete areas of LGE or diffuse areas of LGE in less than half of the short axis images (Table 4). LGE patterns, T1 mapping, and PET images of a representative CA patient are shown in Figure 2. Visual inspection of PET images demonstrated positive 11C-PIB uptake in 12 out of 13 CA patients. However, none of the non-CA patients and healthy subjects showed any visible 11C-PIB uptake.
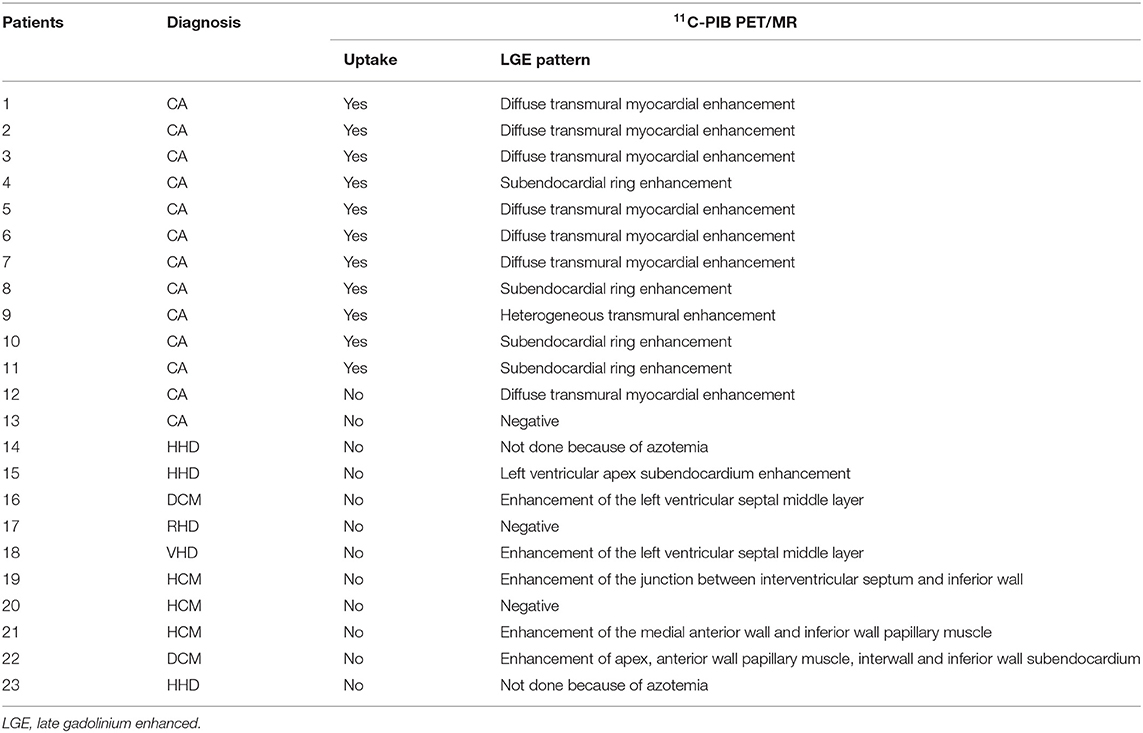
Table 4. Baseline late gadolinium enhancement (LGE) patterns for all cardiac amyloidosis (CA) and non-CA patients based on 11C-PIB PET/MR data.
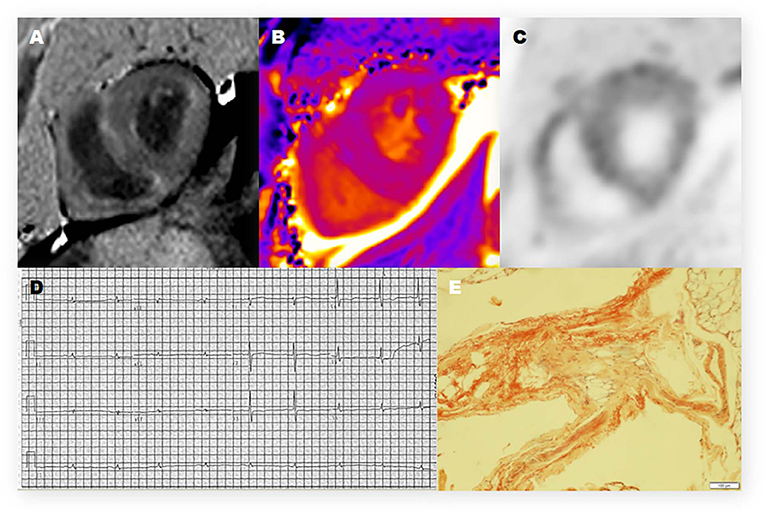
Figure 2. Representative 11C-PiB PET/MR, electrocardiogram, and histologic photomicrograph of one CA patient. (A) Late-gadolinium enhancement (LGE)-CMR image demonstrates a diffuse transmural enhancement pattern. (B) Native T1 mapping shows that the myocardial T1 value was 1,569 ms. (C) The PET/MR image of the myocardium shows strong uptake of 11C-PIB in the left ventricle (LV) and right ventricle (RV). (D) The electrocardiogram (12-lead) shows low voltage in the limb leads. (E) Histopathologic examination shows positive Congo red staining and amyloid deposits in the adipose tissue.
ROC curve analysis using a TBR cutoff value of 1.09 showed that the area under the curve (AUC) value for discriminating CA patients from the controls (10 non-CA patients and 8 healthy subjects) was 0.99 (95% CI: 0.96–1.00) with a sensitivity of 92% (95% CI: 62–100%) and specificity of 100% (95% CI: 78–100%) (Table 4). The positive predictive value (PPV) using a TBR cutoff value of 1.09 was 100% (95% CI: 70–100%) and the negative predictive value (NPV) was 95% (95% CI: 72–100%). The PPV, AUC, sensitivity, and specificity values for both ECV and TBR were similar at the ECV cutoff value of 42.5, but NPV [89% (95% CI: 51%–99%)] was lower than TBR. The AUC value for discriminating CA patients from controls using a T1 mapping cutoff value of 1,429.5 was 0.98 (95% CI: 0.96–1.00) with a sensitivity of 100% (95% CI: 72–100%) and specificity of 94% (95% CI: 71–100%). The positive predictive value with this cutoff was 93% (95% CI: 64–100%) and the negative predictive value was 100% (95% CI: 77–98%). The other CMR parameters are shown in Table 5.
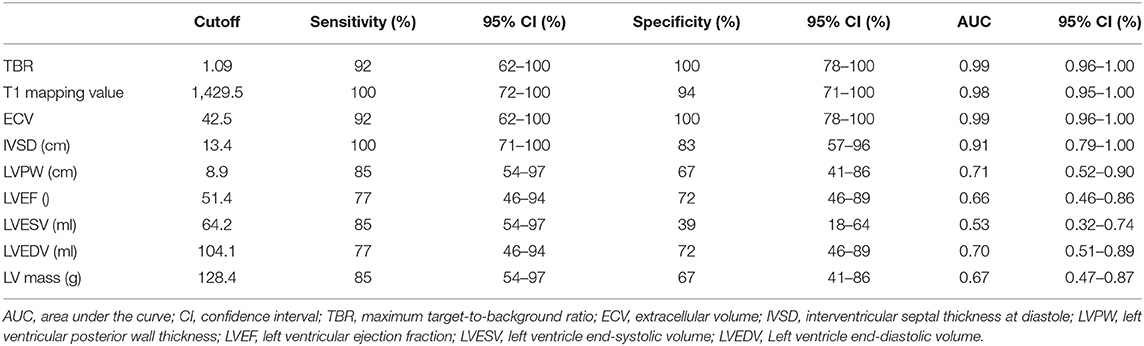
Table 5. Differential diagnostic efficiency of TBR and CMR parameters between cardiac amyloidosis (CA) patients and control subjects (non-CA patients‘ and healthy subjects).
False-positive 11C-PIB PET/MR scan results were not observed in any of the non-CA patients and healthy subjects using a TBR cut-off value of 1.09. In contrast, one CA patient (Patient #13) showed a false-negative 11C-PIB PET/MR result (maximal LV myocardium to blood cavity ratio of 0.92) (Figure 3). We observed positive ECV and native T1 mapping values in a PET-negative CA patient who did not show a typical CMR LGE pattern for cardiac amyloidosis, thereby prompting false-positive diagnosis of CA. We did not observe any false positive cases in the non-CA and healthy control groups with a ECV cut-off value of 42.5, but the CA patient with false-negative 11C-PIB (Patient #13) also showed false-negative ECV result. None of the CA patients were false-negative and none of the healthy subjects were false-positive when the cut-off value for native T1 mapping was 1,429.5 ms However, one non-CA patient showed false-positive result because the native T1 mapping value was 1467 ms. The 11C-PIB PET result of this patient was negative, and MR LGE was not performed on this patient because of renal insufficiency. A positive correlation between native T1 mapping value and TBR in CA and non-CA patients was also observed (r = 0.38, P = 0.0004, Figure 4).
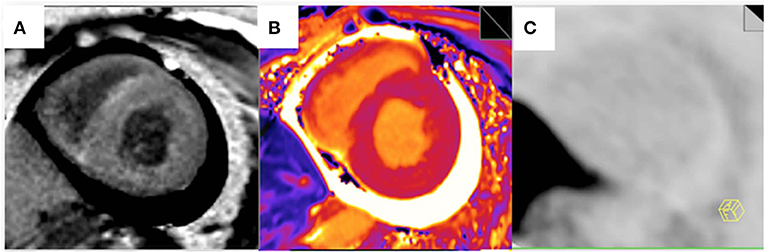
Figure 3. Myocardial LGE, T1 mapping, and PET images from the false-negative CA patient. (A) A late gadolinium enhancement image shows a diffuse transmural delayed enhancement pattern in the myocardium. (B) The native T1 value was 1,401 ms. (C) 11C-PiB PET staining of the myocardium was negative.
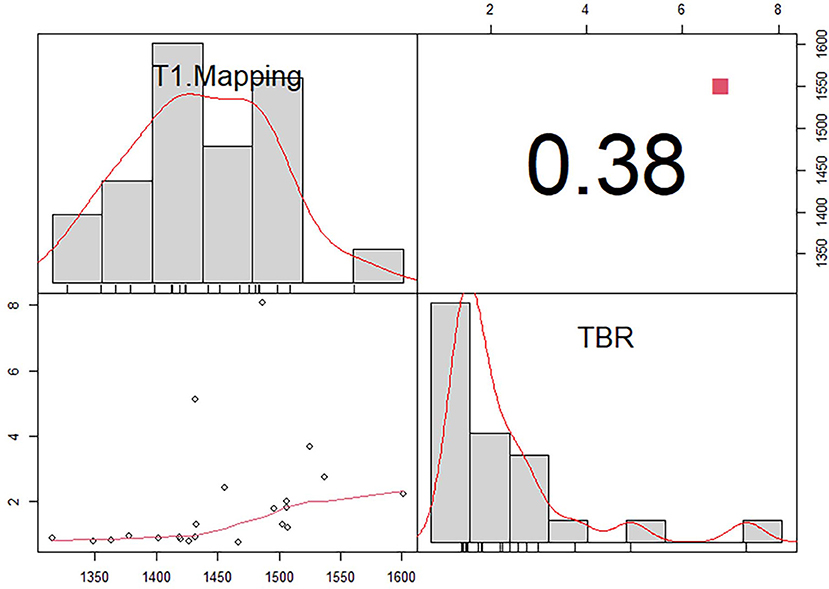
Figure 4. Correlation between T1 mapping and maximum target-to-background ratio (TBR) in patients with (CA) and without cardiac amyloidosis (non-CA).There is a positive correlation between native T1 mapping value and TBR in CA and non-CA patients (r = 0.38, P = 0.0004).
Discussion
Our study demonstrated that 11C-PIB PET/MR was a highly sensitive and accurate method to confirm cardiac amyloidosis. Moreover, we demonstrated that a combination of TBRmax values derived from 11C-PIB PET scans, T1 mapping values, and ECV values derived from CMR can be used for accurate diagnosis of CA.
CA is caused by extracellular and intracellular accumulation of insoluble and misfolded fibrillar amyloid protein and shows clinical features resembling restrictive cardiomyopathy (2). Endomyocardial biopsy, the gold standard for diagnosis of CA, is invasive and cannot be performed routinely (22). Moreover, focal myocardial biopsy does not provide information regarding the overall myocardial amyloid load and active accumulation of the amyloid protein. Therefore, there is an urgent need for techniques that can accurately and non-invasively confirm cardiac amyloidosis in clinical settings. Previous studies (23, 24) have demonstrated that 11C-PIB PET/CT is a valuable tool for the non-invasive diagnosis of CA with ≥ 95% sensitivity and specificity (18). Our study showed that 11C-PIB PET distinguishes CA patients from both non-CA patients and healthy controls with 94% sensitivity and 100% specificity. Moreover, 11C-PIB-PET was 99% accurate in the positive diagnosis of CA. Rosengren et al. demonstrated that 11C-PIB-PET detected CA in different amyloid subtypes with 89 to 100% accuracy in a dual-center setting (25). Therefore, our results are consistent with these previous findings and suggest that 11C-PIB PET is an independent diagnostic indicator of CA.
LGE-CMR has shown great promise in clinical diagnosis and prognosis because it offers high spatial resolution and the ability to identify pathology in the extracellular space (26). CA patients show diverse patterns of late gadolinium enhancement, such as global subendocardial enhancement, transmural LGE, and patchy focal LGE. In some CA cases, it is very difficult to quantify the degree of abnormality based on LGE-CMR. A recent meta-analysis of seven published studies showed that the accuracy of CMR-based LGE in the positive diagnosis of CA was high with 85% sensitivity and 92% specificity. In our study, 12 out of 13 CA patients showed global left ventricular LGE, a typical enhancement pattern of cardiac amyloidosis. In non-CA patients, we did not observe any typical CA enhancement. However, some patients showed patchy enhancement characteristics, which were indistinguishable from non-CA patients.
The native T1 value has been proposed as a quantitative parameter for evaluating CA with diffuse disease. Furthermore, native T1 mapping eliminates the need for gadolinium and can be used as an alternative method for assessing CA patients with renal insufficiency (27). ECV is more reproducible than absolute T1 mapping values. Moreover, ECV is more advantageous than LGE because it can quantify expansion of the extracellular space based on the region of interest drawn on the ECV maps. Our study showed that the diagnostic accuracy of native T1 values and ECV were significantly higher than the other CMR parameters, with the AUC value of ECV being the highest. However, at a molecular level, both native T1 mapping and ECV are not specific to amyloidosis (6, 28). In contrast, 11C-PIB PET is a useful method for direct evaluation of overall myocardial amyloid load in cardiac amyloidosis. In our study, the diagnostic accuracy of both TBR and ECV was 99%. Native T1 showed higher sensitivity (100 vs. 94%) and lower specificity (94 vs. 100%) than TBR and ECV. In our study, one CA patient (Patient #13) was false-negative for both 11C-PIB PET and ECV. The CMR result of this patient did not show any LV LGE, but the nativeT1 mapping results were positive. Therefore, patient #13 was positively diagnosed as CA based on the native T1 mapping data. The cases of patients #14 and #23 demonstrated unique superiority of 11C-PIB PET for differential diagnosis of cardiac amyloidosis from other cardiomyopathies in the setting of significant azotemia, a clinical condition that prevents contrast-enhanced CMR from being performed. Although the native T1 mapping results were positive for patient #23, the PET results were negative. Therefore, patient #23 was classified as non-CA based on the PET results.
We also analyzed the correlations between TBR values derived from 11C-PIB PET and native T1. Our analysis showed that TBR and native T1 in PET/MR can be used to diagnose CA patients that cannot undergo delayed enhancement because of renal insufficiency. Hence, the combination of the 2 diagnostic indices played a complementary role and improved the diagnostic accuracy of CA. We did not obtain ECV values for some patients who did not undergo delayed enhancement. Both ECV and TBR showed the same AUC (0.99), sensitivity (92%), specificity (100%) and PPV (100%). However, ECV showed lower NPR compared with TBR (89 vs. 95%). This suggested that ECV can be used as an independent diagnostic index for CA.
There are several limitations to this study. Firstly, the sample size of study subjects was small. Therefore, our results need to be confirmed in large cohort studies. Secondly, we could not complete typing of myocardial amyloidosis in this study because (1) endomyocardial biopsies were not performed for some patients; (2) bone marrow biopsies were performed for only a few patients; and (3) laboratory tests for urine and blood IFE were not performed for all patients. Fontana et al. (29) showed that native T1 values were relatively higher, and ECV values were lower patients with immunoglobulin light chain amyloidosis compared with those with transthyretin amyloidosis (ATTR). Ezawa and Katoh (24) showed that 11C-PIB uptake was lower in patients with ATTR compared with the patients with AL. Therefore, the diagnostic value of 11C-PIB PET/MR imaging for CA requires further evaluation according to the cardiac amyloidosis type because the underlying mechanisms are not completely known. Finally, normal ranges vary for different CMR systems and T1 mapping sequences (30). Normal T1 values are higher when measured at 3T with different sequences and typically with newer versions of mapping compared with older ones. This is a significant obstacle to using native T1 mapping in clinical practice. Therefore, uniform guidelines and normal ranges need to be established for different CMR techniques and sequences so that data can be compared between different patients that have undergone MRI scans at different facilities.
Although endomyocardial biopsy is the golden standard for diagnosis of CA, extrapolating the amyloid content in line with the biopsy sample to the entire heart may be inaccurate, especially in the early CA when the amyloid deposits may not be extensive or diffuse (31). Quantification of amyloid burden is currently based on assessment of wall thickness, LV mass, ECV, or semi-quantitative index on amyloid PET imaging (32). 11C-PIB PET/MR offers substantial advantages. It is non-invasive, quantitative, fuses quantitative parameters of PET and MR to estimate whole-heart cardiac amyloid burden, and can be easily repeated to monitor response to therapy. For patients clinically suspected of CA with heart failure 11C-PIB PET/MR is valuable in CA patients with contraindications to gadolinium (due to renal dysfunction). Our study confirms that 11C-PIB PET/MR multi-parameter imaging provides additional evidence for the diagnosis of CA in the absence of LGE. Moreover, the high sensitivity and specificity of 11C-PIB PET/MR make it possible to detect CA early.
Conclusions
In conclusion, this study showed that 11C-PIB PET/MR accurately diagnosed cardiac amyloidosis with high sensitivity and specificity. 11C-PIB PET/MR showed structural and functional changes in CA patients and helped to accurately determine the location and extent of amyloid protein deposition. Our study also demonstrated the advantages of using multiple parameters and multi-sequence imaging characteristics of CMR in combination with the high specificity of 11C-PIB PET for the accurate diagnosis of CA.
Data Availability Statement
The raw data supporting the conclusions of this article will be made available by the authors, without undue reservation.
Ethics Statement
The studies involving human participants were reviewed and approved by the Human Ethics Committee of the Chinese PLA General Hospital. The patients/participants provided their written informed consent to participate in this study. Written informed consent was obtained from the individual(s) for the publication of any potentially identifiable images or data included in this article.
Author Contributions
XB, JL, WD, JA, RW, BX, and ZG: conception and design. XB, JL, XZ, and WD: data collation. XB, JL, and GW: statistical Analysis. XB and JL: article writing. GW, JA, WD, BX, and ZG: article revision. All authors contributed to the article and approved the submitted version.
Funding
Granting agencies: National Clinical Research Center for Geriatric Diseases, Chinese PLA General Hospital. Grant number: NCRCG-PLAGH-2019012.
Conflict of Interest
JA is employed at Siemens Healthcare Ltd.
The remaining authors declare that the research was conducted in the absence of any commercial or financial relationships that could be construed as a potential conflict of interest.
Publisher's Note
All claims expressed in this article are solely those of the authors and do not necessarily represent those of their affiliated organizations, or those of the publisher, the editors and the reviewers. Any product that may be evaluated in this article, or claim that may be made by its manufacturer, is not guaranteed or endorsed by the publisher.
Acknowledgments
I would like to thank JL, ZG, WD, BX, JA, and RW for their guidance to me in the experimental design. I would also like to thank JL, XZ, and WD for their help in patient enrollment and data collection. Thanks to GW for his support in data processing. I would like to thank JL for guiding me in writing PET/MR related technologies. I would like to thank GW, ZG, WD, BX, and JA for carefully revisingmy article. Thanks to everyone's help and joint efforts, we have completed this meaningful article.
References
1. Merlini G, Bellotti V. Molecular mechanisms of amyloidosis. N Engl J Med. (2003) 349:583–96. doi: 10.1056/NEJMra023144
2. Rapezzi C, Merlini G, Quarta CC, Riva L, Longhi S, Leone O, et al. Systemic cardiac amyloidoses: disease profiles and clinical courses of the 3 main types. Circulation. (2009) 120:1203–12. doi: 10.1161/CIRCULATIONAHA.108.843334
3. Yusuf SW, Solhpour A, Banchs J, Lopez-Mattei JC, Durand JB, Iliescu C, et al. Cardiac amyloidosis. Expert Rev Cardiovasc Ther. (2014) 12:265–77. doi: 10.1586/14779072.2014.876363
4. Bokhari S, Shahzad R, Castano A, Maurer MS. Nuclear imaging modalities for cardiac amyloidosis. J Nucl Cardiol. (2014) 21:175–84. doi: 10.1007/s12350-013-9803-2
5. Lin L, Li X, Feng J, Shen KN, Tian Z, Sun J, et al. The prognostic value of T1 mapping and late gadolinium enhancement cardiovascular magnetic resonance imaging in patients with light chain amyloidosis. J Cardiovasc Magn Reson. (2018) 20:2. doi: 10.1186/s12968-017-0419-6
6. Syed IS, Glockner JF, Feng D, Araoz PA, Martinez MW, Edwards WD, et al. Role of cardiac magnetic resonance imaging in the detection of cardiac amyloidosis. JACC Cardiovasc Imaging. (2010) 3:155–64. doi: 10.1016/j.jcmg.2009.09.023
7. Barison A, Aquaro GD, Pugliese NR, Cappelli F, Chiappino S, Vergaro G, et al. Measurement of myocardial amyloid deposition in systemic amyloidosis: insights from cardiovascular magnetic resonance imaging. J Intern Med. (2015) 277:605–14. doi: 10.1111/joim.12324
8. Mongeon FP, Jerosch-Herold M, Coelho-Filho OR, Blankstein R, Falk RH, Kwong RY, et al. Quantification of extracellular matrix expansion by CMR in infiltrative heart disease. JACC Cardiovasc Imaging. (2012) 5:897–907. doi: 10.1016/j.jcmg.2012.04.006
9. Bollée G, Guery B, Joly D, Snanoudj R, Terrier B, Allouache M, et al. Presentation and outcome of patients with systemic amyloidosis undergoing dialysis. Clin J Am Soc Nephrol. (2008) 3:375–81. doi: 10.2215/CJN.02470607
10. Lachmann HJ, Gillmore JD. Renal amyloidosis. Br J Hosp Med. (2010) 71:83–6. doi: 10.12968/hmed.2010.71.2.46485
11. Muscogiuri G, Suranyi P, Schoepf UJ, De Cecco CN, Secinaro A, Wichmann JL, et al. Cardiac magnetic resonance T1-mapping of the myocardium: technical background and clinical relevance. J Thorac Imaging. (2018) 33:71–80. doi: 10.1097/RTI.0000000000000270
12. aus dem Siepen F, Buss SJ, Messroghli D, Andre F, L ossnitzer D, Seitz S, et al. T1 mapping in dilated cardiomyopathy with cardiac magnetic resonance: quantification of diffuse myocardial fibrosis and comparison with endomyocardial biopsy. Eur Heart J Cardiovasc Imaging. (2015) 16:210–6. doi: 10.1093/ehjci/jeu183
13. Ntusi NA, Piechnik SK, Francis JM, Ferreira VM, Rai AB, Matthews PM, et al. Subclinical myocardial inflammation and diffuse fibrosis are common in systemic sclerosis – a clinical study using myocardial T1-mapping and extracellular volume quantification. J Cardiovasc Magn Reson. (2014) 16:21–33. doi: 10.1186/1532-429X-16-21
14. Ferreira VM, Piechnik SK, Dall'Armellina E, Karamitsos TD, Francis JM, Ntusi N, et al. Native T1-mapping detects the location, extent and patterns of acute myocarditis without the need for gadolinium contrast agents. J Cardiovasc Magn Reson. (2014) 16:36–47. doi: 10.1186/1532-429X-16-36
15. Boomen MVD, Slart RHJA, Hulleman EV, Dierckx RAJO, Velthuis BK, van der Harst P, et al. Native T1 Reference Values for Nonischemic Cardiomyopathies and Populations With Increased Cardiovascular Risk: A Systematic Review and Meta- analysis. JMRI. (2017) 47:891–912. doi: 10.1002/jmri.25885
16. Fontana M, White SK, Banypersad SM, Sado DM, Maestrini V, Flett AS, et al. Comparison of T1 mapping techniques for ECV quantification. Histological validation and reproducibility of ShMOLLI versus multi breath-hold T1 quantification equilibrium contrast CMR. J Cardiovasc Magn Res. (2012) 14:88. doi: 10.1186/1532-429X-14-88
17. Nordberg A, Carter SF, Rinne J, Drzezga A, Brooks DJ, Vandenberghe R, et al. A European multicentre PET study of fibrillar amyloid in Alzheimer's disease. Eur J Nucl Med Mol Imaging. (2013) 40:104–14. doi: 10.1007/s00259-012-2237-2
18. Kim Y J, Ha S, Kim Y. Cardiac amyloidosis imaging with amyloid positron emission tomography: a systematic review and meta-analysis. J Nucl Cardiol. (2018) 27:123–32. doi: 10.1007/s12350-018-1365-x
19. Kellman P, Hansen MS. T1 mapping in the heart: accuracy and precision. J Cardiovasc Magn Reson. (2014) 16:20. doi: 10.1186/1532-429X-16-2
20. Kellman P, Bandettini WP, Hammer-Hansen S, Hansen MS, Arai AE. Characterization of myocardial T1- mapping bias caused by intramyocardial fat in inversion recovery and saturation recovery techniques. J Cardiovasc Magn Reson. (2015) 17:33. doi: 10.1186/s12968-015-0136-y
21. Garcia-Pavia P, Rapezzi C, Adler Y, Arad M. Linhart A. Diagnosis and treatment of cardiac amyloidosis: a position statement of the ESC Working Group on Myocardial and Pericardial Diseases. Eur J Heart Failur. (2021) 23:512–26. doi: 10.1093/eurheartj/ehab072
22. Gertz MA, Lacy MQ, Dispenzieri A, Hayman SR. Amyloidosis: diagnosis and management. Clin LymphomaMyeloma. (2005) 6:208–19. doi: 10.3816/CLM.2005.n.048
23. Lee SP, Lee ES, Choi H, Im HJ, Koh Y, Lee MH, et al. 11C-Pittsburgh B PET imaging in cardiac amyloidosis. JACC Cardiovasc Imaging. (2015) 8:50–9. doi: 10.1016/j.jcmg.2014.09.018
24. Ezawa N, Katoh N. Visualization of multiple organ amyloid involvement in systemic amyloidosis using 11C-PiB PET imaging. Eur J Nucl Med Mol Imaging. (2018) 45:452–61. doi: 10.1007/s00259-017-3814-1
25. Rosengren S, Clemmensen TS, Tolbod L, Granstam SO, Eiskjær H, Wikström G, et al. Diagnostic accuracy of [11C]PIB positron emission tomography for detection of cardiac amyloidosis. J Am Coll Cardiol Imaging. (2020) 13:1299–1460. doi: 10.1016/j.jcmg.2020.02.023
26. Bhatti S, Watts E, Syed F, Vallurupalli S, Pandey T, Jambekar K, et al. Clinical and prognostic utility of cardiovascular magnetic resonance imaging in myeloma patients with suspected cardiac amyloidosis. Eur Heart J Cardiovasc Imaging. (2016) 17:970–7. doi: 10.1093/ehjci/jew101
27. Baggiano A, Boldrini M, Martinez-Naharro A, Kotecha T, Petrie A, Rezket T, et al. Non-contrast magnetic resonance for the diagnosis of cardiac amyloidosis. JACC: Cardiovascular Imaging. (2020) 13:69–80. doi: 10.1016/j.jcmg.2019.03.026
28. Ruberg FL, Appelbaum E, Davidoff R, Ozonoff A, Kissinger KV, Harrigan C, et al. Diagnostic and prognostic utility of cardiovascular magnetic resonance imaging in light-chain cardiac amyloidosis. Am J Cardiol. (2009) 103:544–9. doi: 10.1016/j.amjcard.2008.09.105
29. Fontana M, Banypersad SM, Treibel TA, Abdel-Gadir A, Maestrini V, Lane T, et al. Differential myocyte responses in patients with cardiac transthyretin amyloidosis and light-chain amyloidosis: a cardiac MR imaging study. Radiology. (2015) 277:388–97. doi: 10.1148/radiol.2015141744
30. Roujol S, Weingärtner S, Foppa M, Chow K, Kawaji K, Ngo LH, et al. Accuracy, precision, and reproducibility of four T1 mapping sequences: a head-to-head comparison of MOLLI, ShMOLLI, SASHA, and SAPPHIRE. Radiology. (2014) 272:6. doi: 10.1148/radiol.14140296
31. Haq M, Pawar S, Berk JL. Miller EJ, Ruberg FL. Can (99m)Tc-Pyrophosphate aid in early detection of cardiac involvement in asymptomatic variant TTR amyloidosis? JACC Cardiovasc Imaging. (2017) 10:713–4. doi: 10.1016/j.jcmg.2016.06.003
Keywords: 11C-PIB, PET/MR, cardiac amyloidosis, non-invasive diagnosis, LGE, ECV, TBR
Citation: Bi X, Xu B, Liu J, Wang G, An J, Zhang X, Wang R, Dong W and Guan Z (2022) Diagnostic Value of 11C-PIB PET/MR in Cardiac Amyloidosis. Front. Cardiovasc. Med. 9:830572. doi: 10.3389/fcvm.2022.830572
Received: 07 December 2021; Accepted: 07 February 2022;
Published: 16 March 2022.
Edited by:
Ali Yilmaz, University Hospital Münster, GermanyReviewed by:
Filippo Cademartiri, Gabriele Monasterio Tuscany Foundation (CNR), ItalyMaria Concetta Pastore, Università del Piemonte Orientale, Italy
Copyright © 2022 Bi, Xu, Liu, Wang, An, Zhang, Wang, Dong and Guan. This is an open-access article distributed under the terms of the Creative Commons Attribution License (CC BY). The use, distribution or reproduction in other forums is permitted, provided the original author(s) and the copyright owner(s) are credited and that the original publication in this journal is cited, in accordance with accepted academic practice. No use, distribution or reproduction is permitted which does not comply with these terms.
*Correspondence: Zhiwei Guan, bm1ndWFuQDEzOS5jb20=; Baixuan Xu, eGJ4MzAxQDE2My5jb20=; Wei Dong, ZG9uZ3dlaUAzMDFob3NwaXRhbC5jb20uY24=
†These authors have contributed equally to this work
‡These authors share first authorship