 Devine S. Frundi1,2*
 Eva Kettig1
 Lena Luise Popp1
 Melanie Hoffman1Marine Dumartin1Magali Hughes1Edgar Lamy1Yvonne Joko Walburga Fru3
 Arjola Bano4,5
 Taulant Muka4
 Matthias Wilhelm5
- 1Berner Klinik Montana, Zentrum für Medizinische und Neurologische Rehabilitation, Crans-Montana, Switzerland
- 2Permanence Médicale, Hôpital de Sierre, Sierre, Switzerland
- 3Nuffield Department of Population Health (NDPH), University of Oxford, Oxford, United Kingdom
- 4Institute of Social and Preventive Medicine (ISPM), University of Bern, Bern, Switzerland
- 5Center for Preventive Cardiology, University Hospital Bern and University of Bern, Bern, Switzerland
Background: Type 2 diabetes (T2D) is associated with limitation in physical performance. Results from animal studies report enhancement of physical performance in T2D rodents treated with sodium glucose cotransporter 2 inhibitors (SGLT2is). However, in human patients with T2D and established atherosclerotic cardiovascular disease (ASCVD) or high cardiovascular risk, the impact of guideline directed SGLT2i medication on physical performance has not been sufficiently examined.
Objectives: The main objectives of this study are thus firstly, to assess the changes in physical performance after 4 weeks of exercise therapy in patients with established ASCVD or high cardiovascular risk categorized into three groups according to their glycemic control at baseline. Secondly, to investigate the association of glycemic control at baseline and new guideline directed antidiabetic treatment (inadequate glycemic control and diabetes + new SGLT2i vs. adequate glycemic control and diabetes vs. no diabetes) with change in physical performance.
Methods and design: This is a 4-week prospective observational study of 450 participants with established ASCVD or high cardiovascular risk with or without T2D and without previous SGLT2i medication undergoing exercise therapy during inpatient rehabilitation in a single center in Switzerland. Upon admission, participants are categorized into 3 groups of 150 participants each according to their glycemic control. Group I consisting of participants with inadequately controlled T2D defined as mean fasting plasma glucose (FPG) of ≥7 mmol/L, who are consequently administered new treatment with an SGLT2i. Group II comprises of participants with adequately controlled T2D with mean FPG of <7 mmol/L requiring no antidiabetic medication change. Group III consists of participants with no diabetes and mean FPG of ≤5.5 mmol/L. Primary outcomes are 6-min walk distance and rate of perceived exertion. Secondary outcomes are echocardiographic parameters (left ventricular mass index; global longitudinal strain average; end-diastolic volume), fatigue, muscle, metabolic, and anthropometric measures.
Ethics and dissemination: This study is conducted in accordance with the Declaration of Helsinki with ethical approval from the Cantonal Ethical Commission of Bern, Switzerland. The results will be published in a peer-reviewed journal. The implementation and reporting will be according to the SPIRIT guidelines.
Study protocol registration: https://www.clinicaltrials.gov/, identifier: NCT03422263.
Introduction
Type 2 diabetes (T2D) has been associated with limitation in physical performance in individuals with or without atherosclerotic cardiovascular diseases (ASCVD) (1–4). These impairments in physical performance, measured as submaximal or maximal exercise capacity, manifest even with adequate glycemic control and in the absence of overt signs or symptoms of established ASCVD (1, 4–6). This is of clinical relevance because low physical performance in addition to poor glycemic control strongly predicts long-term cardiovascular mortality in individuals with T2D (7–11).
Accordingly, improvement of exercise capacity is considered an important prevention and therapeutic target in existing guidelines to alleviate the risk of atherosclerotic cardiovascular events and mortality in individuals with T2D and/or ASCVD (12–15). Furthermore, because independent of diabetes, fasting plasma glucose is associated with risk of ASCVD, the guidelines also highlight the need for adequate glycemic control (11, 15). Consequently, algorithms for the use of medical therapy have been developed in recent years for the treatment of T2D based on individualized cardiovascular risk profiles with sodium glucose cotransporter 2 inhibitors (SGLT2is) being recommended mainly for individuals with congestive heart failure, established ASCVD or high cardiovascular risk (16–19). These recommendations are based on the results of major cardiovascular outcome trials on SGLT2is, namely empagliflozin, dapagliflozin, and canagliflozin, in patients with T2D which showed that this drug class consistently reduces the risks of heart failure hospitalisations, progression of renal disease as well as moderately reduces the risk of major adverse cardiovascular events, or at least some features of them (20–23). Data suggest these benefits are independent of glycemic control and can be apparent early upon initiation of treatment (24). However, the precise mechanisms of these benefits remain unclear.
Based on recent studies in animals, a possible mechanism can be the enhancement of exercise capacity after 4 weeks of SGLT2i treatment in murine models of T2D and heart failure. The results showed that lowered exercise capacity was restored through central and peripheral mechanisms by improvement of myocardial function and activation of skeletal muscle fatty acid oxidation (25, 26). In humans, although a few studies with small sample sizes suggested that empagliflozin was associated with early improvement in exercise capacity in T2D patients with heart failure (27, 28), others could not replicate these findings on empagliflozin and canagliflozin (29, 30). In a randomized, double blinded study of exercise therapy and dapagliflozin vs. exercise therapy and placebo, dapagliflozin treatment resulted in higher increase in peak exercise capacity from baseline when compared with exercise therapy and placebo despite elevated fasting plasma glucose levels and abrogated increased insulin sensitivity when compared to exercise therapy and placebo (31). These findings suggest that the influence of dapagliflozin on physical performance measured as peak exercise capacity may possibly be independent of glycemic control and that when combined with exercise therapy as recommended by guidelines, dapagliflozin may even contribute to a poorer glycemic control.
To the best of our knowledge, the above findings have not been examined patients with T2D and established ASCVD or high cardiovascular risk, as such, in patients where guideline recommendations strongly favor both improvement of physical performance and first-line medical therapy with an SGLT2i (15, 19).
Given this background, the main aims of this study are firstly, to investigate the changes in physical performance and glycemic control 4 weeks after initiation of guideline-directed medical therapy of an SGLT2i and exercise therapy in patients with established ASCVD or high cardiovascular risk and T2D with initial inadequate glycemic control; secondly, to investigate the changes in physical performance and glycemic control 4 weeks after exercise therapy only in patients with established ASCVD or high cardiovascular risk and T2D with adequate glycemic control; thirdly, to investigate the changes in physical performance 4 weeks after exercise therapy only in non-diabetic patients with established ASCVD or high cardiovascular risk; and fourthly to investigate the cross-sectional and longitudinal association of glycemic control at baseline and new guideline directed antidiabetic treatment (inadequate glycemic control and diabetes + new SGLT2i vs adequate glycemic control and diabetes vs. no diabetes) with physical performance and other outcomes influencing physical performance (secondary outcomes), in patients with established ASCVD or high cardiovascular risk after adjusting for baseline covariates.
Methods and analysis
Study design
The PUSH is a real-world, 4 week prospective, three-arm observational study of patients with established ASCVD or high cardiovascular risk with and without T2D undergoing regular exercise therapy during inpatient rehabilitation in a single center in Switzerland. Employing a multi-group design and a two-step analytic approach, the study investigates the changes in physical performance (and glycemic control) in 3 categories of glycemic control after 4 weeks. Furthermore, the associations between the 3 categories of glycemic control and new guideline directed antidiabetic treatment (inadequate glycemic control and diabetes + new SGLT2i vs. adequate glycemic control and diabetes vs. no diabetes) with physical performance are evaluated in cross-sectional and prospective analyses. A flow chart of the study is shown in Figure 1.
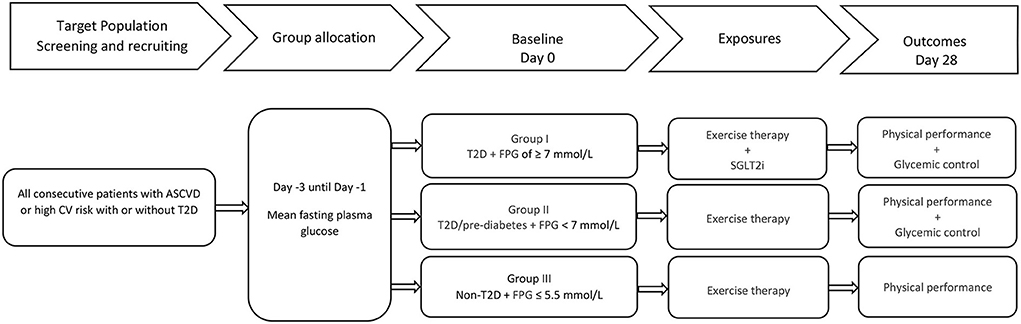
Figure 1. Flowchart of the PUSH study. ASCVD, atherosclerotic cardiovascular diseases; CV, cardiovascular; T2D, type II diabetes mellitus; FPG, fasting plasma glucose; SGLT2i, sodium glucose cotransporter 2 inhibitor.
Eligibility criteria
All consecutive patients with established ASCVD or high cardiovascular risk with or without T2D who met the inclusion criteria summarized below were prospectively enrolled as from 1 January 2018 and data collection lasted until 30 September 2020. Individuals below 40 years of age upon admission were excluded due to the low incidence of ASCVD in people under 40 years (32). For participants with T2D, T2D was determined by self-report with verification of medical records, current treatment or FPG ≥ 7 mmol/L and symptoms of hyperglycemia with random plasma glucose ≥ 11.1 mmol/L (33). Individuals who had a clinical history strongly suggestive of type I diabetes were excluded.
Inclusion criteria
1. Ambulatory patients, defined as able to walk about and not bedridden, with or without walking aids admitted following a medical or surgical condition warranting inpatient rehabilitation,
2. willing to give informed written consent,
3. with established ASCVD or high cardiovascular risk with and without T2D were included. ASCVD and high cardiovascular risk were defined as follows:
a. established ASCVD: coronary artery disease (CAD), cerebrovascular disease (CeVD), peripheral artery disease (PAD) and ischemic congestive heart failure (CHF),
b. high cardiovascular risk: as defined in the 2016 European Guidelines on cardiovascular disease prevention in clinical practice (13). consisting of patients without clinically manifest ASCVD with markedly elevated single cardiovascular risk factors (hypertension with blood pressure ≥180/110 mmHG, blood lipid profile with cholesterol > 8 mmol/L, metabolic syndrome and central obesity with body mass index ≥40 kg/m2 in patients below 60 years of age), or with T2D plus any additional risk factor, or with moderate chronic kidney disease defined as glomerular filtration rate between 30 and 59 mL/min/1.73 m2, or with a calculated systematic coronary risk estimation (SCORE) ≥5 and <10 % (13), or with scores above the high risk cut-off using the American College of Cardiology (ACC)/American Heart Association (AHA) score of ≥20% (34, 35).
Exclusion criteria
1. Patients who were not willing to give informed consent or declined suggestions of guideline directed medical therapy,
2. who were not able to walk,
3. in lower cardiovascular risk categories,
4. had a history of unstable angina or acute myocardial infarction in the 4 weeks prior to baseline or any terminal cardiovascular, respiratory, musculoskeletal, or neurological condition that relevantly limited patient's physical performance and/or movement defined as 6-min walk distance of <25 m at baseline,
5. had relevant pain limiting physical performance and/or movement defined as pain numeric rating scale (NRS) of above 5/10 at rest,
6. had an active malignancy,
7. had advanced renal disease defined as glomerular filtration rate (GFR) permanently below 30 mL/min/1.73 m2 in the 12 weeks prior to admission,
8. were already under treatment with SGLT2i upon admission were excluded. Participants were considered already under treatment with an SGLT2i if they received continuous SGLT2i medication for longer than 3 days prior to admission.
Study group categories
Glycemic control was assessed within the first 3 days upon admission by measurement of fasting plasma glucose (FPG) with the widely used diagnostic cut-off of ≥7 mmol/L employed to define inadequate glycemic control (33, 36). Hemoglobin A1c (HBA1c) testing was equally done in all participants upon admission but was not used to define inadequate glycemic control in this cohort to circumvent the bias linked to participants with conditions that affect erythrocyte turnover such as acute bleeding and/or erythrocyte transfusion during the acute hospitalization prior to rehabilitation (33). HbA1c was however used as one of the parameters to distinguish participants with diabetes or impaired glucose metabolism from those with normal glucose metabolism as described below.
Depending on their glycemic control upon admission and following guideline recommendations, participants were categorized to one of three groups using clinically defined cut-off categories of FPG levels as follows (11):
Group I: Participants with inadequately controlled T2D defined as mean FPG of ≥7 mmol/l within the first 3 days upon admission under other standard of care medication, who were afterwards administered de novo SGLT2i treatment; namely either canagliflozin 100 mg, or dapagliflozin 10 mg, or empagliflozin 10 mg once daily, with the choice of which of the SGLT2is being at the discretion of the individual treating physician,
Group II: Participants with adequately controlled T2D, previous diagnosis of T2D or use of antidiabetic medication, with mean FPG <7 mmol/L; and participants with impaired fasting glycemia (IFG) or pre-diabetes, defined as mean FPG of 5.6–6.9 mmol/L and HbA1c levels of 5.7–6.4 % (15, 33), under other standard of care treatment and no SGLT2i,
Group III: Participants with no previous diagnosis of T2D or use of antidiabetic medication and normal glucose metabolism defined as FPG of ≤ 5.5 mmol/L under other standard of care treatment and no SGLT2i were included as a reference group as previously described in the meta-analysis of prospective studies on diabetes mellitus, FPG, and risk of vascular disease (11).
Rehabilitation program
The research was conducted in a single center at an altitude of 1,600 m in the Bernese Swiss Alps in Crans-Montana, Switzerland. All participants were exposed to supervised exercise therapy as follows: eight to twelve 30-min-sessions per week of physical activity, of which 4–5 sessions were aerobic exercises in a pool, on a cycloergometer, treadmill or outdoor moderate intensity walking, 2–3 sessions of muscle strengthening through resistance and stretching exercises, 2–4 sessions of occupational activity, proprioceptive and range of motion exercises supervised by blinded certified therapists. Exercise intensity was determined according to the rate of perceived exertion measured using the Borg category ratio (CR-10) as previously described (37, 38). Intensity was increased progressively according to the patient's tolerance. In addition, 30-min sessions of auxiliary non-physical activity with a dietician, psychologist, acupuncturist, art therapist or social worker were planned as needed.
For the PUSH study, participant motivation and participation were measured based on the session reports of blinded therapist during weekly interdisciplinary meetings using the Pittsburgh rehabilitation participation scale as previously described (39).
Outcome measures: Assessment, blinding, and rationale
The PUSH assessed objective and subjective outcomes of physical performance in addition to hemodynamic, cardiorespiratory, and cardiometabolic risk variables. Outcome assessments were done upon admission (baseline), facultatively at week 2 and at week 4 (Table 1). All participants, direct care providers and assessors were masked to the outcomes under investigation throughout the study. Whereas, participant and care providers were blinded by categorically withholding supplementary information on the glycemic control categories described above and exposures under investigation, main outcome assessors (therapists and laboratory technicians) were masked by complete prohibition of access to patient medication data as per previously established institutional policy.
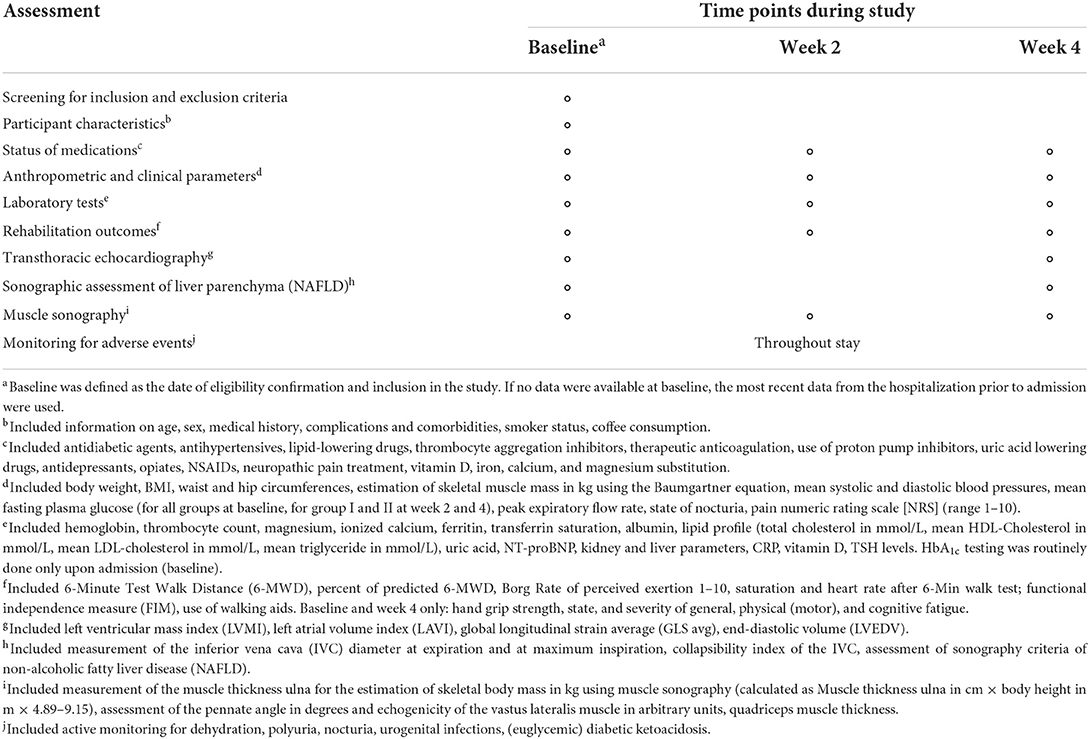
Table 1. Assessment time plan.
Primary outcomes
The primary outcomes were defined as
i). walk distance (6-MWD in m),
ii). percent of predicted 6-MWD,
iii). rate of perceived exertion [Borg category ratio (CR-10)]
at the end of 6-minute walk test (6MWT) performed by a blinded certified therapist using the protocol outlined by the American Thoracic Society (ATS) with participant permitted to use a walking aid if needed (40). In brief, the 6MWT was performed over a 100 m long straight course within an enclosed level corridor. Standardized instructions were given to patients prior to each 6MWT. Patients wearing comfortable clothes and shoes were asked to walk as quickly as they can for 6 min to cover as much ground as possible. They were told that they could slow down or rest if necessary. The starting and turnaround points were indicated with a bright mark on the floor corresponding to the beginning and the end of each 90-meter lap, respectively, with further marks shown at 5-meter intervals. Heart rate (HR) and oxygen saturation (SpO2) were recorded prior to and upon completion of the 6MWT using an oximeter and finger sensor (OxyTrue A®, Bluepoint MEDICAL GmbH & Co.KG, Germany). At the end of the test, the distance was measured, and rate of perceived exertion was rated by the patient using a Borg category ratio (CR-10) scale. Because 6-MWD is directly related to age, height and sex and as such may give misleading results when used in groups with different age, sex and BMI distributions, the percent of predicted 6-MWD was also determined as a means of standardizing the outcome using norm-referenced equations (41, 42). For each participant, predicted 6-MWD was calculated as: 6-MWDpred = 218 + (5.14 × height−5.32 × age)–[1.80 × weight + (51.31 × sex)]; where male = 1 and female = 0 (43). Additionally, percent of predicted 6-MWD was computed by dividing each participant's actual 6-MWD by the predicted 6-MWD and multiplying by 100, using the model parameter values (weight) at the assessment time point.
Measuring physical performance based on a submaximal exercise test, the 6MWT, is a distinctive choice as a primary outcome in this field given that previous exploratory studies focused on Cardiopulmonary Exercise Testing (CPET) with the measurement of peak exercise capacity (peak VO2) for assessing maximal aerobic capacity (27–30).
The decision to employ submaximal exercise testing as the primary outcome was based on several factors. First, the 6MWT is an inexpensive, efficient, safe and a well-tolerated method of assessing the functional exercise capacity of patients with ASCVD. It is widely used to follow the natural history of various diseases, and for measuring the response to medical interventions (40, 44, 45). Second, functional exercise capacity and mobility are composite of several factors targeted in rehabilitation programs in patients with established ASCVD and high cardiovascular risk with the goal of attaining physical activity levels in the community (13, 46–48). The 6MWT has been shown to correlate closely with physical performance levels in the community (49, 50) and to be strongly associated to clinical change and functional capacity following rehabilitation (51–53). The test reproduces the limitations of physical performance when undergoing activities of daily living such as dyspnea, fatigue, pain and weakness, while maximal aerobic capacity testing mainly measures the reserve capacity (thought to be barely tapped during daily activities) limited by exertion (54, 55). Third, evidence shows that the 6MWT is not associated with a relevant learning effect when repeated testing is performed in individuals with ASCVD (51, 56, 57). Fourth, minimal clinically important difference has been defined for the 6-MWT and helps determine whether a given change in the 6-MWT represents a clinically meaningful difference (58–60). Fifth, previous studies show that in patients with established ASCVD, poor physical performance measured with the 6-MWT is an independent predictor of survival and predicts risk of hospitalization, all-cause mortality, cardiovascular disease mortality, and mobility loss (44, 61–64). Together, these aspects mean the results of the primary outcomes of the PUSH should be indeed translatable to similar cohorts of patients with established ASCVD and high cardiovascular risk with or without a T2D comorbidity.
Furthermore, the duration of follow-up of 28 days was mainly based on a previous pilot study participants with similar comorbidities that showed that the SGLT2-inhibitor empagliflozin was associated with 1-month improvement in exercise capacity in T2D patients with symptomatic CHF measured amongst others using the 6-MWD and that this beneficial effect was also found for other surrogates of severity including quality of life measures and markers associated with congestive heart failure as measured in some of the secondary outcomes below (28).
Secondary outcomes
Secondary outcomes included surrogate variables related to or influencing physical performance measured as follows:
Transthoracic echocardiography parameters at rest
Main echocardiographic parameters such as left ventricular mass index (LVMI) in kg/m2, diastolic function (E/e' average), left atrial volume index (LAVI) in ml/m2, global longitudinal strain average (GLS avg) in %, doppler techniques used to measure end-diastolic volume (LVEDV) in ml, resting stroke volume (SV) in ml, left ventricular ejection fraction (LVEF) with datasets registered and stored on an Echo PAC software (GE Medical Systems Glattbrugg, Switzerland) for analysis offline by an independent cardiologist unaware of the treatment allocation using previously described guidelines and protocols (65–67).
It has been well-proven that physical performance correlates strongly with cardiac size (LV volumes, LV mass or whole heart volumes), both in athletic and non-athletic populations (68, 69). Likewise, there is a strong correlation between resting cardiac geometry measures (LV mass, LVEDV) and exercise capacity in individuals with T2D (6). And although these previous studies could not demonstrate a correlation between LVEF and exercise capacity in individuals, the PUSH is designed to explore early changes in newer echocardiographic measures of subclinical LV systolic dysfunction in the presence of a normal ejection fraction such as global longitudinal strain average [GLS avg] (Figure 2) (70).
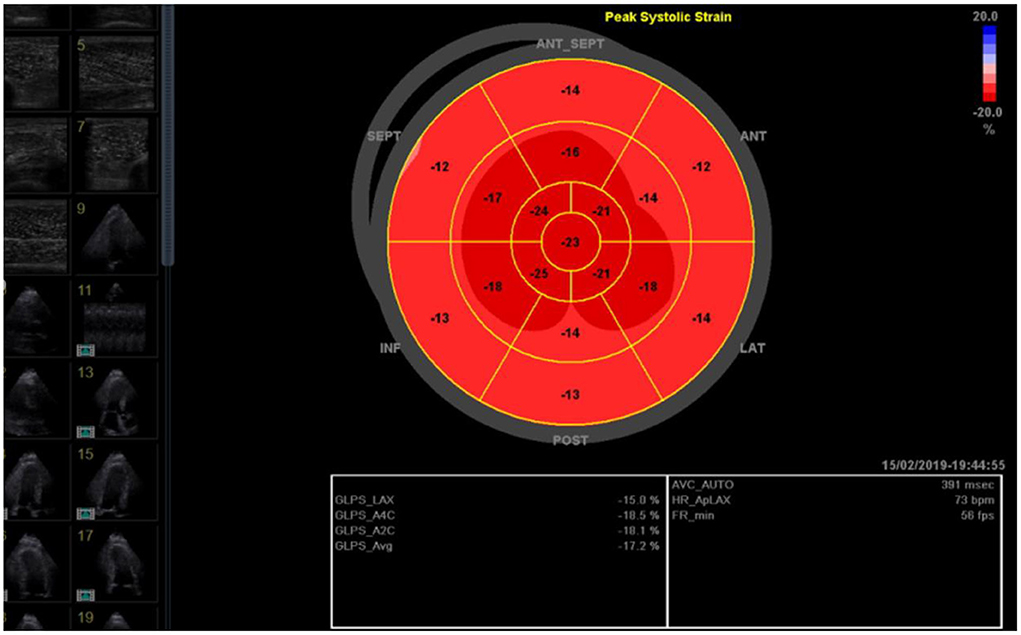
Figure 2. Global longitudinal strain average (GLS avg; here −17.2 %) as measured by a blinded cardiologist using images stored on an Echo PAC software.
Fatigue
Self-reported fatigue (continuous) and grade of fatigue severity (categorical) were measured using the Fatigue Scale for Motor and Cognitive function (FSMC) as previously described (71). In brief, the assessment is a patient-reported outcome measure (PROM) with a generic tool that measures a variety of aspects of fatigue. It employs a Likert-type 5-point scale ranging from “does not apply at all” to “applies completely” producing a score between 1 and 5 for each scored question. For the general scale, the minimum value is 20 (no general fatigue at all) and the maximum value is 100 (very severe general fatigue). Besides distinguishing between physical and cognitive fatigue, this scale offers a subdivision into different grades of fatigue severity with a cut-off value of ≥63 considered as severe, ≥53–62 moderate and ≥43–52 mild general fatigue (71, 72).
Independent of care providers, diagnosis upon admission or current treatment, the standardized and validated questionnaires are completed by patients in most rehabilitation centers in Switzerland to ascertain perceptions of their fatigue status and severity, perceived level of general as well as physical and cognitive impairment.
Grip-strength
Hand grip strength in kg measured using a JAMAR™ hand dynamometer recorded as the average of three measurements of the dominant hand in the neutral position. All participants performed the test upon admission and at discharge at the occupational therapy department, in the morning, on the same dynamometer and supervised by the same assessors blinded to patient medication.
Prior research showed grip strength is inversely associated with cardiovascular and all-cause mortality events especially in individuals with T2D (73–77).
Peak-expiratory-flow-rate
Peak expiratory flow rate in L/minute registered as the best of 3 attempts using a non-digital vitalograph™ peak flow meter (Vitalograph GmbH Hamburg, Germany) was measured during the clinical visits by treating rehabilitation physicians as a measure of pulmonary function and expiratory muscle strength.
To produce accurate measurements, assessors provided explanations and demonstrated the measurement to the participants so that they could fully understand the procedure before the measurements were performed.
The peak expiratory flow rate, in the absence of obstructive lung disease, has been shown in previous studies to have a strong correlation with expiratory muscle strength which is equally closely associated to hand grip strength (78, 79). Furthermore, in older adults physical performance has been shown to be more strongly associated with respiratory muscle mass than total skeletal muscle mass (80).
Body-mass-index
Body mass index (BMI) in kg/m2 measured as weight (kg) divided by measured height (m) squared. Weight and height were measured upon admission by blinded certified nurses and physiotherapists, respectively, and entered into patient records. During stay, weight was controlled at regular intervals in the morning before breakfast during the clinical visits by blinded nurses.
BMI is a crude adiposity indicator with higher BMI being an independent predictor of higher mortality risk in the general population (76, 77). On the other hand, many large cohort studies of individuals with T2D and high BMI suggest higher BMI to be a protective factor for all-cause mortality, a phenomenon described as the “obesity paradox” (81–83). Consequently, in interventions inducing weight reduction in individuals with T2D, such as regular exercise training in rehabilitation in combination with diet and SGLT2 is, lifestyle changes focussed around improving physical performance are recommended to alleviate the potential risk of BMI reduction and cardiovascular mortality (84, 85).
Muscle-mass
Estimated appendicular skeletal muscle mass (ASM) in kg using the previously described Baumgartner equation [ASM = 0.2487 (weight) + 0.0483 (height)−0.1584 (hip circumference) + 0.0732 (Hand grip strength) +2.5843 (SEX) + 5.8828] (86), and muscle sonography [ASM = 4.89 × Muscle thickness-forearm (ulna) × Height (m)−9.15] (87–89). Hip circumference is measured during the clinical examination by treating rehabilitation physicians at the level of the widest protrusion of the buttocks with the patient standing erect and feet together. Muscle thickness of the forearm is measured at the anterior forearm at 30 % proximal between the styloid process and the head of the radius by a single trained and certified sonographer using a GE Vivid S70 N R2 (GE Medical Systems, Switzerland) with a 9L-D 2.4–10-MHz linear array transducer (Figure 3).
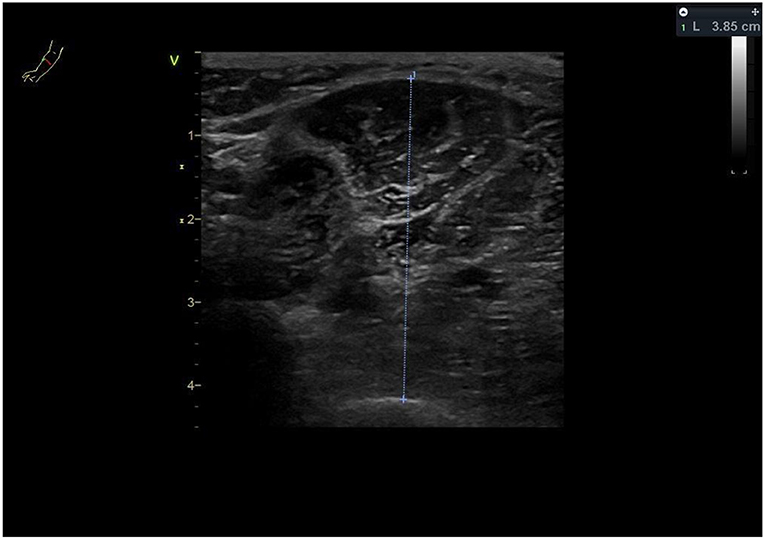
Figure 3. Muscle thickness ulna right forearm (here 3.85 cm).
Not only is there a strong relation between muscle mass and physical performance (90), but also muscle mass as a measure of muscle quantity has been shown to have a strong correlation with ASCVD mortality with high muscle/low fat mass individuals having a lower risk of ASCVD and total mortality (91–93).
Muscle-quality
Muscle echogenicity of the vastus lateralis muscle on B-Mode ultrasound imaging obtained by a single trained and certified sonographer using a GE Vivid S70 N R2 (GE Medical Systems, Switzerland) with a 9L-D 2.4–10-MHz linear array transducer with duplicate assessment of outcomes using Image J software [Wayne Rasband, National Institute of Mental Health (NIH)] by an independent sonographer unaware of the treatment allocation following previously described protocols (94–96) as shown in Figure 4.
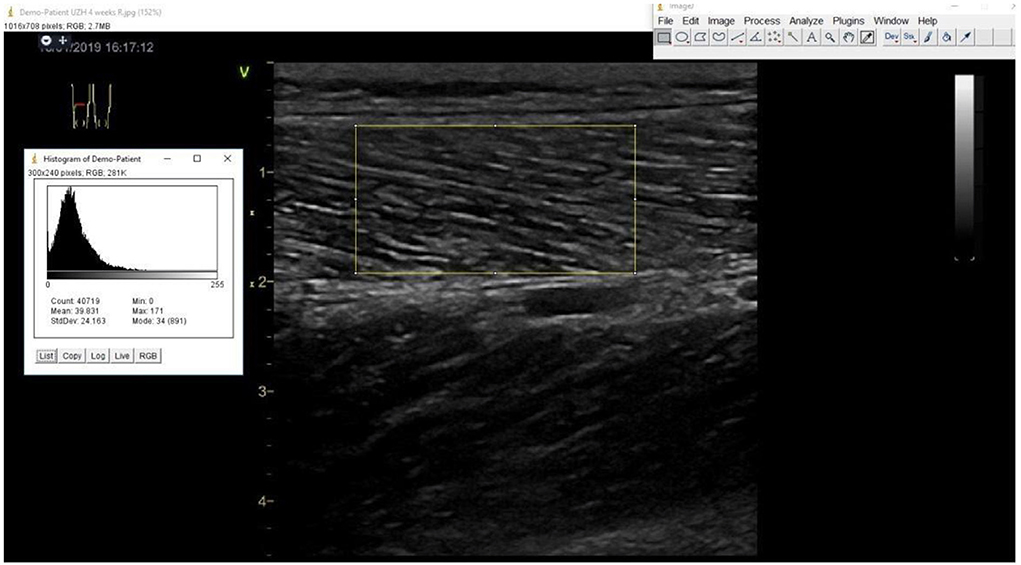
Figure 4. Measurement of echogenicity of the right vastus lateralis muscle using Image J software.
Muscle strength and physical performance are affected by not only muscle mass but also muscle quality which could be measured by echogenicity in ultrasound imaging (97, 98). Echogenicity reflects muscle quality, since non-contractile tissue associated with myosteatosis shows hyper-echogenicity (Figure 4) (98). Furthermore, individuals with T2D have been shown to have a an impaired microvascular blood flow in the muscles which could partially explain the impaired physical performance (99, 100).
To check for inter-rater and intra-rater reproducibility of the ultrasound measurements, especially when older individuals are examined, regular in-study reliability assessments (ICC) were conducted randomly on 30 patients of the PUSH study. For the ICC evaluation, measurements were repeated 3 times for each participant. The measured data shall be analyzed using a single-measurement, absolute-agreement, 2-way mixed-effects model and reported as ICC with 95% confident interval. Based on the ICC results, the measurements shall be classified according to the subgroups defined by Landis and Koch, in which ICC values below 0.00 are considered poor reliability, 0.00–0.20 slight reliability, 0.21–0.40 fair reliability, 0.41–0.60 moderate reliability, 0.61–0.80 substantial reliability, and 0.81–1.00 almost perfect reliability (101).
Functional-status
Functional independence measure (FIM™) as registered by blinded certified nursing staff. The FIM™ measures functional status, independent of diagnosis, using an 18-item, seven-level, ordinal scale intended to be sensitive to changes over the course of a comprehensive inpatient rehabilitation program (102).
The change in the FIM score has been shown to strongly correlate with long-term mortality in patients with CeVD admitted for rehabilitation (103).
Walking-aids
Use of walking aids (categorical) as documented by blinded physical therapists. As a measure of functional independence and balance, change in the need and use of walking aids is also a proxy measurement of change in physical performance in individuals with T2D (104, 105).
N-terminal-pro-brain-natriuretic-peptide
Fasting blood samples (serum or plasma as appropriate) are evaluated for circulating levels of N-terminal pro-brain natriuretic peptide (NT-pro-BNP) in ng/L [1 Nanogram per liter (ng/l) = 1 Picogram per milliliter (pg/ml)] measured by laboratory technicians unaware of study group allocation.
In patients with ASCVD, NT-pro-BNP levels have been shown to predict physical performance and cardiovascular events (106–109).
Anthropometric-indices
Anthropometry comprising of mean waist and hip circumferences in cm, waist-to-height, and waist-to-hip ratios. Waist circumference was measured during the clinical examination by treating rehabilitation physicians at the level of the umbilicus with the patient standing erect and feet together.Waist circumference has been demonstrated to be a modifiable factor associated with post-rehabilitation physical performance and function (110). Additionally, both waist-to-height and waist-to-hip ratios have been associated with cardiovascular events (111–113).
Parameters-of-muscle-physiology
Fasting blood samples (serum or plasma as appropriate) evaluated for biomarkers of muscle response to training including creatinine kinase (CK) in U/L, lactate dehydrogenase (LDH) in U/L (114), and biomarkers likely influencing both musculoskeletal function and cardiovascular disease including serum magnesium (115, 116) in mmol/L, serum ionized calcium and serum vitamin D levels (117).
Other-biomarkers-associated-with-fatigue
Fasting blood samples (serum or plasma as appropriate) were evaluated for biomarkers of iron deficiency including serum ferritin in μg/L, transferrin saturation (TSAT) in % (118).
Safety outcomes
The safety outcomes included adverse event (AE) reporting, hemoglobin, liver and kidney function, electrolytes, dehydration, polyuria, nocturia, urogenital infections, (euglycemic) diabetic ketoacidosis. A general physical examination was performed at baseline and at the end of the study. Patients were specifically asked at the regular clinical visits about AEs. Each AE was registered in a standardized manner with laboratory findings in the study registry. In addition, at baseline and at week 4, calculated BUN creatinine ratio and ultrasound measurements of the inferior vena cava were employed as surrogate markers of dehydration (119, 120).
Sample size and data analysis
Sample size
Based on the results of the cardiovascular heart study of Enright et al., among 2,281 community dwelling adults ≥68 years old, the expected mean 6-min walk distance (6MWD) was 344 ± 88 m which is the set target of exercise therapy in rehabilitation (45). Centered on our clinical observations and on the results of a small pilot study in the clinical rehabilitation of patients with cerebrovascular disease (121), we assumed a mean 6-MWD at baseline of 250 m with an anticipated improvement of 80 ± 40 m after 4 weeks of exercise therapy. To detect an additional difference of ±15%, as reported in previous studies on this subject (28), within the group as well as between any 2 groups with power of 80 % and an alpha error of 5% using a 2-sided test after 4 weeks, the sample size required was 130 participants per group. Based on our admission statistics, the attrition rate for administrative reasons, mainly being lack of insurance coverage for a treatment duration of at least 20 days, was estimated at 15 %, while 85 % of participants were expected to complete the week 4 follow-up. To this end, 150 participants per group needed to be enrolled (450 participants in total).
Data analyses
Demographic data will be examined using independent-samples t-tests and Fisher's exact tests for dichotomous variables. Independent-samples t-tests and repeated-measures ANOVAs will be employed to compare changes in physical performance after 4 weeks. Differences between primary and secondary outcome variables after 4 weeks will also analyzed by linear mixed-effects models (LMMs). The time factor for the model will be set at baseline and week 4. The models will include model-based adjustments for baseline characteristics influencing physical performance in such cohorts: (1) age, sex, BMI, waist circumference, diabetes duration and history of cardiovascular disease.
To minimize the bias that could result from participants in the 3 groups having highly variable duration of stay, the prospective analyses will be performed on a modified intention-to-treat and per protocol basis. The modified intention-to-treat population will be defined as participants who have been categorized to a study group and have at least one follow-up measurement of the primary outcomes, regardless of treatment adherence or duration of stay. The “last observation carry-forward method” will be used in the absence of complete follow-up data. For “per protocol” analysis, only those participants who have follow-up measurements after a minimum treatment duration or length of stay of ≥20 days will be included.
Sensitivity analyses will be performed to account for potentially non-ignorable missing data due to dropout as well as the possible impact of other potentially influential variables. A Bonferroni correction will be applied to the LMM analyses of the primary and secondary outcomes.
Pre-specified subgroup analyses will be conducted; these will include subgroups defined according to the various entities of ASCVD, gender, age groups, and other factors.
Discussion
The PUSH is a a real-world, 4-week prospective, three-arm observational study designed to evaluate the impact of glycemic control and guideline-directed medical therapy with an SGLT2i on physical performance of patients with established ASCVD or high cardiovascular risk.
Prior research suggests that there is a strong correlation between physical performance and the risks of cardiovascular disease and mortality (62, 122). It is also clear that treatment with SGLT2is reduces the risks of heart failure hospitalisations, progression of renal disease, cardiovascular disease and mortality in individuals with T2D with changes seen early within a few weeks after the begin of treatment (20–22). Therefore, unlike previous pilot studies on the subject (27–31), the PUSH incorporated strategies to investigate change in physical performance in a larger cohort of individuals with established ASCVD or high cardiovascular risk under guideline-directed medical therapy. Because change in physical performance is highly dependent on both oxygen delivery and utilization systems (123), the PUSH assesses cardiac, respiratory and muscle parameters related to physical performance. Thus, much effort was made in the design to have an extensive assessment of variables impacting exercise capacity as previously described in similar cohorts (1). In analyzing or adjusting for these variables, the results of the PUSH could be of clinical relevance in the management of patients with T2D and established ASCVD or high cardiovascular risk.
Due to demographic factors, the clinical and economic costs related to ASCVD are expected to increase dramatically in coming years. Consequently, the identification of therapy regimes capable of reducing ASCVD disease burden is an important goal with remarkable public health repercussions (124).
The PUSH design however has some limitations. First, the non-randomized design precludes analyses and conclusions of the causal relationships among variables. Second, despite efforts to address the internal validity threats, the selection bias of using glycemic control to determine participants for the guideline-directed medical therapy with an SGLT2i remains an important threat in the interpretation of the results even though a previous study in this field did not show any negative impact of suboptimal glycemic control under treatment with an SGLT2i (dapagliflozin 10 mg) on the physiological adaptation to endurance exercise training (31). Accordingly, studies on changes in physical performance under SGLT2is in patients with both inadequately and adequately controlled T2D are still warranted. Third, the prospective design of this study with a follow-up of just 4 weeks addresses solely the hypothesis of early changes in physical performance under guideline-directed medical therapy with an SGLT2i. Further studies will be necessary to investigate, if present, the extent and sustainability of these early changes over a longer period of observation with or without endurance exercise therapy. Finally, we will not compare participants to those who did not receive inpatient rehabilitation after a medical or surgical condition warranting inpatient rehabilitation, as such, the potentiating effect of exercise therapy during rehabilitation on the results shall not be easily quantified.
Study status
The first participant was recruited in January 2018. Data collection was concluded in September 2020 when the target of 450 participants was met. The SARS-COVID global pandemic delayed patient enrollment and data collection between February and September 2020 but neither relevantly influenced the study protocol nor the rehabilitation program. The publication of the results is expected in 2022.
Ethics Statement
Written informed consent was obtained from the individual(s) for the publication of any potentially identifiable images or data included in this article.
Author Contributions
DF: project administration, conceptualization, methodology, investigation, visualization, and writing original draft. EK: conceptualization, resources, validation, data curation, visualization, and writing review and editing. LP: resources provision of study materials and patients. MHo: resources, visualization, and writing review and editing. MHu and EL: resources, validation, data curation, and visualization. YF: conceptualization, methodology, and formal analysis. AB and TM: formal analysis and writing review and editing. MW: writing review and editing and supervision. All authors contributed to the article and approved the submitted version.
Funding
The PUSH was approved and funded by the Berner Klinik Foundation, Bern, Switzerland. The foundation is a non-profit organization focused on clinical rehabilitation. External funding was neither sought nor endured from previous research projects in the institution. The investigators designed and conducted the study, will perform all study analyses and have contributed and are responsible for the contents of this manuscript. The principal investigator will have full access to all the data and the final responsibility for the decision to submit for publication.
Conflict of interest
The authors declare that the research was conducted in the absence of any commercial or financial relationships that could be construed as a potential conflict of interest.
Publisher's Note
All claims expressed in this article are solely those of the authors and do not necessarily represent those of their affiliated organizations, or those of the publisher, the editors and the reviewers. Any product that may be evaluated in this article, or claim that may be made by its manufacturer, is not guaranteed or endorsed by the publisher.
References
1. Ribisl PM, Lang W, Jaramillo SA, Jakicic JM, Stewart KJ, Bahnson J, et al. Exercise capacity and cardiovascular/metabolic characteristics of overweight and obese individuals with type 2 diabetes: the look AHEAD clinical trial. Diabetes Care. (2007) 30:2679–84. doi: 10.2337/dc06-2487
2. De Rekeneire N, Resnick HE, Schwartz AV, Shorr RI, Kuller LH, Simonsick EM, et al. Diabetes is associated with subclinical functional limitation in nondisabled older individuals: the health, aging, and body composition study. Diabetes Care. (2003) 26:3257–63. doi: 10.2337/diacare.26.12.3257
3. Uribe-Heredia G, Arroyo-Espliguero R, Viana-Llamas MC, Piccone-Saponara LG, Álvaro-Fernández H, García-Magallón B, et al. Type 2 diabetes mellitus, glycated hemoglobin levels, and cardiopulmonary exercise capacity in patients with ischemic heart disease. J Cardiopulm Rehabil Prev. (2020) 40:167–73. doi: 10.1097/HCR.0000000000000451
4. Reusch JE, Bridenstine M, Regensteiner JG. Type 2 diabetes mellitus and exercise impairment. Rev Endocr Metab Disord. (2013) 14:77–86. doi: 10.1007/s11154-012-9234-4
5. Nojima H, Yoneda M, Watanabe H, Yamane K, Kitahara Y, Sekikawa K, et al. Association between aerobic capacity and the improvement in glycemic control after the exercise training in type 2 diabetes. Diabetol Metab Syndr. (2017) 9:63. doi: 10.1186/s13098-017-0262-9
6. Roberts TJ, Burns AT, MacIsaac RJ, MacIsaac AI, Prior DL, La Gerche A. Exercise capacity in diabetes mellitus is predicted by activity status and cardiac size rather than cardiac function: a case control study. Cardiovasc Diabetol. (2018) 17:44. doi: 10.1186/s12933-018-0688-x
7. Kohl HW, Gordon NF, Villegas JA, Blair SN. Cardiorespiratory fitness, glycemic status, and mortality risk in men. Diabetes Care. (1992) 15:184–92. doi: 10.2337/diacare.15.2.184
8. Wei M, Gibbons LW, Kampert JB, Nichaman MZ, Blair SN. Low cardiorespiratory fitness and physical inactivity as predictors of mortality in men with type 2 diabetes. Ann Intern Med. (2000) 132:605–11. doi: 10.7326/0003-4819-132-8-200004180-00002
9. Church TS, LaMonte MJ, Barlow CE, Blair SN. Cardiorespiratory fitness and body mass index as predictors of cardiovascular disease mortality among men with diabetes. Arch Intern Med. (2005) 165:2114–20. doi: 10.1001/archinte.165.18.2114
10. Farrell SW, Barlow CE, Willis BL, Leonard D, Pavlovic A, DeFina LF, et al. Cardiorespiratory fitness, different measures of adiposity, and cardiovascular disease mortality risk in women. J Womens Health. (2020) 29:319–26. doi: 10.1089/jwh.2019.7793
11. Sarwar N, Gao P, Seshasai SR, Gobin R, Kaptoge S, Di Angelantonio E, et al. Diabetes mellitus, fasting blood glucose concentration, and risk of vascular disease: a collaborative meta-analysis of 102 prospective studies. Lancet. (2010) 375:2215–22. doi: 10.1016/S0140-6736(10)60484-9
12. American Diabetes Association. 4. Lifestyle Management: Standards of Medical Care in Diabetes-2018. Diabetes care. (2018) 41(Suppl 1):S38–50. doi: 10.2337/dc18-S004
13. Piepoli MF, Hoes AW, Agewall S, Albus C, Brotons C, Catapano AL, et al. 2016 European guidelines on cardiovascular disease prevention in clinical practice: the sixth joint task force of the european society of cardiology and other societies on cardiovascular disease prevention in clinical practice (constituted by representatives of 10 societies and by invited experts) developed with the special contribution of the European association for cardiovascular prevention & rehabilitation (EACPR). Eur Heart J. (2016) 37:2315–81. doi: 10.1093/eurheartj/ehw106
14. Inzucchi SE, Bergenstal RM, Buse JB, Diamant M, Ferrannini E, Nauck M, et al. Management of hyperglycaemia in type 2 diabetes, 2015: a patient-centred approach. Update to a position statement of the American diabetes association and the European association for the study of diabetes. Diabetologia. (2015) 58:429–42. doi: 10.1007/s00125-014-3460-0
15. Cosentino F, Grant PJ, Aboyans V, Bailey CJ, Ceriello A, Delgado V, et al. 2019 ESC guidelines on diabetes, pre-diabetes, cardiovascular diseases developed in collaboration with the EASD. Eur Heart J. (2020) 41:255–323. doi: 10.1093/eurheartj/ehz486
16. Schernthaner G, Lehmann R, Prázný M, Czupryniak L, Ducena K, Fasching P, et al. Translating recent results from the cardiovascular outcomes trials into clinical practice: recommendations from the central and eastern European diabetes expert group (CEEDEG). Cardiovasc Diabetol. (2017) 16:137. doi: 10.1186/s12933-017-0622-7
17. Marín-Peñalver JJ, Martín-Timón I, Sevillano-Collantes C, Del Cañizo-Gómez FJ. Update on the treatment of type 2 diabetes mellitus. World J Diabetes. (2016) 7:354–95. doi: 10.4239/wjd.v7.i17.354
18. Qaseem A, Barry MJ, Humphrey LL, Forciea MA, Fitterman N, Horwitch C, et al. Oral pharmacologic treatment of type 2 diabetes mellitus: a clinical practice guideline update from the American college of physicians. Ann Intern Med. (2017) 166:279–90. doi: 10.7326/M16-1860
19. Buse JB, Wexler DJ, Tsapas A, Rossing P, Mingrone G, Mathieu C, et al. 2019 Update to: management of hyperglycemia in type 2 diabetes, 2018. A consensus report by the American diabetes association (ADA) and the European association for the study of diabetes (EASD). Diabetes Care. (2020) 43:487–93. doi: 10.2337/dci19-0066
20. Zinman B, Wanner C, Lachin JM, Fitchett D, Bluhmki E, Hantel S, et al. Empagliflozin, cardiovascular outcomes, and mortality in type 2 diabetes. N Engl J Med. (2015) 373:2117–28. doi: 10.1056/NEJMoa1504720
21. Wiviott SD, Raz I, Bonaca MP, Mosenzon O, Kato ET, Cahn A, et al. Dapagliflozin and cardiovascular outcomes in type 2 diabetes. N Engl J Med. (2019) 380:347–57. doi: 10.1056/NEJMoa1812389
22. Neal B, Perkovic V, Mahaffey KW, de Zeeuw D, Fulcher G, Erondu N, et al. Canagliflozin and cardiovascular and renal events in type 2 diabetes. N Engl J Med. (2017) 377:644–57. doi: 10.1056/NEJMoa1611925
23. Zelniker TA, Wiviott SD, Raz I, Im K, Goodrich EL, Bonaca MP, et al. SGLT2 inhibitors for primary and secondary prevention of cardiovascular and renal outcomes in type 2 diabetes: a systematic review and meta-analysis of cardiovascular outcome trials. Lancet. (2019) 393:31–9. doi: 10.1016/S0140-6736(18)32590-X
24. Cowie MR, Fisher M. SGLT2 inhibitors: mechanisms of cardiovascular benefit beyond glycaemic control. Nat Rev Cardiol. (2020) 17:761–72. doi: 10.1038/s41569-020-0406-8
25. Nambu H, Takada S, Fukushima A, Matsumoto J, Kakutani N, Maekawa S, et al. Empagliflozin restores lowered exercise endurance capacity via the activation of skeletal muscle fatty acid oxidation in a murine model of heart failure. Eur J Pharmacol. (2020) 866:172810. doi: 10.1016/j.ejphar.2019.172810
26. Li X, Lu Q, Qiu Y, do Carmo JM, Wang Z, da Silva AA, et al. Direct cardiac actions of the sodium glucose co-transporter 2 inhibitor empagliflozin improve myocardial oxidative phosphorylation and attenuate pressure-overload heart failure. J Am Heart Assoc. (2021) 10:e018298. doi: 10.1161/JAHA.120.018298
27. Kumar N, Garg A, Bhatt DL, Sabongui S, Gupta N, Chaudhry S, et al. Empagliflozin improves cardiorespiratory fitness in type 2 diabetes: translational implications. Can J Physiol Pharmacol. (2018) 96:1184–7. doi: 10.1139/cjpp-2018-0359
28. Núñez J, Palau P, Domínguez E, Mollar A, Núñez E, Ramón JM, et al. Early effects of empagliflozin on exercise tolerance in patients with heart failure: a pilot study. Clin Cardiol. (2018) 41:476–80. doi: 10.1002/clc.22899
29. Carbone S, Canada JM, Billingsley HE, Kadariya D, Dixon DL, Trankle CR, et al. Effects of empagliflozin on cardiorespiratory fitness and significant interaction of loop diuretics. Diabetes Obes Metab. (2018) 20:2014–8. doi: 10.1111/dom.13309
30. Carbone S, Billingsley HE, Canada JM, Bressi E, Rotelli B, Kadariya D, et al. The effects of canagliflozin compared to sitagliptin on cardiorespiratory fitness in type 2 diabetes mellitus and heart failure with reduced ejection fraction: the CANA-HF study. Diabetes Metab Res Rev. (2020) 36:e3335. doi: 10.1002/dmrr.3335
31. Newman AA, Grimm NC, Wilburn JR, Schoenberg HM, Trikha SRJ, Luckasen GJ, et al. Influence of sodium glucose cotransporter 2 inhibition on physiological adaptation to endurance exercise training. J Clin Endocrinol Metab. (2019) 104:1953–66. doi: 10.1210/jc.2018-01741
32. Wald NJ, Simmonds M, Morris JK. Screening for future cardiovascular disease using age alone compared with multiple risk factors and age. PLoS ONE. (2011) 6:e18742. doi: 10.1371/journal.pone.0018742
33. Chamberlain JJ, Rhinehart AS, Shaefer CF Jr, Neuman Diagnosis A Management Management of Diabetes: Synopsis of the 2016. American diabetes association standards of medical care in diabetes. Ann Intern Med. (2016) 164:542–52. doi: 10.7326/M15-3016
34. Yancy CW, Jessup M, Bozkurt B, Butler J, Casey DE Jr, Colvin MM, et al. 2017 ACC/AHA/HFSA focused update of the 2013 ACCF/AHA guideline for the management of heart failure: a report of the American college of cardiology/American heart association task force on clinical practice guidelines and the heart failure society of America. Circulation. (2017) 136:e137–61. doi: 10.1161/CIR.0000000000000509
35. Goff DC Jr, Lloyd-Jones DM, Bennett G, Coady S, D'Agostino RB, Gibbons R, et al. 2013 ACC/AHA guideline on the assessment of cardiovascular risk: a report of the American college of cardiology/American heart association task force on practice guidelines. Circulation. (2014) 129 (25 Suppl. 2):S49–73. doi: 10.1161/01.cir.0000437741.48606.98
36. Alberti KG, Zimmet PZ. Definition, diagnosis and classification of diabetes mellitus and its complications. Part 1: diagnosis and classification of diabetes mellitus provisional report of a WHO consultation. Diabet Med. (1998) 15:539–53. doi: 10.1002/(SICI)1096-9136(199807)15:7<539::AID-DIA668>3.0.CO;2-S
37. Hampton S, Armstrong G, Ayyar MS, Li S. Quantification of perceived exertion during isometric force production with the Borg scale in healthy individuals and patients with chronic stroke. Top Stroke Rehabil. (2014) 21:33–9. doi: 10.1310/tsr2101-33
38. Morishita S, Tsubaki A, Nakamura M, Nashimoto S, Fu JB, Onishi H. Rating of perceived exertion on resistance training in elderly subjects. Expert Rev Cardiovasc Ther. (2019) 17:135–42. doi: 10.1080/14779072.2019.1561278
39. Lenze EJ, Munin MC, Quear T, Dew MA, Rogers JC, Begley AE, et al. The Pittsburgh rehabilitation participation scale: reliability and validity of a clinician-rated measure of participation in acute rehabilitation. Arch Phys Med Rehabil. (2004) 85:380–4. doi: 10.1016/j.apmr.2003.06.001
40. ATS Committee on Proficiency Standards for Clinical Pulmonary Function Laboratories. ATS statement: guidelines for the six-minute walk test. Am J Respir Crit Care Med. (2002). 166:111–7. doi: 10.1164/ajrccm.166.1.at1102
41. Gibbons WJ, Fruchter N, Sloan S, Levy RD. Reference values for a multiple repetition 6-minute walk test in healthy adults older than 20 years. J Cardiopulm Rehabil. (2001) 21:87–93. doi: 10.1097/00008483-200103000-00005
42. Balashov K, Feldman DE, Savard S, Houde S, Frenette M, Ducharme A, et al. Percent predicted value for the 6-minute walk test: using norm-referenced equations to characterize severity in persons with CHF. J Card Fail. (2008) 14:75–81. doi: 10.1016/j.cardfail.2007.09.005
43. Troosters T, Gosselink R, Decramer M. Six minute walking distance in healthy elderly subjects. Eur Respir J. (1999) 14:270–4. doi: 10.1034/j.1399-3003.1999.14b06.x
44. Passantino A, Lagioia R, Mastropasqua F, Scrutinio D. Short-term change in distance walked in 6 min is an indicator of outcome in patients with chronic heart failure in clinical practice. J Am Coll Cardiol. (2006) 48:99–105. doi: 10.1016/j.jacc.2006.02.061
45. Enright PL, McBurnie MA, Bittner V, Tracy RP, McNamara R, Arnold A, et al. The 6-min walk test: a quick measure of functional status in elderly adults. Chest. (2003) 123:387–98. doi: 10.1378/chest.123.2.387
46. Bjarnason-Wehrens B, Mayer-Berger W, Meister ER, Baum K, Hambrecht R, Gielen S. Recommendations for resistance exercise in cardiac rehabilitation. Recommendations of the German federation for cardiovascular prevention and rehabilitation. Eur J Cardiovasc Prev Rehabil. (2004) 11:352–61. doi: 10.1097/01.hjr.0000137692.36013.27
47. Vanhees L, Rauch B, Piepoli M, van Buuren F, Takken T, Börjesson M, et al. Importance of characteristics and modalities of physical activity and exercise in the management of cardiovascular health in individuals with cardiovascular disease (part III). Eur J Prev Cardiol. (2012) 19:1333–56. doi: 10.1177/2047487312437063
48. Rauch B, Salzwedel A, Bjarnason-Wehrens B, Albus C, Meng K, Schmid JP, et al. Cardiac rehabilitation in german speaking countries of Europe-evidence-based guidelines from Germany, Austria and Switzerland LLKardReha-DACH-Part 1. J Clin Med. (2021) 10:2192. doi: 10.3390/jcm10102192
49. McDermott MM, Ades PA, Dyer A, Guralnik JM, Kibbe M, Criqui MH. Corridor-based functional performance measures correlate better with physical activity during daily life than treadmill measures in persons with peripheral arterial disease. J Vasc Surg. (2008) 48:1231–7.e1. doi: 10.1016/j.jvs.2008.06.050
50. Rostagno C, Gensini GF. Six minute walk test: a simple and useful test to evaluate functional capacity in patients with heart failure. Intern Emerg Med. (2008) 3:205–12. doi: 10.1007/s11739-008-0130-6
51. Bellet RN, Adams L, Morris NR. The 6-minute walk test in outpatient cardiac rehabilitation: validity, reliability and responsiveness–a systematic review. Physiotherapy. (2012) 98:277–86. doi: 10.1016/j.physio.2011.11.003
52. Hayta E, Korkmaz Ö. Cardiac rehabilitation increases the reliability of the 6-minute walk test in patients after coronary artery bypass graft surgery. Heart Surg Forum. (2017) 20:E247–51. doi: 10.1532/hsf.1737
53. Fulk GD, Echternach JL, Nof L, O'Sullivan S. Clinometric properties of the six-minute walk test in individuals undergoing rehabilitation poststroke. Physiother Theory Pract. (2008) 24:195–204. doi: 10.1080/09593980701588284
54. Noonan V, Dean E. Submaximal exercise testing: clinical application and interpretation. Phys Ther. (2000) 80:782–807. doi: 10.1093/ptj/80.8.782
55. Fletcher GF, Froelicher VF, Hartley LH, Haskell WL, Pollock ML. Exercise standards. A statement for health professionals from the American heart association. Circulation. (1990) 82:2286–322. doi: 10.1161/01.CIR.82.6.2286
56. Gardner AW, Katzel LI, Sorkin JD, Bradham DD, Hochberg MC, Flinn WR, et al. Exercise rehabilitation improves functional outcomes and peripheral circulation in patients with intermittent claudication: a randomized controlled trial. J Am Geriatr Soc. (2001) 49:755–62. doi: 10.1046/j.1532-5415.2001.49152.x
57. Liu J, Drutz C, Kumar R, McVicar L, Weinberger R, Brooks D, et al. Use of the six-minute walk test poststroke: is there a practice effect? Arch Phys Med Rehabil. (2008) 89:1686–92. doi: 10.1016/j.apmr.2008.02.026
58. McDermott MM, Guralnik JM, Criqui MH, Liu K, Kibbe MR, Ferrucci L. Six-minute walk is a better outcome measure than treadmill walking tests in therapeutic trials of patients with peripheral artery disease. Circulation. (2014) 130:61–8. doi: 10.1161/CIRCULATIONAHA.114.007002
59. Bohannon RW, Crouch R. Minimal clinically important difference for change in 6-minute walk test distance of adults with pathology: a systematic review. J Eval Clin Pract. (2017) 23:377–81. doi: 10.1111/jep.12629
60. Fulk GD, He Y. Minimal clinically important difference of the 6-minute walk test in people with stroke. J Neurol Phys Ther. (2018) 42:235–40. doi: 10.1097/NPT.0000000000000236
61. McDermott MM, Liu K, Ferrucci L, Tian L, Guralnik JM, Liao Y, et al. Decline in functional performance predicts later increased mobility loss and mortality in peripheral arterial disease. J Am Coll Cardiol. (2011) 57:962–70. doi: 10.1016/j.jacc.2010.09.053
62. Fuentes-Abolafio IJ, Stubbs B, Pérez-Belmonte LM, Bernal-López MR, Gómez-Huelgas R, Cuesta-Vargas AI. Physical functional performance and prognosis in patients with heart failure: a systematic review and meta-analysis. BMC Cardiovasc Disord. (2020) 20:512. doi: 10.1186/s12872-020-01725-5
63. Boxer R, Kleppinger A, Ahmad A, Annis K, Hager D, Kenny A. The 6-minute walk is associated with frailty and predicts mortality in older adults with heart failure. Congest Heart Fail. (2010) 16:208–13. doi: 10.1111/j.1751-7133.2010.00151.x
64. Wegrzynowska-Teodorczyk K, Rudzinska E, Lazorczyk M, Nowakowska K, Banasiak W, Ponikowski P, et al. Distance covered during a six-minute walk test predicts long-term cardiovascular mortality and hospitalisation rates in men with systolic heart failure: an observational study. J Physiother. (2013) 59:177–87. doi: 10.1016/S1836-9553(13)70182-6
65. Lang RM, Badano LP, Mor-Avi V, Afilalo J, Armstrong A, Ernande L, et al. Recommendations for cardiac chamber quantification by echocardiography in adults: an update from the American society of echocardiography and the European association of cardiovascular imaging. J Am Soc Echocardiogr. (2015) 28:1–39.e14. doi: 10.1016/j.echo.2014.10.003
66. Dumesnil JG, Dion D, Yvorchuk K, Davies RA, Chan K. A new, simple and accurate method for determining ejection fraction by doppler echocardiography. Can J Cardiol. (1995) 11:1007–14.
67. Ponikowski P, Voors AA, Anker SD, Bueno H, Cleland JG, Coats AJ, et al. 2016 ESC guidelines for the diagnosis treatment of acute chronic heart failure: the task force for the diagnosis treatment of acute chronic heart failure of the European society of cardiology (ESC). Developed with the special contribution of the heart failure association (HFA) of the ESC. Eur J Heart Fail. (2016) 18:891–975. doi: 10.1002/ejhf.592
68. La Gerche A, Burns AT, Taylor AJ, Macisaac AI, Heidbüchel H, Prior DL. Maximal oxygen consumption is best predicted by measures of cardiac size rather than function in healthy adults. Eur J Appl Physiol. (2012) 112:2139–47. doi: 10.1007/s00421-011-2184-9
69. Steding K, Engblom H, Buhre T, Carlsson M, Mosén H, Wohlfart B, et al. Relation between cardiac dimensions and peak oxygen uptake. J Cardiovasc Magn Reson. (2010) 12:8. doi: 10.1186/1532-429X-12-8
70. Russo C, Jin Z, Elkind MS, Rundek T, Homma S, Sacco RL, et al. Prevalence and prognostic value of subclinical left ventricular systolic dysfunction by global longitudinal strain in a community-based cohort. Eur J Heart Fail. (2014) 16:1301–9. doi: 10.1002/ejhf.154
71. Penner IK, Raselli C, Stöcklin M, Opwis K, Kappos L, Calabrese P. The fatigue scale for motor and cognitive functions (FSMC): validation of a new instrument to assess multiple sclerosis-related fatigue. Mult Scler. (2009) 15:1509–17. doi: 10.1177/1352458509348519
72. Hubacher M, Calabrese P, Bassetti C, Carota A, Stöcklin M, Penner IK. Assessment of post-stroke fatigue: the fatigue scale for motor and cognitive functions. Eur Neurol. (2012) 67:377–84. doi: 10.1159/000336736
73. Laukkanen JA, Voutilainen A, Kurl S, Araujo CGS, Jae SY, Kunutsor SK. Handgrip strength is inversely associated with fatal cardiovascular and all-cause mortality events. Ann Med. (2020) 52:109–19. doi: 10.1080/07853890.2020.1748220
74. Lopez-Jaramillo P, Cohen DD, Gómez-Arbeláez D, Bosch J, Dyal L, Yusuf S, et al. Association of handgrip strength to cardiovascular mortality in pre-diabetic and diabetic patients: a subanalysis of the ORIGIN trial. Int J Cardiol. (2014) 174:458–61. doi: 10.1016/j.ijcard.2014.04.013
75. Yates T, Zaccardi F, Dhalwani NN, Davies MJ, Bakrania K, Celis-Morales CA, et al. Association of walking pace and handgrip strength with all-cause, cardiovascular, and cancer mortality: a UK Biobank observational study. Eur Heart J. (2017) 38:3232–40. doi: 10.1093/eurheartj/ehx449
76. Kim Y, Wijndaele K, Lee DC, Sharp SJ, Wareham N, Brage S. Independent and joint associations of grip strength and adiposity with all-cause and cardiovascular disease mortality in 403,199 adults: the UK Biobank study. Am J Clin Nutr. (2017) 106:773–82. doi: 10.3945/ajcn.117.156851
77. Farmer RE, Mathur R, Schmidt AF, Bhaskaran K, Fatemifar G, Eastwood SV, et al. Associations between measures of sarcopenic obesity and risk of cardiovascular disease and mortality: a cohort study and mendelian randomization analysis using the UK biobank. J Am Heart Assoc. (2019) 8:e011638. doi: 10.1161/JAHA.118.011638
78. Holmes SJ, Allen SC, Roberts HC. Relationship between lung function and grip strength in older hospitalized patients: a pilot study. Int J Chron Obstruct Pulmon Dis. (2017) 12:1207–12. doi: 10.2147/COPD.S120721
79. Kim NS. Correlation between grip strength and pulmonary function and respiratory muscle strength in stroke patients over 50 years of age. J Exerc Rehabil. (2018) 14:1017–23. doi: 10.12965/jer.1836444.222
80. Kera T, Kawai H, Hirano H, Kojima M, Fujiwara Y, Ihara K, et al. Relationships among peak expiratory flow rate, body composition, physical function, and sarcopenia in community-dwelling older adults. Aging Clin Exp Res. (2018) 30:331–40. doi: 10.1007/s40520-017-0777-9
81. Liu XM, Liu YJ, Zhan J, He QQ. Overweight, obesity and risk of all-cause and cardiovascular mortality in patients with type 2 diabetes mellitus: a dose-response meta-analysis of prospective cohort studies. Eur J Epidemiol. (2015) 30:35–45. doi: 10.1007/s10654-014-9973-5
82. Lee DH, Ha KH, Kim HC, Kim DJ. Association of body mass index with risk of major adverse cardiovascular events and mortality in people with diabetes. J Obes Metab Syndr. (2018) 27:61–70. doi: 10.7570/jomes.2018.27.1.61
83. Chen Y, Yang X, Wang J, Li Y, Ying D, Yuan H. Weight loss increases all-cause mortality in overweight or obese patients with diabetes: a meta-analysis. Medicine. (2018) 97:e12075. doi: 10.1097/MD.0000000000012075
84. Lee AK, Woodward M, Wang D, Ohkuma T, Warren B, Sharrett AR, et al. The risks of cardiovascular disease and mortality following weight change in adults with diabetes: results from ADVANCE. J Clin Endocrinol Metab. (2020) 105:152–62. doi: 10.1210/clinem/dgz045
85. Carbone S, Del Buono MG, Ozemek C, Lavie CJ. Obesity, risk of diabetes and role of physical activity, exercise training and cardiorespiratory fitness. Prog Cardiovasc Dis. (2019) 62:327–33. doi: 10.1016/j.pcad.2019.08.004
86. Baumgartner RN, Koehler KM, Gallagher D, Romero L, Heymsfield SB, Ross RR, et al. Epidemiology of sarcopenia among the elderly in New Mexico. Am J Epidemiol. (1998) 147:755–63. doi: 10.1093/oxfordjournals.aje.a009520
87. Abe T, Thiebaud RS, Loenneke JP, Young KC. Prediction and validation of DXA-derived appendicular lean soft tissue mass by ultrasound in older adults. Age. (2015) 37:114. doi: 10.1007/s11357-015-9853-2
88. Abe T, Loenneke JP, Young KC, Thiebaud RS, Nahar VK, Hollaway KM, et al. Validity of ultrasound prediction equations for total and regional muscularity in middle-aged and older men and women. Ultrasound Med Biol. (2015) 41:557–64. doi: 10.1016/j.ultrasmedbio.2014.09.007
89. Nijholt W, Scafoglieri A, Jager-Wittenaar H, Hobbelen JSM, van der Schans CP. The reliability and validity of ultrasound to quantify muscles in older adults: a systematic review. J Cachexia Sarcopenia Muscle. (2017) 8:702–12. doi: 10.1002/jcsm.12210
90. Cawthon PM, Orwoll ES, Peters KE, Ensrud KE, Cauley JA, Kado DM, et al. Strong relation between muscle mass determined by d3-creatine dilution, physical performance, and incidence of falls and mobility limitations in a prospective cohort of older men. J Gerontol A Biol Sci Med Sci. (2019) 74:844–52. doi: 10.1093/gerona/gly129
91. Srikanthan P, Horwich TB, Tseng CH. Relation of muscle mass and fat mass to cardiovascular disease mortality. Am J Cardiol. (2016) 117:1355–60. doi: 10.1016/j.amjcard.2016.01.033
92. Kim Y, Han BD, Han K, Shin KE, Lee H, Kim TR, et al. Optimal cutoffs for low skeletal muscle mass related to cardiovascular risk in adults: the Korea national health and nutrition examination survey 2009-2010. Endocrine. (2015) 50:424–33. doi: 10.1007/s12020-015-0577-y
93. Spahillari A, Mukamal KJ, DeFilippi C, Kizer JR, Gottdiener JS, Djoussé L, et al. The association of lean and fat mass with all-cause mortality in older adults: the cardiovascular health study. Nutr Metab Cardiovasc Dis. (2016) 26:1039–47. doi: 10.1016/j.numecd.2016.06.011
94. Ticinesi A, Narici MV, Lauretani F, Nouvenne A, Colizzi E, Mantovani M, et al. Assessing sarcopenia with vastus lateralis muscle ultrasound: an operative protocol. Aging Clin Exp Res. (2018) 30:1437–43. doi: 10.1007/s40520-018-0958-1
95. Perkisas S, Bastijns S, Baudry S, Bauer J, Beaudart C, Beckwée D, et al. Application of ultrasound for muscle assessment in sarcopenia: 2020 SARCUS update. Eur Geriatr Med. (2021) 12:45–59. doi: 10.1007/s41999-020-00433-9
96. Harris-Love MO, Seamon BA, Teixeira C, Ismail C. Ultrasound estimates of muscle quality in older adults: reliability and comparison of photoshop and ImageJ for the grayscale analysis of muscle echogenicity. PeerJ. (2016) 4:e1721. doi: 10.7717/peerj.1721
97. Cruz-Jentoft AJ, Bahat G, Bauer J, Boirie Y, Bruyère O, Cederholm T, et al. Sarcopenia: revised European consensus on definition and diagnosis. Age Ageing. (2019) 48:16–31. doi: 10.1093/ageing/afy169
98. Ismail C, Zabal J, Hernandez HJ, Woletz P, Manning H, Teixeira C, et al. Diagnostic ultrasound estimates of muscle mass and muscle quality discriminate between women with and without sarcopenia. Front Physiol. (2015) 6:302. doi: 10.3389/fphys.2015.00302
99. Bauer TA, Reusch JE, Levi M, Regensteiner JG. Skeletal muscle deoxygenation after the onset of moderate exercise suggests slowed microvascular blood flow kinetics in type 2 diabetes. Diabetes Care. (2007) 30:2880–5. doi: 10.2337/dc07-0843
100. Bilak JM, Gulsin GS, McCann GP. Cardiovascular and systemic determinants of exercise capacity in people with type 2 diabetes mellitus. Ther Adv Endocrinol Metab. (2021) 12:2042018820980235. doi: 10.1177/2042018820980235
101. Landis JR, Koch GG. The measurement of observer agreement for categorical data. Biometrics. (1977) 33:159–74. doi: 10.2307/2529310
102. Mizrahi EH, Fleissig Y, Arad M, Kaplan A, Adunsky A. Functional outcome of ischemic stroke: a comparative study of diabetic and non-diabetic patients. Disabil Rehabil. (2007) 29:1091–5. doi: 10.1080/09638280600929177
103. Scrutinio D, Monitillo V, Guida P, Nardulli R, Multari V, Monitillo F, et al. Functional gain after inpatient stroke rehabilitation: correlates and impact on long-term survival. Stroke. (2015) 46:2976–80. doi: 10.1161/STROKEAHA.115.010440
104. Roman de Mettelinge T, Cambier D, Calders P, Van Den Noortgate N, Delbaere K. Understanding the relationship between type 2 diabetes mellitus and falls in older adults: a prospective cohort study. PLoS ONE. (2013) 8:e67055. doi: 10.1371/journal.pone.0067055
105. Gravesande J, Richardson J. Identifying non-pharmacological risk factors for falling in older adults with type 2 diabetes mellitus: a systematic review. Disabil Rehabil. (2017) 39:1459–65. doi: 10.1080/09638288.2016.1199741
106. Koç M, Bozkurt A, Yildiray-Sahin D, Unal I, Acartürk E. Cutoff values of NT-proBNP for the prediction of low functional capacity, decreased ejection fraction and cardiovascular events in patients with heart failure. Cardiol J. (2009) 16:43–9.
107. Grewal J, McKelvie RS, Persson H, Tait P, Carlsson J, Swedberg K, et al. Usefulness of N-terminal pro-brain natriuretic peptide and brain natriuretic peptide to predict cardiovascular outcomes in patients with heart failure and preserved left ventricular ejection fraction. Am J Cardiol. (2008) 102:733–7. doi: 10.1016/j.amjcard.2008.04.048
108. Sir JJ, Chung WY, Hwang SJ, Kang HJ, Cho YS, Koo BK, et al. N-terminal pro-B-type natriuretic peptide as a predictor of repeat coronary revascularization. Int J Cardiol. (2008) 126:322–32. doi: 10.1016/j.ijcard.2007.04.007
109. Wolber T, Maeder M, Rickli H, Riesen W, Binggeli C, Duru F, et al. N-terminal pro-brain natriuretic peptide used for the prediction of coronary artery stenosis. Eur J Clin Invest. (2007) 37:18–25. doi: 10.1111/j.1365-2362.2007.01731.x
110. Beckie TM, Beckstead JW, Kip K, Fletcher G. Physiological and exercise capacity improvements in women completing cardiac rehabilitation. J Cardiopulm Rehabil Prev. (2013) 33:16–25. doi: 10.1097/HCR.0b013e3182763192
111. Cao Q, Yu S, Xiong W, Li Y, Li H, Li J, et al. Waist-hip ratio as a predictor of myocardial infarction risk: a systematic review and meta-analysis. Medicine. (2018) 97:e11639. doi: 10.1097/MD.0000000000011639
112. de Koning L, Merchant AT, Pogue J, Anand SS. Waist circumference and waist-to-hip ratio as predictors of cardiovascular events: meta-regression analysis of prospective studies. Eur Heart J. (2007) 28:850–6. doi: 10.1093/eurheartj/ehm026
113. Lee JE. Simply the best: anthropometric indices for predicting cardiovascular disease. Diabetes Metab J. (2019) 43:156–7. doi: 10.4093/dmj.2019.0057
114. Brancaccio P, Maffulli N, Buonauro R, Limongelli FM. Serum enzyme monitoring in sports medicine. Clin Sports Med. (2008) 27:1–18, vii. doi: 10.1016/j.csm.2007.09.005
115. Tangvoraphonkchai K, Davenport A. Magnesium cardiovascular disease. Adv Chronic Kidney Dis. (2018) 25:251–60. doi: 10.1053/j.ackd.2018.02.010
116. Wang R, Chen C, Liu W, Zhou T, Xun P, He K, et al. The effect of magnesium supplementation on muscle fitness: a meta-analysis and systematic review. Magnes Res. (2017) 30:120–32. doi: 10.1684/mrh.2018.0430
117. Pilz S, Verheyen N, Grübler MR, Tomaschitz A, März W. Vitamin D and cardiovascular disease prevention. Nat Rev Cardiol. (2016) 13:404–17. doi: 10.1038/nrcardio.2016.73
118. von Haehling S, Jankowska EA, van Veldhuisen DJ, Ponikowski P, Anker SD. Iron deficiency and cardiovascular disease. Nat Rev Cardiol. (2015) 12:659–69. doi: 10.1038/nrcardio.2015.109
119. Dipti A, Soucy Z, Surana A, Chandra S. Role of inferior vena cava diameter in assessment of volume status: a meta-analysis. Am J Emerg Med. (2012) 30:1414–9.e1. doi: 10.1016/j.ajem.2011.10.017
120. Riccardi A, Chiarbonello B, Minuto P, Guiddo G, Corti L, Lerza R. Identification of the hydration state in emergency patients: correlation between caval index and BUN/creatinine ratio. Eur Rev Med Pharmacol Sci. (2013) 17:1800–3.
121. Lamberti N, Straudi S, Malagoni AM, Argirò M, Felisatti M, Nardini E, et al. Effects of low-intensity endurance and resistance training on mobility in chronic stroke survivors: a pilot randomized controlled study. Eur J Phys Rehabil Med. (2017) 53:228–39. doi: 10.23736/S1973-9087.16.04322-7
122. Newman AB, Simonsick EM, Naydeck BL, Boudreau RM, Kritchevsky SB, Nevitt MC, et al. Association of long-distance corridor walk performance with mortality, cardiovascular disease, mobility limitation, and disability. JAMA. (2006) 295:2018–26. doi: 10.1001/jama.295.17.2018
123. Bassett DR Jr, Howley ET. Limiting factors for maximum oxygen uptake and determinants of endurance performance. Med Sci Sports Exerc. (2000) 32:70–84. doi: 10.1097/00005768-200001000-00012
Keywords: SGLT-2-inhibitors, atherosclerotic cardiovascular disease, high cardiovascular risk, type II diabetes mellitus, glycemic control, physical performance
Citation: Frundi DS, Kettig E, Popp LL, Hoffman M, Dumartin M, Hughes M, Lamy E, Fru YJW, Bano A, Muka T and Wilhelm M (2022) Physical performance and glycemic control under SGLT-2-inhibitors in patients with type 2 diabetes and established atherosclerotic cardiovascular diseases or high cardiovascular risk (PUSH): Design of a 4-week prospective observational study. Front. Cardiovasc. Med. 9:907385. doi: 10.3389/fcvm.2022.907385
Received: 29 March 2022; Accepted: 24 June 2022;
Published: 22 July 2022.
Edited by:
Andre Rodrigues Duraes, Federal University of Bahia, BrazilReviewed by:
Samit Ghosal, Nightingale Hospital, IndiaApi Chewcharat, Mount Auburn Hospital, United States
Francesco Prattichizzo, MultiMedica Holding SpA (IRCCS), Italy
Copyright © 2022 Frundi, Kettig, Popp, Hoffman, Dumartin, Hughes, Lamy, Fru, Bano, Muka and Wilhelm. This is an open-access article distributed under the terms of the Creative Commons Attribution License (CC BY). The use, distribution or reproduction in other forums is permitted, provided the original author(s) and the copyright owner(s) are credited and that the original publication in this journal is cited, in accordance with accepted academic practice. No use, distribution or reproduction is permitted which does not comply with these terms.
*Correspondence: Devine S. Frundi, ZGV2aW5lc2hpbWJhZ2hhLmZydW5kaUBob3BpdGFsdnMuY2g=