 Przemysław Palka1,2*
 Roland Hilling-Smith1,2
 Rohan Swann1,2Sean Allwood1,2Alexander Moore1,2Chris Bian1Aleksandra Lange1,2
- 1Queensland Cardiovascular Group, Brisbane, QLD, Australia
- 2Cardiac Catheterisation Laboratory, St Andrew's War Memorial Hospital, Brisbane, QLD, Australia
Introduction: Assessing filling pressure (FP) remains a clinical challenge despite advancements in non-invasive imaging techniques. This study investigates the utility of echocardiographic left ventricular (LV) to left atrial (LA) volume ratio in estimating the resting FP in patients with dyspnoea and preserved ejection fraction (EF).
Methods: This study is a prospective, single-centre analysis of 53 consecutive patients with dyspnoea (New York Heart Association grade 2 or 3) and LVEF of ≥50% (mean age 71 ± 10 years) who underwent cardiac catheterisation, including direct measurement of LA pressure at rest using retrograde technique. Echocardiographic data were obtained 1.5 ± 1.0 h after cardiac catheterisation. The patients were divided into two groups: Group 1 consisted of individuals with elevated FP, indicated by a mean LA pressure or mean pulmonary capillary wedge pressure of >12 mmHg, and Group 2 comprised of patients with normal FP. The LV and LA volumes were measured at three specific points: the minimum volume (LVES, LAmin), the volume during diastasis (LVdias, LAdias), and the maximum volume (LVED, LAmax). The corresponding LV/LA volume ratios were analysed: end-systole (LVES/LAmax), diastasis (LVdias/LAdias), and end-diastole (LVED/LAmin).
Results: The patients in Group 1 exhibited lower LV/LA volume ratios compared with those in Group 2 (LVES/LAmax 0.44 ± 0.12 vs. 0.60 ± 0.23, P = 0.0032; LVdias/LAdias 1.13 ± 0.30 vs. 1.56 ± 0.49, P = 0.0007; LVED/LAmin 2.71 ± 1.57 vs. 4.44 ± 1.70, P = 0.0004). The LV/LA volume ratios correlated inversely with an increased FP (LVES/LAmax, r = −0.40, P = 0.0033; LVdias/LAdias, r = −0.45, P = 0.0007; LVED/LAmin, r = −0.55, P < 0.0001). Among all the measurements, the LVdias/LAdias ratio demonstrated the highest discriminatory power to distinguish patients with elevated FP from normal FP, with a cut-off value of ≤1.24 [area under the curve (AUC) = 0.822] for the entire group, encompassing both sinus rhythm and atrial fibrillation. For patients in sinus rhythm specifically, the cut-off value was ≤1.28 (AUC = 0.799), with P < 0.0001 for both. The LVdias/LAdias index demonstrated non-inferiority to the E/e' ratio [ΔAUC = 0.159, confidence interval (CI) = −0.020–0.338; P = 0.0809], while surpassing the indices of LA reservoir function (ΔAUC = 0.249, CI = 0.044–0.454; P = 0.0176), LA reservoir strain (ΔAUC = 0.333, CI = 0.149–0.517; P = 0.0004), and LAmax index (ΔAUC = 0.224, CI = 0.043–0.406; P = 0.0152) in diagnosing patients with elevated FP.
Conclusion: The study presents a straightforward and reproducible method for non-invasive estimation of FP using routine TTE in patients with dyspnoea and preserved EF. The LVdias/LAdias index emerges as a promising indicator for identifying elevated FP, demonstrating comparable or even superior performance to established parameters.
Introduction
Elevated filling pressure (FP) contributes to dyspnoea and is central to heart failure (HF) pathogenesis (1). Accurate FP approximation is crucial for therapy optimisation and prognosis determination (2, 3). Cardiac catheterisation, the gold standard, is invasive and impractical for serial monitoring in all patients (4). Over the past three decades, extensive research has focused on a non-invasive, rapid, or bedside screening tool for FP assessment. The evaluation of left atrial (LA) pressure or pulmonary capillary wedge pressure, as opposed to left ventricular (LV) end-diastolic pressure, provides a more accurate reflection of the elevated FP (5, 6). This differentiation is essential as it ensures a more precise understanding of FP, as LV end-diastolic pressure primarily conveys information regarding LV compliance and preload. The current guidelines from the American Society of Echocardiography and the European Association of Cardiovascular Imaging (ASE/EACVI) advocate for the evaluation of mean left atrial (LA) pressure. This assessment involves a composite score derived from selected indices acquired through Doppler blood flow, tissue Doppler imaging, and LA volume measurements (7, 8). Recent data underscore that in patients falling into the indeterminate category, the inclusion of LA strain measurements can further enhance diagnostic accuracy (9, 10). Patients presenting suboptimal diagnostic image quality, atrial fibrillation, conduction abnormalities, and mitral annulus calcification pose challenges within the non-invasive assessment paradigm (11). Thus, the overall efficacy of the non-invasive approach in routine clinical settings remains challenging (12, 13). In our recent work, we used computed tomography images to demonstrate that patients with abnormal diastolic function, as determined by ASE/EACVI criteria and/or documented elevated LV end-diastolic pressure, exhibit a decrease in the ratio of LV-to-LA volume measured during diastasis, specifically below 1.40 (14). Therefore, we sought to test whether, in patients with dyspnoea and preserved LV ejection fraction (EF), transthoracic echocardiogram (TTE)-derived measurements of LV/LA volume ratio taken at predefined phases of the cardiac cycle, including the period of diastasis, could effectively estimate FP. To validate our findings, the TTE results were compared with measurements obtained from right and left heart catheterisation, including direct retrograde LA pressure.
Methods
Selection criteria
Between January 2021 and February 2022, out of a consecutive group of 66 patients referred to the Queensland Cardiovascular Group in Brisbane, Australia, for cardiac catheterisation, 53 patients were enrolled and prospectively analysed. The study cohort exhibited a diverse range of underlying pathologies, including ischaemic and non-ischaemic conditions, hypertension, type II diabetes, with or without atrial fibrillation, and accompanying conduction abnormalities. The inclusion criteria consisted of the presence of dyspnoea (New York Heart Association grade II or III), preserved LVEF (≥50%), and no underlying valvular disease (grade >2/4). Patients with hypertrophic cardiomyopathy and/or cardiac amyloidosis were also excluded. A total of 12 patients were excluded from the original referral group for the following reasons: five patients had an LVEF of <50% on restudy evaluation, three patients required coronary artery interventions due to documented obstructive coronary artery disease, and four patients had non-cardiac issues.
To mitigate potential bias, the study was conducted in a consecutive group of patients who were referred for a haemodynamic assessment, and all data were collected prospectively. Exclusion was minimal, with only one patient omitted due to the inadequate quality of the two-dimensional TTE image. All other patients with satisfactory TTE image quality were included in the study. The time interval between cardiac catheterisation and TTE was minimised, ensuring a close temporal alignment. None of the enrolled patients exhibited clinical instability, and there were no alterations in the therapeutic regimen during the period between cardiac catheterisation and TTE. The TTE was conducted in the cardiac catheterisation laboratory within an average of 1.5 ± 1.0 h after the haemodynamic study.
The average age of the participants was 71 ± 10 years, and 49% of them were female. Out of the total 53 patients included in the study, 15 patients (28%) had a history of previous coronary artery revascularisation (either percutaneous coronary artery intervention and/or coronary artery bypass graft surgery), 38 patients (72%) had hypertension, and 12 patients (23%) had type II diabetes.
Cardiac catheterisation
In all 53 patients, six French catheters were used for left heart catheterisation with the following access distribution: 48 patients had a right radial artery access, four patients had a right femoral artery access, and one patient had a left femoral artery access. Right heart catheterisation was performed in 43/53 patients. Six French catheters were used in 42 patients, whereas seven French catheters were used in one patient. In 38 cases, the right brachial vein was used as the access point, whereas the right femoral vein was used in four cases and the left femoral vein was used in one case. The direct measurements of LA pressure were obtained via the retrograde LV approach using a TIG catheter with side holes (15). All invasive haemodynamic measurements were acquired in a steady state during end-expiratory cycles. The offline measurements obtained from the LA pressure tracing include the mean LA pressure and the peaks observed during the V-wave, C-wave, and A-wave (patients in sinus rhythm). The measurements of LV end-diastolic pressure, mean right atrial pressure, pulmonary artery pressure, pulmonary artery wedge pressure, and pulmonary vascular resistance were obtained and calculated in a routine and standard manner.
TTE
The studies were acquired using commercially available equipment (Philips EPIQ CVx—Philips North America Corporation, Andover, Massachusetts, and Siemens SC2000—Siemens Medical Solutions, Mountain View, California). A standard imaging protocol, which included assessments of LV longitudinal strain and LA reservoir strain, was implemented for each patient. Apical views were meticulously optimised to prevent the foreshortening of both the LV and the LA. As a result, LV and LA volumes were measured in separate apical views. The LA volumes were measured using biplane Simpson’s method (from the four-chamber and the two-chamber views), excluding the LA appendage and the pulmonary veins (16). LA volumes were measured at the (i) maximum (LAmax), (ii) diastasis (LAdias), and (iii) minimum (LAmin) (17). Routine biplane Simpson's method was used to quantify LV volumes in (i) end-diastole (LVED), (ii) end-systole (LVES), and (iii) diastasis (LVdias), Figure 1. The diastasis period was determined through a visual assessment of the mitral valve motion and/or by considering the percentage of the cardiac cycle, as determined from Doppler mitral inflow velocities, and supported by a simultaneous electrocardiogram tracing. The measurements of LVdias and LAdias were consistently taken at 79% ± 6% (with a range of 65%–91%) of the cardiac cycle, irrespective of whether patients were in sinus rhythm or atrial fibrillation. All the measurements were averaged from three end-expiratory cardiac cycles in patients in sinus rhythm and from five end-expiratory cardiac cycles in patients with atrial fibrillation. As a result, three LV/LA ratios were calculated: end-systole (LVES/LAmax), diastasis (LVdias/LAdias), and end-diastole (LVED/LAmin), as depicted in Figure 2. To ensure quality and objectivity, all TTE measurements were conducted by very experienced sonographers, and echocardiographic data were independently and blindly analysed by RS, SA, and AM without access to the cardiac catheterisation results.
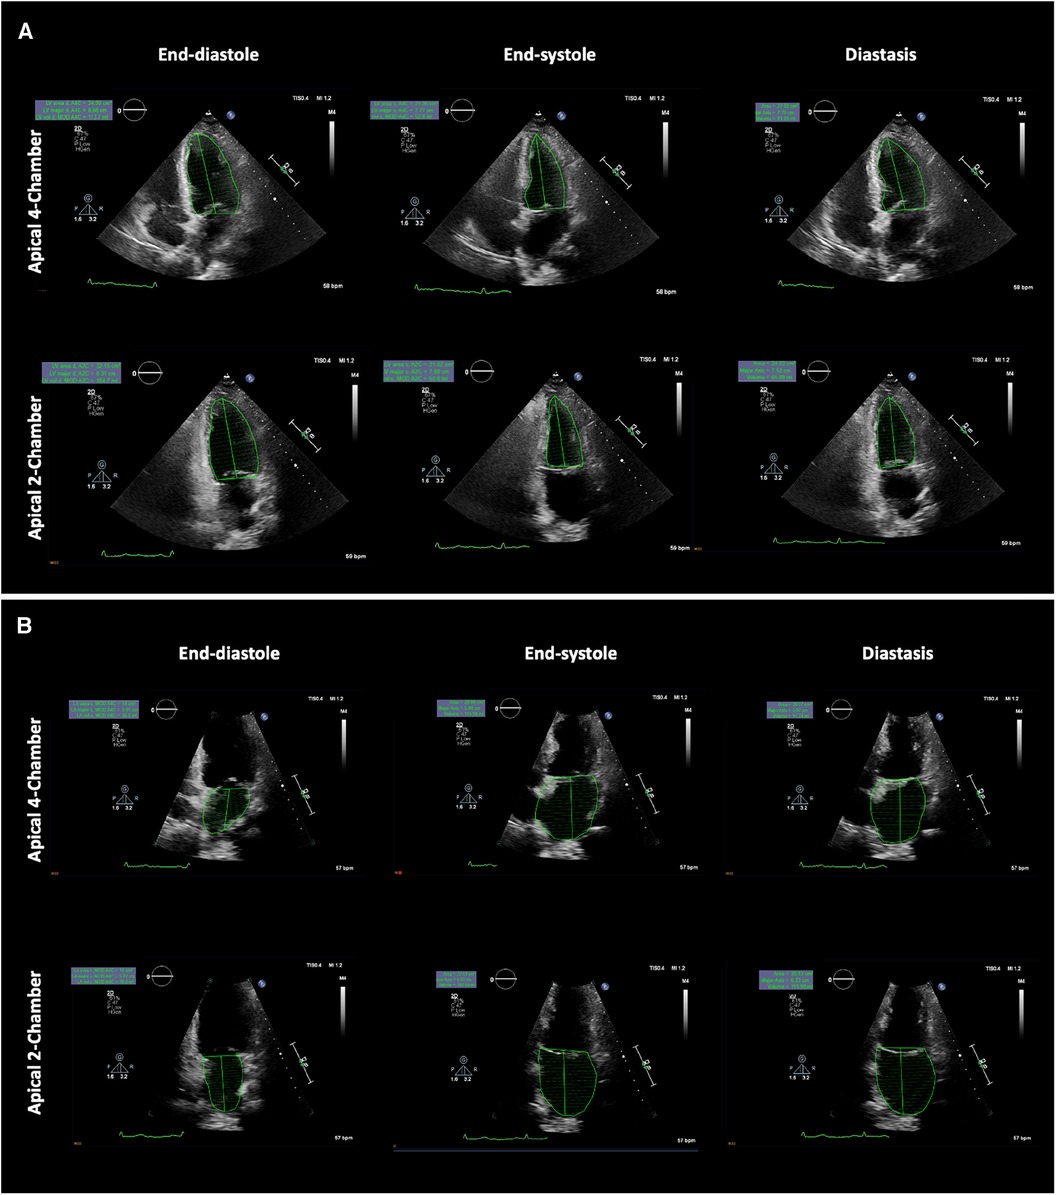
Figure 1. Example showing left ventricular and left atrial volume measurements at the specific phases of the cardiac cycle. (A) Left ventricle biplane Simpson's method (top panel apical four-chamber view, bottom panel apical two-chamber view) and (B) Left atrial biplane Simpson's method (top panel apical four-chamber view, bottom panel apical two-chamber view). LV and LA volumes were measured at the end-diastole (left panel), end-systole (middle panel), and in diastasis (right panel). LV, left ventricular; LA, left atrial.
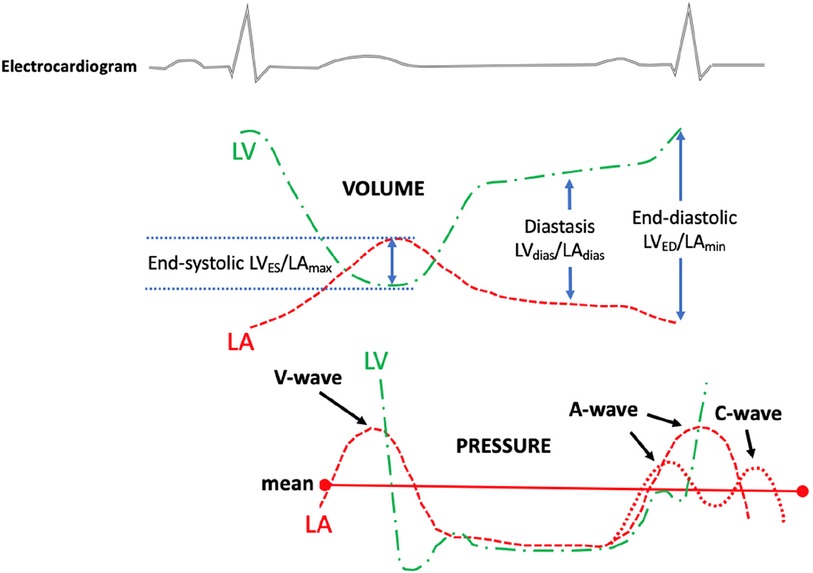
Figure 2. The diagram illustrates the measurement of the left ventricular to left atrial volume ratio (top panel) and the left atrial and left ventricular pressure (bottom panel). The left ventricular to left atrium volume ratio was measured from a routine transthoracic echocardiogram at certain phases of the cardiac cycle. The top dotted green line indicates LV volume changes during the cardiac cycle; the top red dotted line indicates LA volume changes during the cardiac cycle; the bottom green line indicates LV pressure changes during the cardiac cycle; and the bottom red dotted line indicates LA pressure changes during the cardiac cycle. LV, left ventricular/left ventricle; LA, left atrial; LVES, left ventricular end-systolic volume; LVED, left ventricular end-diastolic volume; LVdias, left ventricular diastasis volume; LAmax, left atrial maximum volume; LAmin, left atrial minimum volume; LAdias, left atrial diastasis volume.
The study complies with the Declaration of Helsinki. The study was approved by the UnitingCare Human Research Ethics Committee (number 2021.01.339), and informed consent has been obtained from all patients.
Statistical analysis
Continuous variables are expressed as mean ± standard deviation, and categorical variables are expressed as numbers and percentages. The sample power for testing the hypothesis that there will be a difference in the LV/LA volume ratio between the two groups (with a significance level of ∝ < 0.05) was calculated to be 0.934 for the potential 50 patients based on data from the first 12 patients. An unpaired t-test, chi-square, or Fisher exact test was used, when appropriate, for comparison in clinical, echocardiographic, and haemodynamic data. Linear regression and Pearson correlation were used to assess the relationship between echocardiographic variables and FP. For the assessment of predictive accuracy in predicting elevated FP, logistic regression analysis with power analysis was used to determine the area under the curve. Univariate linear regression with Pearson correlation coefficients was used to evaluate the relationship between FP and various TTE variables, including LV/LA ratios. A multivariate analysis of covariance (MANOVA) with the D'Agostino–Pearson test for normal distribution was employed to conduct a comprehensive linear regression comparison between LVdias/LAdias and clinical variables, including FP. In addition, multivariate analysis of covariance was applied to examine the interdependence of TTE indices in assessing elevated FP. Receiver operating curve comparisons were performed by the DeLong et al. method (1988). Sensitivity and specificity were calculated in a standard manner. Intraobserver and interobserver variability in LVdias, LAdias, and the ratio of LVdias/LAdias were assessed using the Bland and Altman method [mean difference ±2 standard deviation, 95% confidence interval (CI)]. All tests were two-sided, with a value of P < 0.05 considered significant. All analyses were performed by JMP 15 (SAS Institute, Cary, NC, USA) and MedCalc version 22.009 (Ostend, Belgium).
Results
The patients were divided into two groups: Group 1 consisted of 29 (55%) patients with elevated FP (with a mean LA pressure or pulmonary capillary wedge pressure of >12 mmHg), and Group 2 comprised 24 (45%) patients with normal FP (with a mean LA pressure or pulmonary capillary wedge pressure of ≤12 mmHg). Out of the entire cohort, direct LA pressure was measured in 44 (83%) patients, and in the remaining nine (17%) patients, the mean pulmonary capillary wedge pressure was analysed.
Table 1 presents the clinical characteristics of the study patients. No significant differences were observed in basic clinical characteristics, including age (Group 1 73 ± 9 years vs. Group 2 70 ± 11 years, P = 0.2666), gender, history of underlying hypertension, and/or type II diabetes. However, the body mass index was higher in Group 1 (30 ± 5 kg/m2) compared with that of Group 2 (26 ± 4 kg/m2, P = 0.0057). The patients in Group 1 had a higher prevalence of stage 3 chronic kidney disease (52% vs. 17%, P = 0.006), elevated levels of N-terminal-prohormone of brain natriuretic peptide (902 ± 1,226 pg/ml vs. 294 ± 346 pg/ml; P = 0.0216), and a greater frequency of using loop and/or thiazides diuretics (41% vs. 17%; P = 0.0467). There were no significant differences observed in the use of other medications, but there was a tendency for a more frequent use of aldosterone antagonists and sodium-glucose transport protein 2-receptor inhibitors in Group 1 compared with Group 2. Furthermore, the patients in Group 1 exhibited lower levels of high-density lipids and tended to be more treated for obstructive sleep apnoea. The documented history of paroxysmal atrial fibrillation was similar in both groups (Group 1, 31% vs. Group 2, 25%; P = 0.2493), but all patients with chronic/persistent atrial fibrillation (7/53) were in Group 1 (P = 0.0058).
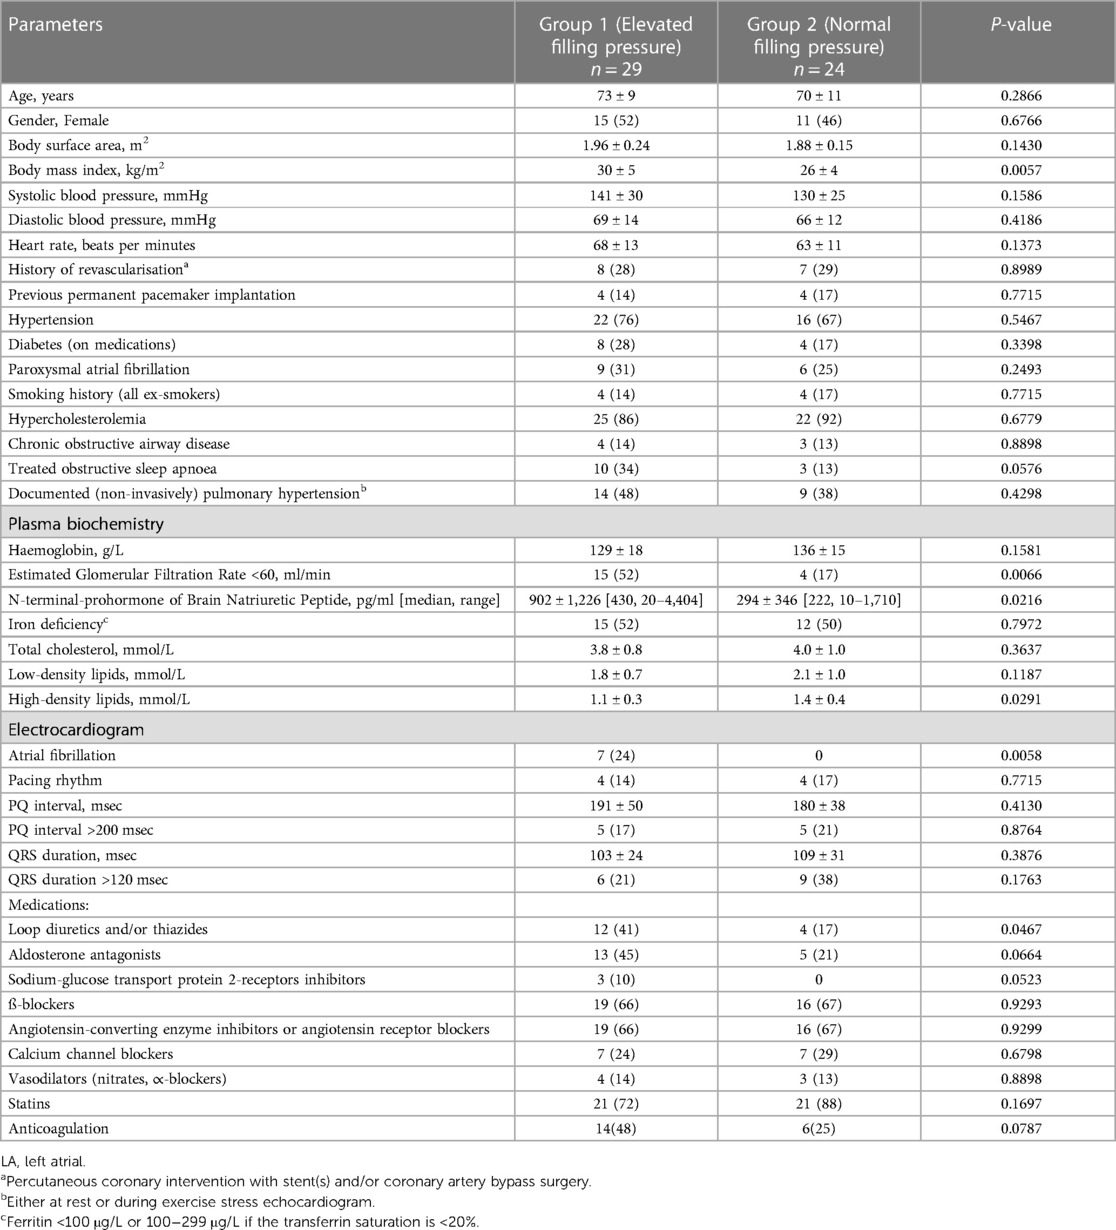
Table 1. Patients’ characteristics.
Haemodynamic data
The average mean LA pressure and mean pulmonary capillary pressure were higher in Group 1 (19 ± 5 mmHg and 17 ± 5 mmHg, respectively) compared with Group 2 (9 ± 2 mmHg and 11 ± 3 mmHg, respectively), P < 0.0001 for all. Also, the peak of C-, V-, and A-waves of LA pressure, LV end-diastolic pressure, and mean pulmonary artery pressure were higher in Group 1 compared with Group 2. Between Group 1 and Group 2, there were no differences in pulmonary vascular resistance or transpulmonary pressure gradient (Table 2).
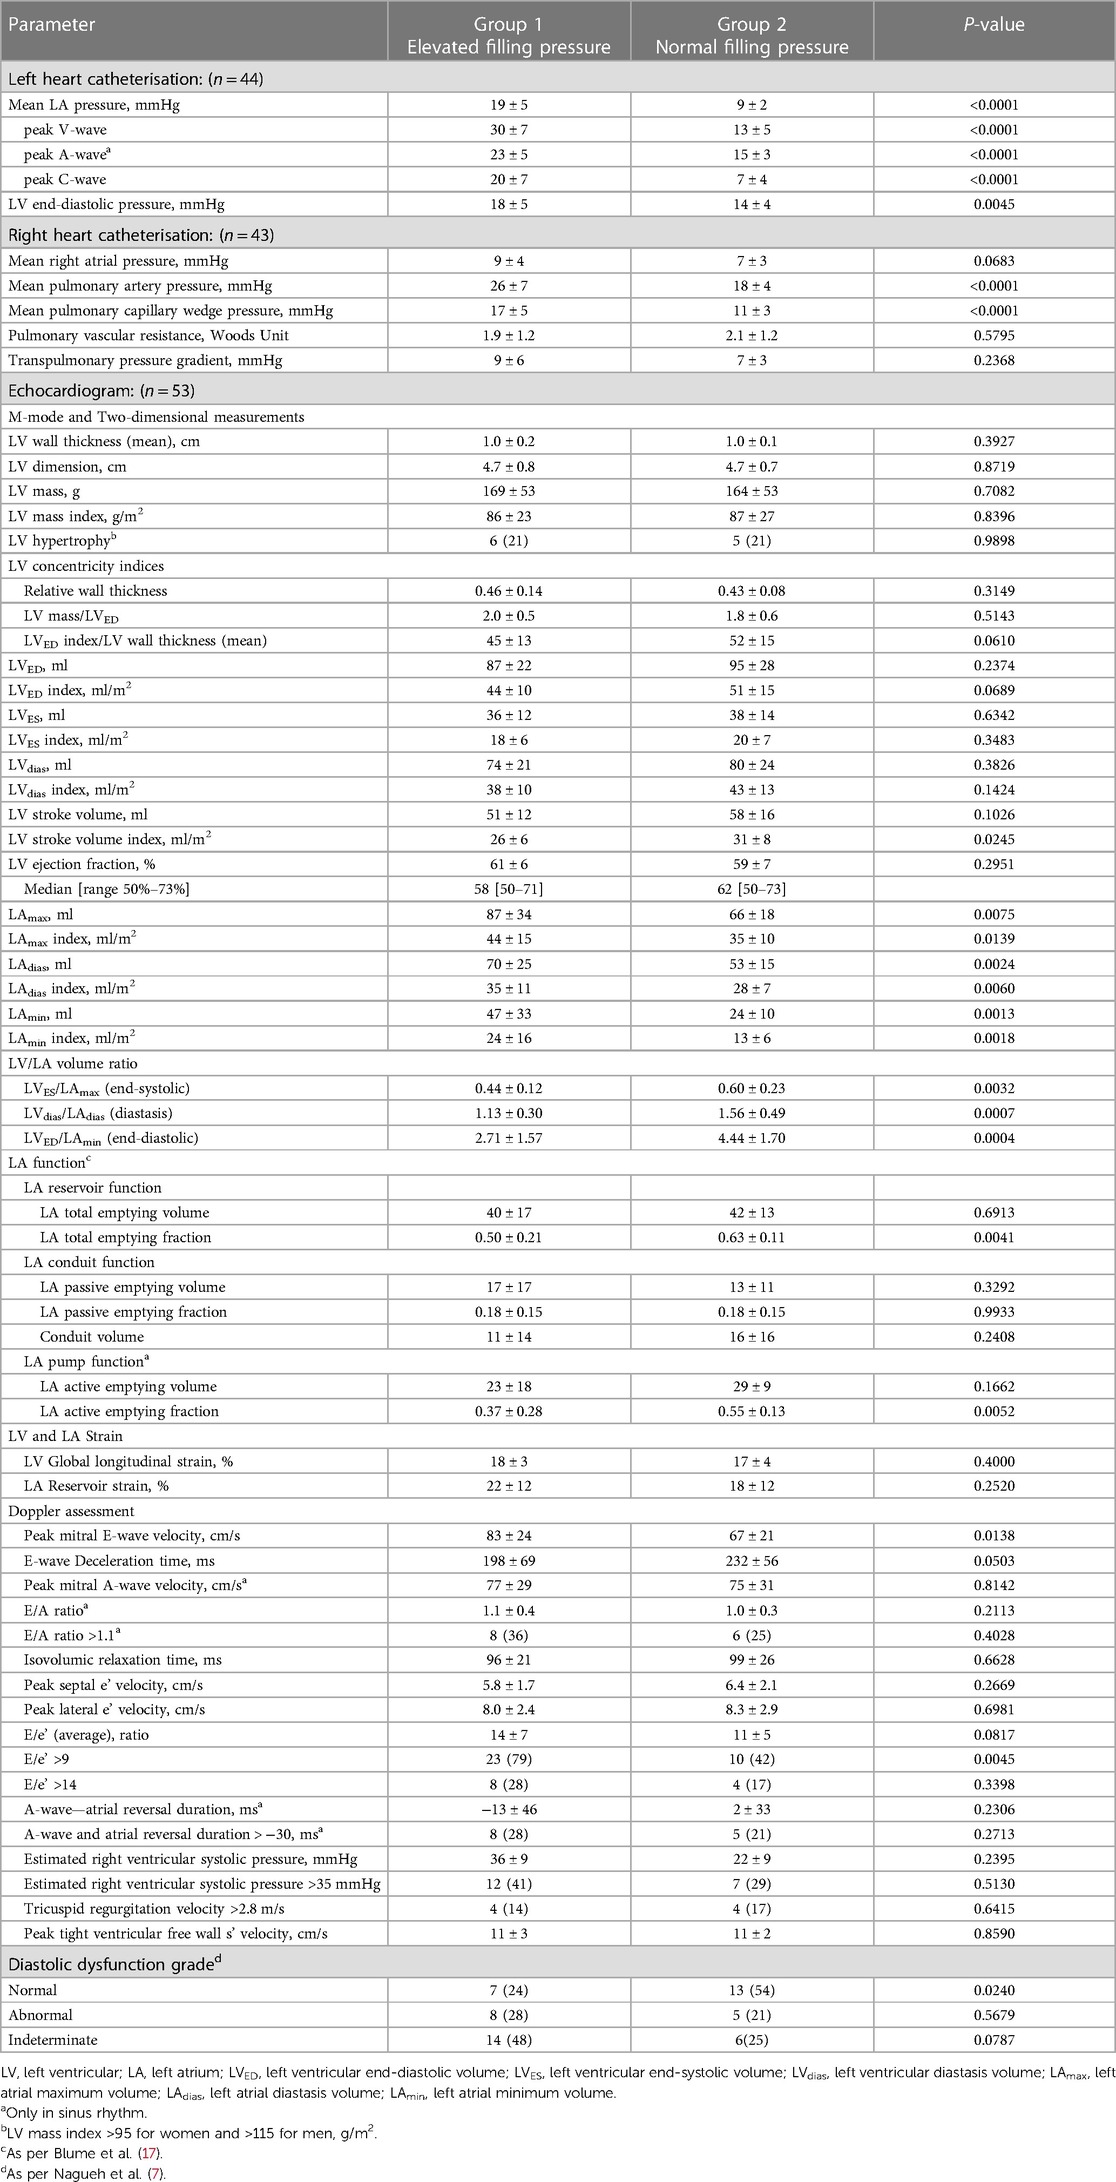
Table 2. Haemodynamic and echocardiographic data.
TTE data
The left ventricle
When comparing all recorded LV measurements, it was observed that only the LV stroke volume index exhibited a lower value in Group 1 compared with Group 2 (26 ± 6 ml/m2 vs. 31 ± 8 ml/m2; P = 0.0245). There were no differences found between Groups 1 and 2 in LV wall thickness, LV mass, LV mass index, LV hypertrophy, and LV concentricity indices (Table 2).
The left atrium
In Group 1, all measured LA volumes were higher compared with Group 2 (LAmax 87 ± 34 ml vs. 66 ± 18 ml, P = 0.0075; LAdias 70 ± 25 ml vs. 53 ± 15 ml, P = 0.0024; LAmin 47 ± 33 ml vs. 24 ± 10 ml, P = 0.0013; respectively). A similar pattern was noted when measured LA volumes were indexed by body surface area (LAmax index 44 ± 15 ml/m2 vs. 35 ± 10 ml/m2, P = 0.0139; LAdias index 35 ± 11 ml/m2 vs. 28 ± 7 ml/m2, P = 0.0060; LAmin index 24 ± 16 ml/m2 vs. 13 ± 6 ml/m2, P = 0.0018; respectively). Among LA function measurements, it was observed that only LA total emptying fraction (LA reservoir function) and LA active emptying fraction (LA pump function) were lower in Group 1 compared with Group 2 (0.50 ± 0.21 vs. 0.63 ± 0.11, P = 0.0041; and 0.37 ± 0.28 vs. 0.55 ± 0.13, P = 0.0052; respectively).
Strain measurement
Both LV global longitudinal strain and LA reservoir strain were similar in Group 1 and Group 2 (18% ± 3% vs. 17% ± 4%, P = 0.4000; and 22 ± 12 vs. 18 ± 12, P = 0.2520; respectively).
Doppler measurements
Group 1 exhibited a higher mitral inflow peak E-wave velocity compared with Group 2 (83 ± 24 cm/s vs. 67 ± 21 cm/s, P = 0.0138) and a higher proportion of patients with an E/e' ratio of >9 (79% vs. 42%, P = 0.0045). The percentage of patients with abnormal diastolic function (ASE/EACVI 2016 guidance) (7) did not differ between Group 1 and Group 2 (28% vs. 21%, P = 0.5679), but Group 2 had a higher proportion of patients with normal diastolic function compared with Group 1 (54% vs. 24%, P = 0.0240).
The ratio of left ventricle to left atrium volume
The LV/LA volume ratios were found to be lower in Group 1 for all three measurements.
1. The ratio of minimum LV to maximum LA volumes (LVES/LAmax) was 0.44 ± 0.12 in Group 1 and 0.60 ± 0.23 in Group 2 (P = 0.0032).
2. The ratio taken in LV diastasis (LVdias/LAdias) was 1.13 ± 0.30 in Group 1 and 1.56 ± 0.49 in Group 2 (P = 0.0007).
3. The ratio of maximum LV to minimum LA volumes (LVED/LAmin) was 2.71 ± 1.57 in Group 1 and 4.44 ± 1.70 in Group 2 (P = 0.0004).
Figure 3 illustrates an inverse correlation between the reduction in all three LV/LA ratio indices and the values of FP. The correlation between LV/LA ratio indices and FP remained consistent regardless of the underlying rhythm, whether it was sinus rhythm or atrial fibrillation. This independence strengthens the reliability of the LV/LA ratio indices as markers for FP, regardless of the patient's rhythm status.
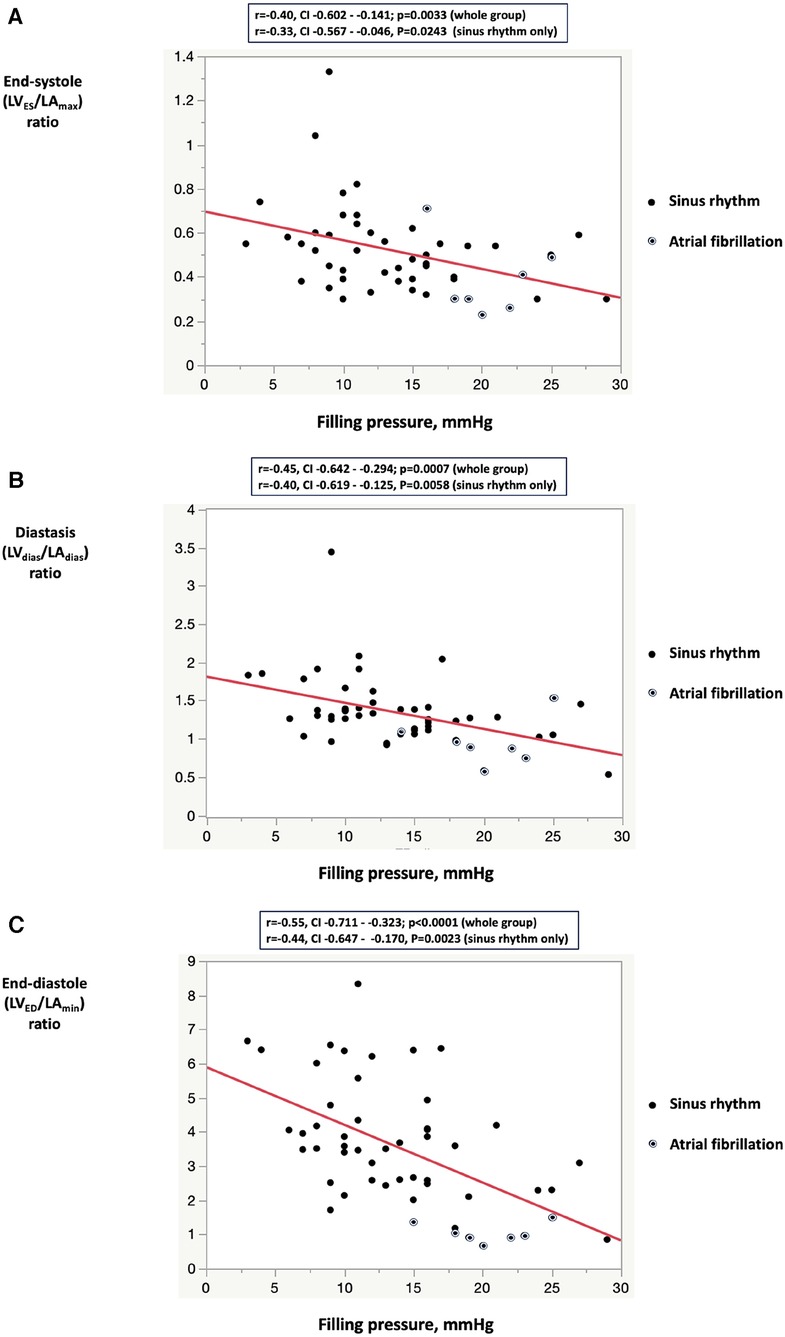
Figure 3. Correlation between filling pressure and the left ventricular to left atrial volume ratio indices: (A) left ventricular end-systolic volume to left arial maximum volume ratio; (B) left ventricular diastasis volume to left atrial diastasis volume ratio; (C) left ventricular end-diastolic volume to left atrial minimum volume ratio. In the sinus rhythm subgroup analysis, all three LV/LA volume indexes were lower in Group 1 compared with Group 2 (LVES/LAmax 0.46 ± 0.10 vs. 0.60 ± 0.23, P = 0.0087; LVdias/LAdias 1.19 ± 0.28 vs. 1.56 ± 0.49, P = 0.0029, LVED/LAmin 3.24 ± 1.43 vs. 4.44 ± 1.70, P = 0.0123). LVES, left ventricular end-systolic volume; LVED, left ventricular end-diastolic volume; LVdias, left ventricular diastasis volume; LAmax, left atrial maximum volume, LAmin, left atrial minimum volume; LAdias, left atrial diastasis volume.
The analysis of all the TTE parameters revealed that each of the three LV/LA volume ratio indices—LVES/LAmax, LVdias/LAdias, and LVED/LAmin—exhibited high discriminatory ability to diagnose patients with elevated FP. With cut-off values of ≤1.24 for LVdias/LAdias, ≤2.66 for LVED/LAmin, and ≤0.50 for LVES/LAmax, they demonstrated overall accuracies of 0.81, 0.73, and 0.73, respectively (Table 3A). The observed decrease in the LV/LA volume ratio in patients with elevated FP persists in the subgroup analysis limited to patients in sinus rhythm (Table 3B). Specifically, the LVdias/LAdias ratio maintains its prominence with the highest area under the curve (AUC) of 0.822 (for all patients) and of 0.799 (for patients with sinus rhythm), effectively distinguishing between those with elevated and normal FP. For patients in sinus rhythm, the assessment of LA volume measurements alone, including LAmax, LAdias, and LAmin (both absolute and index), as well as LA reservoir function and LA reservoir strain, demonstrated limited accuracy in distinguishing between individuals with elevated and normal FP when compared with the LV/LA volume ratio assessment. In the subgroup analysis of patients in sinus rhythm, the LVdias/LAdias measurement with a cut-off value of ≤1.28 emerged as the most accurate TTE parameter in distinguishing patients with elevated from normal FP (P < 0.0001).
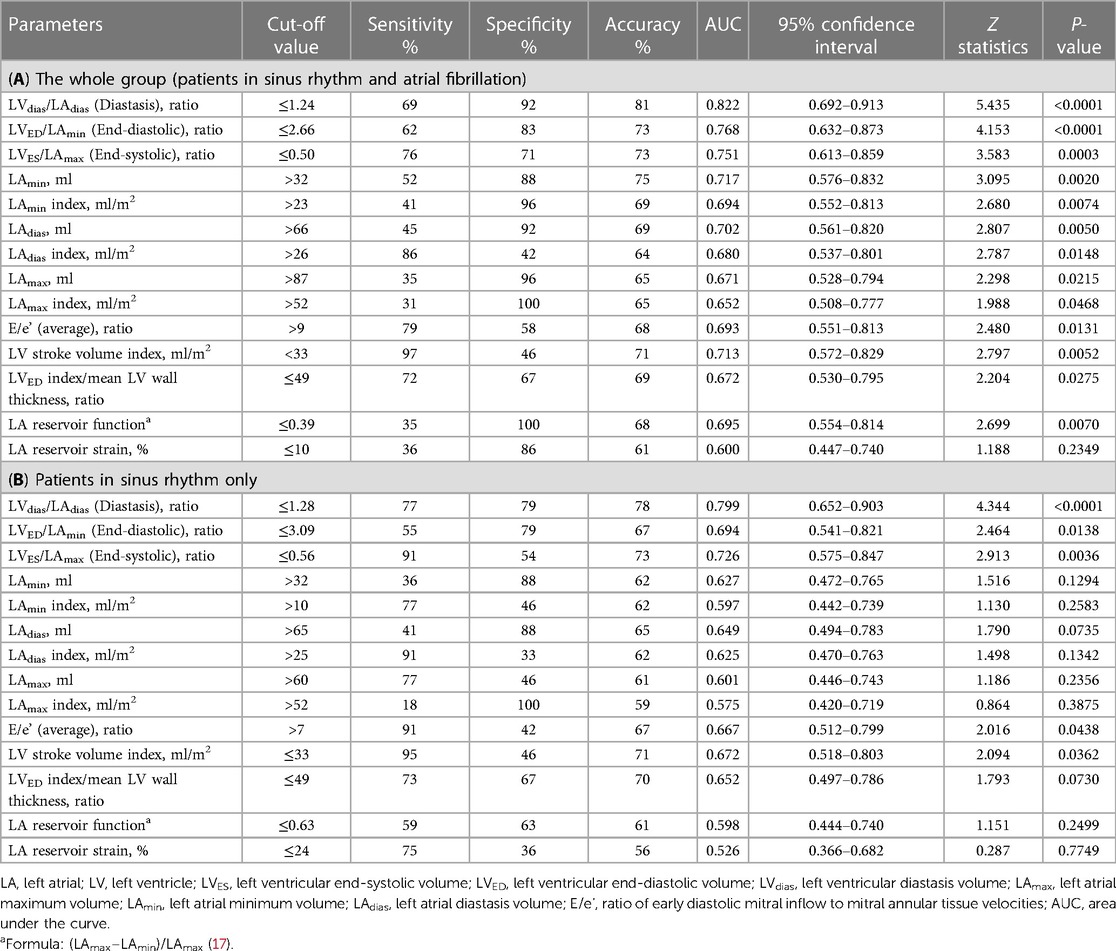
Table 3. Power analysis of echocardiographic parameters to diagnose elevated filling pressure.
Multivariate analysis
The multivariate regression analysis revealed a strong association between the reduction in LVdias/LAdias ratio and increased FP, with a weak correlation to patient age (Table 4). The decrease in the LVdias/LAdias ratio was found to be independent of atrial fibrillation and other comorbidities, including obesity, underlying hypertension, type II diabetes, or obstructive sleep apnoea. Among all the TTE measurements studied, only the LVdias/LAdias ratio demonstrated a significant correlation with the presence of elevated FP compared with other indices such as E/e', LA reservoir function, LA reservoir strain, LAmax index, and LAmin (correlation coefficient for multivariate comparison −0.528, standard error 0.181, P = 0.0058; with constant 1.496, coefficient of determination R2 0.332, and residual standard deviation 0.442).
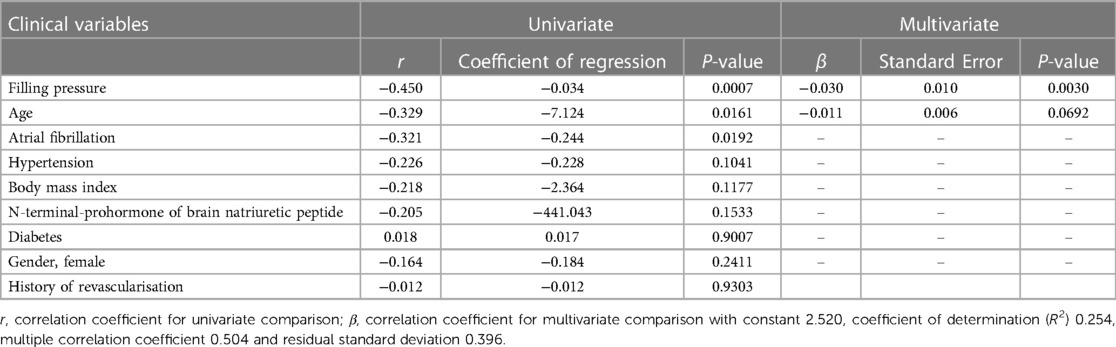
Table 4. Univariate and multivariate linear regression comparison between the echocardiographic left ventricular diastasis volume to left atrial diastasis volume ratio (LVdias/LAdias) and clinical variables.
The comparison of logistic regression analysis curves demonstrated that the LVdias/LAdias ratio was non-inferior to the E/e' ratio in diagnosing patients with elevated FP (for all: ΔAUC = 0.139, CI = −0.014–0.313, P = 0.1177; for sinus rhythm: ΔAUC = 0.159, CI = −0.020–0.338, P = 0.0809, Figure 4). Particularly in patients in sinus rhythm, the LVdias/LAdias ratio measurements outperformed the other studied TTE parameters, including LAmax index (ΔAUC = 0.224, CI = 0.043–0.406, P = 0.0152), LA reservoir function (ΔAUC = 0.249, CI = 0.044–0.454, P = 0.0176), LA reservoir strain (ΔAUC = 0.333, CI = 0.149–0.517, P = 0.0004), and LV stroke volume index (ΔAUC = 0.220, CI = 0.037–0.404, P = 0.0185).
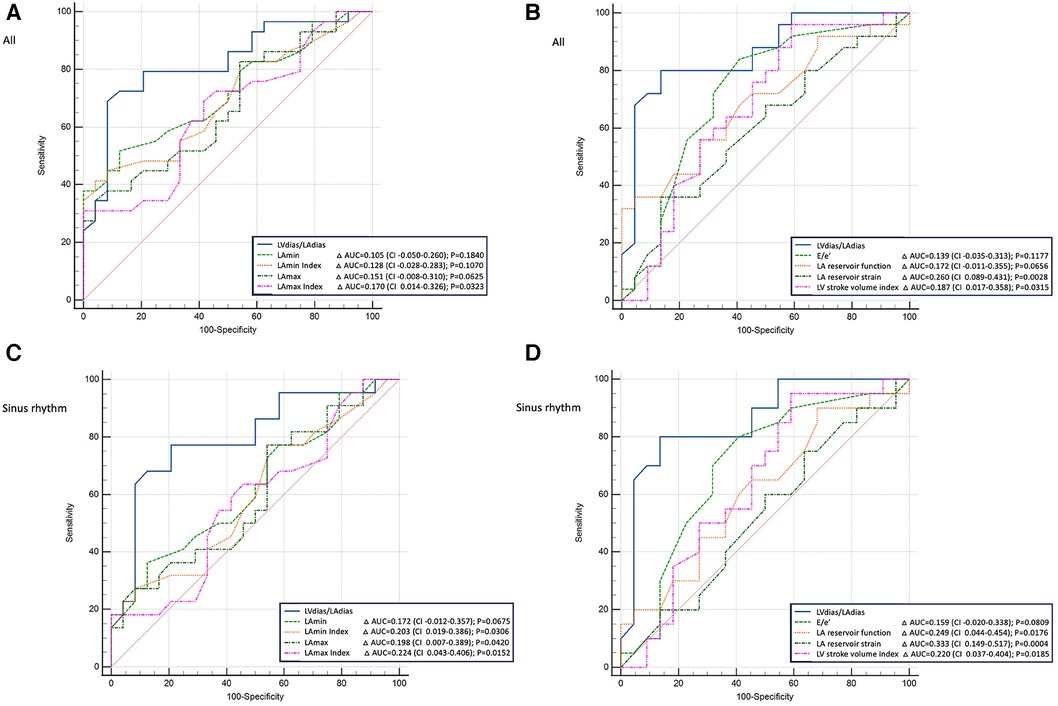
Figure 4. Comparison of power analysis of the receiver operating characteristic curves to diagnose patients with elevated filling pressure. (A,B) The whole group (patients with sinus rhythm or atrial fibrillation); (C,D) patients with sinus rhythm only. (A,C) The left ventricular diastasis volume to left atrial diastasis volume ratio compared with the left atrial maximum and minimum volumes (absolute values and index for body surface area). (B,D) The left ventricular diastasis volume to left atrial diastasis volume ratio compared with early diastolic mitral inflow to mitral annulus velocity ratio, left atrial reservoir function, left atrial reservoir strain, and left ventricle stroke volume index. LVdias/LAdias, left ventricular diastasis volume to left atrial diastasis volume ratio; E/e’, early diastolic mitral inflow to mitral annular tissue velocities ratio; LAmin, left atrial minimal volume; LAmax, left atrial maximum volume; CI, confidence interval; AUC, area under the curve.
Interobserver and intraobserver agreement
The agreement between LVdias and LAdias measurements was evaluated in a subgroup of 15 randomly chosen patients. This assessment aimed to determine the consistency or similarity between these two measurements. The mean difference between two independent observers (interobserver variability) was 0 ± 10 ml for LVdias, −1 ± 10 ml for LAdias, and 0.03 ± 0.32 for LVdias/LAdias. The mean difference between two measurements performed by the same operator (intraobserver variability) was 0 ± 13 ml for LVdias, −1 ± 10 ml for LAdias, and 0.04 ± 0.32 for LVdias/LAdias.
Discussion
This prospective study involved a consecutive group of patients with persistent symptoms despite optimal medical therapy who subsequently underwent cardiac catheterisation. Our findings suggest that in individuals experiencing shortness of breath, lacking significant valve disease, and maintaining preserved LVEF, a non-invasive estimation of FP is possible using the LV/LA volume ratio obtained from standard two-dimensional TTE images.
Patients with elevated FP, defined by a mean LA pressure and/or pulmonary capillary wedge pressure higher than 12 mmHg, also displayed elevated LV end-diastolic pressure but not pulmonary vascular resistance or transpulmonary gradient (3–6). Consistent with existing literature, patients with elevated FP were characterised by a higher body mass index, elevated natriuretic peptide levels, a higher prevalence of chronic kidney disease, and a more frequent occurrence of persistent/chronic atrial fibrillation (18, 19).
Among all LV measurements, only the indexed LV stroke volume was shown to be reduced in patients with elevated FP, supporting the previously observed inverse relationship between LA pressure and LV stroke volume (20). The presence of increased LV wall thickness as well as concentric LV remodelling did not provide informative distinctions between patients with elevated and normal FP. These findings are also supported by previous studies, demonstrating that although LV hypertrophy is often present in patients with elevated FP, it is a non-specific finding (21).
Historically, LAmax measurement has been documented as a powerful predictor of survival following myocardial infarction (22). Recent research has linked an increase in LAmin to a poor prognosis in HF with preserved EF (23). We have observed that all measured LA volumes (LAmax, LAdias, LAmin) were higher in patients with elevated FP. Differences were observed in LA reservoir function and LA pump function among the investigated LA function parameters, consistent with the findings reported by others (24). Notably, LA reservoir strain showed similar values in patients with normal and elevated FP, aligning with previous research indicating that LA reservoir strain is determined by LV strain (25) and has limited value in assessing FP in patients with preserved EF compared with those with reduced EF (10). The increase in LA volume throughout the cardiac cycle, measured at LAmax, LAdias, and LAmin, and the observed impairment in LA reservoir function and strain observed in our study confirmed that the presence of atrial fibrillation contributes to LA remodelling.
Our data confirmed a well-documented inverse relationship between E/e' and FP (19, 26), but the combination of the scores recommended by ASE/EACVI provided limited assistance in distinguishing patients with elevated from normal FP (7). However, we did not evaluate the potential pathological increase in FP during exercise, which could reveal underlying diastolic dysfunction in some patients with normal resting FP (27).
The study showed a decrease in all three measured LV/LA volume ratios in patients with elevated FP. Among the TTE indices studied, the LVdias/LAdias ratio, with a cut-off value of ≤1.24 (for all patients, including those in atrial fibrillation) and ≤1.28 (for patients in sinus rhythm only) demonstrated the highest discriminatory ability for indicating elevated FP. This reduction in these LV/LA ratios correlated with the rate of increase in FP, as well as patients' age, as partially indicated in our previous work in patients with hypertension (28). A progressive reduction in the LVdias/LAdias ratio was observed in hypertensive heart disease and in patients with elevated resting FP, both in sinus rhythm and/or atrial fibrillation. This finding supports the potential clinical relevance of this ratio, with cut-off values of ≤1.62, ≤1.28, and ≤1.24, respectively, as illustrated in Figure 5.
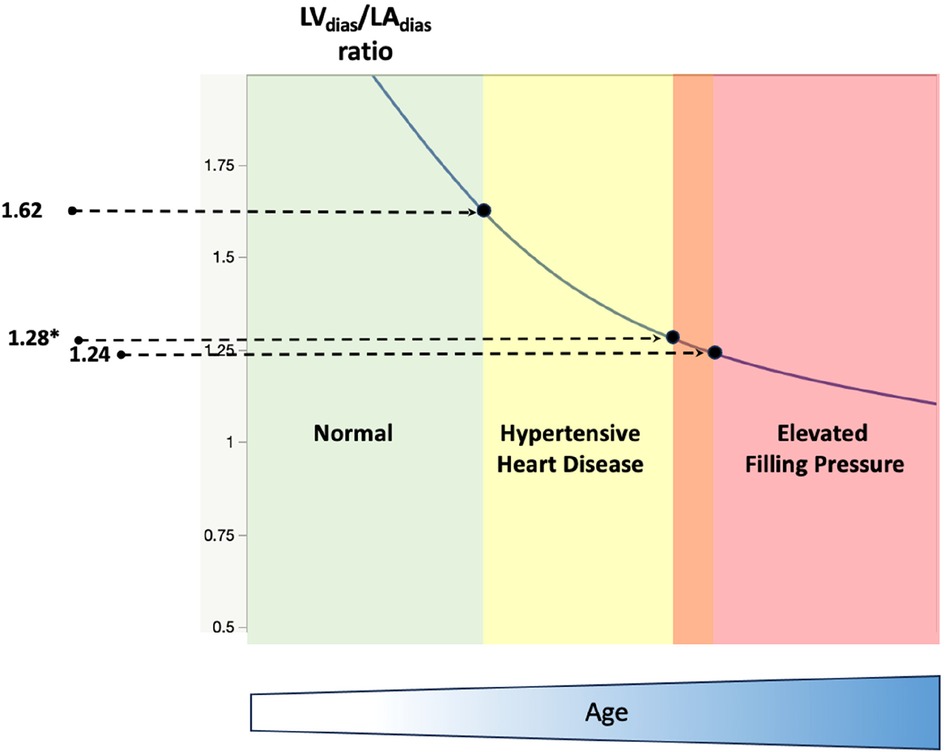
Figure 5. A schematic diagram illustrates the progressive reduction of the diastasis left ventricle to left atrial volume ratio in normal (left, green colour), hypertensive heart disease (middle, yellow colour), and patients with dyspnoea and elevated resting filling pressure (right, red colour). LVdias/LAdias, left ventricle diastasis volume to left atrial diastasis volume ratio. The cut-off value of LVdias/LAdias to diagnose hypertensive heart disease is ≤1.62 (27), and the cut-off value to diagnose patients with elevated filling pressure is ≤1.24 (*≤1.28 for patients in sinus rhythm only). Note that the reduction in LVdias/LAdias is also correlated with patients’ age (bottom, blue colour).
The LVdias/LAdias ratio demonstrated superior performance compared with other TTE parameters, including LAmax index, LA reservoir function, LA reservoir strain, and LV stroke volume index. These findings underscore the potential utility of the LVdias/LAdias ratio in assessing elevated FP. The LV/LA volume ratios demonstrated ease of measurements and good reproducibility, offering an attractive alternative to the current complex assessment of FP, which often requires combined information from different imaging modalities. An additional benefit is its consistent accuracy, unaffected by the underlying rhythm, whether it in is sinus rhythm or atrial fibrillation.
The reduced LV/LA ratio can be explained by the impaired net atrio-ventricular compliance due to chronic LA myopathic remodelling, with the LA wall becoming thinner and more compliant compared with a thicker and less compliant LV wall resulting from chronically elevated preload (29). The concept of the LV-to-LA volume ratio has been explored previously. Spevack et al. (30) found that in patients with hypertension or diabetes, the ratio of LA to LV diameter can serve as a marker of the diastolic LV pressure–volume relationship. Their findings align with the findings of our present study exploring LV/LA volume ratios as potential indicators of elevated FP. Recent studies in cardiac magnetic resonance imaging, conducted by Pezel et al. (31), demonstrated that the LA to LV volume ratio (LAmin to LVED) could offer incremental prognostic value for predicting HF events beyond traditional risk factors. In addition, Garg et al. (32) suggested that elevated LV FP can be estimated from both LV mass and LA volume. Our study demonstrated a weak correlation between FP and either LV mass or LAmax acquired by TTE. It is important to note that we did not analyse any other cardiac imaging techniques, including cardiac magnetic imaging.
Limitations
While our study involved a relatively small, consecutive group of patients, the inclusion of a small group of patients with chronic/persistent atrial fibrillation was intentional to address the diagnostic challenges posed by intrinsic atrial dysfunction, a key factor in HF (33, 34). We focused on patients with an LVEF cut-off value of ≥50%, and the potential role of LV/LA volume ratio indices in patients with reduced LVEF and/or valvular disease remains unknown. In addition, our cardiac catheterisation data were performed at rest, and potential exercise-related changes between FP and LV/LA volume ratio are unknown. The potential superiority of the proposed volumetric two-dimensional measurements, such as the LVdias/LAdias ratio, over other echocardiographic measurements, particularly LA strain, may be attributed to the inclusion of all examined patients without excluding them based on TTE image quality. Both LV and LA chamber volumes were manually traced by experienced sonographers, in contrast to the semiautomatic nature of obtaining LV or LA strain. This may explain the relatively lower accuracy of the LA strain, particularly in detecting elevated FP, as it was not limited to selected patients with good TTE image quality. Nevertheless, our study results indicate that the assessment of FP volume using the LVdias/LAdias ratio may be performed in essentially all patients, thereby providing a broader range of routine clinical applications.
Our study was performed on clinically stable patients. It is unknown whether our results could be incorporated in acute settings or in populations with significant valvular disease. Due to the fact that this was a single-centre study, further validation through a multicentre study should be considered.
Future research pathways and potential clinical applications
Further research should explore the establishment of normal values for LVdias/LAdias in various age subgroups, given that the present study focused on patients with a mean age of 71 years. Investigating the applicability of the LVdias/LAdias ratio across a broader spectrum of diseases is essential. For instance, assessing early changes in specific age groups, such as patients with diabetes or hypertension, before the onset of HF symptoms (stage A or B) could provide valuable insights. Furthermore, there is a need to investigate whether the LVdias/LAdias ratio can serve as a diastolic function parameter in developing machine-augmented echocardiography for diagnosing diastolic dysfunction and managing HF patients. This area requires additional study and may contribute to advancements in the diagnosis and management of HF (35, 36).
Clinical relevance
Our study highlights the LVdias/LAdias ratio as a straightforward volumetric assessment for evaluating FP in patients experiencing dyspnoea, particularly when a routine TTE indicates preserved LVEF (≥50%). This ratio is notable as a powerful and singular test that could significantly guide the management of HF patients. Monitoring changes in the LVdias/LAdias ratio may potentially allow not only the assessment of disease progression but, more importantly, facilitate the monitoring of treatment efficacy. Presently, there is no single TTE parameter that serves as a definitive tool for both the diagnosis and monitoring of the effects of medications or procedures on FP. Hence, the LVdias/LAdias ratio could serve as a dual-purpose diagnostic and management tool in both clinical practice and future research trials.
Summary
This study suggests that in patients with dyspnoea and preserved LV ejection fraction, estimating FP is possible using the LV/LA volume ratio derived from routine TTE. The LVdias/LAdias ratio demonstrated the highest discriminatory ability to differentiate between patients with elevated FP and normal FP. The proposed measures of the LV/LA volume ratio, which can be easily obtained and replicated using routine TTE images, could provide an alternative approach to the current complex assessment of FP.
Data availability statement
The raw data supporting the conclusions of this article will be made available by the authors, without undue reservation.
Ethics statement
The studies involving humans were approved by the UnitingCare Human Research Ethics Committee (number 2021.01.339). The studies were conducted in accordance with the local legislation and institutional requirements. The participants provided their written informed consent to participate in this study. Written informed consent was obtained from the individual(s) for the publication of any potentially identifiable images or data included in this article.
Author contributions
PP: Conceptualization, Data curation, Formal Analysis, Investigation, Methodology, Project administration, Resources, Software, Supervision, Validation, Visualization, Writing – original draft, Writing – review & editing. RH: Data curation, Investigation, Methodology, Supervision, Writing – original draft, Writing – review & editing. RS: Data curation, Formal Analysis, Investigation, Methodology, Resources, Supervision, Writing – original draft, Writing – review & editing. SA: Data curation, Formal Analysis, Investigation, Methodology, Resources, Supervision, Writing – original draft, Writing – review & editing. AM: Data curation, Formal Analysis, Investigation, Methodology, Supervision, Visualization, Writing – original draft, Writing – review & editing. CB: Data curation, Formal Analysis, Investigation, Methodology, Project administration, Resources, Supervision, Visualization, Writing – original draft, Writing – review & editing. AL: Conceptualization, Data curation, Formal Analysis, Funding acquisition, Investigation, Methodology, Project administration, Resources, Software, Supervision, Validation, Visualization, Writing – original draft, Writing – review & editing.
Funding
The author(s) declare that no financial support was received for the research, authorship, and/or publication of this article.
Acknowledgments
This work was facilitated by Queensland Cardiovascular Group at St. Andrew's War Memorial Hospital. The authors would like to thank Philips Australia for providing logistic support for the project.
Conflict of interest
The authors declare that the research was conducted in the absence of any commercial or financial relationships that could be construed as a potential conflict of interest.
Publisher's note
All claims expressed in this article are solely those of the authors and do not necessarily represent those of their affiliated organizations, or those of the publisher, the editors and the reviewers. Any product that may be evaluated in this article, or claim that may be made by its manufacturer, is not guaranteed or endorsed by the publisher.
References
1. Fonarow GC. The Acute Decompensated Heart Failure National Registry (ADHERE): opportunities to improve care of patients hospitalized with acute decompensated heart failure. Rev Cardiovasc Med. (2003) 4(suppl7):S21–30. https://www.imrpress.com/journal/RCM/4/S7/pii/1587892345832-191167638414668697
2. Maeder MT, Thompson BR, Brunner-La Rocca HP, Kaye DM. Hemodynamic basis of exercise limitation in patients with heart failure and normal ejection fraction. J Am Coll Cardiol. (2010) 56:855–63. doi: 10.1016/j.jacc.2010.04.040
3. Obokata M, Olson TP, Reddy YNV, Melenovsky V, Kane GC, Borlaug BA. Haemodynamics, dyspnea, and pulmonary reserve in heart failure with preserved ejection fraction. Eur Heart J. (2018) 39:2810–21. doi: 10.1093/eurheartj/ehy268
4. Rethy L, Borlaug BA, Redfield MM, Oh JK, Shah SJ, Patel RB. Application of guideline-based echocardiographic assessment of left atrial pressure to heart failure with preserved ejection fraction. J Am Soc Echocardiogr. (2021) 34:456–64. doi: 10.1016/j.echo.2020.12.008
5. Mascherbauer J, Zotter-Tufaro C, Duca F, Binder C, Koschutnik M, Kammerlander AA, et al. Wedge pressure rather than left ventricular end-diastolic pressure predicts outcome in heart failure with preserved ejection fraction. J Am Coll Cardiol HF. (2017) 5:795–801. doi: 10.1016/j.jchf.2017.08.005
6. Reddy YNV, El-Sabbagh A, Nishimura RA. Comparing pulmonary arterial wedge pressure and left ventricular end diastolic pressure for assessment of left-sided filling pressures. JAMA Cardiol. (2018) 3:453–4. doi: 10.1001/jamacardio.2018.0318
7. Nagueh SF, Smiseth OA, Appleton CP, Byrd BF 3rd, Dokainish H, Edvardsen T, et al. Recommendations for the evaluation of left ventricular diastolic function by echocardiography: an update from the American Society of Echocardiography and the European Association of Cardiovascular Imaging. J Am Soc Echocardiogr. (2016) 29:277–314. doi: 10.1016/j.echo.2016.01.011
8. Prasad SB, Holland DJ, Atherton JJ, Whalley G. New diastology guidelines: evolution, validation and impact on clinical practice. Heart Lung Circ. (2019) 28:141–1420. doi: 10.1016/j.hlc.2019.03.013
9. Reddy YNV, Obokata M, Egbe A, Yang JH, Pislaru S, Lin G, et al. Left atrial strain and compliance in the diagnostic evaluation of heart failure with preserved ejection fraction. Eur J Heart Fail. (2019) 21:891–900. doi: 10.1002/ejhf.1464
10. Inoue K, Khan FH, Remme EW, Ohte N, Garcia-Izquierdo E, Chetrit M, et al. Determinants of left atrial reservoir and pump strain and use of atrial strain for evaluation of left ventricular filling pressure. Eur Heart J Cardiovasc Imaging. (2022) 23:61–70. doi: 10.1093/ehjci/jeaa415
11. Smiseth OA, Morris DA, Cardim N, Cikes M, Delgaro V, Donal E, et al. Multimodality imaging in patients with heart failure and preserved ejection fraction: an expert consensus document of the European Association of Cardiovascular Imaging. Eur Heart J Cardiovasc Imaging. (2021) 23:e34–61. doi: 10.1093/ehjci/jeab154
12. Lancelloti P, Galderisi M, Edvardsen T, Donal E, Goliasch G, Cardim N, et al. Echo-Doppler estimation of left ventricular filling pressure: results of the multicenter EACVI euro-filling study. Eur Heart J Cardiovasc Imaging. (2017) 18:961–8. doi: 10.1093/ehjci/jex067
13. Hummel YM, Liu LCY, Lam CSP, Fonseca-Munoz DF, Damman K, Rienstra M, et al. Echocardiographic estimation of left ventricular and pulmonary pressures in patients with heart failure and preserved ejection fraction: a study utilizing simultaneous echocardiography and invasive measurements. Eur J Heart Fail. (2017) 19:1651–60. doi: 10.1002/ejhf.957
14. Lange A, Huntress H, Steindl J, Palka P. Incremental role of CT coronary angiography in the assessment of left ventricular diastolic function. Open Heart. (2021) 8:e001566. doi: 10.1136/openhrt-2020-001566
15. Fa’ak F, Shabaneh B, Younis G. Direct measurement of left atrial pressure during routine transradial catheterization. Tex Heart Inst J. (2016) 43:503–6. doi: 10.14503/THIJ-15-5508
16. Lang RM, Badano LP, Mor-Avi V, Afilalo J, Armstrong A, Ernande L, et al. Recommendations for cardiac chamber quantification by echocardiography in adults: an update from the American Society of Echocardiography and the European Association of Cardiovascular Imaging. J Am Soc Echocardiogr. (2015) 28:1–39. doi: 10.1016/j.echo.2014.10.003
17. Blume GG, McLeod CJ, Barnes ME, Seward JB, Pellikka PA, Bastiansen PM, et al. Left atrial function: physiology, assessment, and clinical implications. Eur J Echocardiogr. (2011) 12:421–30. doi: 10.1093/ejechocard/jeq175
18. Atherton JJ, Sindone A, De Pasquale CG, Driscoll A, MacDonald PS, Hopper I, et al. National Heart Foundation of Australia and Cardiac Society of Australia and New Zealand: guidelines for prevention, detection and management of heart failure in Australia 2018. Heart Lung Circ. (2018) 27:1123–208. doi: 10.1016/j.hlc.2018.06.1042
19. Reddy YNV, Carter RE, Obokata M, Redfield MM, Borlaug BA. A simple, evidence-based approach to help guide diagnosis of heart failure with preserved ejection fraction. Circulation. (2018) 138:861–70. doi: 10.1161/CIRCULATIONAHA.118.034646
20. Tobushi T, Nakano M, Hosokawa K, Koga H, Yamada A. Improved diastolic function is associated with higher cardiac output in patients with heart failure irrespective of left ventricular ejection fraction. J Am Heart Assoc. (2017) 6:e003389. doi: 10.1161/JAHA.116.003389
21. Shah AM, Cikes M, Prasad N, Li G, Getchevski S, Claggett B, et al. Echocardiographic features of patients with heart failure and preserved left ventricular ejection fraction. J Am Coll Cardiol. (2019) 74:2858–73. doi: 10.1016/j.jacc.2019.09.063
22. Møller JE, Hillis GS, Oh JK, Seward JB, Reeder GS, Wright RS, et al. Left atrial volume a powerful predictor of survival after acute myocardial infarction. Circulation. (2003) 107:2207–12. doi: 10.1161/01.CIR.0000066318.21784.43
23. Shin S-H, Claggett B, Inciardi RM, Santos ABS, Shah SJ, Zile MR, et al. Prognostic value of minimal left atrial volume in heart failure with preserved ejection fraction. J Am Heart Assoc. (2021) 10:e019545. doi: 10.1161/JAHA.120.019545
24. Inciardi RM, Claggett B, Minamisawa M, Sung-Hee S, Selvaraj S, Gonçalves A, et al. Association of left atrial structure and function with heart failure in older adults. J Am Coll Cardiol. (2022) 79:1549–61. doi: 10.1016/j.jacc.2022.01.053
25. Mălălaescu G-G, Mirea O, Capotă R, Petrescu AM, Duchenne J, Voigt J-U. Left atrial strain determinants during the cardiac phases. J Am Coll Cardiol Img. (2022) 15:381–91. doi: 10.1016/j.jcmg.2021.09.009
26. Pieske B, Tschöpe C, de Boer RA, Fraser AG, Anker SD, Donal E, et al. How to diagnose heart failure with preserved ejection fraction: the HFA–PEFF diagnostic algorithm: a consensus recommendation from the Heart Failure Association (HFA) of the European Society of Cardiology (ESC). Eur Heart J. (2019) 40:3297–317. doi: 10.1093/eurheartj/ehz641
27. Borlaug BA, Nishimura RA, Sorajja P, Lam CS, Redfield MM. Exercise hemodynamics enhance diagnosis of early heart failure with preserved ejection fraction. Circ Heart Fail. (2010) 3:588–95. doi: 10.1161/CIRCHEARTFAILURE.109.930701
28. Lange A, Palka V, Bian C, Huntress H, Morgan J, Allwood S, et al. Left heart remodelling in hypertensive patients: a comprehensive echocardiography and computed tomography study. Front Cardiovasc Med. (2023) 10:1295537. doi: 10.3389/fcvm.2023.1295537
29. Reddy YNV, El Sabbagh A, Packer D, Nishimura RA. Evaluation of shortness of breath after atrial fibrillation ablation: is there a stiff left atrium? Heart Rhythm. (2018) 15:930–5. doi: 10.1016/j.hrthm.2018.01.029
30. Spevack DM, Blum L, Malhotra D, Nazari R, Ostfeld RJ, Doddamani S, et al. Ratio of left atrial to left ventricular size: an anatomical marker of the diastolic left ventricular pressure-volume relationship. Echocardiography. (2008) 25:366–73. doi: 10.1111/j.1540-8175.2007.00619.x
31. Pezel T, Venkatesh BA, de Vasconcellos HD, Kato Y, Shabani M, Xie E, et al. Left atrioventricular coupling index as a prognostic marker of cardiovascular events: the MESA study. Hypertension. (2021) 78:661–71. doi: 10.1161/HYPERTENSIONAHA.121.17339
32. Garg P, Gosling R, Swoboda P, Jones R, Rothman A, Wild JM, et al. Cardiac magnetic resonance identifies raised left ventricular filling pressure: prognostic implications. Eur Heart J. (2022) 43:2511–22. doi: 10.1093/eurheartj/ehac207
33. Kotechta D, Lam CS, Van Veldhuisen DJ, Van Gelder IC, Voors AA, Rienstra M. Heart failure with preserved ejection fraction and atrial fibrillation: vicious twins. J Am Coll Cardiol. (2016) 68:2217–28. doi: 10.1016/j.jacc.2016.08.048
34. Reddy YNV, Obokata M, Verbrugge FH, Lin G, Borlaug BA. Atrial dysfunction in patients with heart failure with preserved ejection fraction and atrial fibrillation. J Am Coll Cardiol. (2020) 76:1051–64. doi: 10.1016/j.jacc.2020.07.009
35. Fletcher AJ, Lapidaire W, Leeson P. Machine learning augmented echocardiography for diastolic function assessment. Front Cardiovasc Med. (2021) 8:711611. doi: 10.3389/fcvm.2021.711611
Keywords: dyspnoea, ejection fraction, left atrial pressure, filling pressure, echocardiography, left ventricle to left atrial volume ratio, diastasis
Citation: Palka P, Hilling-Smith R, Swann R, Allwood S, Moore A, Bian C and Lange A (2024) Left ventricular to left arial volume ratio in the assessment of filling pressure in patients with dyspnoea and preserved ejection fraction. Front. Cardiovasc. Med. 11:1357006. doi: 10.3389/fcvm.2024.1357006
Received: 17 December 2023; Accepted: 19 January 2024;
Published: 9 February 2024.
Edited by:
Grigorios Korosoglou, GRN Klinik Weinheim, GermanyReviewed by:
Wolfgang Fehske, Independent Researcher, Aachen, GermanyJingyue Wang, First Affiliated Hospital of Jilin University, China
© 2024 Palka, Hilling-Smith, Swann, Allwood, Moore, Bian and Lange. This is an open-access article distributed under the terms of the Creative Commons Attribution License (CC BY). The use, distribution or reproduction in other forums is permitted, provided the original author(s) and the copyright owner(s) are credited and that the original publication in this journal is cited, in accordance with accepted academic practice. No use, distribution or reproduction is permitted which does not comply with these terms.
*Correspondence: Przemysław Palka cHJ6ZW1la3BAcWNnLmNvbS5hdQ==
Abbreviations ASE/EACVI, American Society of Echocardiography and the European Association of Cardiovascular Imaging; AUC, area under curve; CI, confidence interval; EF, ejection fraction; FP, filling pressure; HF, heart failure; LA, left atrial/atrium; LAdias, left atrial diastasis volume; LAmax, left atrial maximum volume; LAmin, left atrial minimal volume; LV, left ventricle/ventricular; LVdias, left ventricular diastasis volume; LVED, left ventricular end-diastolic volume; LVES, left ventricular end-systolic volume; TTE, transthoracic echocardiogram.