- 1Department of Computer Science, CECOS University of IT and Emerging Sciences, Peshawar, Pakistan
- 2Department of Computer Science, Al Ain University, Al Ain, UAE
- 3Department of Statistics and Operations Research, College of Science, King Saud University, Riyadh, Saudi Arabia
- 4Department of Computational Mathematics, Science and Engineering (CMSE), College of Engineering, Michigan State University, East Lansing, MI, United States
- 5Department of Mathematics, Faculty of Science, Mansoura University, Mansoura, Egypt
The 2017 World Health Organization Fact Sheet highlights that coronary artery disease is the leading cause of death globally, responsible for approximately 30% of all deaths. In this context, machine learning (ML) technology is crucial in identifying coronary artery disease, thereby saving lives. ML algorithms can potentially analyze complex patterns and correlations within medical data, enabling early detection and accurate diagnosis of CAD. By leveraging ML technology, healthcare professionals can make informed decisions and implement timely interventions, ultimately leading to improved outcomes and potentially reducing the mortality rate associated with coronary artery disease. Machine learning algorithms create non-invasive, quick, accurate, and economical diagnoses. As a result, machine learning algorithms can be employed to supplement existing approaches or as a forerunner to them. This study shows how to use the CNN classifier and RNN based on the LSTM classifier in deep learning to attain targeted “risk” CAD categorization utilizing an evolving set of 450 cytokine biomarkers that could be used as suggestive solid predictive variables for treatment. The two used classifiers are based on these “45” different cytokine prediction characteristics. The best Area Under the Receiver Operating Characteristic curve (AUROC) score achieved is (0.98) for a confidence interval (CI) of 95; the classifier RNN-LSTM used “450” cytokine biomarkers had a great (AUROC) score of 0.99 with a confidence interval of 0.95 the percentage 95, the CNN model containing cytokines received the second best AUROC score (0.92). The RNN-LSTM classifier considerably beats the CNN classifier regarding AUROC scores, as evidenced by a p-value smaller than 7.48 obtained via an independent t-test. As large-scale initiatives to achieve early, rapid, reliable, inexpensive, and accessible individual identification of CAD risk gain traction, robust machine learning algorithms can now augment older methods such as angiography. Incorporating 65 new sensitive cytokine biomarkers can increase early detection even more. Investigating the novel involvement of cytokines in CAD could lead to better risk detection, disease mechanism discovery, and new therapy options.
1 Introduction
The crucial role inflammation plays in the beginning and development of coronary heart disease is well-known (CHD) (1). However, the precise mechanism through which inflammation contributes to the pathophysiology of CHD remains unclear (2, 3). Several inflammatory indicators have been evaluated for their capacity to predict CHD risk, with C-reactive protein (CRP) receiving the most attention. On the other hand, CRP does not appear to be a risk factor for coronary heart disease. Cytokines are chemical messengers produced by immune and nonimmune cells that influence cell activity. The liver also produces C-reactive protein (CRP), an inflammation marker and cardiovascular disease risk factor (4). Cytokines are chemical messengers produced by the immune system and other cells in order to regulate numerous biological processes. Activated macrophages, T cells, B cells, and other immune and nonimmune cells generate them. They are crucial in immune response modulation, tissue repair, and homeostasis maintenance. Understanding their biology is essential for developing new treatments for chronic inflammatory diseases such as autoimmune disorders and cancer. Apart from their role in the development of well-known CHD risk factors such as tobacco use and high cholesterol, hypertension (blood pressure), and diabetes, these factors also initiate a cascade reaction in which the release of very low-concentration cytokines recruits inflammatory cells, which then produces additional cytokines, amplifying the local inflammatory response. (TNF-α) and interferon-γ (IFN-γ) are proinflammatory cytokines that play an essential role in developing chronic inflammatory illnesses such as coronary artery disease (CAD) (5). These cytokines are present in the circulation and drive monocytes and macrophages to create interleukin-1 (IL-1) and interleukin-6 (IL-6), influencing the endothelial cells lining the artery wall.
Interleukin-6 (IL-6) is an important proinflammatory cytokine genetically linked to coronary artery disease. It has been established that elevated levels of IL-6 are related to an increased risk of coronary heart disease, and it is believed to play a crucial role in the onset and progression of the inflammatory process that leads to coronary plaque formation (6). It is well-recognized that IL-6 stimulates the production of other cytokines, chemokines, and proinflammatory chemicals. It also encourages the development of smooth muscle cells in the artery wall, contributing to plaque formation. In addition, IL-6 is known to play a role in developing other inflammatory diseases, such as rheumatoid arthritis and some kinds of cancer, emphasizing the necessity of knowing its involvement in the pathogenesis of chronic inflammatory disorders (7). CANTOS provides crucial insight into the link between inflammation and coronary artery disease. Chronic inflammation is connected with an increased risk of coronary heart disease (CHD). The findings indicate that targeting IL-1 with anti-IL-1 medications such as canakinumab can considerably lower the risk of severe adverse cardiovascular events in those with elevated levels of the inflammatory biomarker C-reactive protein (CRP) (8, 9). Participants had a prior myocardial infarction (MI) and CRP levels greater than 2 g/L. As part of the study, they were given canakinumab, which decreases interleukin-6 levels in the bloodstream. Scientists are now investigating the effects of other cytokines on the risk of coronary heart disease, considering the findings of Mendelian randomization studies (MR studies) and the CANTOS trial.
In Europe and North America, cardiovascular disease is the leading cause of mortality (10), emphasizing the importance of incorporating developing risk variables to enhance risk prediction, enable early diagnosis, and customize care. The ability of machine learning like CNN (11) and LSTM is used to achieve patterns that can be used to inform healthcare decisions (12). By adjusting various tuning settings and combining k-fold cross-validation, we demonstrate the juxtaposition of algorithm CNN and LSTM in this study. This effective resampling strategy eliminates the problem of overfitting and improves model generalization (13). Due to data availability constraints, the Random Oversampling Example (ROSE) Technique improves and balances the data before model construction and final prediction. ROSE, accessible via the Integrated R Archive ‘Network = (https://cran.r.project.org/web/Packages/ROSE/index.html), uses a smooth bootstrap strategy to simulate balanced synthetic data.
To improve the classification of individuals with or without clinical coronary artery disease, we have used 450 plasma cytokines as novel biomarkers (CAD). This method has the potential to uncover disease pathways involving previously unknown cytokine targets and enhance early detection of people at risk. In response to cellular signals, the immune system produces cytokines, which are proteins. By targeting active receptors and generating downstream signals, they operate as messengers to other cells. Lymphokines, chemokines, interferons, and interleukins are examples of cytokines responding to environmental signals that initiate an anti-inflammatory or pro-cascade response (14, 15). Cytokines have been linked to the progression and development of coronary artery disease (9).
The study included 1,040 people to create a dataset with various biomarker levels. Every one of the 450 cytokine indicators was put to the test. Based on the final target attributes, people were assigned to the CAD (421 individuals) or control groups (619 individuals). The 36 cytokine biomarkers were merged in the model's feature space to quantify similarity. Deep machine learning techniques such as CNN and LSTM are used to create patterns that can be used to guide healthcare decisions. The CNN and RNN-LSTM are commonly used when developing a computer-aided diagnosis system. The primary contribution of this research work is the creation of standard data labeled by specialists in the relevant field. Using the deep neural network designer application found in MATLAB, a custom CNN, and LSTM network architecture is developed for the detection of coronary artery disease. Both the architecture and the parameters of the networks were designed following the dataset's characteristics.
This research study makes significant contributions in several key areas that are discussed as follows:
• The study introduces an innovative approach to the detection of CAD by leveraging deep learning techniques, specifically CNN and RNN-LSTM, for the analysis of plasma cytokine data.
• The integration of deep learning algorithms, CNN and RNN-LSTM, with a comprehensive set of 450 plasma cytokine biomarkers represents a novel and advanced methodology. This approach provides a more nuanced understanding of the complex interplay between cytokines and CAD, surpassing traditional methods.
• The study achieves high diagnostic accuracy, as evidenced by Area Under the Receiver Operating Characteristic curve (AUROC) scores. The RNN-LSTM classifier, in particular, outperforms the CNN classifier, showcasing the potential of deep learning in improving the accuracy of CAD detection using plasma cytokine data.
• By employing deep learning techniques, the study identifies key cytokine biomarkers associated with CAD risk. This not only contributes to the understanding of the disease mechanisms but also provides potential targets for future therapeutic interventions.
• The study highlights the application of machine learning, specifically CNN and RNN-LSTM, in enhancing cardiovascular risk prediction. The models developed showcase the potential of these algorithms as valuable tools for healthcare professionals in making informed decisions regarding CAD diagnosis.
• The study conducts a comprehensive comparison with state-of-the-art (SOTA) approaches, demonstrating the superior accuracy of the proposed deep learning model. This emphasizes the effectiveness of the novel approach in outperforming existing methods commonly employed in CAD detection.
• The identification of specific cytokine biomarkers associated with CAD risk holds the potential for personalized medicine. Tailoring interventions based on individual cytokine profiles may lead to more targeted and effective treatment strategies, contributing to improved patient outcomes.
This article is organized logically and coherently to thoroughly analyze the subject at hand. Section 2’s literature review provides an in-depth analysis of existing research on the topic as a basis for the research. The third section describes the study approach, including a description of the dataset, the suggested model framework, the training of the hyper models, and the processes for optimizing the hyperparameters to produce optimal feature weights. Section 4 describes the performed experiments, performance evaluations, and model performance comparisons. In this section, the outcomes of the study are discussed. In Section 5, the paper's principal results and recommendations for future research are outlined. Overall, the format of the article is intended to provide a complete and clear comprehension of the conducted research and its outcomes.
2 Literature review
In literature, high-level methods like RNNs & CNNs are widely anticipated to extract patterns for verifications, judgments, and treatments (16). Authors in (13) illustrate the “exploratory juxtaposition of “CNN” and RNN’ by modifying various tuning settings and combining k-fold cross-validation. This successful resampling method solves the overfitting problem and improves the model's generalization. The Random Oversampling Example Technique (ROSE) enriches and balances the data prior to model creation and final prediction due to data availability constraints (17). The Integrated R Archive Network hosts ROSE, which puts on balanced synthetic data using a smoothing bootstrap technique.
A comprehensive analysis of biomarkers was conducted to determine whether individuals with or without clinical coronary artery disease (CAD) are at risk of developing the condition. Four hundred fifty plasma cytokines were utilized as novel biomarkers in this endeavor. Using multiple biomarkers in combination allowed for the development of a robust and accurate classification system for CAD. This approach represents a significant advancement in identifying and diagnosing this prevalent disease. The utilization of these biomarkers may have the potential to improve the detection and management of CAD. The method can help to uncover disease pathways involving previously undiscovered cytokine targets and improve early diagnosis in high-risk people (18). The immune system creates cytokines, or proteins, reacting to cellular signals. Cytokines such as “lymphokines,” “chemokine,” “interferon,” and interleukins respond to environmental signals to launch a pro- or anti-inflammatory cascade reply (14, 19). The development and progression of coronary artery disease have been linked to cytokines (9).
Hampel et al. (20) proposed using machine learning techniques to investigate cardiac computed tomography (CT) visualization. Due to a scarcity of experienced cardiac imagers and the severe workload of medical practitioners, CT provides detailed high 3-D images with hundreds100 of underutilized slices (21). By producing reliable and fast answers, machine learning algorithms can overcome the limitations of manual diagnosis, potentially leading to further secondary diagnoses. Over the last ten years, machine learning techniques have improved CAD detection and characterization, according to this survey. Despite the obstacles of using ML in a clinical setting, the power of novel ML algorithms drives significant discoveries in CAD classification, according to the findings (22).
Due to the nature of ML algorithms learning from prior estimates, “Martin-Isla, Carlos, et al.” (23). Examined the use of (“ML”) algorithms for image-based CAD diagnosis that has enabled deeper eligibility and more excellent diagnosis. Furthermore, a considerable amount of literature in this field emphasizes the potential of machine learning techniques in CAD identification.
The inflammatory profile of mature patients with the disease of mouth, foot, and hand, joint in the Asia-Pacific area, was studied using cytokines by Ling-Hua Yu et al. (15). Participants used a random forest to identify the (HFMD) illness collection from controls using 26 key cytokines as predictive characteristics (24). The study revealed links between enterovirus infection, genotype, and clinical manifestation. The algorithm RNN-LSTM ended up with an AUROC value of 0.91, exhibiting its partitioning solid ability. Stevens et al. (25) Working cytokine predictors to discriminate the disease malaria from bloodstream bacterial infections using RNN-LSTM, implying that cytokines are active and predictive solid biomarker profiles. The 6–15 cytokines employed for the job were chosen using ML classification algorithms. Researchers employed cytokines to discriminate severe malaria contagion from asymptomatic malaria to compensate for the absence of quick malaria diagnosis. This study found that 88% of disease states could be predicted accurately, which could lead to the development of new rapid diagnostics in Sub-Saharan Africa.
Saini examined the application of CNN for recognizing QRS complex waves in ECG-related data, Indu et al. (26). The authors demonstrated that the k value and the classification distance metric primarily determine prediction accuracy. Experiments showed that the Euclidean distance value and k = 3 are the best when paired with a 6-fold cross-validation-produced CNN classifier. Forecast accuracy reached 99 percent, which is extremely high.
A CANTO (canakinumab anti-inflammatory thrombosis outcomes) was an objective assessment funded by Novartis that aimed to investigate the role of interleukin 1 in inflammation at the cellular level. R, Paul M et al. The males in the study will get monoclonal antibodies against interleukin one beta as part of the trial. Canakinumab, an anti-inflammatory drug that targets the interleukin one beta innate immune pathway every three months the, is given 150 mg. Compared to placebo, there was a considerably decreased incidence of cardiovascular events unrelated to cholesterol lowering in the research. This research aims to improve and extend the approaches employed in previous investigations. The primary goal is to improve separability for AUROC curve assessment by combining sophisticated algorithms, such as the “CNN” and RNN (LSTM), with new cytokine-biomarkers.
Almost half of all deaths worldwide are caused by heart disease or stroke, according to Lozano et al. (27). Both diseases are significant public health issues in developing countries, notably Africa. Significant socioeconomic disparities in heart disease and stroke morbidity and mortality are common in many Western countries, particularly the United States (28). Although there have been improvements in reducing disparities in morbidity and mortality related to heart disease and stroke, the gap between rich and poor is expected to widen over the next several years in several countries. This is particularly evident when considering the persistent disparities between socioeconomically disadvantaged groups and their more affluent counterparts. Implementing practical strategies and preventive interventions is crucial to address the health disparities related to heart disease and stroke, especially among older adults, in the context of socioeconomic inequality. Doing so can effectively reduce health inequalities and promote better overall health outcomes. According to Mattiussi and Lippi (29), approximately 70% of heart disease and stroke cases occur in individuals over the age of 65, indicating that heart disease and stroke are diseases of aging (Yousuf et al.) (30). The World Health Organization reports that as populations age and the income disparity between rich and poor continues to widen, the global incidence of heart disease and stroke continues to rise, particularly in low- and middle-income countries (LMICs) such as China (31). Few studies have examined the relationship between socioeconomic status and heart disease and stroke; evidence linking these diseases to socioeconomic status is still scarce in low- and middle-income countries, particularly developing countries. Most evidence from low- and middle-income countries comes from hospital-based studies involving various middle-aged populations of varying quality (31). According to the International Society for Cardiovascular Diseases (ISCD), the relationship between socioeconomic status (SES) and mortality from heart disease and stroke in older adults in low- and middle-income countries needs to be better understood (LMICs). As a result, it is primarily concerned with China's older adults, the subject of this thesis, which examines their relationship with them.
Numerous studies have been conducted to determine which parameters or factors significantly improve the efficacy of CRT. These studies’ findings were published in the journal Radiology. Park et al. (32) demonstrated that using SPECT images to assess the LV's most recent activation can improve both the speed with which the LV is placed and the quality of the CRT response. Machine learning techniques have been employed in various studies to predict mortality in patients with coronary artery disease and other ailments. For instance, researchers effectively employed machine learning to identify patients with CRT (Cardiac et al.) who would benefit from the phenol group. This approach enabled them to observe the improvements in CRT response over time. The researchers utilized unsupervised learning methods to identify patients more likely to respond positively to the treatment. They combined clinical characteristics with echocardiographic data, precisely measurements of myocardial infarction. They left ventricular volume changes throughout the cardiac cycle to identify patients with a higher likelihood of positive response. According to the findings, it is possible to classify heterogeneous groups of heart failure patients in a clinically meaningful manner using an unsupervised machine learning technique, which can aid in the identification of subgroups of patients who are most likely to respond to specific therapies. According to the paper's authors, a prospective controlled trial should assess the proposed model's feasibility in patients with phenotypic heart failure and clinical decision-making.
The research article outlines (33), a randomized trial examining the impact of low-dose colchicine (0.5 mg daily) vs. a placebo on patients who recently experienced a myocardial infarction. Involving 4,745 participants over 22.6 months, the trial revealed a significant reduction (5.5% vs. 7.1%, hazard ratio 0.77) in the primary composite endpoint, including cardiovascular death, myocardial infarction, and stroke. Noteworthy reductions were observed in death from cardiovascular causes, stroke, and urgent hospitalization for angina leading to coronary revascularization. Diarrhea, the primary adverse event, occurred more frequently in the colchicine group (17% vs. 8.9%). The study concludes that low-dose colchicine effectively reduces cardiovascular events, presenting a potential cost-effective treatment for coronary artery disease.
This study presents a meta-analysis of randomized controlled trials (RCTs) assessing the efficacy and safety of colchicine in post-acute coronary syndrome (ACS) patients (34). Encompassing two RCTs and 5,540 participants (50.1% colchicine, 49.9% placebo), the primary outcome was major adverse cardiovascular events (MACE), with secondary endpoints including stroke, myocardial infarction (MI), all-cause and cardiovascular death, and urgent revascularization. Results indicate a significant reduction in the colchicine group for the composite endpoint (5.5% vs. 7.6%, OR 0.67, 95% CI 0.46–0.98, p = 0.04, I2 = 46%). Notably, colchicine demonstrated substantial reductions in cerebrovascular accidents (OR 0.31, 95% CI 0.14–0.69, p = 0.004, I2 = 0%) and repeat revascularization (OR 0.36, 95% CI 0.14–0.90, p = 0.03, I2 = 54%). Nevertheless, no significant differences were observed in cardiovascular death, non-cardiovascular death, MI at longest follow-up, or resuscitated cardiac arrest between the colchicine and placebo groups.
3 Methodology
3.1 Custom data Set creation
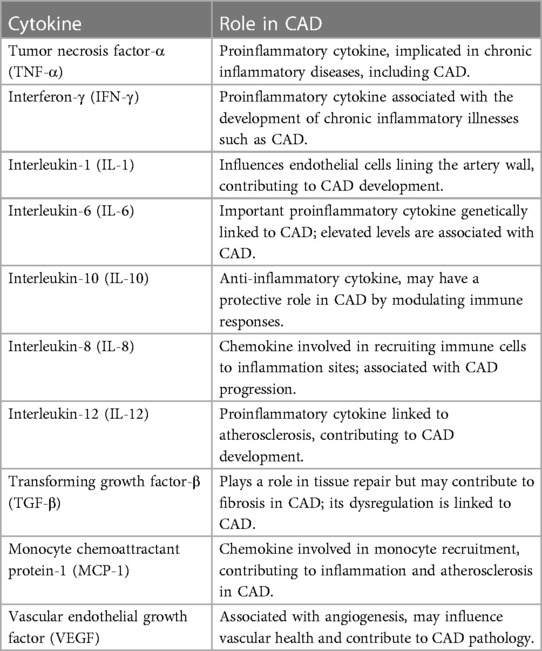
A total of 1,040 people were included in the study, each with different biomarker levels. Each of the 450 cytokine indicators was tested. They assigned People to the CAD (390 individuals) or control groups based on the final target trait qualities (650 individuals). The 36 cytokine biomarkers were merged in the model's feature space to quantify similarity, followed by the CAD or Regulator categorization. They approved this study via the institutional review board human research group & followed the standards of the Declaration of Kuwait Teaching Hospital Peshawar. Prior to participating, all individuals signed a written informed consent form. Blood samples were taken from males (43.3%) and females (43.3%) whose ages ranged from 17 to 64 years (median age = 40). This group included individuals who had been diagnosed with CAD as well as age- and sex-matched controls. The infarction Myocardial, angiographic ally confirmed (CAD), or coronary artery bypass graft surgery was all present in the CAD participants. There was no history of CAD or clinical indication of it in the control group. In our study, we examined the relationship between cytokines and coronary artery disease (CAD), focusing on the role of these signaling proteins in cardiovascular health. We utilized a large dataset of 450 cytokines, each playing a crucial role in immune responses and inflammation. The selected cytokines in Table 1 provide a comprehensive overview of the key players associated with CAD. While the table includes only 10 cytokines, it serves as a representative sample of our extensive analysis.
Prior or Current therapy for autoimmune illness or cancer, diabetes, smoking, use of NSAIDs before blood collection, postmenopausal women, and anyone over the age of 65 were all excluded. There were no lipid-lowering drugs given to the participants. The blood is taken into EDTA collecting tubes and placed on ice immediately. Separate plasma from samples by centrifuging, then aliquot and store at −80°C until further use. Before detecting cytokine levels using the Thermosphere/Life Sciences 45-fold Human ELISA kit, samples must be thawed on ice per the manufacturer's instructions. Using a standard curve for each cytokine, the exponent program was used to analyze the raw data and convert them to pg./mL. Table 2 presents demographic and clinical data for the study cohort.

Table 2. Analyzing pooled plasma samples allowed researchers to compare the demographic traits of CHD patients with those of healthy controls.
3.2 Pre processing steps
The characteristics of the information are normalized before operating the classifier on the test to prevent predicted cues with greater values from overwhelming those with smaller values, which could lead to biased categorization. In addition, domain experts review and adjust the data for anomalies, such as nulls or outliers. The data is synthetically incremented by a smoothing bootstrap method because of considerably imbalanced tiny data sets, which minimizes overfitting in the training phase and translates to the testing phase, which is higher generalizability. Using the R programming language, ROSE Package enhances data synthesis to 1,000, balancing CAD in 52 percent of cases and Controls in 48 percent. By emulating a smooth bootstrap technique, the ROSE Package aids in these endeavors. Z-score normalization is used to scale the data. The resulting balanced data, which contains 52 percent (“CAD”) and 48% percent Control, is suitable for LSTM and CNN implementation. When data is expanded to one thousand observations and combined with balance data, standard partitioning for training and testing partitions can be used 75-25 percent of the time. This split will enable observations to be included in the training dataset, preventing model underfitting.
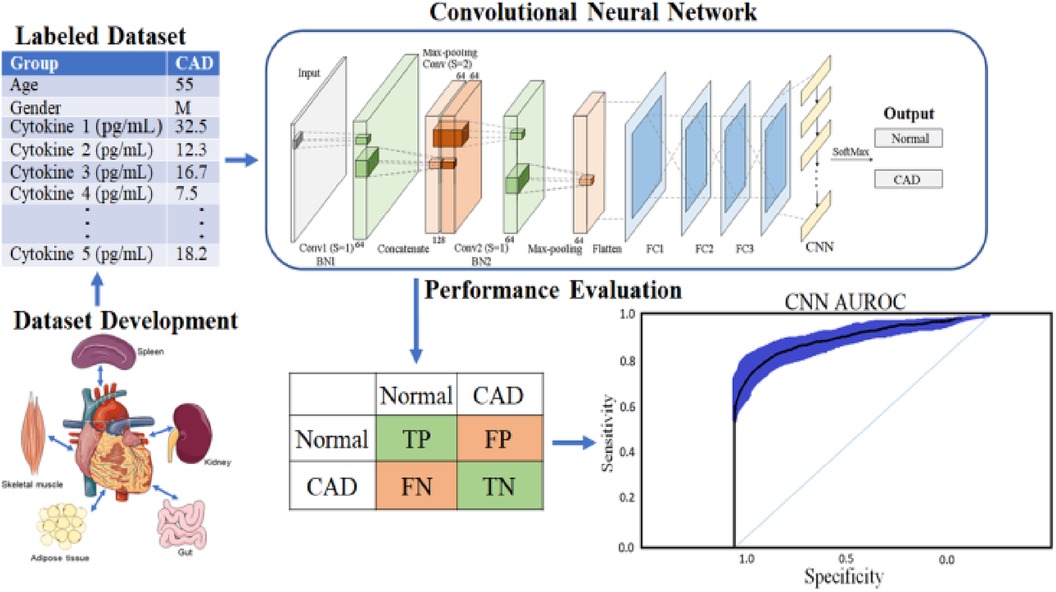
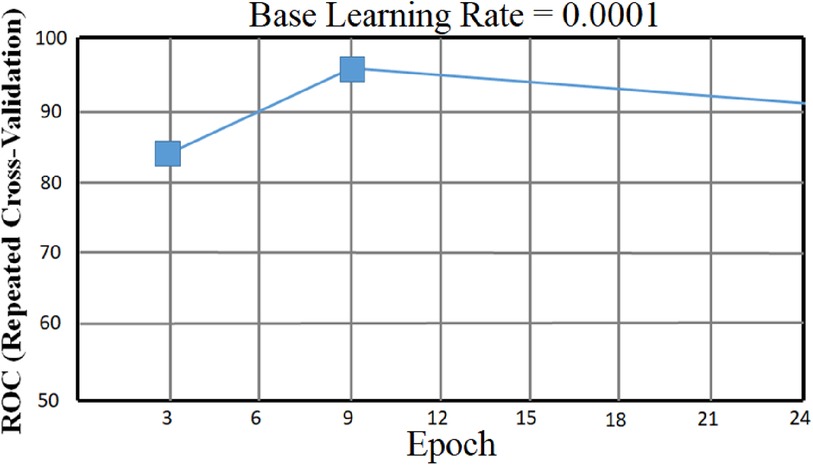
In addition, to avoid biased predictions, a 10-fold cross-validation with three replications was used to choose hyperparameters. Because feature selection was unnecessary after balancing and adding data to avoid model underfitting or overfitting, a total prediction feature space of 450 cytokines was used. The proposed CAD framework is depicted in Figure 1. The optimal balancing of bias-variance (underfitting and overfitting) tradeoffs is achieved using these strategies.
3.3 Convolutional neural network
A convolutional neural network (CNN or ConvNet) is a framework that leverages patterns in data, such as photos, videos, text, and bioinformatics sequences, to automatically recognize and classify information (35). CNNs are particularly useful for evaluating time series and signal data, and the structure and function of the brain's visual cortex strongly influence their design. The visual cortex comprises stratified tissue and two fundamental cell types: simple and complicated. Simple cells respond to primitive patterns in the subregion of visual stimuli, while complex cells use this information to identify more intricate characteristics.
CNNs duplicate the visual cortex by utilizing three essential concepts: local connection, localization invariance, and local transition invariance. As shown in Figure 2, the fundamental structure of a CNN involves different nonlinear layers (36). Filters or weight vectors are applied to local data blocks to generate feature maps at each convolutional layer. These feature maps are then utilized to generate feature maps at a higher level. The recurrent application of filters throughout the dataset increases training efficiency by decreasing the number of parameters to be learned. The nonlinear layers are then blended to enhance the map's nonlinear characteristics. Subsampling non-overlapping regions with maximum or average values, the clustering layer further aggregates local characteristics to uncover more complex features (37).
3.4 Deep network
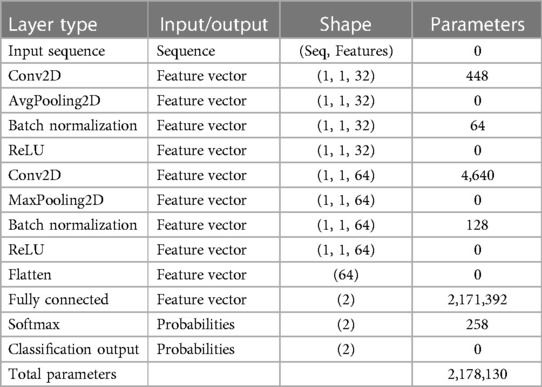
A deep network that uses data operations to learn specific features from the data. As depicted in Figure 3, a CNN consists of multiple layers, including a convolutional, activation, and pooling layer. The convolutional layers pass the input image through several convolutional filters, each activating a distinct image feature. This method, known as feature extraction, finds patterns in your data. The activation layer is often implemented as a rectified linear unit (ReLU) for faster and more efficient training. This method is sometimes called feature selection since only enabled features are passed to the subsequent layer (38). Table 3 presents the detailed architecture of the proposed CNN, providing information on the input and output of each layer, as well as the network training parameters.
The clustering layer loses the number of considerations the system needs to discover by subsampling the output nonlinearly. This minimizes computing complexity and increases the network's resiliency. CNN architecture moves on to classification after learning multi-layer features. The next layer is the fully connected layer, which outputs a K-dimensional vector, where K is the number of predicted classes. This vector includes the likelihood that each class in an image is classified. The classification layer, the final layer of the CNN design, uses methods such as softmax to produce the result. This process is performed multiple times, and each layer learns to distinguish unique features. CNNs can learn and detect increasingly complicated data patterns by stacking numerous layers.
3.5 Recurrent network
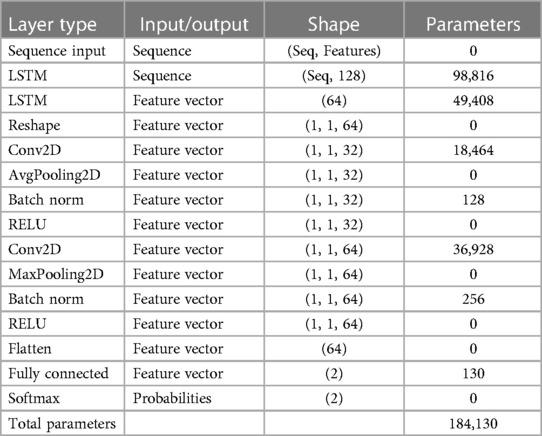
A recurrent network like RNN was created mainly for sequential data handling. Circular connections within hidden cells enable circular computing. This circular computation implicitly enables the network to store past data as a state vector. This information is utilized to calculate the output of a specific input in addition to the current input. Long-term memory networks (LSTMs) are a popular type of RNNs commonly employed in applications such as speech recognition, where previous and future inputs influence outputs. LSTM is designed to overcome the leaking gradient problem, a prevalent issue in RNNs that makes learning long-term dependencies challenging. Table 4 showcases the comprehensive architecture details of the proposed RNN-LSTM model. It elucidates the input and output specifications of each layer while also offering insights into the network's training parameters.
The RNNs can develop deeper structures over time and make systems appropriate for sequential data applications such as natural language processing, language translation, and time series prediction. In recent years, RNNs have been successfully employed in multiple domains thanks to the development of increasingly complicated hidden units, such as LSTM memory cells, drastically reducing the gradient vanishing issue. RNNs have additional prospects for more advanced applications, including speech recognition, synthesis, and image captioning.
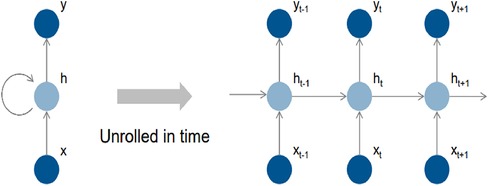
Figure 4 depicts the fundamental structure of a recurrent neural network (RNN), which consists of input cells (x), hidden cells (h), and output cells (o) (y). The hidden cells are designed to use circular joins to handle sequential information, allowing computation to consider inputs from hidden cells from earlier time steps and current input cells. This circular join enables the network to store past information implicitly in hidden units called state vectors and to use state vectors to compute the output of the current input while accounting for all previous inputs. If the RNN grows over time, it can reflect circular computation more precisely. Each time step is represented by an index in this representation, and the masked unit (h) gets input from the input unit (x) and the masked unit from the previous time step (h-1). The calculation result is then transmitted to the output (y) and the masked cell for the subsequent time step (h + 1).
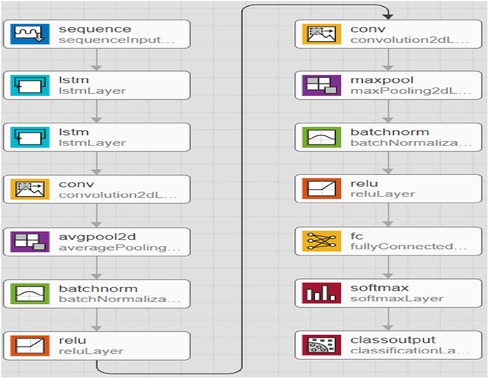
In Figure 5, a feature learning block with an LSTM node is added to the neural network. The input features are first converted to sequential data, where each data point is linked with the next and previous data points to add up some sequential information by matching the same patterns in data points. Instead of a single LSTM layer, multiple LSTM is used to create a sequence-to-sequence model, where the input to the first LSTM is a sequence, and the output of the first LSTM is also a sequence. Similarly, the second LSTM accepts sequence as input but generates a features map as output. The feature map passes through several convolutional operations for learning robust and optimal features. The last two layers of the LSTM-RNN are SoftMax and classification, which are responsible for probability calculation and prediction, i.e., assigning a class label to the test sample.
3.6 K-fold cross validation
To improve the final classification results, combine k-fold cross-validation with an optimization method considering statistically significant cytokines. The k-fold cross-validation methodology improves the prediction power of fresh unlabeled data while avoiding problems like overfitting and variety bias. The method investigated by a (10-fold) cross-validation with (k = 10) was performed three times.
The CNN technique, which involves 450 cytokine prediction characteristics with Euclidean distance, was used in the first classifier experiment. The second classifier used 450 cytokines to create an RNN-LSTM. The experimental framework classifier is depicted graphically in the following image, Figure 1.
A general set of performance evaluation measures can be applied to acquire insights into the algorithm's correctness. In this study, we used AUROC to compare the performance of the developed classifiers and to estimate the precision & discriminating the CAD group from the control group.
3.7 Area under receiver operating characteristic (AUROC)
This is a commonly used statistic for determining the degree of separability across different classification algorithm implementations. A higher AUROC indicates that the algorithm can accurately classify examples into objective sets. An AUROC graph is generated by mapping false-positive rates on the X-axis in opposition to true-positive rates on the Y-axis. AUROC provides an excellent technique to compare different classifiers’ statistical consistency and discrimination accuracy.
4 Experimental result
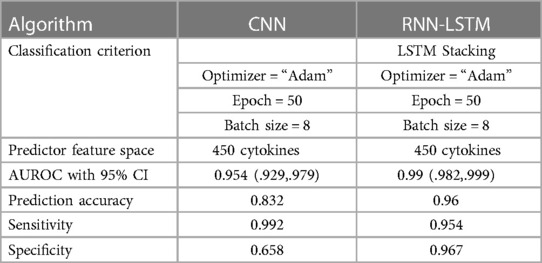
The accompanying tables (Table 5) and graphs demonstrate the test results produced by executing the algorithm on the test data (Figures 6–8). The hyperparameters tuning measure was adjusted by resampling replicas of the cross-validation results in the test results.
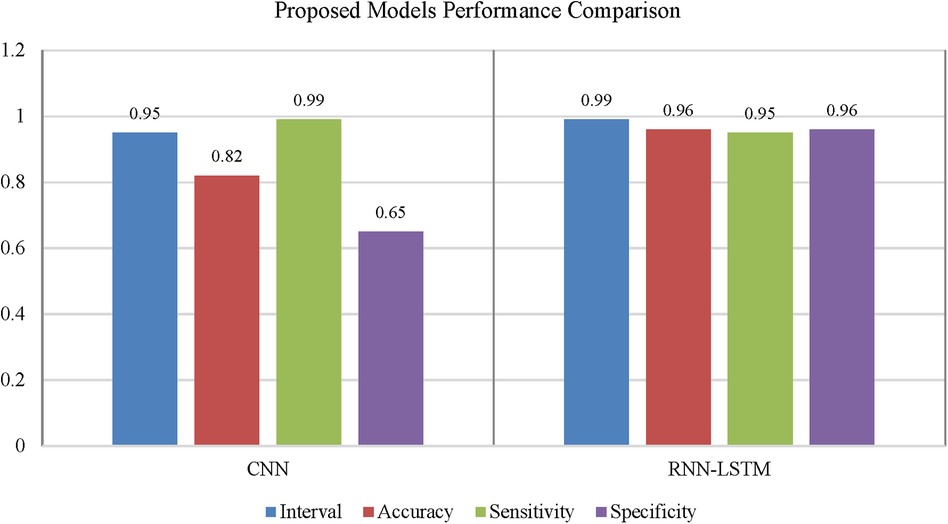
Figure 7. Performance comparison of convolutional neural network and recurrent neural network for coronary artery disease detection.
4.1 Convolutional neural network
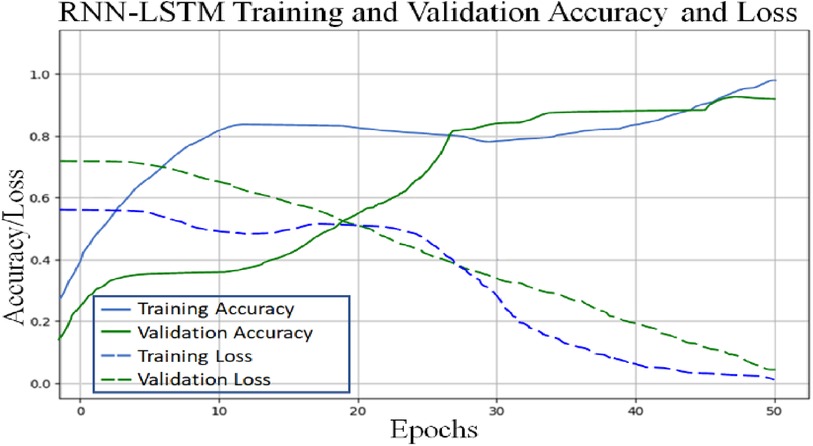
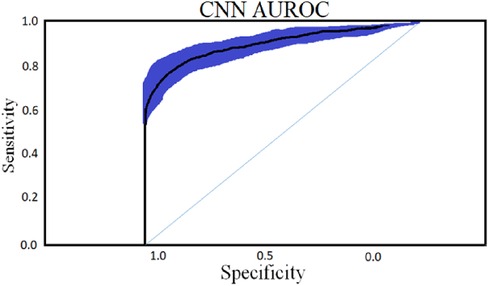
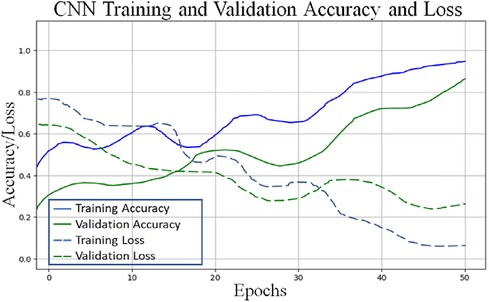
To classify “at risk” instances, the classifier utilizes the CNN using the “Adam” optimization technique for optimal weights calculation. A total of 450 cytokines were employed in this classification. The AUROC value of 0.95, representing the degree of separation between CAD and the control, is quite essential. The above table and graphs provide detailed information on the AUROC, the optimal CNN neighbors determined by cross-validation, and the numerical metric of classifier 1. (Table 5 and Figures 8, 9). The Figure 10 illustrates the smooth training of the proposed CNN model. The model was trained for 50 epochs, exhibiting higher training and validation accuracy.
4.2 RNN-LSTM classifier result
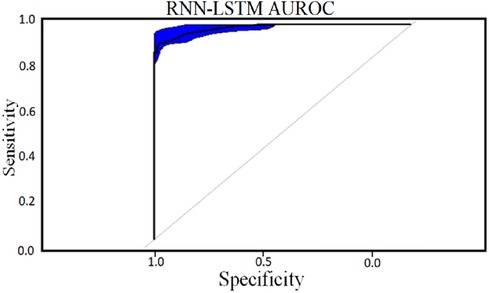
Classifier 2 uses 450 cytokines as predictor characteristics in an RNN-LSTM. The AUROC of 0.99 is extremely high, and it outperforms previous classifiers in terms of accuracy. The foundation of the RNN-LSTM algorithm explains this achievement. For the RNN-LSTM classification, Stacked LSTM layers are used for learning the plasma cytokines data, six feature variables as segmentation standard, and the Gini index is a quality assessor were employed as hyperparameters. Combining random feature segmentation criteria, several LSTM layers and the accumulation of intermediate outcomes from these LSTM resulted in excellent results. Many LSTM units utilized the decision-making method to improve the final forecasts “accuracy” and “stability”. The graph and table below show the final numerical metric results and the AUROC for Classifier 2. (Table 5 and Figure 11).
4.3 Performance comparison of CNN and LSTM
Using confidence intervals, the procedure can be combined with a t-test to check for significant differences in AUROC scores. A box-line plot can be used to compare the two classifiers visually. With p-values smaller than 7.48, independent t-test comparisons show two classifiers have significantly different AUROC values. The following figure shows paired box plot comparisons of AUROC, sensitivity, and specificity (Figure 12).
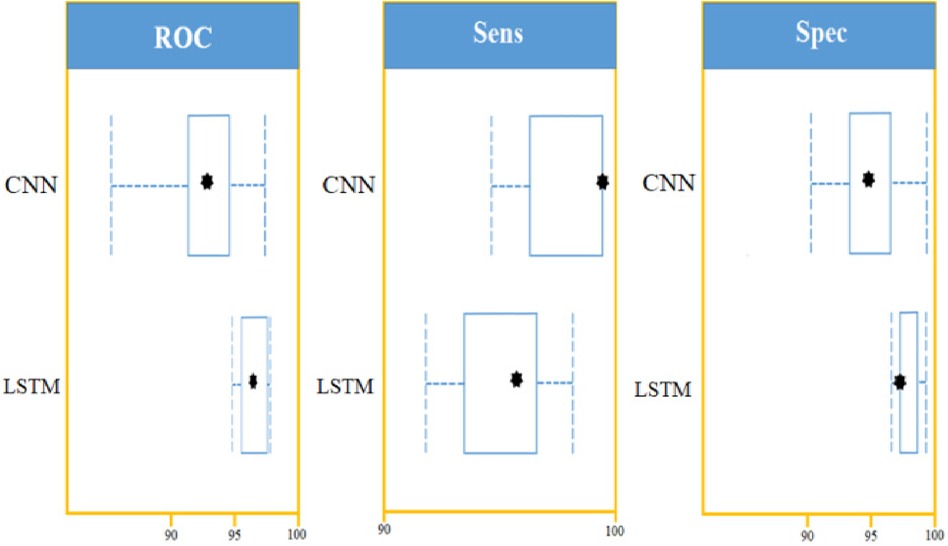
Figure 12. LSTM and CNN classification model comparison using: AUROC curve, sensitivity, and specificity on a set of 450 cytokines.
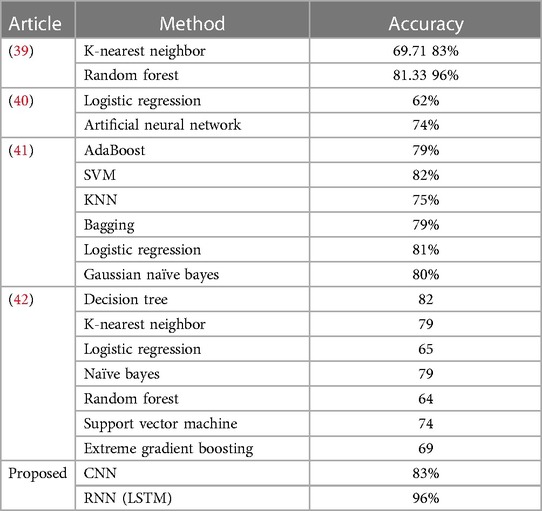
Table 6 provides a comparative analysis between the proposed method, which incorporates CNN and RNN-LSTM, and other state-of-the-art (SOTA) approaches in detecting coronary artery disease using plasma cytokine data. The results indicate that the proposed method outperforms the other models regarding prediction accuracy. Specifically, the CNN model achieved an accuracy of 83%, while the RNN-LSTM model demonstrated an impressive accuracy of 96%. These accuracies surpass the performance of several well-known models commonly found in the literature, such as K-Nearest Neighbor, Random Forest, Logistic Regression, Artificial Neural Network, AdaBoost, SVM, KNN, Bagging, Gaussian Naive Bayes, Decision Tree, Naive Bayes, Random Forest, Support Vector Machine, and Extreme Gradient Boosting. These findings strongly suggest that the proposed method holds great promise as a practical approach for detecting coronary artery disease using plasma cytokine data.
5 Discussion
With the experiment of RNN-LSTM classifier, 2 (450 cytokines) was shown that the ML is a reasonable classification technique overall, with a score of AUROC (99%) and a (95%) confidence interval of “95” percent (“.982,.999”). Figure 7 compares the two proposed deep-learning models for coronary artery disease classification concerning performance. The data comprises a collection of non-sequential data that work together to produce better classification than the CNN model; RNN-LSTM outperforms other models and achieves almost perfect AUROC. RNN-LSTM, like stacking, uses bootstrap samples to form a deep network. RNN-LSTM also picks a subset of sequences for each partition they construct. This desirable trait leads to single output predictions with more diversity and uncorrelated prediction errors. Creating the classifier with a random subset of characteristics at each partition point allows for more diversified integration and, thus, higher overall performance than methods like CNN.
The (AUROC) value of (0.955) with 95% percent CI for the (CNN) with “450” cytokines (Classifier 1 experiment) (“.929” “.979”) is an excellent but not better than Classifier 2, which gave near good control differentiation and CAD. The RNN-LSTM classifier (classifier 2) considerably outperformed the CNN classifier (p-value 7.48) in a t-test comparing the AUROC scores of the two classifiers (p-value 7.48) (classifier 1).
Due to the incredible processing power and excellent predicted accuracy, ML algorithms are becoming more widely used, which is an improvement over current qualitative picture analysis and basic quantitative assessments of heart anatomy and function. ML algorithms can build a holistic framework incorporating images and other valuable aspects for trustworthy insight and early diagnosis that can save lives.
The reviewed studies and current research emphasize the status of the machine learning approach and how it can be utilized to detect patients at higher risk for (CAD) and guide conventional treatment options. RNN-LSTM is a deep-learning classification algorithm popular and used in various domain areas, including medical diagnosis. At the same time, CNN is an algorithm of similarity metric based. RNN-LSTM used in this research is stacked LSTM, where the output of the first LSTM is also a sequence that is forwarded to the next LSTM layer for learning purposes; LSTM is very popular for learning sequential data and is used in a wide range of domain areas; including medical diagnosis. Some of the most well-known are discussed here. The current analysis shows outstanding prediction accuracy, a significant improvement over Alizadeh Sani et al. research work (13). The RNN-LSTM highest AUROC used in this investigation received (.99), outperforming Yu et al. review study (15). Traditional procedures, such as angiography, cannot be replaced by this prediction system. It can, however, suggest more advanced tests for people at risk of developing a more severe disease. When used and compared, multiple methods are an effective way to gain a categorized overall perspective. This comparison paradigm is combined in the current investigation to present (23) results. The current study's in-depth investigation was guided by empirical evidence of performance enhancement using hyperparameter change and (cross-validation) (43) with RNN-LSTM and CNN. In general, fine-tuning hyperparameters has proven to be a successful optimization strategy. (Novel, cytokine, biomarkers) as indicators of inflammation (9, 44, 45) could be employed to predict CAD risk and serve as a comprehensive therapy target in the future more accurately.
6 Conclusion
This study is the first to employ cytokine plasma indicators to distinguish CAD from non-CAD sufferers. It also emphasizes the experimental methodology of multiple classifier studies, which demonstrate better-predicting accuracy across models. The performance of the CNN algorithm implementation is compared to that of the RNN-LSTM method in terms of efficacy. In comparison to earlier research employed RNN-LSTM and (“cytokines”) to identify and control disease groups, this study had a higher AUROC (0.99). For all 450 cytokines, mutually forest and “k—NN” produced reasonable effects. Cross-validation, data balancing, data augmentation, and employing 75-25 percent of the training and test sets splits were used in the CNN and RNN-LSTM classifier trials to balance the bias-covariance tradeoff. Overall, the RNN-LSTM has an AUROC of 0.99 with a 95 percent confidence interval of (0.982,.999), a prediction accuracy of 0.96, and a p-value is less than 7.480e-10. Utilizing the optimization, generalization, computational, and abstraction power of universal ML is vital and is employed in a wide range of fields in this era of creative and universal ML systems. Medicine is a well-known profession. Future research on the role of cytokine profiles in detecting the inflammation that CAD patients experience will lead to treatment targets. Many biological variables, including species of molecular lipoproteins, genetic drivers, oxidative stress of coagulopathy, and inflammation, have been demonstrated to contribute to CAD risk in recent studies. The analytical mathematical approaches developed in this study will allow for investigating various elements in estimating CAD risk, including their interactions. Adding a wide range of cytokines will provide additional aspects to this study, allowing for better risk prediction and new treatment options.
Data availability statement
The datasets presented in this study can be found in online repositories. The names of the repository/repositories and accession number(s) can be found below: https://figshare.com/, https://figshare.com/articles/dataset/Coronary_Artery_Disease_Plasma_Cytokine_Data/24942093.
Author contributions
MS: Conceptualization, Data curation, Methodology, Software, Writing – original draft, Writing – review & editing. AJ: Formal Analysis, Investigation, Writing – review & editing. GH: Investigation, Resources, Supervision, Validation, Writing – review & editing. MQ: Conceptualization, Software, Validation, Writing – review & editing. YG: Formal Analysis, Investigation, Validation, Writing – review & editing. SA: Data curation, Investigation, Validation, Writing – review & editing. MA: Funding acquisition, Investigation, Resources, Supervision, Writing – review & editing.
Funding
The author(s) declare financial support was received for the research, authorship, and/or publication of this article.
This project is funded by King Saud University in Riyadh, Saudi Arabia, through the Researchers Supporting Project number (RSP2024R167).
Acknowledgments
This project is funded by King Saud University in Riyadh, Saudi Arabia. Researchers Supporting Project number (RSP2024R167), King Saud University, Riyadh, Saudi Arabia.
Conflict of interest
The authors declare that the research was conducted in the absence of any commercial or financial relationships that could be construed as a potential conflict of interest.
The author(s) declared that they were an editorial board member of Frontiers, at the time of submission. This had no impact on the peer review process and the final decision.
Publisher's note
All claims expressed in this article are solely those of the authors and do not necessarily represent those of their affiliated organizations, or those of the publisher, the editors and the reviewers. Any product that may be evaluated in this article, or claim that may be made by its manufacturer, is not guaranteed or endorsed by the publisher.
References
1. Friede A, O'Carroll PW, Thralls RB, Reid JA. CDC WONDER on the web. Proceedings: a Conference of the American Medical Informatics Association. AMIA Fall Symposium (1996). p. 408–12
2. Hansson GK. Inflammation, atherosclerosis, and coronary artery disease. N Engl J Med. (2005) 352:1685–95. doi: 10.1056/NEJMra043430
3. Eiriksdottir G, Harris TB, Launer LJ, Gudnason V, Folsom AR, Andrews G, et al. Association between C reactive protein and coronary heart disease: mendelian randomisation analysis based on individual participant data. Br Med J. (2011) 342(7794):425. doi: 10.1136/bmj.d548
4. Libby P. Inflammation in atherosclerosis, Arterioscler Thromb Vasc Biol. (2012) 32(9):2045–51. doi: 10.1161/ATVBAHA.108.179705
5. Ma J, Luo J, Sun Y, Zhao Z. Cytokines associated with immune response in atherosclerosis. Am J Transl Res. (2022) 14(9):6424–44. doi: 10.1016/j.imed.2023.06.001
6. Feng Y, Ye D, Wang Z, Pan H, Lu X, Wang M, et al. The role of interleukin-6 family members in cardiovascular diseases. Front Cardiovasc Med. (2022) 9:818890. doi: 10.3389/fcvm.2022.818890
7. Swerdlow DI, Holmes MV, Kuchenbaecker KB, Engmann JEL, Shah T, Sofat R, et al. The interleukin-6 receptor as a target for prevention of coronary heart disease: a Mendelian randomisation analysis. Lancet. (2012) 379(9822):1214–24. doi: 10.1016/S0140-6736(12)60110-X
8. Ridker PM, Thuren T, Zalewski A, Libby P. Interleukin-1β inhibition and the prevention of recurrent cardiovascular events: rationale and design of the canakinumab anti-inflammatory thrombosis outcomes study (CANTOS). Am Heart J. (2011) 162(4):597–605. doi: 10.1016/j.ahj.2011.06.012
9. Thompson PL, Mark Nidorf S. Anti-inflammatory therapy with canakinumab for atherosclerotic disease: lessons from the CANTOS trial. J Thorac Dis. (2018) 10(2):695–8. doi: 10.21037/jtd.2018.01.119
10. Mc Namara K, Alzubaidi H, Jackson JK. Cardiovascular disease as a leading cause of death: how are pharmacists getting involved? Integr Pharm Res Pract. (2019) 8:1–11. doi: 10.2147/iprp.s133088
11. Sayed N, Shoaib M, Ahmed W, Qasem SN, Albarrak AM, Saeed F. Augmenting IoT intrusion detection system performance using deep neural network. Comp MatContinua. (2023) 74(1):1351–74. doi: 10.32604/cmc.2023.030831
12. Iqbal S, Agarwal S, Purcell I, Murray A, Bacardit J, Allen J. Deep learning identification of coronary artery disease from bilateral finger photoplethysmography sensing: a proof-of-concept study. Biomed Signal Process Control. (2023) 86(PA):104993. doi: 10.1016/j.bspc.2023.104993
13. Peña Yañez A. El anillo esofágico inferior. Rev Esp Enferm Apar Dig. (1967) 26(4):505–16. doi: 10.1016/j.ccell.2020.09.002
14. Djuichou Nguemnang SF, Tsafack EG, Mbiantcha M, Gilbert A, Atsamo AD, Yousseu Nana W, et al. In vitro anti-inflammatory and in vivo antiarthritic activities of aqueous and ethanolic extracts of dissotis thollonii cogn. (Melastomataceae) in rats. Evidence-Based Complementary Altern Med. (2019) 2019:3612481. doi: 10.1155/2019/3612481
15. Li Y, Gou H, Chu P, Zhang K, Jiang Z, Cai R, et al. Comparison of host cytokine response in piglets infected with toxigenic and non-toxigenic Staphylococcus hyicus. Front Vet Sci. (2021) 8:639141. doi: 10.3389/fvets.2021.639141
16. Ayana G, Dese K, Choe S. Transfer learning in breast cancer diagnoses via ultrasound imaging. Cancer. (2021) 13:738. doi: 10.3390/cancers13040738
17. Anderson CW, Sijercic Z. Classification of EEG signals from four subjects during five mental tasks. Solving Engineering Problems with Neural Networks: Proceedings of the Conference on Engineering Applications in Neural Networks (EANN’96); Turkey (1996). p. 407–14 Available online at: http://sce.uhcl.edu/boetticher/CSCI5931
18. Melo AK, Milby KM, Caparroz AL, Pinto AC, Santos RR, Rocha AP, et al. Biomarkers of cytokine storm as red flags for severe and fatal COVID-19 cases: a living systematic review and meta-analysis. PLoS One. (2021) 16:e0253894. doi: 10.1371/journal.pone.0253894
19. Muppidi A, Radfar M. Speech emotion recognition using quaternion convolutional neural networks. ICASSP, IEEE International Conference on Acoustics, Speech and Signal Processing - Proceedings; Toronto, ON, Canada (2021). p. 6309–13. doi: 10.1109/ICASSP39728.2021.9414248
20. Hampe N, Wolterink JM, Van Velzen SG, Leiner T, Išgum I. Machine learning for assessment of coronary artery disease in cardiac CT: a survey. Front Cardiovasc Med. (2019) 6:172. doi: 10.3389/fcvm.2019.00172
21. Lee YS, Hong N, Witanto JN, Choi YR, Park J, Decazes P, et al. Deep neural network for automatic volumetric segmentation of whole-body CT images for body composition assessment. Clin Nutr. (2021) 40(8):5038–46. doi: 10.1016/j.clnu.2021.06.025
22. Abedi V, Razavi SM, Khan A, Avula V, Tompe A, Poursoroush A, et al. Artificial intelligence: a shifting paradigm in cardio-cerebrovascular medicine. J Clin Med. (2021) 10(23):1–23. doi: 10.3390/jcm10235710
23. Martin-Isla C, Campello VM, Izquierdo C, Raisi-Estabragh Z, Baeßler B, Petersen SE, et al. Image-Based cardiac diagnosis with machine learning: a review. Front Cardiovasc Med. (2020) 7:1. doi: 10.3389/fcvm.2020.00001
24. Meng D, Xu J, Zhao J. Analysis and prediction of hand, foot and mouth disease incidence in China using random forest and XGBoost. PLoS One. (2021) 16(12):e0261629. doi: 10.1371/journal.pone.0261629
25. Stevens D, Jackson B, Carberry J, McLoughlin J, Barr C, Mukherjee S, et al. The impact of obstructive sleep apnea on balance, gait, and falls risk: a narrative review of the literature. J Gerontol A Biol Sci Med Sci. (2020) 75:2450–60. doi: 10.1093/gerona/glaa014/5732393
26. Wickham H. Elegant graphics for data analysis: ggplot2. In Applied Spatial Data Analysis with R, Vol 1. New York: Springer (2008). p. 21–54. doi: 10.1007/978-0-387-98141-3
27. Lozano R, Naghavi M, Foreman K, Lim S, Shibuya K, Aboyans V, et al. Global and regional mortality from 235 causes of death for 20 age groups in 1990 and 2010: a systematic analysis for the global burden of disease study 2010. Lancet. (2012) 380(9859):2095–128. doi: 10.1016/S0140-6736(12)61728-0
28. Alotaibi FS. Implementation of machine learning model to predict heart failure disease. Int J Adv Comput Sci Appl. (2019) 10(6):261–8. doi: 10.14569/ijacsa.2019.0100637
29. Mattiuzzi C, Lippi G. Worldwide disease epidemiology in the older persons. Eur Geriatr Med. (2020) 11(1):147–53. doi: 10.1007/s41999-019-00265-2
30. Yousufuddin M, Young N. Aging and ischemic stroke. Aging. (2019) 11:2542–4. doi: 10.18632/aging.101931
31. Chen R, Miao F, Zheng J, Wu Y, Li Y. Effects of consecutive moderately cold days on cardiovascular disease mortality in Shenzhen, China: a preliminary study. Annu Int Conf IEEE Eng Med Biol Soc. (2018) 2018:1148–51. doi: 10.1109/EMBC.2018.8513273
32. Park HD, Han Y, Choi JH. Frequency-Aware attention based LSTM networks for cardiovascular disease. 9th International Conference on Information and Communication Technology Convergence: ICT Convergence Powered by Smart Intelligence, ICTC 2018 (2018). p. 1503–5. doi: 10.1109/ICTC.2018.8539509
33. Tardif J-C, Kouz S, Waters DD, Bertrand OF, Diaz R, Maggioni AP, et al. Efficacy and safety of low-dose colchicine after myocardial. N Engl J Med. (2020) 381(26):2497–505. doi: 10.1056/NEJMoa1912388
34. Nogic J, Mehta O, Tong D, Brown AJ, Layland J. Colchicine in the management of acute coronary syndrome: a meta-analysis. Cardiol Ther. (2023) 12(1):171–81. doi: 10.1007/s40119-022-00298-y
35. Shoaib M, Hussain T, Shah B, Ullah I, Shah SM, Ali F, et al. Deep learning-based segmentation and classification of leaf images for detection of tomato plant disease. Front Plant Sci. (2022) 13:1031748. doi: 10.3389/fpls.2022.1031748
36. Shoaib M, Sayed N. Traitement du signal YOLO object detector and inception-V3 convolutional neural network for improved brain tumor segmentation. Traitement Du Signal. (2022) 39(1):371–80. doi: 10.18280/ts.390139
37. Shoaib M, Shah B, Hussain T, Ali A, Ullah A, Alenezi F, et al. A deep learning-based model for plant lesion segmentation, subtype identi fi cation, and survival probability estimation. Front Plant Sci. (2022) 13:1095547. doi: 10.3389/fpls.2022.1095547
38. Shoaib M, Shah B, EI-Sappagh S, Ali A, Ullah A, Alenezi F, et al. An advanced deep learning models-based plant disease detection: a review of recent research. Front Plant Sci. (2023) 14:1–22. doi: 10.3389/fpls.2023.1158933
39. Saharan SS, Nagar P, Creasy KT, Stock EO, Feng J, Malloy MJ, et al. Machine learning and statistical approaches for classification of risk of coronary artery disease using plasma cytokines. BioData Min. (2021) 14(1):1–14. doi: 10.1186/s13040-021-00260-z
40. Cheng X, Han W, Liang Y, Lin X, Luo J, Zhong W, et al. Risk prediction of coronary artery stenosis in patients with coronary heart disease based on logistic regression and artificial neural network. Comput Math Methods Med. (2022) 2022:17–31. doi: 10.1155/2022/3684700
41. Guleria P, Srinivasu PN, Ahmed S, Almusallam N, Alarfaj FK. XAI framework for cardiovascular disease prediction using classification techniques. Electronics (Switzerland). (2022) 11(24):39–52. doi: 10.3390/electronics11244086
42. Jiang Y, Zhang X, Ma R, Wang X, Liu J, Keerman M, et al. Cardiovascular disease prediction by machine learning algorithms based on cytokines in Kazakhs of China. Clin Epidemiol. (2021) 13:417–28. doi: 10.2147/CLEP.S313343
43. Alizadehsani R, Habibi J, Sani ZA, Mashayekhi H, Boghrati R, Ghandeharioun A, et al. Diagnosing coronary artery disease via data mining algorithms by considering laboratory and echocardiography features. Res Cardiovasc Med. (2013) 2(3):133. doi: 10.5812/cardiovascmed.10888
44. Dinarello CA. Overview of the IL-1 family in innate inflammation and acquired immunity. Immunol Rev. (2018) 281(1):8–27. doi: 10.1111/imr.12621.Overview
Keywords: coronary artery disease, convolutional neural network, recurrent neural network, supervised learning, plasma cytokines
Citation: Shoaib M, Junaid A, Husnain G, Qadir M, Ghadi YY, Askar SS and Abouhawwash M (2024) Advanced detection of coronary artery disease via deep learning analysis of plasma cytokine data. Front. Cardiovasc. Med. 11:1365481. doi: 10.3389/fcvm.2024.1365481
Received: 4 January 2024; Accepted: 19 February 2024;
Published: 8 March 2024.
Edited by:
Svetlana Apostolović, University Clinical Center, SerbiaReviewed by:
Aleksandra Djokovic, University Hospital Medical Center Bezanijska kosa, SerbiaGordana Krljanac, University of Belgrade, Serbia
© 2024 Shoaib, Junaid, Husnain, Qadir, Ghadi, Askar and Abouhawwash. This is an open-access article distributed under the terms of the Creative Commons Attribution License (CC BY). The use, distribution or reproduction in other forums is permitted, provided the original author(s) and the copyright owner(s) are credited and that the original publication in this journal is cited, in accordance with accepted academic practice. No use, distribution or reproduction is permitted which does not comply with these terms.
*Correspondence: Mohamed Abouhawwash YWJvdWhhd3dAbXN1LmVkdQ==
†These authors have contributed equally to this work and share first authorship
 Muhammad Shoaib
 Ahmad Junaid1
 Ghassan Husnain
 Mansoor Qadir
 Yazeed Yasin Ghadi
 Mohamed Abouhawwash