 Archana Shrestha1
 Md Anamul Haque1Prajesh Shrestha2Margarita Lamprou3
 Seetharama D. Jois2
 Constantinos M. Mikelis3
 George Mattheolabakis1*
- 1School of Basic Pharmaceutical and Toxicological Sciences, College of Pharmacy, University of Louisiana at Monroe, Monroe, LA, United States
- 2Department of Pathobiological Sciences, School of Veterinary Medicine, Louisiana State University, Baton Rouge, LA, United States
- 3Laboratory of Molecular Pharmacology, Department of Pharmacy, University of Patras, Patras, Greece
Lung cancer (LC) is the leading cause of cancer-related deaths worldwide and is primarily treated with chemotherapy or radiotherapy. The role of microRNAs (miRs) is increasingly studied in cancer therapeutics, as miRs can regulate multiple cancer-related pathways simultaneously. While numerous miRs are individually explored for LC therapy, research on therapeutic miR combinations is limited. Our work here evaluates the stable deregulation of two miRs, miR-143-3p, and miR-506-3p, individually and in combination, to elucidate their roles upon prolonged exposure in non-small cell lung cancer (NSCLC) cell lines. Following stable transductions using lentiviruses in A549 and H1975 cells, we evaluated cell cycle distribution, proliferation, migration, and in vivo tumor growth. Sustained combined upregulation of miR-143-3p and miR-506-3p demonstrated a miR-expression dependent response, with advantageous responses for regulating tumor progression. The dual miR upregulation increased the G2 phase cell population and decreased cell proliferation, motility, migration, and colony formation. Furthermore, the dual upregulation significantly inhibited tumor growth in vivo compared to the respective dual downregulation, in contrast to the individual miR deregulations. Our study highlights the advantages of investigating combinatorial miRs for cancer treatment, particularly miR-143/506 against LC.
Introduction
Although LC represents the second most frequently observed cancer, it presents in the US the highest number of cancer-related fatalities, with a 5-year survival rate of 8% for later-stage cancers (Siegel et al., 2024). Furthermore, non-small cell lung cancer (NSCLC) is the most common lung cancer subtype, accounting for approximately 85% of total lung cancer (LC) cases (Siegel et al., 2024; Ganti et al., 2021). microRNAs (miRs), small RNAs of approximately 19–22 nucleotides length, have emerged as valuable therapeutic and diagnostic tools in cancer-related studies due to their capacity to target and inhibit the expression of mRNAs by targeting their respective 3′-UTR regions (Macfarlane and Murphy, 2010; Hossian et al., 2019a; Hossian A. et al., 2021; Shrestha et al., 2024). Since a single miR can regulate the expression of multiple mRNAs, they can target and regulate multiple pathways. Numerous miRs are deregulated during cancer development and progression, with specific downregulated miRs considered as tumor suppressors and other upregulated miRs classified as tumor promoters (Svoronos et al., 2016). Thus, miRs are potent therapeutic targets/tools or diagnostic molecules against cancers, including NSCLC (Hashimoto et al., 2013).
Our work has focused on the combinatorial utilization of two miRs, miR-143-3p and miR-506-3p, against NSCLC (Hossian A. et al., 2021; Shrestha et al., 2024; Hossian et al., 2018; Hossian A. K. M. N. et al., 2019). Both miRs have been extensively reported as tumor suppressive miRs across multiple cancer types, including NSCLC, where they have been reported to be significantly downregulated and were previously reported individually as potential tumor suppressors against LC (Hossian A. et al., 2021; Shrestha et al., 2024; Hossian et al., 2018; Hossian et al., 2019b; Asghariazar et al., 2022; Guo et al., 2017). Notably, miR-506’s anti-cancer effects are attributed to modulation of several mechanistic pathways such as suppression of epithelial-mesenchymal transition (EMT) (PMID: 23717581), repression of E-cadherin (PMID: 23410973), downregulation of the PI3/AKT signaling axis (PMID: 27065335) and so on. Similarly, miR-143’s role in inhibiting tumor progression is linked to various oncogenic signaling cascades that include, PI3K/MAPK (PMID: 29137432), EMT modulation (PMID: 25175415), KRAS (PMID 31638218) to name a few. Our early work evaluated the transient combined upregulation of these miRs in regulating LC progression. The treatment led to significant inhibition of cell cycle progression in NSCLC cell lines, associated with a combined G1 and G2 cell cycle phase inhibition, cell apoptosis, and decreased cyclin-dependent kinase (CDKs) 1, 4, and 6 expressions (Hossian A. et al., 2021; Hossian et al., 2018; Hossian A. K. M. N. et al., 2019). Our work introduced a novel perspective of combinatorial miR treatment. In our latest report on combinatorial miR utilization, we explored the effect of the two miRs under stable deregulation via viral transduction (Shrestha et al., 2024). Stable deregulation of miRs permits a new understanding of the miRs and their activity, as it represents the effects of these miRs during prolonged treatment in disease models where long-term treatment might be necessary. Unlike the acute treatment, i.e., transient transfection, stable transduction elicits new insights on miR activity with pro-apoptotic effects, as it allows the evaluation of cells that survive the apoptotic pressure, similar to resistant cells. Thus, this elucidates the chronic effects of any miR therapy, as altered or unexpected responses may occur. Such studies are as relevant as chemoresistance is to prolonged treatment of traditional chemotherapeutics.
Our group recently presented the impact of chronic deregulation in A549 cells (Shrestha et al., 2024). We used lentiviral-induced stable deregulations of miR-143-3p and miR-506-3p, individually or in combination. The dual miR-143/506 upregulation showed a miR-expression-dependent change in cell doubling time while indicating a G2 cell cycle arrest, compared to both miR-control and miR-143/506 downregulation groups. In contrast, the individual miR deregulation did not demonstrate the expected similar behavior or, more importantly, miR-dependent cellular responses between up- and downregulation (Shrestha et al., 2024). Our analysis indicated that the prolonged individual miR-143 or miR-506 deregulation may not necessarily maintain the outcomes observed during the transient (acute) transfection of these miRs. In contrast, the combinatorial miR treatment maintained a miR-expression dependent behavior that appears advantageous even under prolonged exposure.
In this study, we evaluate the in vivo tumor growth of these A549 stably deregulated cells and expand our in vitro analysis to an additional NSCLC cell line via the stable individual or combined miR-143/506 deregulation in NCI-H1975 (H1975) cells.
Materials and methods
Materials
The A549 human lung adenocarcinoma cell line (CCL-185), H1975 human lung adenocarcinoma cell line (CRL-5908), Universal Mycoplasma Detection Kit (30-1012K), and FTA Sample Collection Kit for Human Cell Authentication Service (135-XV) were purchased from ATCC (Manassas, VA, United States). All lentiviruses were obtained from Applied Biological Materials (Cat Nos: m002, mh15183, mh35190, mh16154, mh35891; Richmond, Canada). Hexadimethrine bromide (Cat No. H9268) was purchased from Millipore, Sigma (St. Louis, MO, United States). Cell culture medium DMEM (10017-CV) and RPMI-1640 (#16750-070) were purchased from VWR (Radnor, PA), Ham’s F12K media (#10-025-CV) was purchased from Corning (Corning, NY, United States). Penicillin/Streptomycin were purchased from VWR. Puromycin (CAS #53-79-2), Invivogen G418 (Cat No: NC9107150), and transwell polycarbonate membrane inserts (07-200-150) were purchased from Fisher Scientific (Waltham, MA, United States). Matrigel Basement Membrane Matrix (07-200-150) was purchased from VWR (Radnor, PA, United States).
Animals: 49 female nude mice (4-6 weeks old) were obtained from Envigo (Indianapolis, IN, United States). All animals were housed in the College of Pharmacy’s Vivarium facilities. Animal studies were performed according to an approved protocol by the Institutional Animal Care and Use Committee (IACUC) of the College of Pharmacy at the University of Louisiana at Monroe.
Cell culture conditions and generation of stable cell-lines
Stable transduced cells were cultured under conditions previously described by us (Shrestha et al., 2024). Briefly, A549 parent cells and A549-stable transduced cells were cultured in DMEM/F-12K (1:1) culture medium, and H1975 parent and stable transduced cells were cultured in RPMI-1640 complete medium. All media were supplemented with 10% Fetal Bovine Serum (FBS) and 1% penicillin/streptomycin. The cells were cultured at 37 °C under 5% CO2 humidified atmosphere. Culture media for A549-and H1975 -miR-GFP control, -miR-143 and -anti-miR-143 were additionally supplemented with 2.5 μg/mL puromycin, and A549 and H1975- miR-506 and -anti-miR-506 were supplemented with 850 μg/mL G418. Additionally, for the miR-combination stably transduced groups, i.e., A549-and H1975- miR-143/506 and anti-miR-143/506, an initially 7–8-day of 850 μg/mL G418 treatment took placed followed by 2.5 μg/mL puromycin was used to treat the cells.
Lentiviral stable A549 and H1975 cell transduction was performed as previously described (Shrestha et al., 2024). Briefly, 5 × 10⁴ cells/well of A549 or H1975 cells were seeded in 24-well plates overnight. The culture media in the wells was replaced with complete media containing 8 μg/mL hexadimethrine bromide the following day. A calculated volume of viral particles (viral titer >107 IU/mL) was added at the multiplicity of infection (MoI) of 5 for A549 and MoI of 10 for H1975, following a 24 h incubation. Subsequently, the media was replaced by fresh complete media, and the cells were subcultured with 1:3 split in a new 24-well plate for a 48 h incubation. The respective concentrations for the selection antibiotics were identified by performing kill curve experiments, following the vendor’s protocols. Briefly, A549 or H1975 parent cells in a 24-well plate were incubated with varying concentrations of puromycin (0.5, 0.75, 1, 1.5, 2, 2.5, 3, 5 μg/mL) for 5 days and G418 (100–1,000 μg/mL) for 10 days in duplicates. Then, we specified the appropriate concentration was 2.5 μg/mL for puromycin and 850 μg/mL for G418 to treat the newly transduced cells for appropriate antibiotic selection.
Cell sorting
All stably transduced cells were sorted using Bigfoot Spectral Cell Sorter (ThermoFisher Scientific, Waltham, MA) using the Sasquatch software (SQS). Initially, we harvested and counted 5–8 × 10⁶ A549 or H1975 stable-transduced cells from each group and washed them with 1x sterile PBS. We prepared cell suspensions in 2 mL sterile PBS (1x) by mixing gently and filtered them using 40-micron filter. Firstly, we determined the forward scatter (FSC-A) versus side-scatter (SSC-A) gating for live cells using untagged A549 and H1975 parent cells. Next, we gated a singlet population from FSC-A versus FSC-H population. We obtained a histogram from singlet population in FL2-A (log) versus count where the histogram area for untagged cells was determined as a baseline for the GFP-tagged population. Subsequently, the cell population was gated with positive GFP fluorescence with a threshold of log 103, which we used to sort the cells. The sorted cells were collected in a sterile 15 mL falcon tube containing 3 mL complete media. The sorted cells were subsequently used for further analyses.
RNA extraction and qPCR analysis
qPCR analyses took place as previously described (Shrestha et al., 2024; Hossian et al., 2018; Hossian A. K. M. N. et al., 2019; Hossian A. K. M. N. et al., 2021). Briefly, total RNA from cell samples was extracted using the Quick-RNA miniprep kit (Zymo Research- Irvine, CA), following the vendor’s protocol. We quantified the RNA concentration using Nanodrop, and miR cDNA synthesis took place using TaqMan™ MicroRNA Reverse Transcription Kit (Thermo Fisher, Waltham, MA). RT-qPCR was used to determine miRNA expressions between samples, using BioRad CFX96 real-time PCR system (BioRad systems, Hercules, CA) and TaqMan Universal Master Mix II assay along with TaqMan miRNA specific primers (Applied Biosystem, Carlsbad, CA). We used the ∆∆Cq analysis to determine relative miRNA expression. The results are the average of three individual experiments (triplicates per group/experiment).
Cell cycle analysis
We performed cell cycle analysis as previously described (Shrestha et al., 2024; Hossian et al., 2018). Briefly, harvested cells were washed with PBS and fixed in 3.7% paraformaldehyde and 70% ethanol. We stained the cells following the vendor’s protocol using FxCycle™ PI/RNase Staining Solution (Cat No. F10797; Fisher Scientific, WA, MA), and analyzed them using BD Biosciences LSRFortessa X-20 along with BD FACS Diva™ Software v9.0 (BD Biosciences, Franklin Lakes, NJ). We processed the data using FlowJo v10.10 (BD Biosciences, Franklin Lakes, NJ; Supplementary Figure S1). The cell cycle data are presented as the percentage of cell distributions in the different phases (G0/G1, S, and G2). The results obtained were the average of 2 individual experiments (triplicates per group/experiment).
Wound healing assay
We performed a wound healing assay using Incucyte® SX5 (Sartorius, Germany). Briefly, we seeded 3 × 10⁴ cells/well in Incucyte® Imagelock 96-well Microplate (Cat no. BA-04856) and incubated the cells overnight at pre-described conditions. After the cells reached 95%-100% confluency, we gently scratched the middle of the cell monolayer along the diameter of the well using the Incucyte® 96-well woundmaker tool (Cat no. 4563). We gently washed the cells with PBS 3-4 times to remove debris, then added 2% FBS/1% penicillin streptomycin-containing media in all wells. We placed the assay plate into the Incucyte® Live-Cell Analysis System, and images were taken at predetermined time points at 10x magnification. We processed all the images using the live cell analysis software. The data are presented as the percentage relative wound density at the predetermined time points. The results are the average of 4-6 wells per experimental group.
Transwell migration assay
We performed a transwell migration assay using 24-well transwell inserts with 8 µm pore size. At first, we seeded 15 × 103 A549 transduced cells or 35 × 103 H1975 stable transduced cells on the upper side of the chamber with 100 µL serum-free media. The bottom chamber was filled with 600 µL medium containing 10% FBS. After 24 h, we rinsed the inserts with 1x PBS and fixed the cells with 4% paraformaldehyde for 5 min, followed by fixing them with 100% pre-chilled methanol for 20 min. We stained the cells with 0.2% crystal violet for 15 min. After rinsing off excess stains, non-migrated cells were removed from the top of the chamber using a cotton swab. The inserts were inverted and left to air dry overnight. The results are the average of 6 or more randomly obtained images per transwell inserts (2 inserts/experimental group).
Colony formation assay
We seeded A549 or H1975 stable transduced cells at a seeding density of 1,000 cells/well in a 6-well plate. We incubated the cells for 7 days. After incubation, we rinsed the cells with 1x sterile PBS. We fixed the cells with pre-chilled 100% methanol, followed by 0.5% crystal violet staining. We left the plates to air-dry overnight after washing the wells to remove excess stains. The next day, we captured the images of the stained colonies over a white-lit background. The colonies were then counted in ImageJ 1.53e v1.8.0_172 (http://imagej.nih.gov/ij). The results are the average of 3 individual experiments (3 wells per experiment per group).
Mycoplasma detection analysis
We performed mycoplasma detection analysis following the manufacturer’s protocol. Briefly, lysed cell samples were analyzed using PCR with primers provided by the vendor. Bands were detected using ethidium bromide-stained gel electrophoresis.
Kinetic cell proliferation assay
We performed the kinetic cell proliferation assay using the Holomonitor® Live Cell Imaging System (Phase Holographic Imaging, Sweden). Initially, we seeded H1975 stable transduced cells at 15% confluency in a 24-well plate and incubated them at predetermined conditions overnight. The following day, we rinsed the cells with 1x sterile PBS and added fresh complete medium to all wells. We placed sterile HoloLids™ over the wells as per vendor’s protocol and carefully mounted the plate on the HoloMonitor® microscope for scheduled scans at 5-10 positions per well (3 wells per treatment group) every 25 min for 24 h with approximately the same confluency among the groups using the HoloMonitor® App Suite Cell Imaging Software. Using the obtained data, we quantified the cell doubling time.
Cell morphology analysis
We utilized the Holomonitor® Live Cell Imaging System and HoloMonitor® App Suite Cell Imaging Software (Phase Holographic Imaging, Sweden) to assess the H1975 cell area, perimeter and eccentricity. Briefly, we seeded cells at 10% confluency in 96-well plate (>6 wells/group). The following day, we rinsed the cells with 1x sterile PBS and scheduled image scans at 3 positions/well at predetermined intervals for 24 h. We analyzed cell morphology in the HoloMonitor® App Suite Cell Imaging Software.
In vivo subcutaneous tumor growth mouse model
We evaluated tumor growth using a subcutaneous tumor animal model with female nude mice. This study is reported in accordance with ARRIVE guidelines and mice were euthanized with carbon dioxide. All methods were carried out in accordance with relevant guidelines and regulations. Initially, we subcutaneously injected A549 stable transduced cells at a density of 2.5 × 10⁶ cells/100 µL 10% Matrigel/tumor on mice. Two tumors per mouse were inoculated subcutaneously on both flanks on the back of the mice (n = 7 mice/group). Palpable tumors were detected after 4 days of inoculation. We determined tumor dimensions using a vernier caliper, and the body weights of all mice were measured twice per week. The signal intensity of GFP-expressing tumors was detected using Living Image Software (Perkin Elmer, Waltham, MA). After ∼5 weeks, the mice were euthanized. We excised lungs, liver, spleen, kidneys, brain, and tumors for imaging under the IVIS™ imaging system. The tumor volume (V) was calculated using the standard formula:
Statistical analysis
We analyzed the obtained data using one-way analysis of variance (ANOVA) followed by a post hoc Tukey’s test, unless stated otherwise, to determine the significance of differences among the groups. We have presented all data as mean values ± standard error of the mean. P-values ≤0.05 were considered statistically significant.
Results
Stable transduction of cells
Similar to the stable individual and dual up- and downregulation of miR-143 and miR-506 in A549 cells, reported previously, we stably transduced the respective deregulations for miR-143 and/or miR-506 in H1975 cells (Shrestha et al., 2024). The initial validation of successful transduction was determined by GFP expression (Figure 1) and antibiotic resistance to the respective selection antibiotic by the cells. The concentrations of 2.5 μg/mL puromycin for miR-143 deregulations (i.e., miR-143: upregulation; anti-miR-143: downregulation; individual or combination deregulations) and 850 μg/mL G418 for miR-506 deregulations (i.e., miR-506: upregulation; anti-miR-506: downregulation; individual or combination deregulations) were applied to select the successfully transduced cells. Cells were sorted using fluorescence-activated cell sorter (Bigfoot Spectral Cell Sorter). GFP-positive cell populations were collected and used for further analyses (Supplementary Figure S2).
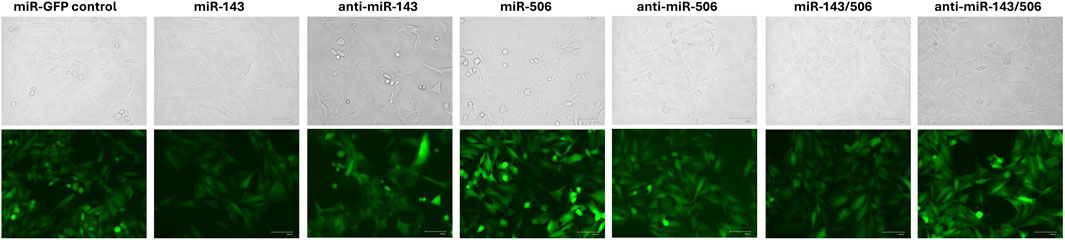
Figure 1. Stable transduction of H1975 cells using lentiviral transduction for miR-143, miR-506 or dual miR-143/506 deregulation. Representative images demonstrate GFP signal from the cells produced due to the presence of GFP as a reporter gene, indicating successful transduction.
We carried out the ATCC STR cell profile cell authentication to confirm the H1975 cell type identity and to verify the absence of unexpected mutations or cross contaminations (Supplementary Figure S3). Finally, we conducted a mycoplasma detection PCR analysis, confirming mycoplasma contamination’s absence (Supplementary Figure S4). The A549 transduction for miR-deregulations and their respective characterization was previously presented (Shrestha et al., 2024).
Effects of stable miR-143 deregulation in LC cells
Lentiviral transduction induced miR-143 deregulation
We evaluated the deregulation of miR-143 in the respective H1975 miR-143 (upregulation) and anti-miR-143 (downregulation) cell groups. Briefly, we performed qPCR analysis using TaqMan primers and RNA extracts from the sorted cells that survived the lentiviral transduction and antibiotic treatment. The lentiviral transduction upregulated the miR-143 expression in the respective cell group, while the downregulation did not achieve a significant difference to the control group but only compared to the upregulation group (Figure 2A). The transduction was successful for all groups, as the cells demonstrated GFP expression and antibiotic resistance. In more detail, H1975 cells in the miR-143 upregulation group demonstrated a >7-fold increase in the levels of miR-143 compared to the miR-control group (p < 0.05), while the cells in the miR-143 downregulation group demonstrated approximately 50% decrease in miR-143 levels compared to the miR-control group. Moreover, miR-143 upregulation displayed an approximately 14-fold increase in miR-143 expression compared to miR-143 downregulation (p < 0.01). We previously reported the respective miR-deregulations and characterizations using A549 cells (Shrestha et al., 2024).
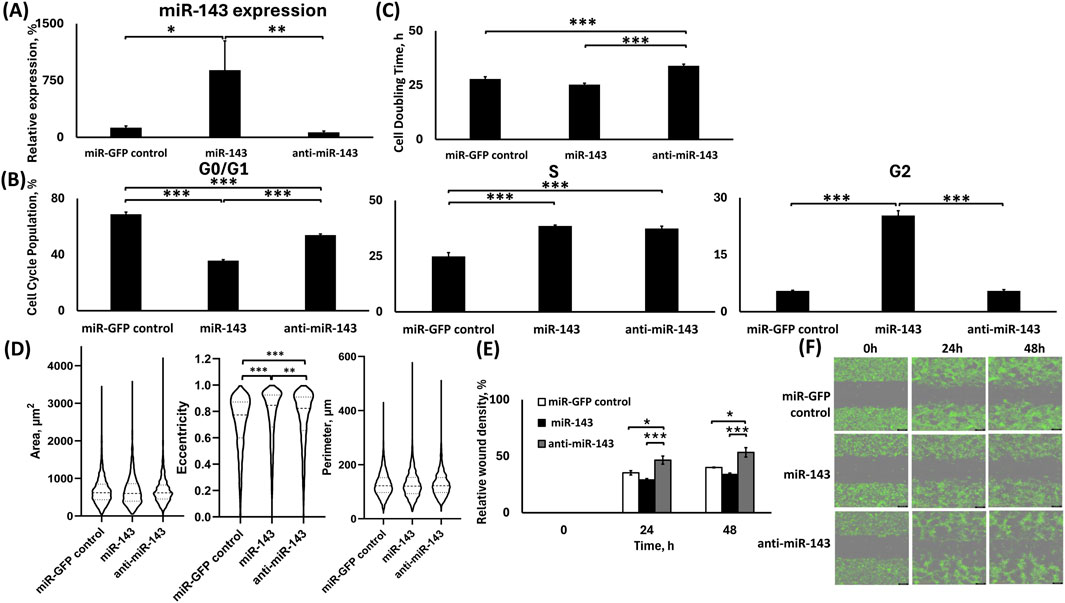
Figure 2. Analysis of H1975 stable cells transduced with lentiviral particles for miR-143 up-/downregulation. (A) TaqMan qPCR analysis of miR-143 expression. U6 was used as reference gene; (B) Cell cycle analysis; (C) Cell doubling time analysis; (D) Morphometrics analysis for area, eccentricity and perimeter using Holomonitor® App Suite Cell Imaging Software; (E,F) Relative wound density analysis (E) and representative green fluorescence images of wound healing assay using Incucyte® Live Cell Imaging and Analysis System (F). *: p < 0.05, **: p < 0.01, ***: p < 0.001; One-way ANOVA followed by Tukey’s post hoc analysis.
miR-143 upregulation significantly increased the G2 phase cell population, but miR-143 downregulation significantly increased the cell doubling time in H1975 cells
In the H1975 cells, miR-143 upregulation had approximately 33% fewer cells of the total population at the G0/G1 phase compared to control (p < 0.001), whereas the miR-143 downregulation had approximately 14% fewer cells of the total population at the G0/G1 phase compared to control (p < 0.001), while the miR-143 downregulation had an approximately 18% more cells of the total population at the G0/G1 phase than the respective upregulation (p < 0.001; Figure 2B). Contrastingly, both the miR-143 upregulation and downregulation groups had significantly larger S-phase populations compared to miR-control, by ∼14% and ∼12% of the total cell populations, respectively (p < 0.001 for both). There was no significant difference between the miR-143 deregulated S-phase cell population groups. Interestingly, the miR-143 upregulation had more than 20% of its total population in the G2 phase compared to both control and miR-143 downregulation (p < 0.001 for both), suggesting a G2 cell cycle arrest. No statistically significant differences were observed between the control and miR-143 downregulation groups for their respective G2 populations (Figure 2B).
Using the Holomonitor® Live Cell Imaging system, we analyzed the cell doubling time for the H1975 miR-143-deregulated groups compared to the miR-GFP control (Figure 2C). The miR-143 downregulation increased the cell doubling time, indicating slower proliferation than the miR-GFP control and miR-143 upregulation. miR-143 downregulation demonstrated a ∼22% increase in cell doubling time compared to the miR-GFP control (p < 0.001), and a ∼34% increase compared to the miR-143 upregulation (p < 0.001). Moreover, miR-143 upregulation decreased the cell doubling time compared to control by 10.33%, with a pairwise significance between the two groups (pairwise: p < 0.05).
miR-143 upregulation decreased cell motility compared to its downregulation with limited differences in morphological characteristics compared to control
We conducted a morphometric analysis using the miR-143 deregulated H1975 cell groups by utilizing the Holomonitor® Live Cell Imaging System (Figure 2D). We evaluated changes in the cellular area, eccentricity, and perimeter to study the possible effects of the miR-143 deregulation in these morphological characteristics. No significant changes were observed for the area of the transduced cells for any of the deregulations. The miR-143 upregulation showed a modest increase in cell eccentricity by 1.08-fold compared to control (p < 0.001) and by 1.02-fold compared to miR-143 downregulation (p < 0.01), and miR-143 downregulation also increased cell eccentricity relative to control by 1.05-fold (p < 0.001). No statistically significant differences in cell perimeter were observed among the miR-143 deregulated groups.
We utilized Incucyte® Live Cell Imaging and Analysis System to conduct a wound healing assay. We evaluated the motility of the cells based on miR-143 deregulation (Figures 2E,F). Our analysis indicated that 24 h following the formation of the wound, the miR-143 downregulation demonstrated accelerated motility compared to the miR-control and miR-143 upregulation. In more detail, the miR-143 downregulation group demonstrated an approximately 1.3-fold larger area closed compared to the miR-control group (p < 0.05) and a 1.6-fold larger area closed compared to the miR-143 upregulation group (p < 0.001). Interestingly, miR-143 upregulation had a slower wound closure compared to miR-control, where miR control demonstrated a 1.2-fold larger relative wound density, with the difference being significant during pairwise comparison of the groups (Pairwise: p < 0.05). Similarly, at the 48 h time point, miR-143 downregulation demonstrated the fastest wound closure compared to the miR-control group by a 1.33-fold increase (p < 0.05) and a 1.57-fold larger relative wound density compared to the miR-143 upregulation group (p < 0.001). The miR-GFP control group also had accelerated closure compared to the miR-143 upregulation group by 1.18-fold, with the difference being significant during pairwise comparison of the groups (Pairwise: p < 0.01).
miR-143 upregulation inhibited cell migration in H1975 but not in A549 cells
We performed a transwell cell migration assay to evaluate the effect of miR-143 deregulations in both H1975 and A549 cell lines (Figures 3A,C).
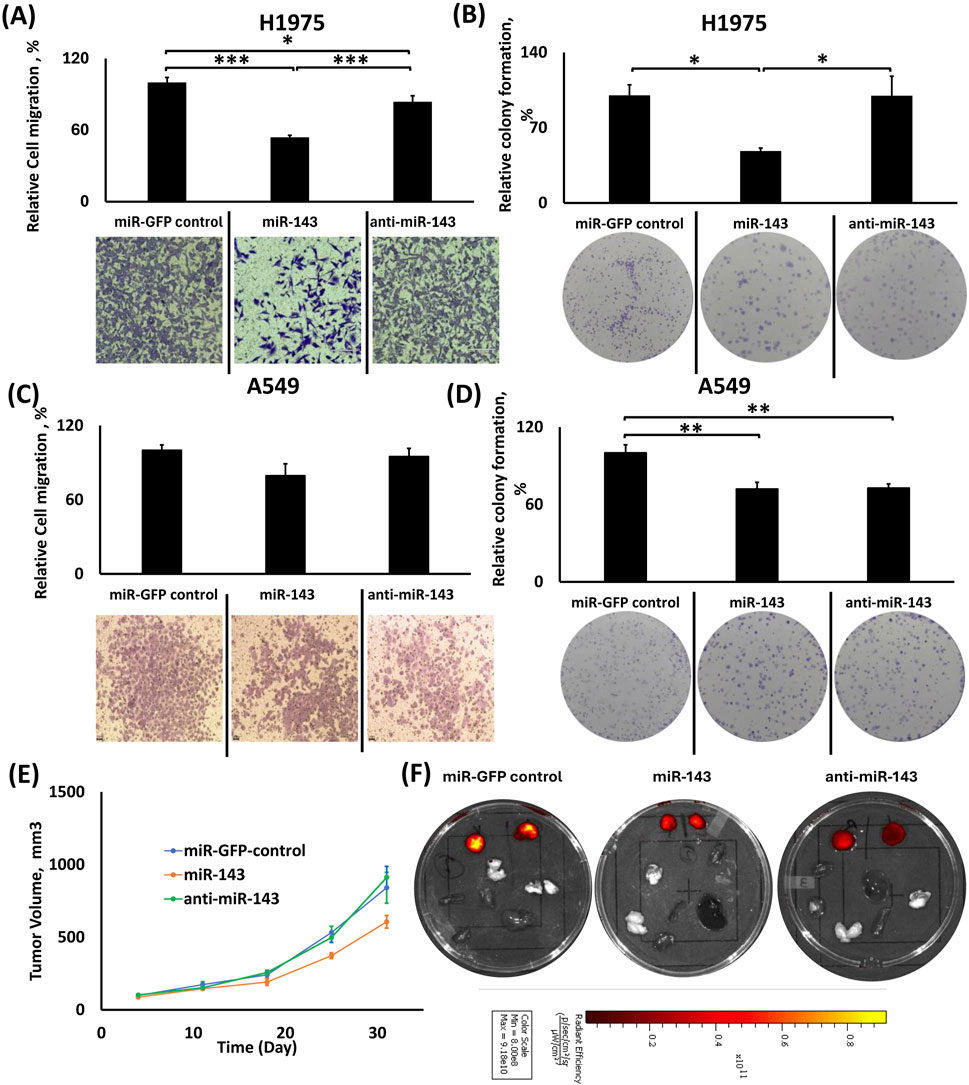
Figure 3. Effects of individual miR-143 up-/downregulation in migration, colony formation and tumor growth in H1975 and A549 cells. (A,C) Relative cell migration analysis using ImageJ and representative images of transwell cell migration of H1975 (A) and A549 (C) cells; (B,D) Relative colony formation analysis using ImageJ with representative images of colony formation using H1975 (B) and A549 (D) cells; (E) Tumor volume growth graph for the subcutaneous tumors from the xenograft mouse model of the miR-143 deregulated A549 cells; (F) Representative IVIS™ fluorescence images of excised tumors (right and left) and vital organs (lungs, liver, heart, spleen, kidney and brain). Red color denotes the presence of fluorescence signal from tumor cells. *: p < 0.05, **: p < 0.01, ***: p < 0.001; One-way ANOVA followed by Tukey’s post hoc analysis.
In H1975 cells, miR-143 upregulation indicated a reduced number of migrated cells compared to the control and miR-143 downregulation (Figure 3A). In detail, the miR-143 upregulation group had 46% and 30% fewer cells migrating compared to the miR-GFP control (p < 0.001) and miR-143 downregulation (p < 0.001) groups, respectively. The miR-143 downregulation group also showed a modestly reduced cell migration compared to the miR-control group (∼16% reduction in cell number, p < 0.05).
In A549 cells, there were no statistically significant differences in cell migration between miR-143 up- and downregulation and control groups, even though cell migration for miR-143 upregulation was modestly lower than the control and respective downregulation groups (Figure 3C).
miR-143 upregulation inhibited colony formation in H1975 cells, but both miR-143 up- and downregulation inhibited colony formation in A549 cells compared to control
In H1975 cells, miR-143 upregulation significantly decreased colony formation compared to both control and miR-143 downregulation (Figure 3B). Both miR-control and miR-143 downregulation groups formed approximately 2.07-fold more colonies (p < 0.05 for both) compared to miR-143 upregulation group, while the miR-downregulation group did not present any significant differences compared to miR-control group.
In A549 cells, miR-143 upregulation showed similar effects for colony formation compared to its downregulation group, while both miR-143 up- and downregulated groups showed a decreased relative percentage of colony formation compared to the miR-GFP group (Figure 3D). In more detail, miR-control demonstrated an approximately ∼1.38-fold larger colony count compared to both miR-143 upregulation (p < 0.01) and downregulation (p < 0.01), with the two deregulation groups presenting similar behavior.
A549 miR-143 upregulation suppresses tumor growth progression compared to miR-143 downregulation and miR-control
We injected A549 cells with miR-143 upregulation or downregulation and A549 miR-GFP control cells subcutaneously in the right and left flanks of nude mice (n = 7 animals), and tumor sizes were determined weekly. miR-143 upregulation inhibited tumor growth compared to its downregulated counterpart and miR-control. As shown in Figure 3E, miR-143 upregulation elicited the slowest rate of tumor growth compared to both miR-143 downregulation and miR-GFP control, presenting the most potent effect of 34% tumor growth inhibition on day 25 post-injection compared to miR-GFP control group (p < 0.01) and on day 31 presenting the maximum difference compared the miR-143-downregulation group, with 36% tumor growth inhibition (p < 0.05). The miR-downregulation group did not present significant differences in tumor growth compared to the miR-GFP control group. Figure 3F shows representative tissue samples from the respective groups.
Effects of stable miR-506 deregulation in LC cells
Lentiviral transduction induced miR-506 deregulation
We evaluated the deregulation of miR-506 in the respective cell groups using qPCR, as shown in Figure 4A. The sorted cells that survived the lentiviral transduction and antibiotic treatment presented a respective upregulated miR-506 expression, while the downregulation did not achieve a significant difference compared to the control group, but only compared to the upregulation group. The transduction was successful for all groups, as the cells demonstrated GFP expression and antibiotic resistance. Briefly, cells in the miR-506 upregulation group demonstrated a ∼25-fold increase in the miR-506 levels compared to the miR-control group (p < 0.001), while the cells in the miR-506 downregulation group did not demonstrate a statistically significant change in miR-506 levels compared to the miR-control group. We previously reported the respective miR-deregulations and characterizations using A549 cells (Shrestha et al., 2024).
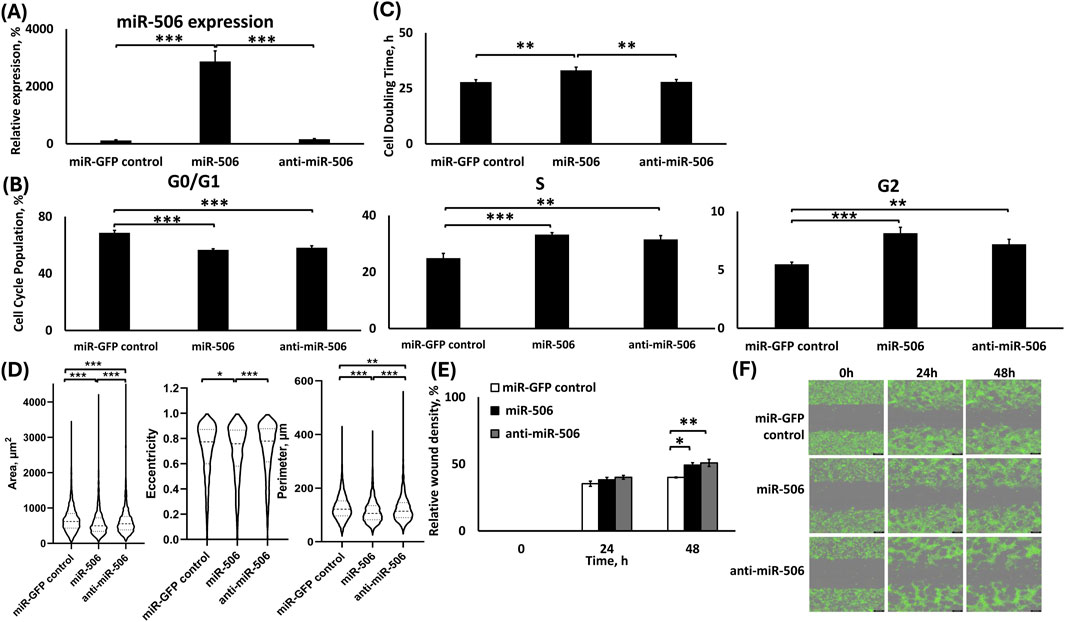
Figure 4. Analysis of H1975 stable cells transduced with lentiviral particles for miR-506 up-/downregulation. (A) TaqMan qPCR analysis of miR-506 expression. U6 was used as reference gene; (B) Cell cycle analysis; (C) Cell doubling time analysis; (D) Morphometrics analysis for area, eccentricity and perimeter using Holomonitor® App Suite Cell Imaging Software; (E,F) Relative wound density analysis (E) and representative green fluorescence images of wound healing assay using Incucyte® Live Cell Imaging and Analysis System (F). *: p < 0.05, **: p < 0.01, ***: p < 0.001; One-way ANOVA followed by Tukey’s post hoc analysis.
Both miR-506 deregulations presented similar cell cycle population distributions, but miR-506 upregulation significantly increased cell doubling time in H1975 cells
Briefly, miR-506 up- and downregulation groups presented similar effects on all cell cycle phases (Figure 4B). In more detail, compared to the miR-GFP control group, miR-506 upregulation presented 12% fewer cells (p < 0.001), and the miR-506 downregulation presented ∼10% fewer cells (p < 0.001) of the total population in the G0/G1 phase. Interestingly, there was no statistically significant difference between the two miR-506 deregulation groups for their G0/G1 phase populations. miR-506 upregulation demonstrated ∼8% more cells of the total cell population in the S phase compared to control (p < 0.001), which was similarly observed with the miR-506 downregulation as well, presenting a 6.6% larger number of cells of the total population in the S phase compared to control (p < 0.01). There were no significant differences between the two miR-506 deregulations in the S phase populations. Finally, miR-506 upregulation increased the G2-phase population by 3% compared to the control (p < 0.001), while the miR-506 downregulation also increased the G2 phase population by 2% compared to the control (p < 0.01). Similarly, no significant differences in the G2 phase populations were observed for the two miR-506 deregulations.
We evaluated the cell doubling time for H1975 miR-506 miR-deregulated groups by utilizing Holomonitor® Live Cell Imaging System with respect to the miR-GFP control (Figure 4C). According to our findings, miR-506 upregulation indicated approximately ∼19% prolonged cell doubling time compared to the miR-GFP control and miR-506 downregulation groups (p < 0.01 for both). miR-506 downregulation group did not demonstrate a significant difference to the control group.
Both miR-506 up- and down-regulations show a similar effect on cellular motility
We utilized the Holomonitor® Live Cell Imaging system to evaluate the morphological characteristics of the H1975 cells under the different miR-506 deregulations (Figure 4D). miR-506 upregulation caused a significant decrease in the cellular area relative to both control and miR-506 downregulation. Briefly, miR-506 upregulation presented a ∼13% (p < 0.001) decreased area compared to miR-GFP control and ∼7% (p < 0.001) decreased area compared to miR-506 downregulation. Interestingly, miR-506 downregulation also demonstrated a ∼6% reduced area compared to miR-control (p < 0.001). miR-506 upregulation reduced cellular eccentricity in comparison with miR-control and miR-506 downregulation by ∼2% (p < 0.05) and ∼3% (p < 0.001), respectively, miR-506 downregulation did not present a significant difference to the control group. Finally, the H1975 cell perimeter decreased due to miR-506 upregulation by 11% (p < 0.001) compared to control and by ∼8% (p < 0.001) compared to miR-506 downregulation. Furthermore, miR-506 downregulation induced a ∼4% decrease in cell perimeter compared to control (p < 0.01).
Using Incucyte® Live Cell Imaging and Analysis wound healing assay, both miR-506 up- and down-regulations in H1975 presented a slight increased relative wound closure at the 24 h time point (Figures 4E,F). At the 48 h time point, both deregulations indicate higher motility for their respective cells, with miR-506 upregulation indicating a 1.22-fold faster wound closure compared to control (p < 0.05) and the miR-506 downregulation indicating a 1.27-fold faster wound closure compared to control (p < 0.01).
miR-506 upregulation decreased cell migration in H1975, but both miR-506 up- and downregulation decreased migration in A549 cells
In H1975 cells, miR-506 upregulation demonstrated decreased cellular migration compared to the control and its downregulated counterpart (Figure 5A). miR-506 upregulation group presented ∼31% fewer migrating cells compared to miR-control group (p < 0.001) and ∼51% compared to its respective downregulation group (p < 0.001). Moreover, miR-506 downregulation group had 1.2-fold more cells migrating compared to the control (p < 0.001).
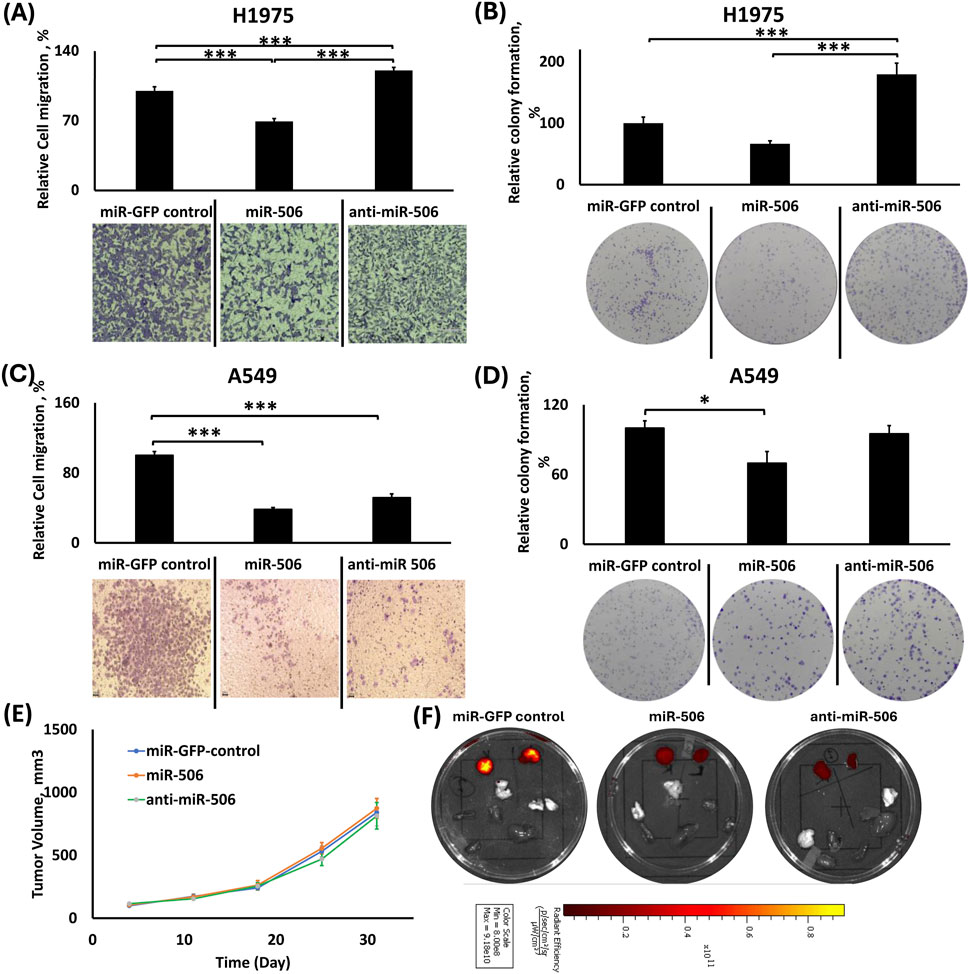
Figure 5. Effects of individual miR-506 up-/downregulation in migration, colony formation and tumor growth in H1975 and A549 cells. (A,C) Relative cell migration analysis using ImageJ and representative images of transwell cell migration of H1975 (A) and A549 (C) cells; (B,D) Relative colony formation analysis using ImageJ with representative images of colony formation using H1975 (B) and A549 (D) cells; (E) Tumor volume growth graph for the subcutaneous tumors from the xenograft mouse model of the miR-506 deregulated A549 cells; (F) Representative IVIS™ fluorescence images of excised tumors (right and left) and vital organs (lungs, liver, heart, spleen, kidney and brain). Red color denotes the presence of fluorescence signal from tumor cells. *: p < 0.05, **: p < 0.01, ***: p < 0.001; One-way ANOVA followed by Tukey’s post hoc analysis.
In A549 cells, both miR-506 up- and downregulation resulted in decreased cell migration compared to the control (Figure 5C). In detail, miR-506 upregulation reduced the number of migrated cells by ∼62% (p < 0.001) compared to the control, and the miR-506 downregulation reduced the number of migrated cells by ∼48% (p < 0.001) compared to the control. Although the miR-506 upregulation inhibited migration more potently than the respective downregulation, the difference between the two groups was not statistically significant.
miR-506 upregulation overall decreased colony formation
In H1975 cells, miR-506 upregulation decreased colony formation compared to control, but miR-506 downregulation potently increased colony formation (Figure 5B). In detail, miR-506 upregulation decreased colony formation by ∼33% compared to control (Pairwise: p < 0.05), while the miR-506 downregulation significantly increased colony formation by 1.8-fold (p < 0.001) compared to the control. Interestingly, miR-506 downregulation had a 2.7-fold increase in colony formation compared to the miR-506 upregulation group (p < 0.001).
Similarly, using A549 cells, miR-506 upregulation overall inhibited colony formation compared to miR-GFP control and miR-506 downregulation (Figure 5D). Briefly, miR-506 upregulation inhibited colony formation by ∼30% (p < 0.05) compared to control and ∼25% compared to miR-506 downregulation (p = 0.07) groups. In contrast, miR-506 downregulation did not appreciably alter colony formation compared to the control group.
miR-506 deregulation did not affect tumor growth progression in vivo
As shown in Figure 5E, miR-506 deregulation did not considerably alter A549 tumor growth progression compared to the control group, as determined by their respective tumor volumes. Although, there was only a slight increase in the average tumor volume for miR-506 upregulation compared to both the control and its downregulated counterpart, there were no statistically significant differences. Figure 5F shows representative tissue samples from the respective groups.
Effects of stable dual miR-143/506 deregulation in LC cells
Lentiviral transduction induced miR-143/506 deregulation
We performed a combined deregulation of miR-143 and miR-506 in H1975 cell, followed by a similar analysis for the individual deregulations. As shown in Figures 6A,B, qPCR analysis on the sorted cells that survived the lentiviral transduction and antibiotic treatment indicated that the lentiviral transduction significantly upregulated both miR-506 and miR-143 expressions, but downregulation did not achieve a significant decrease compared to the control group, but only compared to the upregulation group. The transduction was successful for all groups, as the cells demonstrated GFP expression and antibiotic resistance. In more detail, we initially transduced the cells using lentiviruses for miR-506 up- or downregulation. Following transduction, G418 treatment for selection (850 μg/mL) for up to 14 days, and qPCR confirmation for miR-506 upregulation or downregulation in the respective cell groups, the cells were treated with lentiviruses for the upregulation or downregulation of miR-143 to the respective upregulated or downregulated miR-506 cells. Following lentiviral transduction, the cells were treated with puromycin (2.5 μg/mL), and qPCR analysis took place to detect the dual miR up- or downregulation. Subsequently, the cells were sorted and were introduced to a cyclic antibiotic treatment of puromycin followed by G418 to maintain the transductions. Cells in the miR-143/506 upregulation group demonstrated a >50-fold increase in miR-143 expression and an approximately 25-fold increase in miR-506 expression compared to the miR-control group (p < 0.001). In contrast, the cells in the miR-143/506 downregulation group did not demonstrate statistically significant differences compared to control in miR-143 expression and miR-506 expression. The presence of GFP and respective antibiotic resistance in the respective groups confirmed successful transduction. We previously reported the respective miR-deregulations and characterizations using A549 cells (Shrestha et al., 2024).
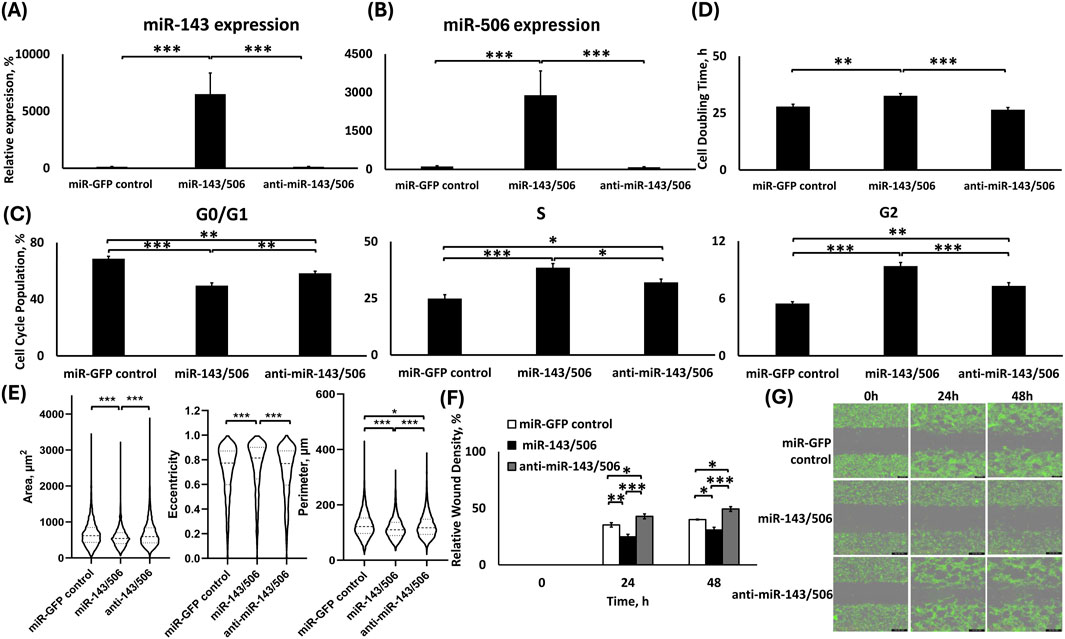
Figure 6. Analysis of H1975 stable cells transduced with lentiviral particles for dual miR-143/506 up-/downregulation. TaqMan qPCR analysis of (A) miR-143 and (B) miR-506 expression; (C) Cell cycle analysis; (D) Cell doubling time analysis; (E) Quantification of morphological parameters (area, eccentricity and perimeter) using Holomonitor® App Suite Cell Imaging Software; (F,G) Relative wound density analysis (F) Representative Green fluorescence images of wound healing assay using Incucyte® Live Cell Imaging and Analysis System (G). *: p < 0.05, **: p < 0.01, ***: p < 0.001; One-way ANOVA followed by Tukey’s post hoc analysis.
miR-143/506 dual upregulation in H1975 significantly increased S and G2 phase population, with decreased cell proliferation rate
miR-143/506 dual upregulation induced significantly increased S and G2 phase cell cycle populations compared to both control and dual downregulation group (Figure 6C). In detail, miR-143/506 upregulation most potently decreased the G0/G1 phase cell population by ∼19% and ∼9% of the total cell population compared to miR-GFP control (p < 0.001) and miR-143/506 downregulation (p < 0.01), respectively. Interestingly, miR-143/506 downregulation also caused a decreased G0/G1 cell population by ∼10% compared to the control group (p < 0.01). For S phase populations, the miR-143/506 upregulation most potently increased the cell population by 1.55-fold compared to control (p < 0.001) and by 1.2-fold compared to miR-143/506 downregulation (p < 0.05). A lower 1.29-fold increase in S-phase population took place for miR-143/506 downregulation relative to miR-control (p < 0.05). miR-143/506 dual upregulation increased the G2 cell population by 1.7-fold compared to the control group (p < 0.001), while the respective downregulations group was significantly lower compared to the upregulations group but higher than the control group, presenting a 1.3-fold increase compared to the control (p < 0.001 vs. upregulation and p < 0.01 vs. control).
We determined the cell doubling time for the dual miR-143/506 deregulated H1975 cells using Holomonitor® Live Cell Imaging System (Figure 6D). miR-143/506-upregulated group demonstrated the slowest cell proliferation rate, corresponding to its highest cell doubling time compared to both miR-GFP control and miR-143/506 downregulation. Briefly, miR-143/506 upregulation induced a 1.17-fold increase in cell doubling time compared to control (p < 0.01), and a 1.23-fold increase in doubling time relative to miR-143/506 downregulation (p < 0.001). Moreover, the miR-143/506 downregulation group demonstrated a slightly decreased cell doubling time compared to the control group, without any statistically significant differences.
Dual miR-143/506 upregulation showed significantly reduced cellular motility
We utilized the Holomonitor® Live Cell Imaging System to evaluate morphological changes in the miR-143/506 deregulated H1975 cell groups (Figure 6E). miR-143/506 upregulation decreased cellular area by ∼14% compared to the control and miR-143/506 downregulation groups (p < 0.001, for both). The miR-143/506 downregulation did not appreciably alter the cellular area compared to the control. miR-143/506 upregulation increased cellular eccentricity by ∼4% compared to control (p < 0.001) and by ∼5% compared to miR-143/506 downregulation (p < 0.001). No significant changes were observed in the cells’ eccentricity between miR-GFP control and miR-143/506 downregulation. Finally, miR-143/506 upregulation significantly decreased the cell perimeter by ∼9% (p < 0.001) compared to the control and ∼7% (p < 0.001) compared to the miR-143/506 downregulation. miR-143/506 downregulation slightly decreased the cell perimeter by ∼2% (p < 0.05) compared to the control.
Using Incucyte® Live Cell Imaging and Analysis wound healing assay, miR-143/506 upregulation demonstrated the slowest wound closure compared to both miR-GFP control and miR-143/506 downregulation (Figures 6F,G). In detail, at the 24 h time point, the miR-143/506 upregulation group cells demonstrated a ∼30% (p < 0.01) and ∼42% (p < 0.001) reduced motility compared the miR-GFP control and miR-143/506 downregulation groups, respectively. At 48 h, the miR-143/506 upregulation group demonstrated a ∼22% (p < 0.05) and ∼37% (p < 0.001) reduced motility compared to the miR-GFP control and miR-143/506 downregulation groups, respectively. Moreover, dual miR downregulation displayed a 1.21-fold (p < 0.05) and 1.23-fold (p < 0.05) increased wound gap closure relative to the control group at 24 h and 48 h, respectively.
miR-143/506 upregulation overall inhibited cell migration
For H1975 cells, miR-143/506 upregulation had the slowest cell migration. miR-control and dual miR downregulation displayed increased cell migration compared to the miR upregulation group by 2.93-fold (p < 0.001) and by 2.64-fold (p < 0.001), respectively (Figure 7A). miR-143/506 downregulation did not present any statistically significant differences compared to the control group.
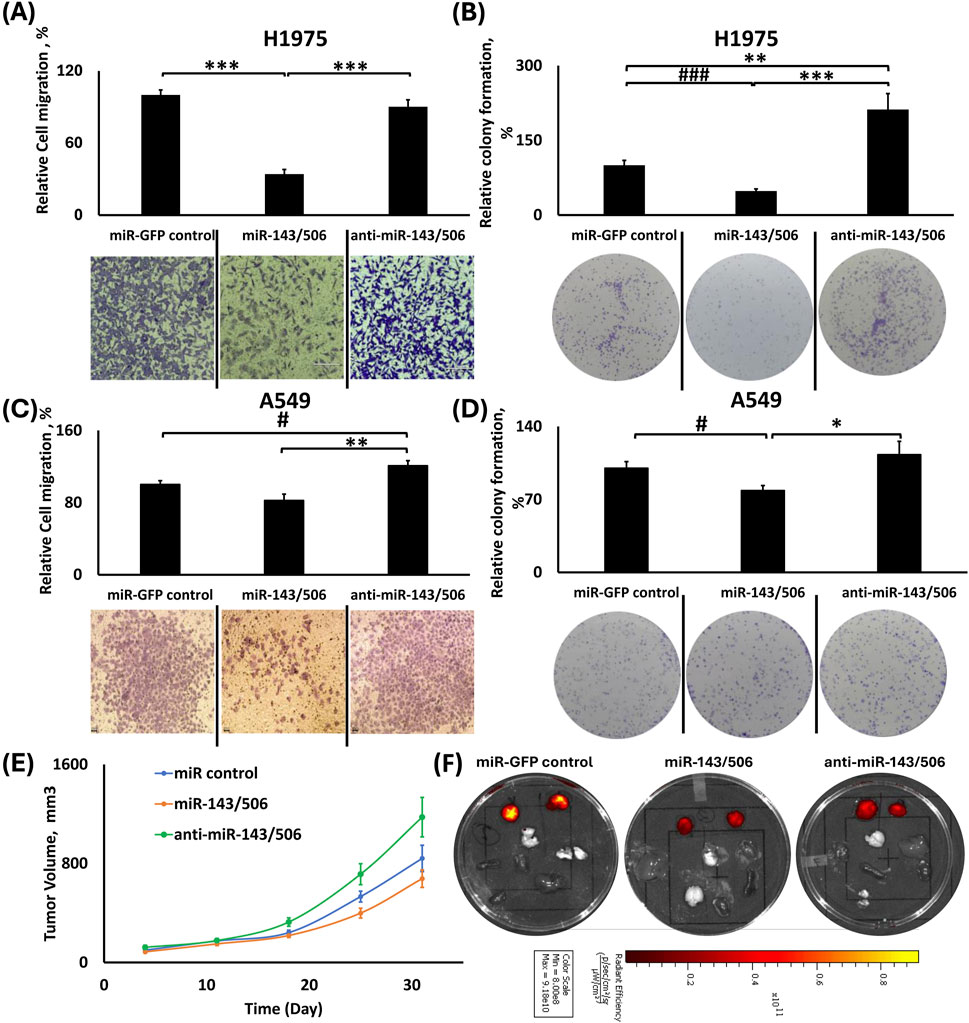
Figure 7. Effects of dual miR-143/506 up-/downregulation in migration, colony formation and tumor growth. (A,C) Relative cell migration analysis using ImageJ and representative images of transwell cell migration of H1975 (A) and A549 (C) cells; (B,D) Relative colony formation analysis using ImageJ with representative images of colony formation using H1975 (B) and A549 (D) cells; (E) Tumor volume growth graph for the subcutaneous tumors from the xenograft mouse model of the miR-143/506 deregulated A549 cells; (F) Representative IVIS™ fluorescence images of excised tumors (right and left) and vital organs (lungs, liver, heart, spleen, kidney and brain). Red color denotes the presence of fluorescence signal from tumor cells. *: p < 0.05, **: p < 0.01, ***: p < 0.001; One-way ANOVA followed by Tukey’s post hoc analysis. #:p < 0.05, ###:p < 0.001 using One-way ANOVA followed by Pairwise Analysis.
In A549 cells, there were no statistically significant differences in cell migration between the miR-GFP control and the miR-143/506 upregulation group. However, the miR-143/506 upregulation group presented ∼18% fewer migrated cells (Figure 7C) compared to the control. In contrast, the miR-143/506 downregulation had 1.2-fold and 1.46-fold more migrated cells compared to the control (Tukey’s: p = 0.07269; Pairwise: p < 0.05) and miR-143/506 upregulation (p < 0.01).
miR-143/506 upregulation overall inhibited colony formation
In H1975 cells, miR-143/506 upregulation inhibited colony formation compared to the control and its downregulated counterpart (Figure 7B). In more detail, the miR-143/506 upregulation presented ∼52% and ∼77% reduced number of colonies compared to control (Pairwise: p < 0.001) and miR-143/506 downregulation groups (p < 0.001), respectively. Moreover, there was also an increase in colony formation for dual downregulation compared to the control by 2.11-fold (p < 0.01).
Similarly, in A549 cells, miR-143/506 upregulation decreased colony formation compared to the control and dual downregulation groups. In more detail, miR-143/506 upregulation presented ∼22% (Pairwise: p < 0.05) and ∼30% (p < 0.05) fewer number of colonies compared to the control and miR-143/506 downregulation groups, respectively (Figure 7D).
Dual miR-143/506 upregulation in A549 cells inhibits tumor growth progression in nude mice
We subcutaneously injected dual miR-143/506 up- and downregulated A549 cells in the flanks of nude mice. We determined the tumor volume for all animals and observed that the miR-143/506 upregulation inhibited tumor growth progression compared to both miR-control and miR-143/506 downregulation. The maximum observed tumor growth inhibition was on day 25 following the tumor injections, where miR-143/506 upregulation inhibited tumor growth by 47% (p < 0.01) compared to the miR-143/506 downregulation (Figure 7E), and a 27% inhibition compared to control (pairwise: p < 0.05). The earliest significant inhibition was observed on day 18, which accounted for ∼35% (p < 0.01) of tumor growth inhibition between the upregulation and the downregulation groups, which continued up to the final observation day of 31, where the tumor growth inhibition due to miR-143/506 upregulation was ∼43% (p < 0.05) compared to miR-143/506 downregulation. Figure 7F shows representative tissue samples from the respective groups.
Discussion
Since their discovery in 1993, miRs have emerged as vital molecules participating in various biological processes, such as embryonic development, cell differentiation, and tissue homeostasis (Bartel, 2004; Gangaraju and Lin, 2009). The discovery of lin-4 (Lee et al., 1993) and let-7 (Reinhart et al., 2000) in the early 90s led pioneer scientists Victor Ambros and Gary Ruvkun to be awarded the 2024 Nobel Prize in Physiology or Medicine. miR research has rapidly increased, given their importance in gene regulation of various biological processes and disease conditions. These small non-coding RNAs of 19-22 nt length typically bind to the mRNA as an AGO-2-miRNA RNA-induced silencing complex (RISC) at the 3′-UTR region to inhibit mRNA translation. Not surprisingly, their application research has expanded in cancer treatment (Orellana and Kasinski, 2015; Calin et al., 2002). With lung cancer being the cause of the highest cancer-related deaths, miRs as cancer therapeutic biomolecules provide important alternatives for disease treatment.
Traditionally, miR mimics are exogenously administered via transient transfections, resembling traditional chemotherapeutics’ administration. This approach identifies effects and mechanistic responses to acute treatments in cells or animals. Alternatively, stable deregulation of miR expressions, either via their up- or downregulation, has been used to evaluate miR effects (Shrestha et al., 2024; Sun et al., 2018; Li et al., 2016a). Unfortunately, due to the apoptotic activity of certain miRs, their stable deregulation may not be comparable to the effects of acute transfections, as the surviving cells constitute a population that survived a prolonged apoptotic pressure. Thus, evaluation of these cells represents analysis of cells surviving a prolonged and continuous series of acute treatments, comparable to surviving resistant cells treated with traditional chemotherapeutics, where drug effect at this point is altered.
We previously characterized the role of two tumor-suppressing microRNAs, miR-143-3p and miR-506-3p, which are downregulated in LC. Both miRs have been reported to be downregulated in LC cells compared to normal cells by our and other groups (Hossian A. et al., 2021; Hossian et al., 2018; Guo et al., 2017; Tokumaru et al., 2020; Li et al., 2016b; Li et al., 2021). Our early work on the combination of the two miRs using transient transfection against LC cells identified that the dual miR upregulation inhibited cell cycle progression, downregulated CDK expression, and induced apoptotic activity (Hossian A. et al., 2021; Hossian et al., 2018; Hossian et al., 2019b). Subsequently, we evaluated the stable up- and down-regulations of the two miRs in A549 cells, constituting the prolonged exposure of the dual miR deregulations in LC cells, using lentiviral transduction (Shrestha et al., 2024). The combined effect of the dual miR deregulation demonstrated a miR-expression dependent effect on LC cell progression, as was detected by cell cycle analysis, cell motility, and cell doubling time, contrary to the individual miR deregulations, which they present undefined, miR-expression independent cellular responses. In summary, the combined dual miR-143/506 upregulation demonstrated a G2 cell cycle arrest, increased cell doubling time, and decreased overall cell proliferation.
Our present study expands on our previous work with A549 cells to explore the roles of the individual and combined deregulations of both miRs, using in vitro and in vivo analyses and evaluating an additional cell line, H1975. Our investigation on H1975 cells, an NSCLC cell line with EGFR/PIK3CA mutations, broadens the evaluation of the dual miR-143/506 therapy beyond KRAS and CDKN2A mutations present in the A549 cells. Moreover, changes in NSCLC cell behavior depending on the mutation types have been widely explored in several studies (Maj et al., 2021; Liang et al., 2015; Ma et al., 2020; Onodera et al., 2018; Martinez-Lira et al., 2024). Altogether, the presence of EGFR-mutation in H1975 and KRAS-mutation in A549 cells can potentially elicit varied responses to therapeutic molecules. In fact, KRAS is the most common cause of oncogenic mutation in NSCLC and is responsible for approximately 30% of the total NSCLC types (Friedlaender et al., 2020; Chevallier et al., 2021). For this reason, we utilized A549 in our previous study to establish proof-of-concept for dual miR-143/506 therapy’s anti-proliferative activities. Both KRAS and EGFR oncogenic mutation will induce respective cellular responses to miR therapy, which could explain differences in the observed behavior of A549 and H1975 to stable dual miR-143/506 upregulation. It is also worth noting that miR downregulations do not present a significant reduction in miR expressions in H1975 cell line, as compared to the A549 stable miR cell groups, despite using same viral constructs for both cell lines and the GFP expression confirming successful transduction. This could possibly be attributed to the basal expression levels for the miRs specific to the cell lines.
We evaluated the cell cycle phase populations and the cell doubling time for the H1975 cells stably deregulated for miR-143 and/or miR-506 to compare them with our previously presented work on the respective A549 stable deregulation. For H1975, individual stable miR-143 upregulation induced a significantly increased G2 cell population compared to control and miR-143 downregulation. This result coincides with our previous findings on A549 stable miR-143 upregulation as well as transient upregulation of miR-143 using mimics (Shrestha et al., 2024). Despite this, the cell doubling time for miR-143 upregulation group was lower than that of its downregulation group. miR-506 deregulation did not create a significantly different cell cycle population distribution for all phases between up- and downregulation, exhibiting a similar, miR-expression independent behavior. Interestingly, miR-506 upregulation prompted a prolonged cell doubling time compared to both the control and its downregulated counterpart. The miR-506 upregulation in A549 also increased the cell doubling time. We previously reported (Shrestha et al., 2024) that in A549 cells, the miR-506 deregulation did not demonstrate any significant changes in cell populations, except for the increased G2 population for the miR-506 downregulation. Here, for H1975, both up- and downregulation for miR-506 presented the same changes in cell cycle phase populations, which does not present an identifiable pattern for the miR in either cell line. These results indicate that our work here on H1975 cells roughly aligns with our previously published work on A549 cells.
Dual miR-143/506 upregulation in H1975 cells displayed an increased G2 cell population compared to control and respective downregulation groups, which aligned with our findings for the A549 miR-143/506 upregulation (Shrestha et al., 2024). Furthermore, the H1975 cells presented a significantly larger S population compared to the other groups, which was not observed with the A549 cells. This would indicate a two-phase arrest in H1975 cells. Interestingly, the miR-143/506 downregulation group also presented a small increase in the S and G2 cell populations, but was significantly lower to the miR-143/506 upregulation. Furthermore, in contrast to the individual deregulation, there was a correlation between cell proliferation rate as detected by cell doubling time and changes in the cell cycle populations. Briefly, the dual miR-upregulation presented a significantly increased doubling time, while the modest changes in cell cycle phase populations for the miR-143/506 downregulation did not present any significant changes in cell doubling time compared to the control group. This was similarly observed in A549 cells and was absent for the individual miR deregulation, presenting a miR-expression dependent behavior for the dual miR deregulation (Shrestha et al., 2024).
We performed a wound healing assay by utilizing Incucyte® Live Cell Imaging and Analysis System and transwell assay to evaluate the effects of the miR-deregulations on cellular motility and migration, respectively. The miR-143 upregulation in H1975 cells demonstrated the slowest closure rate compared to the respective downregulation, which was significantly higher than the other two groups. This similarly aligns with our previous findings in A549 (Shrestha et al., 2024). Interestingly, the miR-143 upregulation did not appear to significantly inhibit the wound closure compared to the control group, though it was lower than the control group, but the miR-143 downregulation significantly increased the cell motility. In contrast, miR-143 upregulation significantly inhibited cell migration compared to both the control and downregulation group, as determined by the transwell assay in H1975 cells, but the effect was not as potent in A549 cells for either deregulation, though presented a similar pattern with the H1975 cells. Our results support that the prolonged miR-143 upregulation at least maintains an inhibition in the motility of LC cells (Asghariazar et al., 2022).
However, unlike our previous observation in A549 with the miR-506 deregulations (Shrestha et al., 2024), where miR-506 upregulation relatively reduced the rate of wound area closure compared to its downregulated counterpart, both up- and downregulation of miR-506 in H1975 had significantly increased motility compared to control. However, miR-506 upregulation significantly reduced cell migration, as determined by the transwell assay, in both the A549 and H1975 cells. Interestingly, miR-506 downregulation demonstrated the opposite effect to its counterpart in H1975 cells, but similar behavior in A549 cells. These observations again indicate that for the single miR deregulations, a miR expression-independent behavior may take place within the same or across different cell lines, indicating that the single miR deregulation may be insufficient to produce a reliable and consistent result under prolonged exposure.
In contrast, a miR-expression-dependent cell motility effect was observed with the dual miR-deregulation, where a significantly diminished wound closure rate was observed for the miR-143/506 upregulation compared to the control and the respective downregulation, which presented a significantly accelerated wound closure rate in H1975 cells. Interestingly, only the accelerated wound closure for the miR-143/506 downregulation was observed with the A549 cells (Shrestha et al., 2024). Furthermore, our analysis here using the transwell migration assay extended these observations, where the miR-143/506 upregulation reduced cell migration in both H1975 and A549 cells in a similar manner, albeit more mildly in A549 cells, having significantly fewer migrating cells compared to the respective miR-143/506 downregulation. In fact, the latter, compared to the respective control groups, either presented a similar migratory behavior (in H1975) or accelerated cell migration (in A549).
We also performed a morphometric analysis to assess changes in the cellular area, perimeter, and eccentricity of H1975, using the Holomonitor® Live Cell Imaging System. No apparent changes in area and perimeter were observed for both miR-143 deregulation groups. There was a modestly altered eccentricity for miR-143, miR-506 and miR-143/506 up- and downregulation groups. In contrast, both miR-506 and miR-143/506 upregulations significantly reduced cell area and perimeter compared to the control and their respective downregulations. These results are in mild contrast compared to the A549 cells, where the individual miR deregulations did not present an identifiable pattern dependent on miR-levels (Shrestha et al., 2024). In fact, in H1975 cells, the miR-506 groups present a miR-expression dependent effect on area and perimeter, similar to the miR-143/506 groups.
The colony formation capacity of both A549 and H1975 was compromised by the stable miR-143 or miR-506 upregulation, which was also observed when the two miRs were combined. In contrast, miR-143 or miR-506 downregulation was similar to control groups overall, with the exception of A549 cells, where miR-143 downregulation decreased colony formation and miR-506 downregulation increased the colony formation in H1975. There appears to be a cell line-dependent effect for the individual miRs in colony formation, where A549 cells did not present significant differences in colony formation for the up-vs. downregulation groups, while present in H1975 cells. In contrast, the miR-143/506 dual deregulation exhibited a well-defined, miR-expression dependent effect, with miR-143/506 upregulation decreasing the colony formation when compared to control or the respective downregulation, while miR-143/506 downregulation promoting an increase in colony formation in both cell lines compared to control or the respective miR dual upregulation. Thus, the dual upregulation presented a consistent significant difference between up-vs. downregulations for both cell lines.
Finally, we evaluated the tumor growth of the A549 miR-143/506 deregulated cells in vivo using a subcutaneous xenograft mouse model. Subcutaneous injection of A549 cells with miR-143/506 upregulation consistently resulted in significantly slower tumor growth compared to the control and miR-143/506 downregulation groups, achieving a maximum inhibition of 47% compared to the respective downregulation group. These findings corroborate our observations from the in vitro results and underscore the potential therapeutic efficacy of dual miR upregulation in vivo, especially considering the contrasting individual miR deregulation groups. Briefly, miR-143 upregulation showed a consistently reduced tumor growth throughout the observation period, but did not achieve as strong tumor growth inhibition as the miR combination compared to the respective downregulation group. In addition to that, the miR-143 downregulation did not indicate a tumor growth acceleration. Furthermore, the miR-506 up- and downregulation demonstrated no significant differences in tumor growth, which also raises the question of the applicability of individual miR deregulation for prolonged treatments. The A549 cells are regarded as a representative cell line for the LC disease, frequently studied in vitro and in vivo. Nonetheless, future in vivo experiments with other NSCLC cell lines, such as H1975 cells with stable miR-143 and miR-506, will supplement and/or support our findings in this study.
Furthermore, the miR-143/506 downregulation showed an appreciable acceleration in tumor growth compared to the baseline tumor volume shown by the control group, underlining the importance of the downregulation of the two miRs in cancer. Therefore, the opposite effects of tumor growth progression demonstrated by the dual miR-up- and downregulation further substantiates our conclusion that the dual miR-143/506 deregulation produces a consistent miR-expression dependent effect under prolonged treatment conditions that the individual miRs may not achieve. Our continuing work so far on the combinatorial miR-143/506 deregulation expandingly supports the potential of the upregulation of these miRs for LC treatment. Although it would be premature to analyze clinical perspective at this point, based on the in vitro and in vivo data, optimization of dual miR-143/506 upregulation efficiency in lung cancer could be considered as an adjunct therapeutic approach in the clinical setting. Of note, we utilized the IVIS™ imaging system to visualize the presence of tumor cells metastasizing to vital organs. We did not observe any metastasis in all samples from all groups. Nonetheless, further histopathological analysis of these tissues, alternative animal models or more extended evaluation periods may be necessary to exclude such eventuality conclusively.
Conclusion
A combined stable miR-deregulation approach for cancer cell therapeutics is a largely unexplored scientific field with substantial potential in tackling cancer progression. Combining two or more miRs to increase therapeutic response is still not extensively evaluated (Kasinski et al., 2015; Devulapally et al., 2015; Tang et al., 2021; Fattore et al., 2023; Xue et al., 2014; Nishimura et al., 2013; Remant Bahadur et al., 2017; Yu et al., 2018; Gibori et al., 2018; Liu et al., 2017; Ball et al., 2018; Wang et al., 2020). Our work on the combined prolonged deregulation of miR-143/506 in NSCLC cells presents a promising miR application in cancer therapeutics. The combinatorial miR-143/506 upregulation has produced advantageous behavior against tumor progression in a panel of cell lines, either via acute treatment or under a prolonged upregulation. Furthermore, the combinatorial miR-143/506 upregulation demonstrated a consistent, miR-expression-dependent advantageous response that the individual miRs alone struggled to produce, which merits further evaluation.
Data availability statement
The original contributions presented in the study are included in the article/Supplementary Material, further inquiries can be directed to the corresponding author.
Ethics statement
The animal study was approved by Institutional Animal Care and Use Committee (IACUC) of the College of Pharmacy at the University of Louisiana at Monroe. The study was conducted in accordance with the local legislation and institutional requirements.
Author contributions
AS: Conceptualization, Data curation, Formal Analysis, Investigation, Methodology, Project administration, Software, Validation, Visualization, Writing – original draft, Writing – review and editing. MH: Data curation, Investigation, Methodology, Software, Writing – original draft, Writing – review and editing. PS: Data curation, Investigation, Software, Writing – review and editing. ML: Data curation, Investigation, Software, Writing – review and editing. SJ: Investigation, Software, Writing – review and editing. CM: Data curation, Investigation, Software, Writing – original draft, Writing – review and editing. GM: Conceptualization, Data curation, Formal Analysis, Funding acquisition, Investigation, Methodology, Project administration, Resources, Supervision, Visualization, Writing – original draft, Writing – review and editing.
Funding
The author(s) declare that financial support was received for the research and/or publication of this article. This research was funded by the College of Pharmacy, University of Louisiana at Monroe start-up funding and National Institutes of Health (NIH) through the National Institute of General Medical Science Grants P20 GM103424-21.
Conflict of interest
The authors declare that the research was conducted in the absence of any commercial or financial relationships that could be construed as a potential conflict of interest.
The author(s) declared that they were an editorial board member of Frontiers, at the time of submission. This had no impact on the peer review process and the final decision.
Generative AI statement
The authors declare that no Generative AI was used in the creation of this manuscript.
Publisher’s note
All claims expressed in this article are solely those of the authors and do not necessarily represent those of their affiliated organizations, or those of the publisher, the editors and the reviewers. Any product that may be evaluated in this article, or claim that may be made by its manufacturer, is not guaranteed or endorsed by the publisher.
Supplementary material
The Supplementary Material for this article can be found online at: https://www.frontiersin.org/articles/10.3389/fddsv.2025.1584801/full#supplementary-material
References
Asghariazar, V., Mansoori, B., Kadkhodayi, M., Safarzadeh, E., Mohammadi, A., Baradaran, B., et al. (2022). MicroRNA-143 act as a tumor suppressor microRNA in human lung cancer cells by inhibiting cell proliferation, invasion, and migration. Mol. Biol. Rep. 49 (8), 7637–7647. doi:10.1007/s11033-022-07580-1
Ball, R. L., Hajj, K. A., Vizelman, J., Bajaj, P., and Whitehead, K. A. (2018). Lipid nanoparticle formulations for enhanced Co-delivery of siRNA and mRNA. Nano Lett. 18 (6), 3814–3822. doi:10.1021/acs.nanolett.8b01101
Bartel, D. P. (2004). MicroRNAs: genomics, biogenesis, mechanism, and function. Cell 116 (2), 281–297. doi:10.1016/s0092-8674(04)00045-5
Calin, G. A., Dumitru, C. D., Shimizu, M., Bichi, R., Zupo, S., Noch, E., et al. (2002). Frequent deletions and down-regulation of micro- RNA genes miR15 and miR16 at 13q14 in chronic lymphocytic leukemia. Proc. Natl. Acad. Sci. U. S. A. 99 (24), 15524–15529. doi:10.1073/pnas.242606799
Chevallier, M., Borgeaud, M., Addeo, A., and Friedlaender, A. (2021). Oncogenic driver mutations in non-small cell lung cancer: past, present and future. World J. Clin. Oncol. 12 (4), 217–237. doi:10.5306/wjco.v12.i4.217
Devulapally, R., Sekar, N. M., Sekar, T. V., Foygel, K., Massoud, T. F., Willmann, J. K., et al. (2015). Polymer nanoparticles mediated codelivery of antimiR-10b and antimiR-21 for achieving triple negative breast cancer therapy. ACS Nano 9 (3), 2290–2302. doi:10.1021/nn507465d
Fattore, L., Cafaro, G., Di Martile, M., Campani, V., Sacconi, A., Liguoro, D., et al. (2023). Oncosuppressive miRNAs loaded in lipid nanoparticles potentiate targeted therapies in BRAF-mutant melanoma by inhibiting core escape pathways of resistance. Oncogene 42 (4), 293–307. doi:10.1038/s41388-022-02547-9
Friedlaender, A., Drilon, A., Weiss, G. J., Banna, G. L., and Addeo, A. (2020). KRAS as a druggable target in NSCLC: rising like a phoenix after decades of development failures. Cancer Treat. Rev. 85, 101978. doi:10.1016/j.ctrv.2020.101978
Gangaraju, V. K., and Lin, H. (2009). MicroRNAs: key regulators of stem cells. Nat. Rev. Mol. Cell Biol. 10 (2), 116–125. doi:10.1038/nrm2621
Ganti, A. K., Klein, A. B., Cotarla, I., Seal, B., and Chou, E. (2021). Update of incidence, prevalence, survival, and initial treatment in patients with non-small cell lung cancer in the US. JAMA Oncol. 7 (12), 1824–1832. doi:10.1001/jamaoncol.2021.4932
Gibori, H., Eliyahu, S., Krivitsky, A., Ben-Shushan, D., Epshtein, Y., Tiram, G., et al. (2018). Amphiphilic nanocarrier-induced modulation of PLK1 and miR-34a leads to improved therapeutic response in pancreatic cancer. Nat. Commun. 9 (1), 16. doi:10.1038/s41467-017-02283-9
Guo, S., Yang, P., Jiang, X., Li, X., Wang, Y., Zhang, X., et al. (2017). Genetic and epigenetic silencing of mircoRNA-506-3p enhances COTL1 oncogene expression to foster non-small lung cancer progression. Oncotarget 8 (1), 644–657. doi:10.18632/oncotarget.13501
Hashimoto, Y., Akiyama, Y., and Yuasa, Y. (2013). Multiple-to-multiple relationships between microRNAs and target genes in gastric cancer. PLoS One 8 (5), e62589. doi:10.1371/journal.pone.0062589
Hossian, A. K. M. N., Sajib, M. S., Tullar, P. E., Mikelis, C. M., and Mattheolabakis, G. (2018). Multipronged activity of combinatorial miR-143 and miR-506 inhibits Lung Cancer cell cycle progression and angiogenesis in vitro. Sci. Rep. 8 (1), 10495. doi:10.1038/s41598-018-28872-2
Hossian, A., Mackenzie, G. G., and Mattheolabakis, G. (2019a). miRNAs in gastrointestinal diseases: can we effectively deliver RNA-based therapeutics orally? Nanomedicine (Lond). 14 (21), 2873–2889. doi:10.2217/nnm-2019-0180
Hossian, A. K. M. N., Muthumula, C. M. R., Sajib, M. S., Tullar, P. E., Stelly, A. M., Briski, K. P., et al. (2019b). Analysis of combinatorial miRNA treatments to regulate cell cycle and angiogenesis. J. Vis. Exp. JoVE 145. doi:10.3791/59460
Hossian, A., Mackenzie, G. G., and Mattheolabakis, G. (2021a). Combination of miR-143 and miR-506 reduces lung and pancreatic cancer cell growth through the downregulation of cyclin-dependent kinases. Oncol. Rep. 45 (4), 2. doi:10.3892/or.2021.7953
Hossian, A. K. M. N., Zahra, F. T., Poudel, S., Abshire, C. F., Polk, P., Garai, J., et al. (2021b). Advanced bioinformatic analysis and pathway prediction of NSCLC cells upon cisplatin resistance. Sci. Rep. 11 (1), 6520. doi:10.1038/s41598-021-85930-y
Kasinski, A. L., Kelnar, K., Stahlhut, C., Orellana, E., Zhao, J., Shimer, E., et al. (2015). A combinatorial microRNA therapeutics approach to suppressing non-small cell lung cancer. Oncogene 34 (27), 3547–3555. doi:10.1038/onc.2014.282
Lee, R. C., Feinbaum, R. L., and Ambros, V. (1993). The C. elegans heterochronic gene lin-4 encodes small RNAs with antisense complementarity to lin-14. Cell 75 (5), 843–854. doi:10.1016/0092-8674(93)90529-y
Li, J., Ju, J., Ni, B., and Wang, H. (2016b). The emerging role of miR-506 in cancer. Oncotarget 7 (38), 62778–62788. doi:10.18632/oncotarget.11294
Li, J., Wu, H., Li, W., Yin, L., Guo, S., Xu, X., et al. (2016a). Downregulated miR-506 expression facilitates pancreatic cancer progression and chemoresistance via SPHK1/Akt/NF-κB signaling. Oncogene 35 (42), 5501–5514. doi:10.1038/onc.2016.90
Li, Z. H., Zhou, J. H., Chen, S. N., Pan, L., Feng, Y., Luo, M. Q., et al. (2021). MicroRNA-506 has a suppressive effect on the tumorigenesis of nonsmall-cell lung cancer by regulating tubby-like protein 3. Bioengineered 12 (2), 10176–10186. doi:10.1080/21655979.2021.2001216
Liang, H., Liu, M., Yan, X., Zhou, Y., Wang, W., Wang, X., et al. (2015). miR-193a-3p functions as a tumor suppressor in lung cancer by down-regulating ERBB4. J. Biol. Chem. 290 (2), 926–940. doi:10.1074/jbc.M114.621409
Liu, C., Liang, Z., and Kong, X. (2017). Efficacy analysis of combinatorial siRNAs against HIV derived from one double hairpin RNA precursor. Front. Microbiol. 8, 1651. doi:10.3389/fmicb.2017.01651
Ma, S., Wang, X., Zhang, Z., and Liu, D. (2020). Actin-like protein 8 promotes cell proliferation, colony-formation, proangiogenesis, migration and invasion in lung adenocarcinoma cells. Thorac. Cancer 11 (3), 526–536. doi:10.1111/1759-7714.13247
Macfarlane, L. A., and Murphy, P. R. (2010). MicroRNA: biogenesis, function and role in cancer. Curr. Genomics. 11 (7), 537–561. doi:10.2174/138920210793175895
Maj, E., Maj, B., Bobak, K., Gos, M., Chodynski, M., Kutner, A., et al. (2021). Differential response of lung cancer cells, with various driver mutations, to plant polyphenol resveratrol and vitamin D active metabolite PRI-2191. Int. J. Mol. Sci. 22 (5), 2354. doi:10.3390/ijms22052354
Martinez-Lira, J. L., Hernandez-Gallegos, E., Guadalupe, M. D. E., Villalobos-Valencia, R., and Camacho, J. (2024). The effects of nebivolol-gefitinib-loratadine against lung cancer cell lines. Vivo 38 (6), 2688–2695. doi:10.21873/invivo.13746
Nishimura, M., Jung, E. J., Shah, M. Y., Lu, C., Spizzo, R., Shimizu, M., et al. (2013). Therapeutic synergy between microRNA and siRNA in ovarian cancer treatment. Cancer Discov. 3 (11), 1302–1315. doi:10.1158/2159-8290.CD-13-0159
Onodera, K., Sakurada, A., Notsuda, H., Watanabe, T., Matsuda, Y., Noda, M., et al. (2018). Growth inhibition of KRAS- and EGFR-mutant lung adenocarcinoma by cosuppression of STAT3 and the SRC/ARHGAP35 axis. Oncol. Rep. 40 (3), 1761–1768. doi:10.3892/or.2018.6536
Orellana, E. A., and Kasinski, A. L. (2015). MicroRNAs in cancer: a historical perspective on the path from discovery to therapy. Cancers 7 (3), 1388–1405. doi:10.3390/cancers7030842
Reinhart, B. J., Slack, F. J., Basson, M., Pasquinelli, A. E., Bettinger, J. C., Rougvie, A. E., et al. (2000). The 21-nucleotide let-7 RNA regulates developmental timing in Caenorhabditis elegans. Nature 403 (6772), 901–906. doi:10.1038/35002607
Remant Bahadur, K. C., Thapa, B., Valencia-Serna, J., Aliabadi, H. M., and Uludağ, H. (2017). Nucleic acid combinations: a new frontier for cancer treatment. J. Control. Release 256, 153–169. doi:10.1016/j.jconrel.2017.04.029
Shrestha, A., Lahooti, B., Hossian, A., Madadi, M., Mikelis, C. M., and Mattheolabakis, G. (2024). Stable dual miR-143 and miR-506 upregulation inhibits proliferation and cell cycle progression. Int. J. Mol. Sci. 25 (8), 4432. doi:10.3390/ijms25084432
Siegel, R. L., Giaquinto, A. N., and Jemal, A. (2024). Cancer statistics, 2024. CA Cancer J. Clin. 74 (1), 12–49. doi:10.3322/caac.21820
Sun, X., Dai, G., Yu, L., Hu, Q., Chen, J., and Guo, W. (2018). miR-143-3p inhibits the proliferation, migration and invasion in osteosarcoma by targeting FOSL2. Sci. Rep. 8 (1), 606. doi:10.1038/s41598-017-18739-3
Sun, Y., Huang, L., Mackenzie, G. G., and Rigas, B. (2011). Oxidative stress mediates through apoptosis the anticancer effect of phospho-nonsteroidal anti-inflammatory drugs: implications for the role of oxidative stress in the action of anticancer agents. J. Pharmacol. Exp. Ther. 338 (3), 775–783. doi:10.1124/jpet.111.183533
Svoronos, A. A., Engelman, D. M., and Slack, F. J. (2016). OncomiR or tumor suppressor? The duplicity of MicroRNAs in cancer. Cancer Res. 76 (13), 3666–3670. doi:10.1158/0008-5472.CAN-16-0359
Tang, J., Pan, H., Wang, W., Qi, C., Gu, C., Shang, A., et al. (2021). MiR-495-3p and miR-143-3p co-target CDK1 to inhibit the development of cervical cancer. Clin. Transl. Oncol. 23 (11), 2323–2334. doi:10.1007/s12094-021-02687-6
Tokumaru, Y., Takabe, K., Yoshida, K., and Akao, Y. (2020). Effects of MIR143 on rat sarcoma signaling networks in solid tumors: a brief overview. Cancer Sci. 111 (4), 1076–1083. doi:10.1111/cas.14357
Wang, Y., Xie, Y., Kilchrist, K. V., Li, J., Duvall, C. L., and Oupický, D. (2020). Endosomolytic and tumor-penetrating mesoporous silica nanoparticles for siRNA/miRNA combination cancer therapy. ACS Appl. Mater. Interfaces 12 (4), 4308–4322. doi:10.1021/acsami.9b21214
Xue, W., Dahlman, J. E., Tammela, T., Khan, O. F., Sood, S., Dave, A., et al. (2014). Small RNA combination therapy for lung cancer. Proc. Natl. Acad. Sci. 111 (34), E3553–E3561. doi:10.1073/pnas.1412686111
Yu, R., Chen, C., Cao, W., Liu, H., Zhou, S., Song, Y., et al. (2018). High-degree and broad-spectrum resistance mediated by a combination of NIb siRNA and miRNA suppresses replication of necrotic and common strains of potato virus Y. Archives Virology 163 (11), 3073–3081. doi:10.1007/s00705-018-3969-5
Keywords: microRNA, lung cancer, lentiviral delivery, microRNA-143, microRNA-506, dual microRNA therapy
Citation: Shrestha A, Haque MA, Shrestha P, Lamprou M, Jois SD, Mikelis CM and Mattheolabakis G (2025) Dual upregulation of miRNA-143 and miRNA-506 in non-small cell lung cancer inhibits proliferation, motility, migration, and tumor growth. Front. Drug Discov. 5:1584801. doi: 10.3389/fddsv.2025.1584801
Received: 27 February 2025; Accepted: 16 May 2025;
Published: 06 June 2025.
Edited by:
Hoang V. Le, National Institute on Drug Abuse (NIH), United StatesReviewed by:
Luyen Vu, Cornell University, United StatesNikhil Samarth, National Centre for Cell Science, India
Loganathan Rangasamy, VIT University, India
Copyright © 2025 Shrestha, Haque, Shrestha, Lamprou, Jois, Mikelis and Mattheolabakis. This is an open-access article distributed under the terms of the Creative Commons Attribution License (CC BY). The use, distribution or reproduction in other forums is permitted, provided the original author(s) and the copyright owner(s) are credited and that the original publication in this journal is cited, in accordance with accepted academic practice. No use, distribution or reproduction is permitted which does not comply with these terms.
*Correspondence: George Mattheolabakis, bWF0dGhhaW9sYW1wYWtpc0B1bG0uZWR1