 Elham Jamshidi1†
 Amirhossein Asgary2†Nader Tavakoli3†Alireza Zali1Soroush Setareh2
 Hadi Esmaily4Seyed Hamid Jamaldini5
 Amir Daaee6
 Amirhesam Babajani7Mohammad Ali Sendani Kashi8
 Masoud Jamshidi9Sahand Jamal Rahi10*
 Nahal Mansouri11,12*
- 1Functional Neurosurgery Research Center, Shohada Tajrish Comprehensive Neurosurgical Center of Excellence, Shahid Beheshti University of Medical Sciences, Tehran, Iran
- 2Department of Biotechnology, College of Sciences, University of Tehran, Tehran, Iran
- 3Trauma and Injury Research Center, Iran University of Medical Sciences, Tehran, Iran
- 4Department of Clinical Pharmacy, School of Pharmacy, Shahid Beheshti University of Medical Sciences, Tehran, Iran
- 5Department of Genetic, Faculty of Advanced Science and Technology, Tehran Medical Sciences, Islamic Azad University, Tehran, Iran
- 6School of Mechanical Engineering, Sharif University of Technology, Tehran, Iran
- 7Department of Pharmacology, School of Medicine, Shahid Beheshti University of Medical Sciences, Tehran, Iran
- 8Master of Business Administration (MBA)-University of Tehran, Tehran, Iran
- 9Department of Exercise Physiology, Tehran University, Tehran, Iran
- 10Swiss Institute for Experimental Cancer Research (ISREC), School of Life Sciences, École Polytechnique Fédérale de Lausanne (EPFL), Lausanne, Switzerland
- 11Division of Pulmonary Medicine, Department of Medicine, Lausanne University Hospital (CHUV), University of Lausanne (UNIL), Lausanne, Switzerland
- 12Laboratory of the Physics of Biological Systems, Institute of Physics, École Polytechnique Fédérale de Lausanne (EPFL), Lausanne, Switzerland
Rationale: Given the expanding number of COVID-19 cases and the potential for new waves of infection, there is an urgent need for early prediction of the severity of the disease in intensive care unit (ICU) patients to optimize treatment strategies.
Objectives: Early prediction of mortality using machine learning based on typical laboratory results and clinical data registered on the day of ICU admission.
Methods: We retrospectively studied 797 patients diagnosed with COVID-19 in Iran and the United Kingdom (U.K.). To find parameters with the highest predictive values, Kolmogorov-Smirnov and Pearson chi-squared tests were used. Several machine learning algorithms, including Random Forest (RF), logistic regression, gradient boosting classifier, support vector machine classifier, and artificial neural network algorithms were utilized to build classification models. The impact of each marker on the RF model predictions was studied by implementing the local interpretable model-agnostic explanation technique (LIME-SP).
Results: Among 66 documented parameters, 15 factors with the highest predictive values were identified as follows: gender, age, blood urea nitrogen (BUN), creatinine, international normalized ratio (INR), albumin, mean corpuscular volume (MCV), white blood cell count, segmented neutrophil count, lymphocyte count, red cell distribution width (RDW), and mean cell hemoglobin (MCH) along with a history of neurological, cardiovascular, and respiratory disorders. Our RF model can predict patient outcomes with a sensitivity of 70% and a specificity of 75%. The performance of the models was confirmed by blindly testing the models in an external dataset.
Conclusions: Using two independent patient datasets, we designed a machine-learning-based model that could predict the risk of mortality from severe COVID-19 with high accuracy. The most decisive variables in our model were increased levels of BUN, lowered albumin levels, increased creatinine, INR, and RDW, along with gender and age. Considering the importance of early triage decisions, this model can be a useful tool in COVID-19 ICU decision-making.
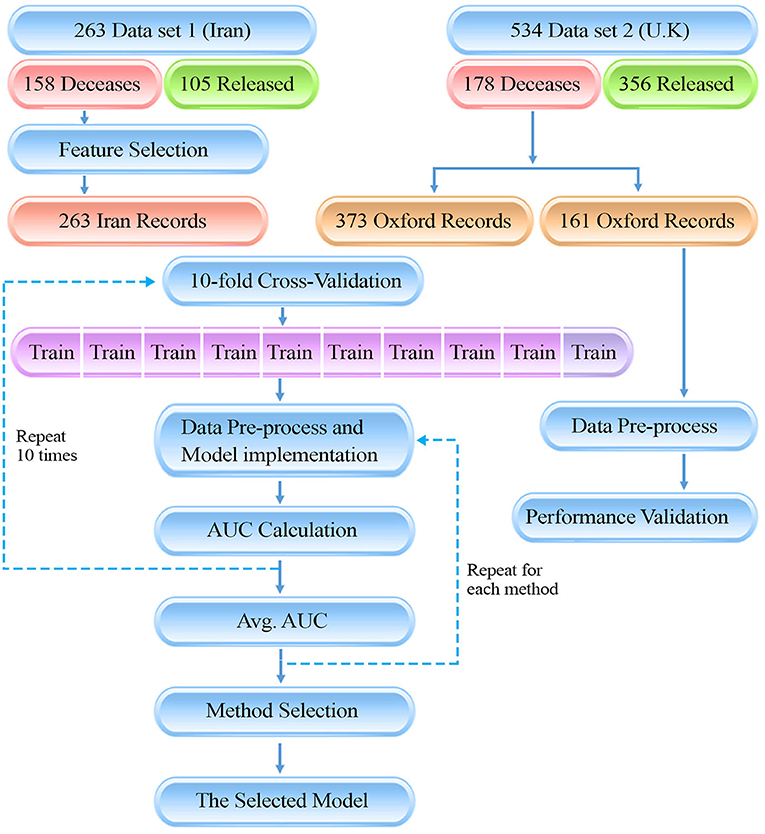
Graphical Abstract. The presenting diagram, is showing the flow of our data gathering and method for the study. There are two data sources which ultimately have been used in a 10-fold cross-validation method to train the machine learning models. Finally, the model with the highest AUC was selected as final model.
Introduction
As of September 6, 2021, COVID-19 has caused more than 219 million infections worldwide and resulted in more than 4.55 million deaths. Complications are more common among elderly patients and people with preexisting conditions, and the rate of intensive care unit (ICU) admission is substantially higher in these groups (1, 2).
ICU admissions rely on the critical care capacity of the health care system. Iran, which is the primary testbed for this study, was one of the first countries hit by COVID-19. The ICU admission rate involves about 32% of all hospitalizations, and the ICU mortality rate is about 39% (3). With the potential of new waves of COVID-19 infections driven by more transmissible variants, ICU hospitalization numbers are expected to rise, leading to shortages of ICU beds and critical management equipment. There is also the risk of a global shortage of effective medical supplies, making the judicious use of these medications a top priority for healthcare systems.
An individual-based prediction model is essential for tailoring treatment strategies and would aid in expanding our insights into the pathogenesis of COVID-19. A number of risk assessment scores are available to predict the severity of different diseases in ICU patients (4). Predictors of the need for intensive respiratory or vasopressor support in patients with COVID-19 and of mortality in COVID-19 patients with pneumonia have been identified (5, 6). To date, no general mortality prediction scores have been available for ICU admitted COVID-19 patients, irrespective of the patients' clinical presentation. Additionally, existing risk scales rely on parameters measured by health care providers such as blood pressure, respiratory rate, and oxygen saturation, which are subject to human error and operator bias especially under challenging and stressful conditions when numbers of COVID-19 patients surge (7). Thus, it remains vital to develop more unbiased risk-assessment tools that can predict the most likely outcomes for individual patients with COVID-19.
Recent advances in artificial intelligence (AI) technology for disease screening show promise as computer-aided diagnosis and prediction tools (8–11). In the era of COVID-19, AI has played an important role in early diagnosis of infection, contact tracing, and drug and vaccine development (12). Thus, AI represents a useful technology for the management of COVID-19 patients with the potential to help control the mortality rate of this disease. Nevertheless, an AI tool for making standardized and accurate predictions of outcomes in COVID-19 patients with severe disease is currently missing.
Beyond the general benefits of data-driven decision-making, the pandemic has also exposed the need for computational assistance to health care providers, who under the pressure of severely ill patients may make mistakes in judgment (7, 13, 14). Stressful conditions and burnout in health care providers can reduce their clinical performance, and a lack of accurate judgment can lead to increased mortality rates (15, 16). Artificial intelligence can help healthcare professionals determine who needs a critical level of care more precisely. Indeed, the effective use of AI could mitigate the severity of this outbreak.
Here, we propose a personalized machine-learning (ML) method for predicting mortality in COVID-19 patients based on routinely available laboratory and clinical data on the day of ICU admission.
Methods
Data Resources
This is an international study involving patients from Iran (dataset 1) and the United Kingdom (U.K., dataset 2). We retrospectively studied 797 adult patients with severe COVID-19 infection confirmed through reverse transcription-polymerase chain reaction (RT-PCR). Two hundred sixty-three patients were admitted to ICUs at different hospitals in Tehran, Iran between February 19 and May 1, 2020, and 534 patients were admitted to ICUs and Emergency Assessment Units based on the Oxfordshire Research Database. The study was performed after approval by the Iran University of Medical Sciences Ethics Committee (approval ID: IR.IUMS.REC.1399.595).
Development of Mortality Prediction Model Using
The Mortality prediction model was aimed to predict whether patients were deceased or got released at the end of the admission period. Due to the generalizability and accessibility of the predictors recorded for patients in dataset 1 (Iran), and to reduce the model's feature space dimensionality, we merely used this dataset (consisting of 263 patients) for feature selection and model development. Only parameters with the highest predictive values were used in the modeling, leading to more robustness and generalizability of the model (17). Aside from that, further ML comparisons and validation was done with both the dataset 1 and 2.
Statistical Analysis and Feature Selection
On the day of the ICU admission, 66 parameters were assessed for each patient including 11 demographic characteristics (e.g., age and gender), past medical history and comorbidities (including nine different preexisting conditions), and 55 laboratory biomarkers. These parameters are listed in Table 1. Sixty-nine percent of measurements were reported on the day of admission, 27% were reported 1 day after, and 4% were reported within 2 days of ICU admission because of sampling limitations and laboratory practice. We excluded patients whose laboratory data were obtained more than 2 days after the date of admission to the ICU.
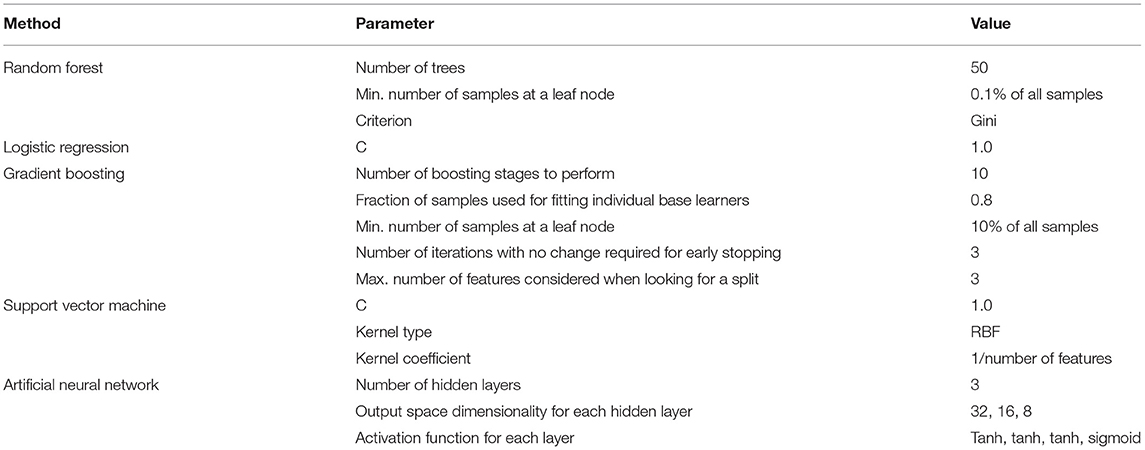
Table 1. Machine learning methods with their parameters.
The aim was to predict a patient's survival. For the selection of parameters with the highest predictive value, under the null hypothesis of distributions being the same between the two groups, the two-sample Kolmogorov-Smirnov test (KS), shown in Supplementary Figure 1, was used for numerical parameters (age and laboratory biomarkers), and the Pearson chi-squared test (χ2), shown in Supplementary Figure 2, was used for categorical parameters (e.g., gender and comorbidities).
All selected predictors were available in the second dataset (Oxfordshire, U.K.). Henceforth, the datasets have been merged, solely possessing previously selected predictors in common.
To investigate multicollinearity, Variance Inflation Factor (VIF) was calculated for each predictor and reported in Supplementary Table 1. A cut-off of 10 has been used to omit predictors that are showing collinearity, which includes none of the included predictors.
Data Preprocessing
Due to the difference in the measurement units and the necessity of units to be uniform, measurements of numerical parameters were unified between the two data sets by applying appropriate conversion factors, resulting in admissible input parameters for the model.
Data processing was carried out in four steps: First, because of incomplete laboratory data and in order to reduce difficulties associated with missing values, 771 patients out of the 797 total patients were selected as they had the data of at least 70 percent of all the biomarkers. Patients that did not have enough data present for biomarkers were removed. Second, samples were randomly separated into 10 independent sets with stratification over outcomes for 10-fold cross-validation to ensure the generalizability of the models (18). Of the 10 subsets, a single subset was retained as a validation set for model testing and the remaining nine subsets were used as training data. The cross-validation process was then iterated 10 times with each of the 10 subsets being used as the validation data exactly once. Third, numerical parameters were standardized by scaling the features to mean zero and unit variance. Last, missing biomarker values were imputed using the k-nearest neighbor (k-NN) algorithm, and a binary indicator of missingness for each biomarker was added to the dataset (17, 19). Standardization and imputation were performed separately on each cross-validation iteration by using training set samples.
Machine Learning Model
Random forest (RF), logistic regression (LR), gradient boosting (GB), support vector machine (SVM), and artificial neural network (NN) methods were used to build classification models using the Python scikit-learn package. Methods along with their parameters are listed in Table 1. The performance of each method on training and validation sets in each cross-validation iteration was compared using a receiver operating characteristic curve (ROC), which is shown in Supplementary Figure 3. Area Under the Curve of ROC for each method is represented in Figure 1. Additional evaluation metrics for each model are also reported in Supplementary Table 2. To prevent overfitting in the training process, the LR model was trained with an L2 regularization factor equal to one, and the RF was forced to hold more than 10% of samples in each of its terminal leaves (20, 21). The statistically significant difference between models' AUC curves has been affirmed by DeLong's test and corresponding DeLong's p-values assure the RF model's superiority and are shown in Supplementary Figure 4. To find the most influential parameters in the LR model prediction, we used regression coefficients, which are shown in the Supplementary Figure 5. Using the local interpretable model-agnostic explanation submodular-pick (LIME-SP) method, we identified different patterns among the whole feature space in the RF model (22). The LIME-SP method can interpret the model's predictions in different parts of the feature space by modeling a subset of model predictions in the feature space around the sample with the help of linear models that are more interpretable. In our study, LIME-SP was performed on 100 random samples to find six submodules with the most disparity in their selected markers, as shown in Figure 2. To identify meaningful clinical differences between patients, seven parameters with the highest predictive values were derived from each submodule.
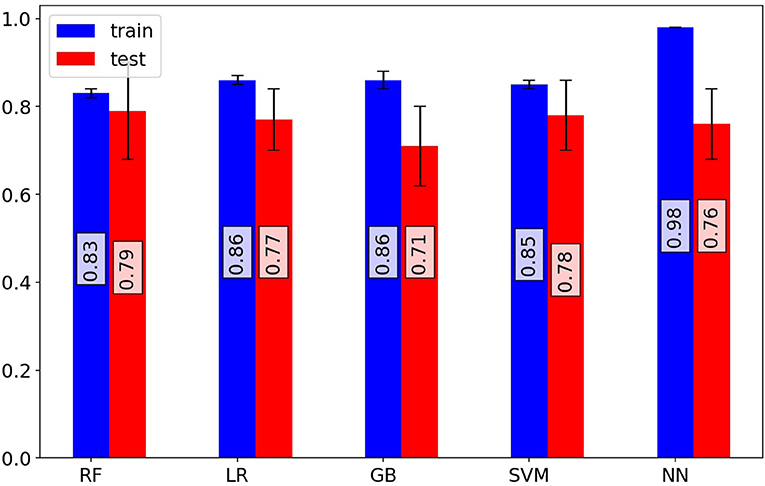
Figure 1. Investigation of model performance. Mean area under the receiver operating characteristic curve (ROC-AUC) of random forest, logistic regression, gradient boosting classifier, support vector machine classifier, and artificial neural network models for training and test sets of cross-validation iterations. The random forest model shows superior performance on validation sets. The random forest model predicts patient outcomes with a 70% sensitivity and 75% specificity.
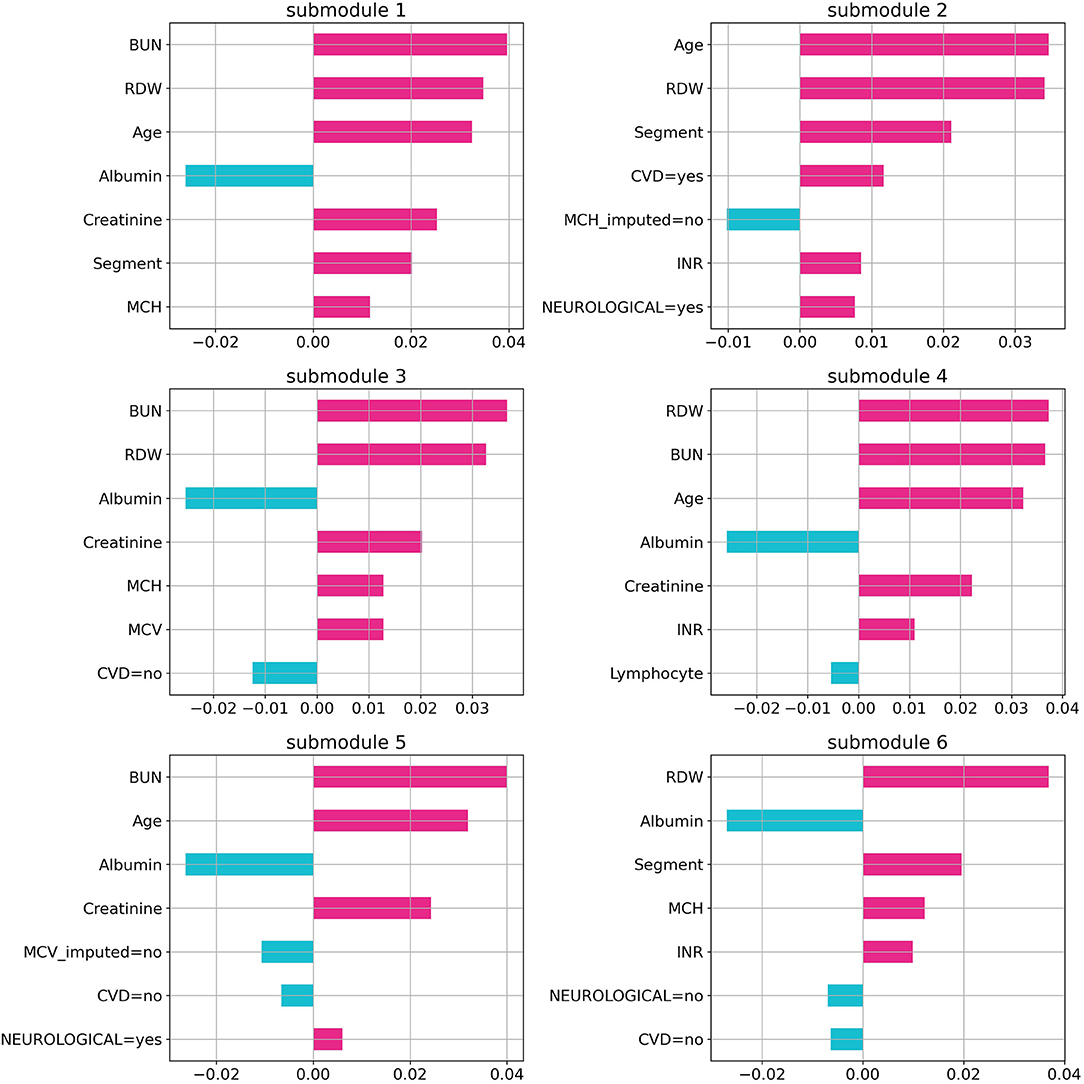
Figure 2. Feature importance in random forest model. The importance of the random forest features using local interpretable model-agnostic explanation submodular-pick with six submodules. Each submodule is related to a patient subpopulation (six subpopulation in this case) and represents decision criteria for them in the model. Negative values (blue) indicate favorable parameters suggesting a better prognosis, and positive values (red) indicate unfavorable parameters suggesting a worse prognosis.
Evaluation Criteria of the Model
To specify the evaluation dataset required for the validation of the model's performance, 30% of the records available in dataset 2 (the U.K, 161 patients; equal to 20% of the records) were randomly selected and assigned to the validation set to be used to blindly test the methods, and externally confirm the exactitude of the model. We have additionally included a data processing pipeline to summarize our methodology.
Results
In dataset 1 (Iran), all the available patient records were used to train the models. The median age of patients was 69 years with an interquartile range (IQR) of 54–78. The minimum and maximum ages were 20 and 98 years, respectively. One hundred fifty-three patients (65.1%) were men, and 82 (34.9%) were women. One hundred five (39.9%) were discharged from the ICU after recovery and 158 (60.1%) patients died. The most frequent comorbidities among the patients were hypertension, diabetes, and cardiovascular disorders in 94, 92, and 86 patients, respectively. Among the 158 deceased patients, neurological disorders were the most prevalent comorbidity (42 patients, 84%). The statistical analysis and the availability of each parameter in our dataset are summarized in Table 2.
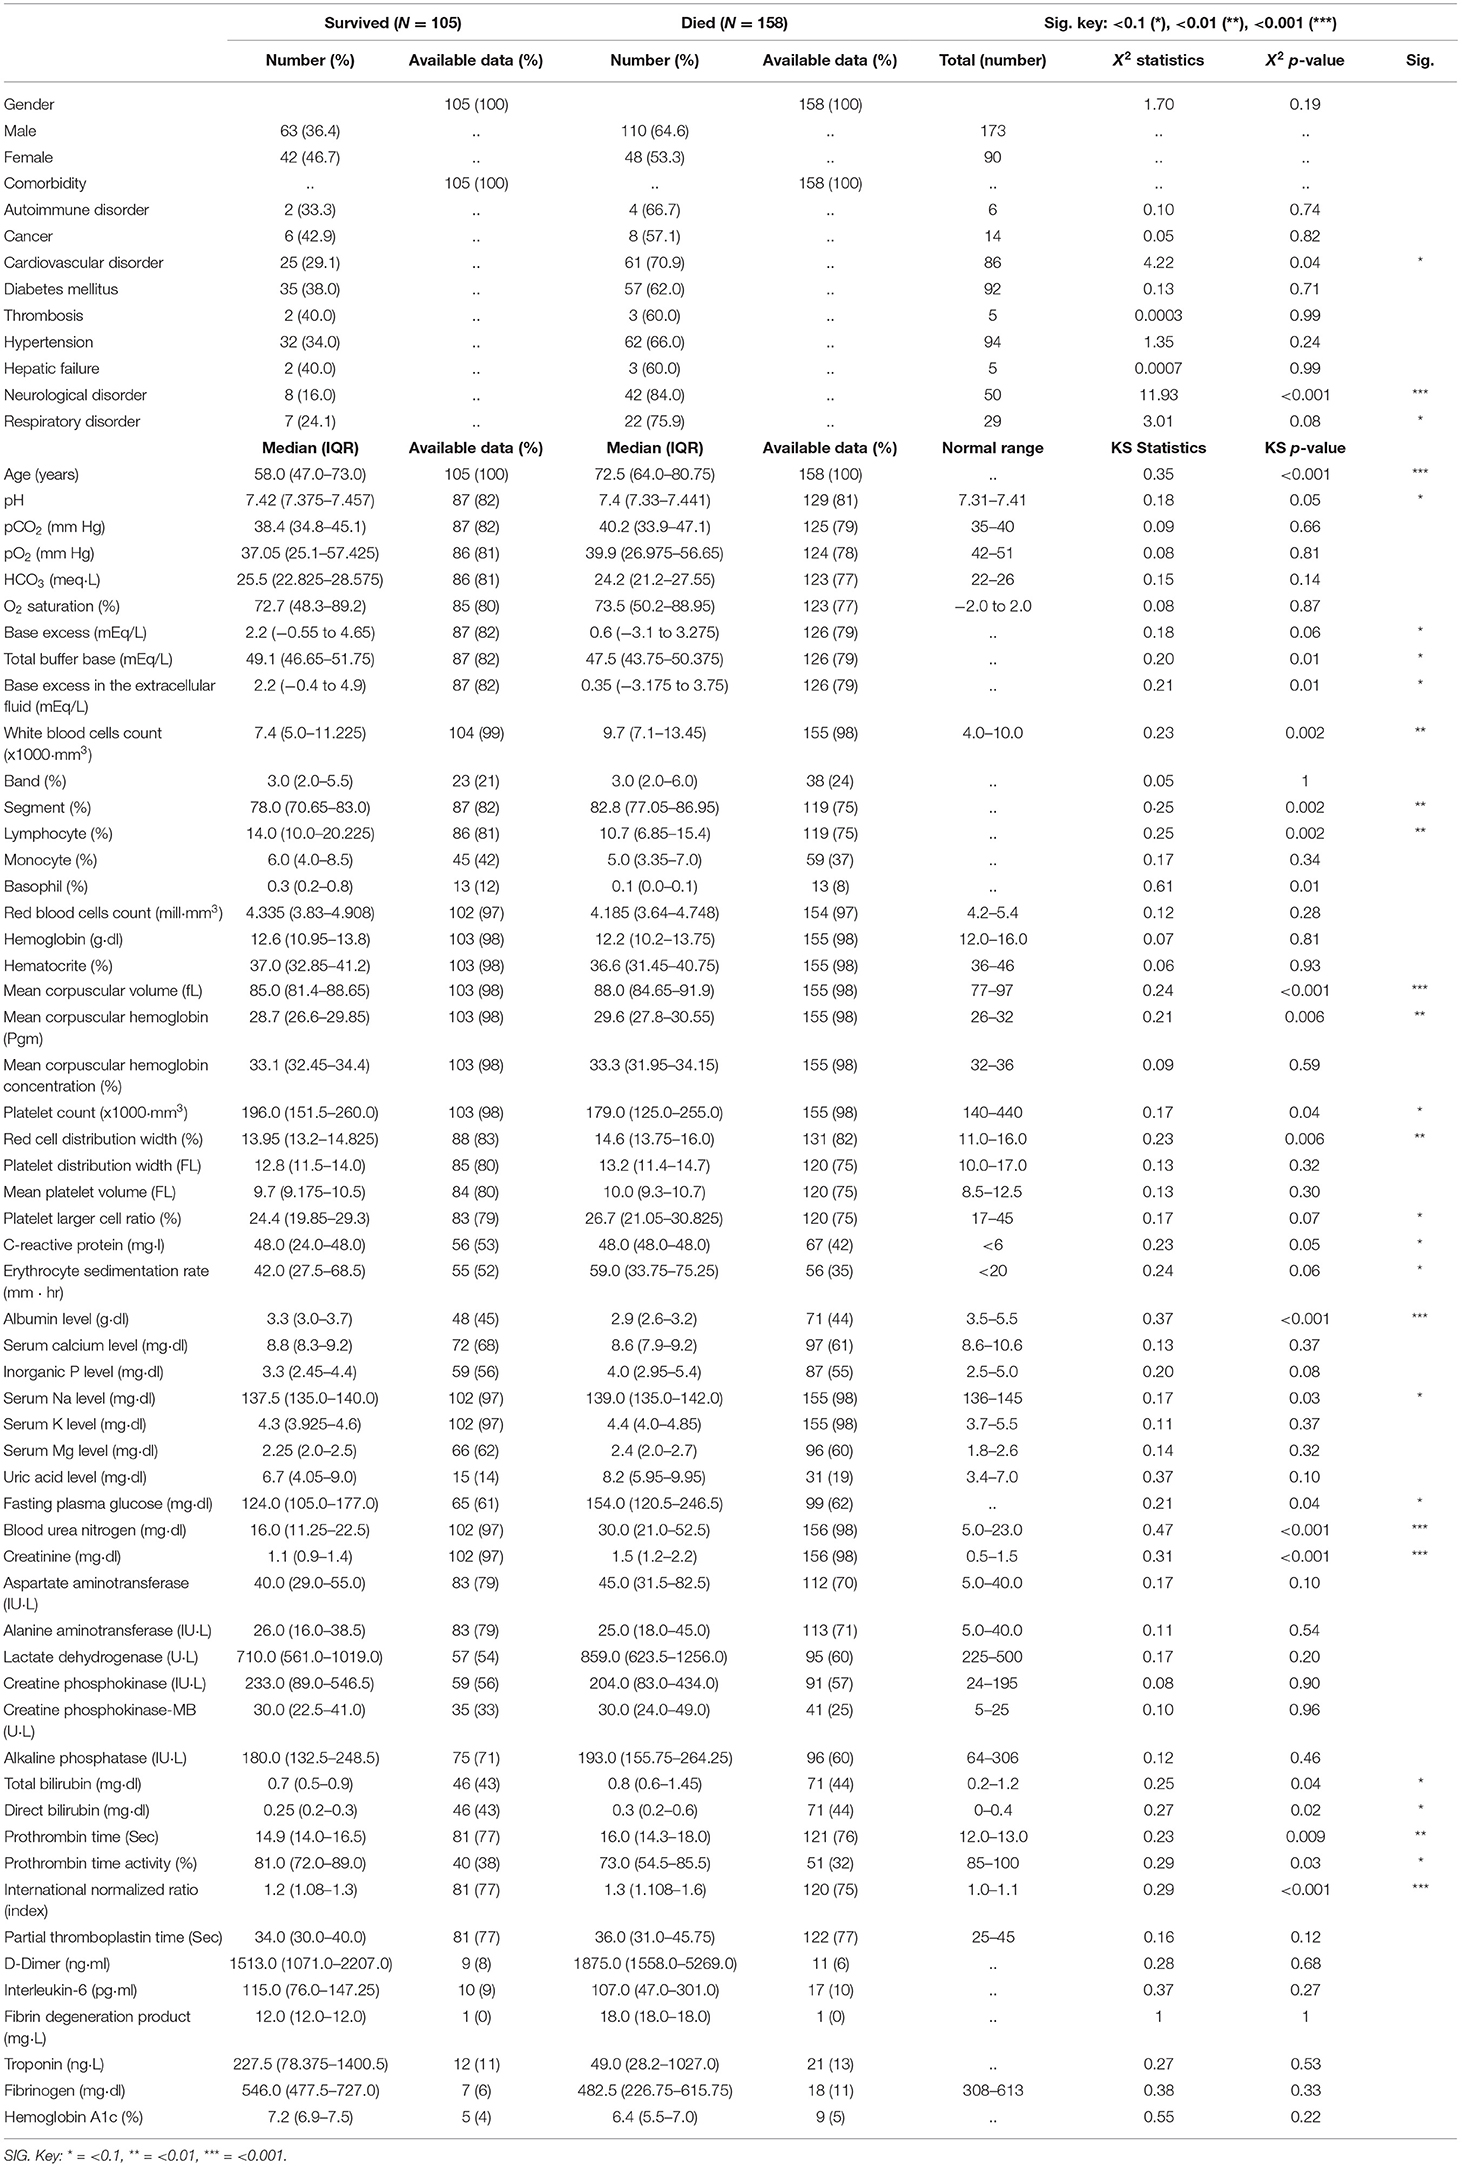
Table 2. Characteristics of intensive care unit patients with COVID-19 in our data.
In the RF model, the optimum point between overfitting and efficiency was found by selecting 10 laboratory biomarkers out of 55 with the lowest KS p-values and three out of nine comorbidities with the lowest χ2 p-values, besides demographic characteristics.
The selected numerical parameters for modeling were as follows: age, blood urea nitrogen (BUN), serum creatinine level (Cr), international normalized ratio (INR), serum albumin, mean corpuscular volume (MCV), red cell distribution width (RDW), mean corpuscular hemoglobin (MCH), white blood cell count (WBC), segmented neutrophil count, and lymphocyte count. In addition, selected categorical parameters were gender and a history of neurological, respiratory, and cardiovascular diseases. The distributions of selected numerical (age and biomarkers) and categorical (gender and preexisting conditions) variables are shown in Supplementary Figures 6, 7, respectively.
Based on the ROC curves of the models (Supplementary Figure 3), the RF model outperformed other models and had superior efficiency. The higher efficiency of the RF model is also statistically significant in comparison to the other methods (Supplementary Figure 4). The better performance of RF could be explained by the complexity of the effects of COVID-19 and the varied etiologies underlying the deterioration of COVID-19 patients, for which the non-linear characteristics of the RF model was a more suitable option for predictions than the linear LR model. The RF model could predict a patient's outcome with a sensitivity of 70% and a specificity of 75%, whereas the sensitivity for the LR model was 65% and the specificity was 70%. Evaluation metrics for the models were also confirmed by the metrics reported as the results of the validating models.
By using the LIME technique, variables that provide the most information on the probability of each patient's death were identified. Among the six submodules identified with the highest disparity among 100 patients, albumin, BUN, and RDW were present in five of them. Age, MCH, and creatinine were present in four of the abovementioned submodules. This points out the importance of these measurements in the recorded parameters. Additionally, BUN (in three of these submodules), RDW (in two submodules), and age (in one submodule) were the most decisive ones.
This model could predict a patient's outcome reliably (AUC between 80 and 85) over a 15-day period, as shown in Figure 3. The mortality rate was highest between zero and 4 days. Given that the model was designed for first-day ICU admissions, moving away from this day reduced the accuracy of the predictions and the efficacy of the LIME method for clinical interventions, as expected.
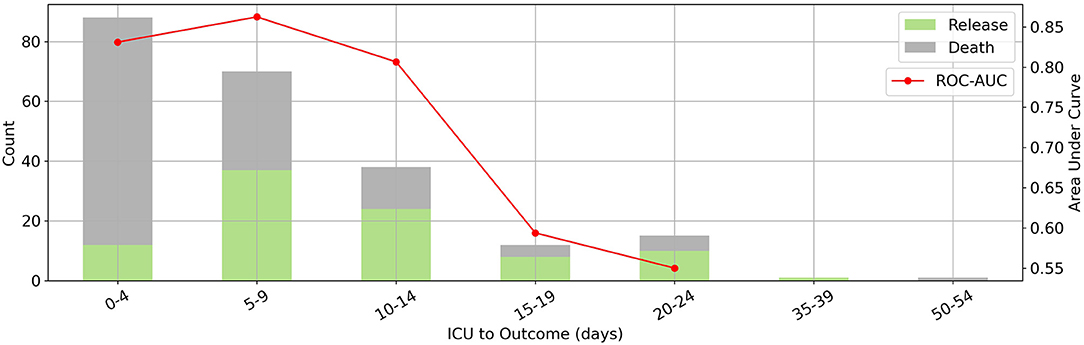
Figure 3. The relation between prediction horizon and performance. Where x-axis denotes days from ICU admission to outcome. Distribution of days between intensive care unit admission and outcome (bars on the left vertical axis) and corresponding random forest model's area under the receiver operating characteristic curve scores for each bin (red line on the right vertical axis). Our model has the best performance to predict outcomes in a 15-day period.
To evaluate the clinical capability of the model, the decision curve (DC) and the clinical impact curve (CIC) were investigated (23). The DC framework measures the clinical “net benefit” for the prediction model relative to the current treatment strategy for all or no patients. The net benefit is measured over a spectrum of threshold probabilities, defined as the minimum disease risk at which further intervention is required. Based on the DC, CIC, and on the assumption of the same interventions for high-risk patients, our model indicated a superior or equal net benefit within a wide range of risk thresholds and patient outcomes, as shown in Figure 4.
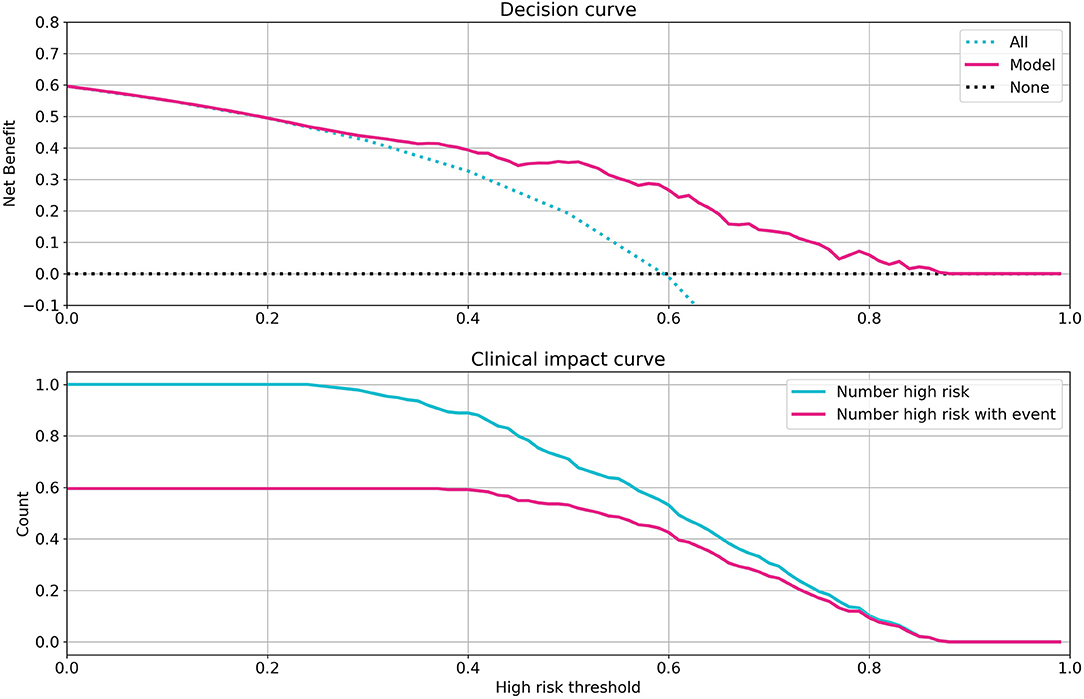
Figure 4. Investigation of clinical impacts and benefits of the model. Decision curve (Top) and clinical impact curve (Bottom) of the random forest model. The decision curve compares the net benefits of an intervention in three scenarios: intervention for all patients (blue dotted line), intervention for no patients (gray dotted line), and intervention for high-risk patients based on the model prediction (red line). The clinical impact curve compares the number of patients classified as high risk by model and the number of patients with a really poor bad outcome who were classified as high risk, for all possible high-risk thresholds in model prediction from 0 to 1.
Validation of the Model
In order to validate the performance of the model, similar records for 161 patients admitted to ICUs and Emergency Assessment Units were studied to externally confirm the prediction model (from dataset 2, U.K. cohort; see graphical abstract). The same Data preprocessing routine was applied to the additional validation data and ML methods with the same parameters as mentioned in Table 1 were implemented. Models were blindly tested with the external validation data. Evaluation metrics for models are reported in Supplementary Table 3. Reported evaluation metrics indicate a 70% sensitivity for the RF model which accredits the certitude of the model. Validation results ensure the generalizability of the model and guarantee it's applicability for external data containing similar, globally accessible features.
Discussion
The aim of this study was to develop an interpretable ML model to predict the mortality rate of COVID-19 patients at the time of admission to the ICU. To the best of our knowledge, this is the first study to develop a predictive model of mortality in patients with severe COVID-19 infection at such an early stage using routine laboratory results and demographic characteristics.
Statistical analysis and feature selection tasks were performed merely by considering patients in dataset 1 (Iran dataset), which includes routine laboratory results, past medical histories and demographic characteristics, leading to selection among accessible and measurable predictors.
The most decisive parameters based on the two-sample KS test were, in decreasing order of importance, increased BUN, Cr, INR, MCV, WBC, segmented neutrophils count, RDW, MCH, and decreased albumin and lymphocyte levels. Moreover, based on a χ2-test, age, gender, and a history of neurological, cardiovascular, and respiratory disorders were identified as parameters with high predictive values. Multicollinearity might affect the performance of the models and result in redundancy. Hence, variance inflation factor was calculated to find and remove highly correlated predictors. Selected predictors along with their references in the literature are listed in Table 3.
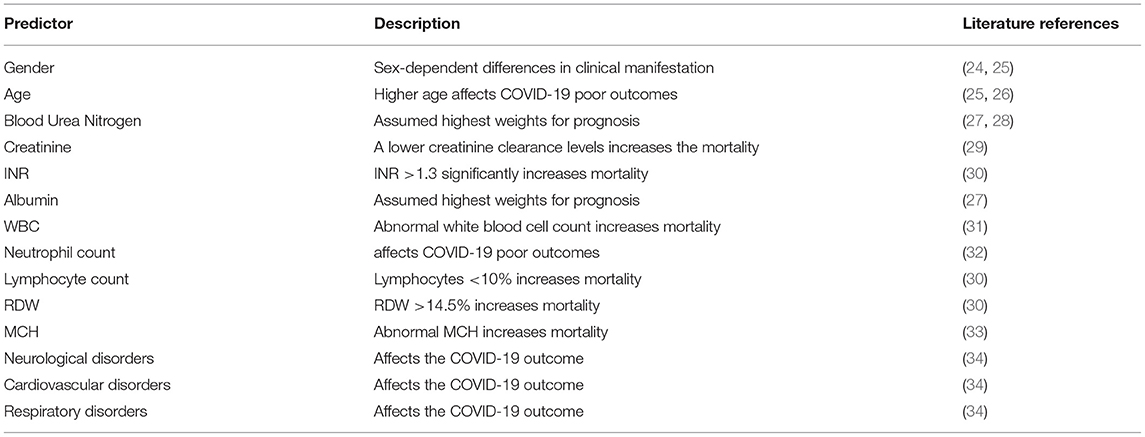
Table 3. Predictors with the highest predictive value, selected in this study, along with studies referring to them.
A number of studies have investigated the risk factors affecting COVID-19 infections (34, 35). Elevated inflammatory cytokines such as interleukin-6 (IL-6), granulocyte colony-stimulating factor (G-CSF), interferon gamma-induced protein 10 (IP-10), and interferon (IFN)-γ have been proposed as poor prognostic factors for COVID-19 patients (36–39). These markers, however, are not usually used as predictors of the severity of disease in clinical practice. Although using these cytokines in modeling may enable a more accurate prediction of the severity of COVID-19 infection, doing so impedes the model's clinical application, as most of the cytokines are not routinely checked at presentation to the ICU. In contrast, all 10 laboratory biomarkers identified in our model are commonly measured and are available to most clinical laboratories. Thus, the DC and CIC analyses indicated the notable clinical benefit of our model especially in a situation characterized by resource scarcity.
Only patients who had at least seven of the 10 selected biomarkers have been included in the training phase of the modeling and missing parameters were imputed using k-NN based on the data. As can be seen in the models' ROC curve, the RF algorithm outperformed other methods in predicting the outcome. Significance of this difference has been investigated using DeLong's test. Superior proficiency of the RF model is mainly due to the non-linear correlation between variables, manifesting the complexity of the problem.
Since a part of the data itself has been used for feature selection and a 10-fold cross-validation algorithm has been implemented to the data, an additional external validation was conducted to confirm the model's performance. Models were blindly tested with validation data, including records of measurements of the selected predictors for 161 patients, taken out of dataset 2 (U.K.).
Results of the validation assure that the model we developed could be applied globally and predict mortality of the patients with severe COVID-19 infection solely with universally accessible parameters (Table 2). As a result, physicians and healthcare systems are able to utilize this model, confident about high sensitivity and specificity in the outcome.
The application of the LIME-SM method allowed us to determine a patient-specific marker set that each patient's prognosis is based on. This technique explains the predictions by perturbing the input of data samples and evaluating the effects. The output of LIME is a list of features, reflecting each feature's contribution to a given prediction. Understanding the “reasoning” of the ML model is crucial for increasing physicians' confidence in selecting treatments based on the prognosis scores. Using the LIME method, the significance of variables with high predictive value was determined for each prediction made for an individual. The evaluation of the variables in the individual's personalized prediction can lead to supportive measures and help determine treatment strategies according to the interpretation of the individual prognosis.
As severe COVID-19 may result from various underlying etiologies, our model can help categorize patients into groups with distinct clinical prognosis, thus allowing personalized treatments. In addition to targeted therapies, the differentiation between patients may reveal disease mechanisms that coincide or that occur under specific preexisting conditions. Future cohort studies could explore these assumptions with increased sample sizes.
In this study, hypoalbuminemia and renal function were identified as the main factors with high predictive values for the model. These findings are in agreement with recent results showing that hypoalbuminemia is an indicator of poor prognosis for COVID-19 patients (40). It is well-documented that endogenous albumin is the primary extracellular molecule responsible for regulating the plasma redox state among plasma antioxidants (40). Moreover, it has been shown that albumin downregulates the expression of the angiotensin-converting enzyme 2 (ACE2) which may explain the association of hypoalbuminemia with severe COVID-19 (41). Intravenous albumin therapy has been shown to improve multiple organ functions (42). Therefore, early treatment with human albumin in severe cases of COVID-19 patients before the drop in albumin levels might have positive outcomes and needs to be further investigated.
Furthermore, increased levels of BUN and Cr are observed in our study, which is an indication of kidney damage. An abrupt loss of kidney function in COVID-19 is strongly associated with increased mortality and morbidity (43). There are multiple mechanisms supporting this association (44, 45).
One of the findings of this study is the identification of RDW (a measure of the variability of the sizes of RBCs) as an influential parameter. This result is in line with recently published reports (46). Elevated RDW, known as anisocytosis, reflects a higher heterogeneity in erythrocyte sizes caused by erythrocyte maturation and degradation abnormalities. Several studies have found that elevated RDW is associated with inflammatory markers in the blood such as IL-6, tumor necrosis factor-α, and CRP, which is common in severely ill Covid-19 patients (44). These inflammatory markers could disrupt the erythropoiesis by directly suppressing erythroid precursors, promoting apoptosis of precursor cells, and reducing the bioavailability of iron for hemoglobin synthesis.
Yan et al. recently identified LDH, lymphocyte, and high-sensitivity C-reactive protein (hs-CRP) as predictors of mortality in COVID-19 patients during their hospitalization. The blood results of hospitalized patients on different days after the initial ICU admission were used for their model (45). Since our goal was the prediction of mortality risk as early as possible for ICU patients, this limited us to using only the laboratory results on day 0, in contrast. For patients with severe COVID-19 infection, early decision-making is critical for successful clinical management. Additionally, laboratory results from other days may not always become available. We also identified lymphocyte count as a predictor of mortality, as in the previous study; however, CRP levels and LDH did not reach statistical significance.
Although IL-6 has been found to be a good predictor of disease severity by other studies, it did not reach statistical significance in our model (47). IL-6 had a considerable KS statistical value, but because of the high number of missing values, its p-value was not significant compared to other markers. The fact that IL-6 is not always measured upon ICU admission is precisely why it is not suitable for our purposes.
In similar studies the impact of laboratory values was assessed. Booth et al. recruited two ML techniques, LR and SVM to design a prediction model for COVID-19 severity among 26 parameters. They indicated CRP, BUN, serum calcium, serum albumin, and lactic acid as the top five highest-weighted laboratory values. Their analysis showed that the SVM model displayed 91% sensitivity and specificity (AUC 0.93) for predicting mortality (27). In another study, Guan et al. used an ML algorithm to predict COVID-19 mortality retrospectively. They showed that CRP, LDH, ferritin, and IL-10 were the most important death predictors with a sensitivity of 85% (48). Zoabi et al. developed a ML-based predicting model that evaluate eight binary features: sex, age, known contact with an infected person, and five initial clinical symptoms including headache, sore throat, cough, fever, and shortness of breath. They showed that their model can predict the COVID-19 infection with 87.30% sensitivity and 71.98% specificity (49).
The missingness indicator of some markers in both LR and RF models has an impact on the predictions based on the regression coefficient and LIME, which can be the result of the model compensating for the imputation error. However, the missingness indicator may also indicate the existence of bias in biomarker reporting (50). Such biases (e.g., sampling bias) are an inevitable part of retrospective studies. They can be addressed using domain-adaptation techniques such as correlation alignment (CORAL) in future studies using additional data (51, 52). Another limitation of this study may be the lack of an objective criterion for ICU admission. Moreover, different treatment strategies can change the survival outcome for patients who may have had similar profiles when admitted to the ICU. In future studies, the accuracy of this model may be further improved by adding chest imaging data and by using a larger dataset. Possible targets for our ML framework include the prediction of other crucial information such as the patients' need for mechanical ventilation, the occurrence of cytokine release syndrome, the severity of acute respiratory disease syndrome, the cause of death, and the right treatment strategy.
In conclusion, we evaluated 66 parameters in COVID-19 patients at the time of ICU admission. Of those parameters, 15 metrics with the highest prediction values were identified: gender, age, BUN, Cr, INR, albumin, MCV, RDW, MCH, WBC, segmented neutrophil count, lymphocyte count, and past medical history of neurological, respiratory, and cardiovascular disorders. In addition, by using the LIME-SP method, we identified different submodules clarifying distinct clinical manifestations of severe COVID-19. The ML model trained in this study could help clinicians determine rapidly which patients are likely to have worse outcomes, and given the limited resources and reliance on supportive care allow physicians to make more informed decisions.
Data Availability Statement
The original contributions presented in the study are included in the article/Supplementary Material, further inquiries can be directed to the corresponding author/s.
Ethics Statement
Written informed consent was obtained from the individual(s) for the publication of any potentially identifiable images or data included in this article.
Author Contributions
EJ, AA, SaJ, NM, and NT: conceptualization, methodology, project administration, writing—original draft, writing—review, and editing. SS: methodology, project administration, writing—review, and editing. AZ, HE, SeJ, AD, AB, MS, and MJ: data curation, investigation, writing—original draft, writing—review, and editing. All authors contributed to the article and approved the submitted version.
Funding
IORD was supported by the Oxford NIHR Biomedical Research Centre.
Conflict of Interest
The authors declare that the research was conducted in the absence of any commercial or financial relationships that could be construed as a potential conflict of interest.
Publisher's Note
All claims expressed in this article are solely those of the authors and do not necessarily represent those of their affiliated organizations, or those of the publisher, the editors and the reviewers. Any product that may be evaluated in this article, or claim that may be made by its manufacturer, is not guaranteed or endorsed by the publisher.
Acknowledgments
This work uses data provided by patients and collected by the UK's National Health Service as part of their care and support. We thank all the people of Oxfordshire who contribute to the Infections in Oxfordshire Research Database. Research Database Team: L. Butcher, H. Boseley, C. Crichton, D. W. Crook, D. Eyre, O. Freeman, J. Gearing (community), R. Harrington, K. Jeffery, M. Landray, A. Pal, T. E. A. Peto, T. P. Quan, J. Robinson (community), J. Sellors, B. Shine, A. S. Walker, and D. Waller. Patient and Public Panel: G. Blower, C. Mancey, P. McLoughlin, and B. Nichols.
Supplementary Material
The Supplementary Material for this article can be found online at: https://www.frontiersin.org/articles/10.3389/fdgth.2021.681608/full#supplementary-material
Abbreviations
ACE2, Angiotensin-Converting Enzyme 2; AI, Artificial Intelligence; BUN, Blood Urea Nitrogen; COVID-19, coronavirus disease of 2019; CIC, clinical impact curve; Cr, creatinine; CRP, C reactive protein; DC, decision curve; ICU, Intensive care unit; INR, International Normalized Ratio; IFN, interferon; IL-6, Interleukin 6; IQR, interquartile range; KS, Kolmogorov- Smirnov; LR, Logistics regression; LIME, local interpretable model-agnostic explanation; LIME-SP, local interpretable model-agnostic explanation submodular-pick; ML, Machine learning; MCH, mean corpuscular hemoglobin; MCV, mean corpuscular volume; RF, Random forest; RDW, Red blood cell distribution width; ROC, receiver operating characteristic curve; RT-PCR, reverse transcription-polymerase chain reaction; WBC, white blood cells count.
References
1. Richardson S, Hirsch JS, Narasimhan M, Crawford JM, McGinn T, Davidson KW, et al. Presenting characteristics, comorbidities, and outcomes among 5700 patients hospitalized with COVID-19 in the New York City area. JAMA. (2020) 323:2052–9. doi: 10.1001/jama.2020.6775
2. Liu K, Chen Y, Lin R, Han K. (2020). Clinical features of COVID-19 in elderly patients: A comparison with young and middle-aged patients. J Infec. 80, e14–e18. doi: 10.1016/j.jinf.2020.03.005
3. Abate SM, Ahmed Ali S, Mantfardo B, Basu B. Rate of Intensive Care Unit admission and outcomes among patients with coronavirus: a systematic review and meta-analysis. PLoS ONE. (2020) 15:e0235653. doi: 10.1371/journal.pone.0235653
4. Rapsang AG, Shyam DC. Scoring systems in the intensive care unit: a compendium. Indian J Crit Care Med. (2014) 18:220. doi: 10.4103/0972-5229.130573
5. Fan G, Tu C, Zhou F, Liu Z, Wang Y, Song B, et al. Comparison of severity scores for COVID-19 patients with pneumonia: a retrospective study. Eur Respir J. (2020) 56:2002113. doi: 10.1183/13993003.02113-2020
6. Su Y, Tu G-W, Ju M-J, Yu S-J, Zheng J-L, Ma G-G, et al. Comparison of CRB-65 and quick sepsis-related organ failure assessment for predicting the need for intensive respiratory or vasopressor support in patients with COVID-19. J Infect. (2020) 81:647–79. doi: 10.1016/j.jinf.2020.05.007
7. Hartzband P, Groopman J. Physician burnout, interrupted. N Engl J Med. (2020) 382:2485–7. doi: 10.1056/NEJMp2003149
8. Shortliffe EH, Sepúlveda MJ. Clinical decision support in the era of artificial intelligence. JAMA. (2018) 320:2199–200. doi: 10.1001/jama.2018.17163
9. Stead WW. Clinical implications and challenges of artificial intelligence and deep learning. JAMA. (2018) 320:1107–8. doi: 10.1001/jama.2018.11029
10. Ghafouri-Fard S, Taheri M, Omrani MD, Daaee A, Mohammad-Rahimi H, Kazazi H. Application of single-nucleotide polymorphisms in the diagnosis of autism spectrum disorders: a preliminary study with artificial neural networks. J Mol Neurosci. (2019) 68:515–21. doi: 10.1007/s12031-019-01311-1
11. Ghafouri-Fard S, Taheri M, Omrani MD, Daaee A, Mohammad-Rahimi H. Application of artificial neural network for prediction of risk of multiple sclerosis based on single nucleotide polymorphism genotypes. J Mol Neurosci. (2020) 70:1081–7. doi: 10.1007/s12031-020-01514-x
12. Vaishya R, Javaid M, Khan IH, Haleem A. Artificial Intelligence (AI) applications for COVID-19 pandemic. Diabetes Metab Syndr Clin Res Rev. (2020) 14:337–9. doi: 10.1016/j.dsx.2020.04.012
13. Lai J, Ma S, Wang Y, Cai Z, Hu J, Wei N, et al. Factors associated with mental health outcomes among health care workers exposed to coronavirus disease 2019. JAMA Netw Open. (2020) 3:e203976. doi: 10.1001/jamanetworkopen.2020.3976
14. Kannampallil TG, Goss CW, Evanoff BA, Strickland JR, McAlister RP, Duncan J. Exposure to COVID-19 patients increases physician trainee stress and burnout. PLoS ONE. (2020) 15:e0237301. doi: 10.1371/journal.pone.0237301
15. Motluk A. Do doctors experiencing burnout make more errors? Can Med Assoc. (2018) 190:E1216–7. doi: 10.1503/cmaj.109-5663
16. Dyrbye LN, Awad KM, Fiscus LC, Sinsky CA, Shanafelt TD. Estimating the attributable cost of physician burnout in the United States. Ann Int Med. (2019) 171:600–1. doi: 10.7326/L19-0522
17. Mladenić D. Feature selection for dimensionality reduction. In: Saunders C, Grobelnik M, Gunn S, Shawe-Taylor J, editors. International Statistical and Optimization Perspectives Workshop “Subspace, Latent Structure and Feature Selection,” Vol. 3940. Berlin; Heidelberg: Springer (2005). p. 84–102. doi: 10.1007/11752790_5
18. Wong TT. Performance evaluation of classification algorithms by k-fold and leave-one-out cross validation. Pattern Recognit. (2015) 48:2839–46. doi: 10.1016/j.patcog.2015.03.009
19. Pujianto U, Wibawa AP, Akbar MI. K-Nearest Neighbor (K-NN) based missing data imputation. In: 2019 5th International Conference on Science in Information Technology (ICSITech). Yogyakarta: IEEE (2019). p. 83–8.
20. Pedregosa F, Cauvet E, Varoquaux G, Pallier C, Thirion B, Gramfort A. Learning to rank from medical imaging data. In: International Workshop on Machine Learning in Medical Imaging. Nice: Springer (2012). p. 234–41. doi: 10.1007/978-3-642-35428-1_29
21. Ng AY. Feature selection, L 1 vs. L 2 regularization, rotational invariance. In: Proceedings of the Twenty-First International Conference on Machine Learning. (2004). p. 78. doi: 10.1145/1015330.1015435
22. Ribeiro MT, Singh S, Guestrin C. “Why should i trust you?” Explaining the predictions of any classifier. In: Proceedings of the 22nd ACM SIGKDD International Conference on Knowledge Discovery and Data Mining. San Francisco, CA (2016). p. 1135–44. doi: 10.1145/2939672.2939778
23. Vickers AJ, Elkin EB. Decision curve analysis: a novel method for evaluating prediction models. Med Decis Making. (2006) 26:565–74. doi: 10.1177/0272989X06295361
24. Ancochea J, Izquierdo JL, Soriano JB. Evidence of gender differences in the diagnosis and management of coronavirus disease 2019 patients: an analysis of electronic health records using natural language processing and machine learning. J Womens Health. (2021) 30:393–404. doi: 10.1089/jwh.2020.8721
25. Aktar S, Talukder A, Ahamad MM, Kamal AHM, Khan JR, Protikuzzaman M, et al. Machine learning approaches to identify patient comorbidities and symptoms that increased risk of mortality in COVID-19. Diagnostics. (2021) 11:1383. doi: 10.3390/diagnostics11081383
26. Li M, Zhang Z, Cao W, Liu Y, Du B, Chen C, et al. Identifying novel factors associated with COVID-19 transmission and fatality using the machine learning approach. Sci Total Environ. (2021) 764:142810. doi: 10.1016/j.scitotenv.2020.142810
27. Booth AL, Abels E, McCaffrey P. Development of a prognostic model for mortality in COVID-19 infection using machine learning. Modern Pathol. (2021) 34:522–31. doi: 10.1038/s41379-020-00700-x
28. Kang J, Chen T, Luo H, Luo Y, Du G, Jiming-Yang M. Machine learning predictive model for severe COVID-19. Infect Genet Evol. (2021) 90:104737. doi: 10.1016/j.meegid.2021.104737
29. Paris S, Inciardi RM, Specchia C, Vezzoli M, Oriecuia C, Lombardi CM, et al. 554 machine learning for prediction of in-hospital mortality in COVID-19 patients: results from an Italian multicentre study. Eur Heart J Suppl. (2021) 23. doi: 10.1093/eurheartj/suab135.035
30. Kar S, Chawla R, Haranath SP, Ramasubban S, Ramakrishnan N, Vaishya R, et al. Multivariable mortality risk prediction using machine learning for COVID-19 patients at admission (AICOVID). Sci Rep. (2021) 11:12801. doi: 10.1038/s41598-021-92146-7
31. Blagojević A, Šušteršič T, Lorencin I, Šegota SB, Milovanović D, Baskić D, Baskić D, Car Z, et al. Combined machine learning and finite element simulation approach towards personalized model for prognosis of COVID-19 disease development in patients. EAI Endorsed Trans Bioeng Bioinform. (2021) 1:e6. doi: 10.4108/eai.12-3-2021.169028
32. Ye J, Hua M, Zhu F. Machine learning algorithms are superior to conventional regression models in predicting risk stratification of COVID-19 patients. Risk Manag Healthc Policy. (2021) 14:3159–66. doi: 10.2147/RMHP.S318265
33. Alves MA, Castro GZ, Oliveira BAS, Ferreira LA, Ramírez JA, Silva R, et al. Explaining machine learning based diagnosis of COVID-19 from routine blood tests with decision trees and criteria graphs. Comput Biol Med. (2021) 132:104335. doi: 10.1016/j.compbiomed.2021.104335
34. Jamshidi E, Asgary A, Tavakoli N, Zali A, Dastan F, Daaee A, et al. Symptom prediction and mortality risk calculation for COVID-19 using machine learning. medRxiv. (2021). doi: 10.1101/2021.02.04.21251143
35. Jamshidi E, Asgary A, Tavakoli N, Zali A, Dastan F, Daaee A, et al. Symptom prediction and mortality risk calculation for COVID-19 using machine learning. Front Artif Intell. (2021) 4:673527. doi: 10.3389/frai.2021.673527
36. Mehta P, McAuley DF, Brown M, Sanchez E, Tattersall RS, Manson JJ. COVID-19: consider cytokine storm syndromes and immunosuppression. Lancet. (2020) 395:1033–4. doi: 10.1016/S0140-6736(20)30628-0
37. Conti P, Ronconi G, Caraffa A, Gallenga C, Ross R, Frydas I, et al. Induction of pro-inflammatory cytokines (IL-1 and IL-6) and lung inflammation by coronavirus-19 (COVI-19 or SARS-CoV-2): anti-inflammatory strategies. J Biol Regul Homeost Agents. (2020) 34:327–31. doi: 10.23812/CONTI-E
38. Jamshidi E, Babajani A, Soltani P, Niknejad H. Proposed mechanisms of targeting COVID-19 by delivering mesenchymal stem cells and their exosomes to damaged organs. Stem Cell Rev Rep. (2021) 17:176–92. doi: 10.1007/s12015-020-10109-3
39. Babajani A, Hosseini-Monfared P, Abbaspour S, Jamshidi E, Niknejad H. Targeted mitochondrial therapy with over-expressed MAVS protein from mesenchymal stem cells: a new therapeutic approach for COVID-19. Front Cell Dev Biol. (2021) 9:695362. doi: 10.3389/fcell.2021.695362
40. de la Rica R, Borges M, Aranda M, Del Castillo A, Socias A, Payeras A, et al. Low albumin levels are associated with poorer outcomes in a case series of COVID-19 patients in Spain: a retrospective cohort study. Microorganisms. (2020) 8:1106. doi: 10.3390/microorganisms8081106
41. Liu B-C, Gao J, Li Q, Xu L-M. Albumin caused the increasing production of angiotensin II due to the dysregulation of ACE/ACE2 expression in HK2 cells. Clin Chim Acta. (2009) 403:23–30. doi: 10.1016/j.cca.2008.12.015
42. Caironi P, Gattinoni L. The clinical use of albumin: the point of view of a specialist in intensive care. Blood Transfus. (2009) 7:259–67. doi: 10.2450/2009.0002-09
43. Cheng Y, Luo R, Wang K, Zhang M, Wang Z, Dong L, et al. Kidney impairment is associated with in-hospital death of COVID-19 patients. medRxiv. (2020). doi: 10.1101/2020.02.18.20023242
44. Agarwal S. Red cell distribution width, inflammatory markers and cardiorespiratory fitness: results from the National Health and Nutrition Examination Survey. Indian Heart J. (2012) 64:380–7. doi: 10.1016/j.ihj.2012.06.006
45. Yan L, Zhang H-T, Goncalves J, Xiao Y, Wang M, Guo Y, et al. An interpretable mortality prediction model for COVID-19 patients. Nat Mach Intell. (2020) 2:283–8. doi: 10.1038/s42256-020-0180-7
46. Foy BH, Carlson JC, Reinertsen E, Valls RP, Lopez RP, Palanques-Tost E, et al. Elevated RDW is associated with increased mortality risk in COVID-19. medRxiv. (2020). doi: 10.1101/2020.05.05.20091702
47. Herold T, Jurinovic V, Arnreich C, Lipworth BJ, Hellmuth JC, von Bergwelt-Baildon M, et al. Elevated levels of IL-6 and CRP predict the need for mechanical ventilation in COVID-19. J Allergy Clin Immunol. (2020) 146:128–36. e4. doi: 10.1016/j.jaci.2020.05.008
48. Guan X, Zhang B, Fu M, Li M, Yuan X, Zhu Y, et al. Clinical and inflammatory features based machine learning model for fatal risk prediction of hospitalized COVID-19 patients: results from a retrospective cohort study. Ann Med. (2021) 53:257–66. doi: 10.1080/07853890.2020.1868564
49. Zoabi Y, Deri-Rozov S, Shomron N. Machine learning-based prediction of COVID-19 diagnosis based on symptoms. npj Digital Med. (2021) 4:3. doi: 10.1038/s41746-020-00372-6
50. Horton NJ, Lipsitz SR, Parzen M. A potential for bias when rounding in multiple imputation. Am Statist. (2003) 57:229–32. doi: 10.1198/0003130032314
51. Sun B, Feng J, Saenko K. Correlation alignment for unsupervised domain adaptation. In: Domain Adaptation in Computer Vision Applications. Springer (2017). p. 153–71. doi: 10.1007/978-3-319-58347-1_8
Keywords: SARS-CoV-2, COVID-19, artificial intelligence, ICU—intensive care unit, machine learning (ML)
Citation: Jamshidi E, Asgary A, Tavakoli N, Zali A, Setareh S, Esmaily H, Jamaldini SH, Daaee A, Babajani A, Sendani Kashi MA, Jamshidi M, Jamal Rahi S and Mansouri N (2022) Using Machine Learning to Predict Mortality for COVID-19 Patients on Day 0 in the ICU. Front. Digit. Health 3:681608. doi: 10.3389/fdgth.2021.681608
Received: 16 March 2021; Accepted: 22 December 2021;
Published: 13 January 2022.
Edited by:
Phuong N. Pham, Harvard Medical School, United StatesReviewed by:
Hao Wang, Shenzhen University General Hospital, ChinaConstantinos S. Pattichis, University of Cyprus, Cyprus
Copyright © 2022 Jamshidi, Asgary, Tavakoli, Zali, Setareh, Esmaily, Jamaldini, Daaee, Babajani, Sendani Kashi, Jamshidi, Jamal Rahi and Mansouri. This is an open-access article distributed under the terms of the Creative Commons Attribution License (CC BY). The use, distribution or reproduction in other forums is permitted, provided the original author(s) and the copyright owner(s) are credited and that the original publication in this journal is cited, in accordance with accepted academic practice. No use, distribution or reproduction is permitted which does not comply with these terms.
*Correspondence: Nahal Mansouri, bmFoYWwubWFuc291cmlAY2h1di5jaA==; Sahand Jamal Rahi, c2FoYW5kLnJhaGlAZXBmbC5jaA==
†These authors have contributed equally to this work