 Neda Abdollahpour
 N. Sertac Artan
- Circuits, Networks, and Systems (CNS) Laboratory, Department of Electrical and Computer Engineering, New York Institute of Technology, New York, NY, United States
Mental Fatigue (MF) impairs cognitive performance and alters brain function, yet its underlying neurophysiological mechanisms remain insufficiently understood. While prior functional Near-Infrared Spectroscopy (fNIRS) studies have focused primarily on signal-level changes or undirected connectivity, few have explored how MF modulates causal interactions within cortical networks. In this study, we employed an Effective Connectivity (EC) framework based on generalized partial directed coherence (GPDC) to investigate directional brain dynamics during a cognitively demanding Stroop task. Using a publicly available dataset comprising continuous fNIRS recordings from 21 healthy adults, we modeled EC across six temporal segments to capture the evolving structure of brain networks. Our results revealed a transition from distributed, flexible connectivity patterns to more rigid and stereotyped configurations, particularly within prefrontal and motor regions. These findings were supported by significant changes in EC intensity in key channels over time. Together, our approach highlights the utility of directional connectivity analysis for identifying neural signatures of MF and contributes toward developing more sensitive biomarkers for real-time fatigue monitoring.
1 Introduction
Mental Fatigue (MF) is a complex psychophysiological state arising from prolonged periods of cognitive activity, resulting in reduced efficiency of mental processes such as attention, working memory, and executive control (Behrens et al., 2023). It differs from physical fatigue in that its origin lies in the central nervous system, manifesting as slower reaction times, diminished concentration, and impaired decision-making (Wang et al., 2023).
MF during prolonged task performance typically unfolds in three progressive stages (Boksem et al., 2005). In the initial compensatory stage, the brain begins to experience strain, but performance remains stable as cognitive resources are actively recruited to maintain efficiency. As the task continues, individuals enter the reduced efficiency stage, where compensatory mechanisms begin to falter. This results in slower responses, decreased accuracy, and fluctuating brain activity, particularly in regions responsible for attention and executive control. Finally, the exhaustion or breakdown stage emerges when mental resources are depleted, leading to marked declines in performance, increased error rates, and disengagement from the task. These stages reflect a dynamic interplay between neural activity, cognitive effort, and motivational state, offering valuable insight into how the brain responds to sustained mental demands.
Detecting MF is essential for maintaining performance, safety, and cognitive wellbeing across various domains. In high-stakes environments such as driving, aviation, or healthcare, MF is associated with slower reaction times, increased error rates, and impaired decision-making, all of which can lead to serious consequences if left unaddressed (Saleem et al., 2023; Sharma et al., 2023). From a cognitive health perspective, early detection of MF can help prevent chronic stress and burnout by enabling timely interventions (Balia et al., 2025). Moreover, identifying MF in real-time supports personalized task management and adaptive systems, allowing for workload adjustments that enhance efficiency and reduce human error (Hinss et al., 2022).
Despite notable advancements, the detection of MF remains a challenging endeavor due to the complexity and variability of cognitive fatigue manifestations across individuals and contexts. One major obstacle lies in the lack of standardized assessment tools and universally accepted physiological or behavioral markers for fatigue, which hinders cross-study comparisons and the generalizability of findings (Kunasegaran et al., 2023). Moreover, most current detection systems face limitations in practicality and scalability, as highlighted by (Al Imran et al., 2024), who reviewed existing technologies and identified issues such as user discomfort, environmental sensitivity, and computational overhead. These limitations are particularly critical when designing systems for real-world deployment, where robustness and adaptability are essential.
As MF can occur without conscious awareness and may not be accurately captured by subjective self-reports, there is a growing need for objective, brain-based measures for its detection (Trejo et al., 2015; Craig et al., 2012). Consequently, the analysis of brain signals has become a critical avenue for understanding and detecting MF. This approach enables the direct measurement of neurophysiological correlates associated with fatigue-induced cognitive decline, such as changes in brain oscillatory activity, network connectivity, and cortical activation patterns (Borghini et al., 2014; Jap et al., 2009). Techniques like electroencephalography (EEG) and functional Near-Infrared Spectroscopy (fNIRS) have proven particularly valuable due to their ability to capture dynamic brain responses with high temporal sensitivity (Zhao et al., 2012; Derosière et al., 2013). These objective indicators provide a reliable foundation for developing real-time MF detection systems in cognitively demanding environments.
To gain deeper insight into how brain regions interact during cognitive processes, researchers analyze not only neural activity but also the directional influences between regions. This is where effective connectivity (EC) becomes essential: it quantifies the causal influence one neural region exerts over another, revealing the brain’s underlying causal architecture (Sporns, 2007). Unlike functional connectivity (FC), which measures undirected statistical dependencies, EC captures mechanistic, directional relationships (Sameshima and Baccala, 2014b). For instance, EC can distinguish whether prefrontal activity drives parietal responses or vice versa, clarifying hierarchical processing that FC alone cannot. Moreover, EC dynamically adapts across tasks and lifespan stages, as demonstrated by (Edde et al., 2021; Abdollahpour and Artan, 2025) in studies of brain maturation, development, and aging. By modeling these directed interactions, EC provides a framework to decode how neural networks reorganize to support cognition and behavior.
In this study, we investigate how MF affects the causal interactions among brain regions by analyzing both the direction and strength of information flow using EC.
1.1 Previous fNIRS studies on fatigue
In recent years, the use of functional neuroimaging—particularly fNIRS, has gained momentum in fatigue research. Its non-invasiveness, portability, and sensitivity to cerebral hemodynamics have made it a valuable tool for investigating the neural correlates of both physical and MF across diverse populations and task paradigms.
Initial studies predominantly examined physical fatigue. For example (Li et al., 2023), employed Pearson correlation, based FC to study upper limb fatigue and observed significant post-fatigue reductions in interhemispheric and prefrontal-motor connectivity, underscoring the capability of fNIRS to detect cortical changes resulting from physical exertion. Building upon these findings, more recent efforts have shifted toward MF (Glavå et al., 2025). compared individuals with post-mononucleosis fatigue (PMF) with healthy controls, revealing altered resting-state and task-evoked neural connectivity. The PMF group exhibited increased global efficiency and reduced modularity, suggesting compensatory or maladaptive reorganization in brain network dynamics associated with chronic fatigue.
Parallel lines of research have explored the reliability of specific fNIRS biomarkers for MF detection. A systematic review by (Yan et al., 2025) identified prefrontal cortex activation, particularly in a rise of oxygenated hemoglobin (HbO), as a robust and consistent indicator of MF across various task types and training conditions. These findings reinforce the centrality of the prefrontal cortex in physical fatigue monitoring and the potential of HbO as a reliable biomarker.
In terms of network-level analyses (Peng et al., 2022), performed a frequency-specific FC study across multiple fatigue states, revealing unique frequency-band signatures for moderate versus severe fatigue. They identified altered clustering coefficients and disruptions in small-world properties, offering a temporal perspective on fatigue diagnostics. Complementarily (Yan et al., 2024), addressed higher-order modeling by combining low- and high-order network features across three fatigue states. Their integrative framework achieved classification accuracies exceeding 88%, demonstrating the importance of network complexity in understanding MF mechanisms.
Multimodal approaches have increasingly gained attention for MF assessment. Hamann and Carstengerdes (2023) conducted a comparative analysis of EEG and fNIRS, showing that while EEG consistently captured spectral changes linked to fatigue, fNIRS data exhibited greater inter-individual variability. This underscores the need for methodological refinement in fNIRS-based analyses and supports the integration of complementary modalities. In a related study, Chen et al. (2023) employed simultaneous EEG-fNIRS recordings during a Stroop task to investigate conflict-related brain dynamics. They reported significant prefrontal activation in fNIRS and distinct event-related potentials (ERPs) in EEG, reinforcing the complementary value of electrophysiological and hemodynamic measures for decoding cognitive demands.
Technological advancements in wearable fNIRS systems have further extended their use into real-time applications, such as brain–computer interfaces (BCIs). For example, Varandas et al. (2022) developed a fatigue-adaptive BCI framework using subject-specific machine learning algorithms, achieving promising classification accuracy despite inter-subject variability. Similarly, Li et al. (2024) demonstrated the potential of fNIRS in monitoring driving fatigue during attention-demanding tasks. Although limited by sample size, the study showed that fNIRS effectively captured hemodynamic fluctuations aligned with fatigue markers, highlighting its relevance in safety-critical environments.
Beyond fNIRS, recent studies using EEG have demonstrated the potential of EC in capturing fatigue-related changes in brain communication. EC alterations, particularly in fronto-parietal regions, have been associated with diminished top-down regulatory control under fatigue. Longitudinal driving studies also revealed reduced EC correlated with behavioral signs of lowered alertness. Notably, multitasking conditions enhanced EC, whereas states of high fatigue did not, suggesting that fatigue may constrain the brain’s adaptive reorganization. Despite its promise, such EC-based insights remain largely unexplored in fNIRS research.
In EEG-based research on mental fatigue, EC methods have been increasingly used to reveal directed brain network dynamics under fatigue-inducing tasks. For instance, using Partial Directed Coherence (PDC) and graph theoretical analyses, Huang et al. (2016) demonstrated distinct topological shifts across frequency bands, with heightened local efficiency in the beta band during cognitively engaging tasks and increased global efficiency in the theta band at rest, reflecting the reconfiguration of functional networks under mental load (Huang et al., 2016). Dynamic Causal Modeling (DCM) has also been employed to track fatigue progression, showing that as fatigue increased across trials, the likelihood of forward model architectures being adopted also increased, suggesting evolving causal patterns linked to mental fatigue (Lin et al., 2019). Moreover, studies in simulated driving tasks using Granger-causality-based directed networks revealed reduced and reorganized information flow among cortical regions in fatigued states, indicating that fatigue significantly alters the causal architecture of brain connectivity (Li et al., 2022).
Collectively, these findings highlight the sensitivity of EC analysis in EEG to mental fatigue and provide strong motivation for applying similar approaches, such as generalized partial directed coherence (GPDC) (Baccalá et al., 2007), to fNIRS data. Applying EC to fNIRS is both non-trivial and advantageous: non-trivial because fNIRS signals reflect slow hemodynamic responses rather than direct neural activity, posing challenges for temporal resolution, modeling, and disentangling task-versus fatigue-related effects; yet advantageous because fNIRS provides higher spatial specificity for cortical hemodynamics, reduced susceptibility to electrical and muscular artifacts, and greater tolerance of movement, making it suitable for naturalistic and applied settings. These unique strengths underscore the growing utility of fNIRS in fatigue research, from fundamental investigations of cortical dynamics to applied systems in BCI and driving. Nonetheless, most current studies rely on statistical or undirected measures of connectivity, while the directionality of brain interactions, captured through EC, remains underexplored in the context of mental fatigue.
1.2 Research gap and objectives
A substantial body of research has used fNIRS to study the effects of mental and physical fatigue. However, the majority of prior work has emphasized signal-level changes (e.g., oxygenated hemoglobin amplitude) or undirected FC measures such as Pearson correlation. While these approaches provide useful insights into regional activation and statistical dependencies, they cannot capture the directionality of neural communication. EC, in contrast, quantifies the causal influence one brain region exerts on another, offering a more mechanistic view of how cortical networks reorganize under fatigue.
Despite its potential, EC remains largely unexplored in fNIRS-based fatigue research. Most existing applications of EC have been conducted with EEG, where methods such as Granger causality and Transfer Entropy have been used to detect mental fatigue. To our knowledge, no previous study has applied EC in the context of fNIRS for fatigue detection. This gap is particularly noteworthy given that fNIRS provides unique advantages over EEG, including higher spatial specificity for cortical regions and greater robustness to electrical and motion artifacts. At the same time, applying EC to fNIRS is non-trivial due to its lower temporal resolution and susceptibility to systemic physiological signals, highlighting the need for methodological innovation.
To address this gap, the present study investigates how mental fatigue alters the directionality and strength of brain network interactions during sustained task engagement. Specifically, we ask: How does mental fatigue modulate the causal dynamics of cortical networks as measured by EC? By examining directional and time-resolved interactions, we aim to advance the neurophysiological understanding of fatigue and contribute toward developing more sensitive biomarkers for real-time fatigue monitoring. For this purpose, we selected a publicly available multimodal Stroop-task dataset (Chen et al., 2023), which provides continuous recordings and well-defined cognitive load manipulations ideally suited for fatigue analysis.
Methodologically, we employed GPDC for EC estimation. GPDC extends the Granger causality framework to the frequency domain and incorporates normalization, ensuring scale-invariant results across channels. Compared with Transfer Entropy, GPDC is computationally efficient, interpretable in terms of oscillatory dynamics, and well-suited for short-window analysis, an essential property for tracking the evolving impact of fatigue.
2 Methods
This study employed a data-driven pipeline to analyze the dynamic EC patterns underlying MF using fNIRS. We leveraged a publicly available multimodal dataset featuring continuous EEG and fNIRS recordings during a Stroop task. Our methodology consisted of five main stages: data selection and description, signal preprocessing, EC computation via GPDC, graph-based modeling of brain network dynamics and visualization of the EC flow among brain regions (see Figure 1). Each step was designed to preserve the temporal resolution of the signals and enable frequency-specific analysis of directed brain interactions across multiple time windows.
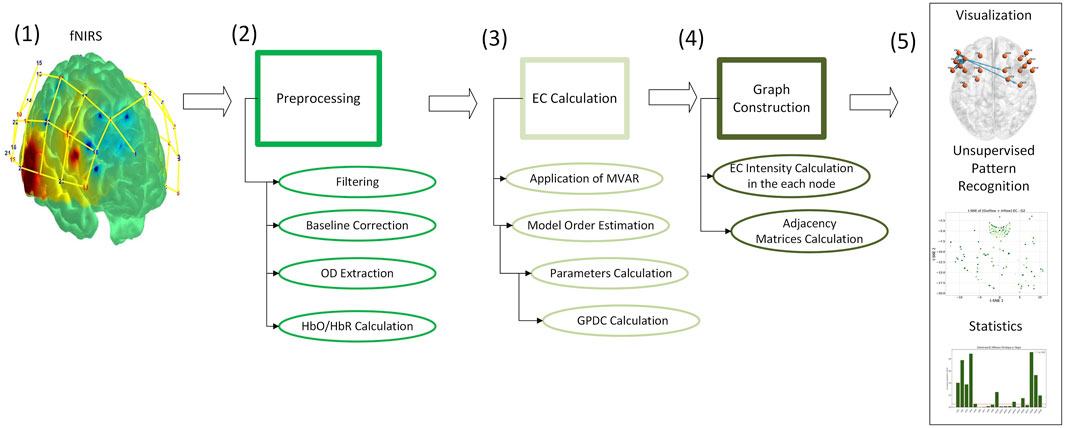
Figure 1. Schematic overview of the analysis pipeline for EC modeling using fNIRS data. The process includes: (1) fNIRS signals are obtained from publicly available recordings (Chen et al., 2023); (2) preprocessing to obtain HbO/HbR signals; (3) EC estimation via MVAR and GPDC; (4) construction of directed graphs using EC intensity; and (5) visualization, pattern recognition, and statistical analysis.
It is worth mentioning that GPDC is preferred over alternatives such as Granger Causality (GC) and Transfer Entropy (TE) because it provides a frequency-domain representation of directional interactions that is both statistically robust and computationally efficient. Unlike classical GC, which is typically implemented in the time domain, GPDC is derived from multivariate autoregressive (MVAR) models and normalizes the influence of each signal by its innovation variance, thereby reducing bias due to amplitude scaling and allowing for direct comparison across connections (Baccalá and Sameshima, 2001; Baccalá and Sameshima, 2007). Compared with transfer entropy (TE), which is model-free but computationally demanding and less interpretable in terms of oscillatory dynamics, GPDC provides clearer physiological interpretability by decomposing directed connectivity across frequency bands and accounting for indirect pathways through its multivariate formulation. This reduces spurious detections common in pairwise approaches and makes GPDC particularly relevant for fNIRS and EEG studies of fatigue, where slow hemodynamic and neural oscillations are of interest (Baccalá and Sameshima, 2001; Baccalá and Sameshima, 2007; Sameshima and Baccalá, 2014a).
2.1 Data description
The fNIRS and EEG recordings used in this study originate from the open-access multimodal dataset first published by Shin et al. (2018), which simultaneously acquired EEG and fNIRS signals during cognitive tasks. A secondary release of this dataset, incorporating additional curation, preprocessing, and expanded documentation, was subsequently provided by Chen et al. (2023). In the present work, we rely on this latter release while acknowledging the original data collection by Shin et al. (2018).
The dataset comprises recordings from 21 healthy adult participants (9 females, 12 males; age range: 20–30 years; mean age:
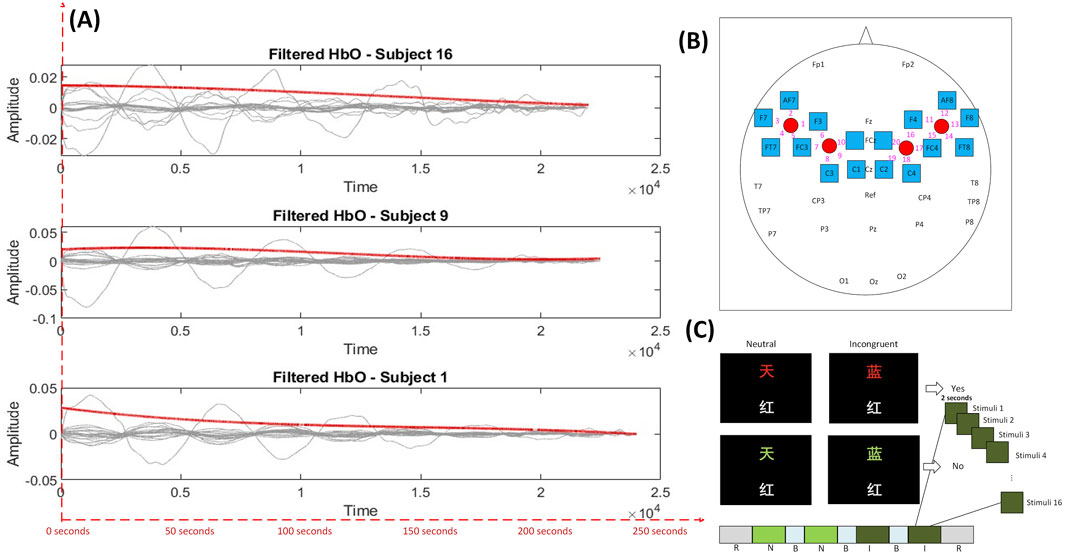
Figure 2. (A) Filtered HbO signals from three representative subjects (Subjects 16, 9, and 1), demonstrating the temporal evolution of hemodynamic responses following preprocessing. The red line represents the smoothed average trend across the selected channels, while the red dashed index line at the bottom indicates time in seconds. (B) Sensor layout on the scalp, illustrating fNIRS channel locations and their corresponding cortical projections based on the 10–20 system (redrawn based on Figure 2 in (Chen et al., 2023)). (C) Experimental blocks: R = rest, N = neutral, B = break, I = incongruent (redrawn based on Figure 1 in (Chen et al., 2023)).
EEG signals were acquired from 34 scalp electrodes at a sampling rate of 1000 Hz, providing high temporal resolution. Concurrently, fNIRS signals were recorded at 100 Hz using a NIRScout system equipped with 4 sources and 16 detectors, producing 20 measurement channels covering frontal and parietal cortices, regions strongly implicated in fatigue, related neural modulation (see Figure 2B). While the present study focuses on EC analysis using only the fNIRS data, the synchronized dual-modality recordings enable future multimodal extensions.
Behavioural data were also recorded, including accuracy, reaction time, and accuracy/reaction time across the two stimulus conditions. As reported previously (Table 3; Figure 5 in the original study), incongruent trials showed significantly lower accuracy, longer reaction times, and reduced accuracy/reaction time compared to neutral trials, demonstrating a robust Stroop effect consistent with prior literature. However, because these behavioural measures are not directly related to the present focus on mental fatigue and effective connectivity, they were not included in our analysis.
The Stroop task paradigm is widely recognized for its ability to elicit executive control, attentional regulation, and conflict monitoring by requiring participants to resolve conflicts between the semantic meaning and the visual color of stimuli. These processes are closely tied to the onset and progression of mental fatigue, making the task particularly suited for the present study. Importantly, to the best of our knowledge, this dataset represented the only publicly available resource at the time that provided continuous, unsegmented recordings of both EEG and fNIRS for fatigue assessment. Its continuous nature, structured block design, and integration of behavioral and physiological measures render it uniquely suited for windowed or time-resolved modeling of neurophysiological changes. As such, it provides a robust foundation for exploring spatiotemporal dynamics of mental fatigue and the associated directional brain network interactions.
The continuous fNIRS recordings provided in the original dataset have a duration of more than 199 s per participant, as reported in Table 2 of the dataset description (Chen et al., 2023).
2.2 Preprocessing
In this stage, the raw light intensity signals at 785 nm and 850 nm wavelengths were first converted to optical density (OD) using a logarithmic transformation, as shown in Equation 1:
where
Next, the hemodynamic concentrations of HbO and HbR were estimated using the modified Beer–Lambert law (MBLL) (Kocsis et al., 2006), which relates changes in OD to chromophore concentration. This estimation incorporates the extinction coefficients of hemoglobin at two wavelengths, the differential pathlength factor (DPF) to account for photon scattering, and the source-detector separation distance
Following concentration estimation, baseline correction was applied by subtracting the mean of the signal during the first and last 30 s of each trial to minimize inter-trial variability. Finally, the baseline-corrected HbO and HbR signals were filtered using a third-order Butterworth bandpass filter in the 0.015–0.2 Hz range to remove low-frequency drifts and high-frequency physiological artifacts, retaining the relevant hemodynamic fluctuations for analysis.
2.3 EC calculation
To quantify EC among fNIRS channels, we employed an adaptive multivariate autoregressive (AMVAR) model (Sameshima and Baccala, 2014b) to capture the non-stationary nature of brain signals. Model fitting was performed using the Vieira–Morf algorithm (Morf et al., 1978). GPDC was computed on HbO signals sampled at 100 Hz using sliding 30 s windows (3,000 samples) with 50% overlap; we summarized spectra into 10 bins from 0.01 to 0.20 Hz (0.01-Hz steps), focusing subsequent analyses on 0.10–0.20 Hz. This window length provided sufficient frequency resolution (
The autoregressive model order was set to
Finally, GPDC was estimated in the 0.10–0.20 Hz band, a frequency range that captures slow hemodynamic oscillations most relevant to fatigue while minimizing contamination from respiration (
After estimating the MVAR coefficients, we computed Generalized GPDC, a frequency-domain metric that quantifies directed interactions while remaining invariant to signal scaling. Unlike its predecessor, PDC, which can be biased by amplitude differences, GPDC normalizes each channel’s influence by the total outflow across all connections. In our analysis, GPDC was computed across 10 frequency bins ranging from
The squared magnitude of GPDC from channel
Here,
To assess the statistical significance of GPDC values, a surrogate bootstrap approach was employed. For each subject, 1,000 surrogate datasets were generated by phase-randomizing the Fourier components of each channel’s time series, thereby preserving the spectral properties of individual signals while eliminating inter-channel dependencies. The MVAR model and GPDC were recomputed for each surrogate dataset to construct an empirical null distribution. Observed GPDC values exceeding the 95th percentile of this distribution were considered statistically significant. This procedure was implemented in Python using custom scripts and applied consistently across all six experimental periods for each subject.
2.4 Graph construction
After computing the GPDC matrices with dimensions
To characterize the role of each channel, we computed the EC intensity as the difference between the total outgoing and incoming connectivity, as defined in Equation 4:
This value reflects whether a node predominantly acts as a source (positive value, driver) or a sink (negative value, receiver) within the network.
Distinct temporal segment of the task. For each graph, we created a corresponding . node and . edge file to be used with the BrainNet Viewer toolbox (Xia et al., 2013)
2.5 Data visualization
For this stage, we utilized the.node and.edge files generated in the previous step to visualize EC patterns using the BrainNet Viewer toolbox (see Figure 3A). BrainNet Viewer is a MATLAB-based visualization tool that enables 3D rendering of brain networks by projecting nodes and weighted edges onto a cortical surface. In our case, each node represented an fNIRS channel with its spatial coordinates and EC intensity, while each edge reflected the strength and direction of the averaged GPDC-based connectivity between channel pairs.
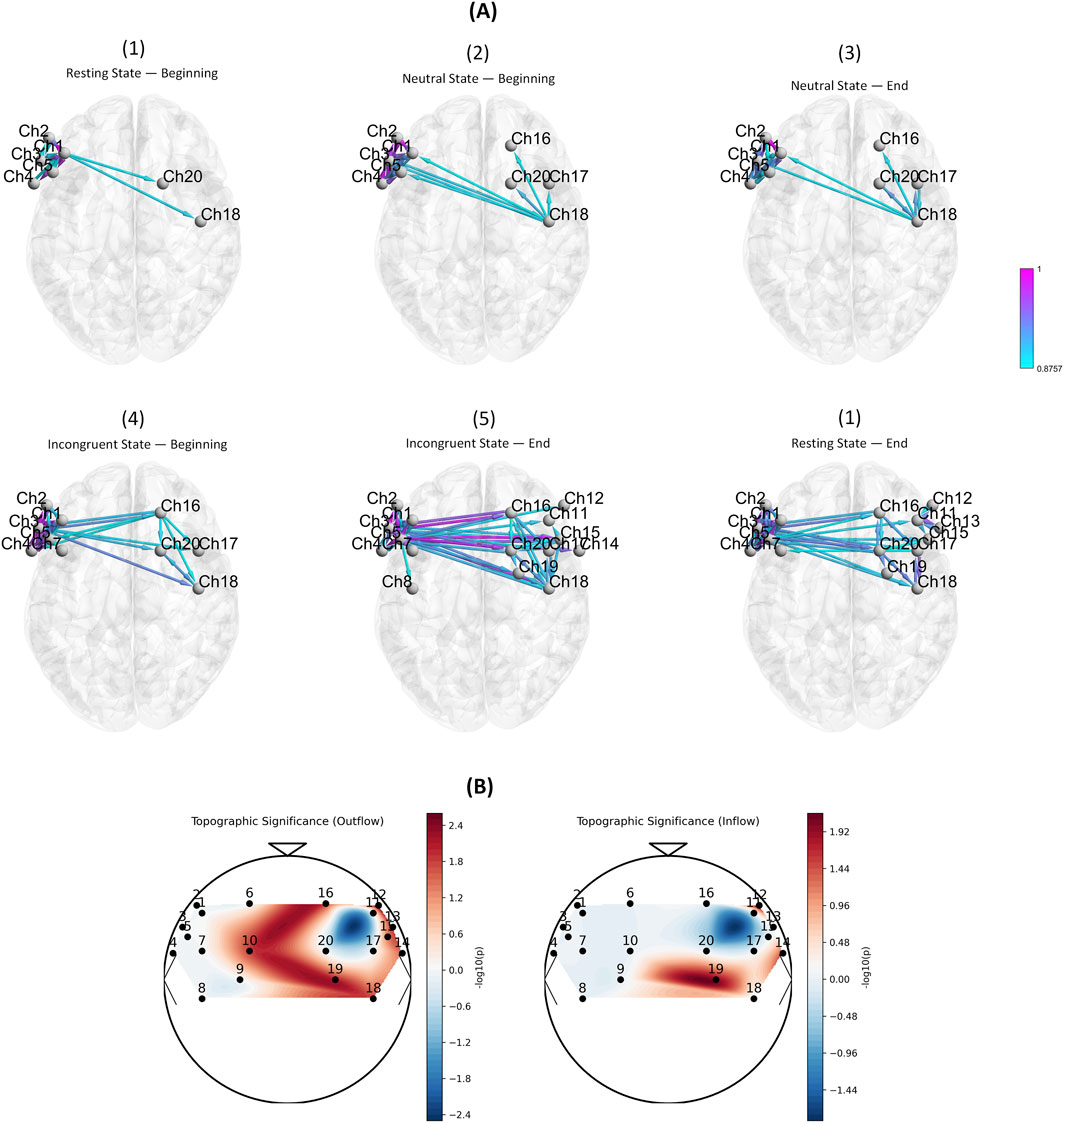
Figure 3. (A) Visualization of directed EC based on GPDC across six consecutive time windows. Each panel represents one temporal segment: resting state (beginning and end), neutral state (beginning and end), and incongruent state (beginning and end). Nodes correspond to fNIRS channels, while edge colors indicate normalized GPDC values (0–1), reflecting the strength and direction of information flow. The progression illustrates how network connectivity evolves from sparse, localized interactions in early windows to denser, more widespread connections under increasing cognitive demand. (B) Topographic significance maps of EC differences between pre-fatigue and fatigue conditions. Outflow (left) and inflow (right) show significant changes predominantly in frontal and motor regions, especially over medial and right-hemispheric areas.
For visualization, we first masked edges by surrogate-based significance, then retained the top 15% of the remaining edge weights for clarity.
3 Results
3.1 Temporal dynamics of HbO signals
Figure 2A presents the filtered HbO signals over time for three representative subjects (Subjects 1, 9, and 16). Each gray line represents a different fNIRS channel, while the red line indicates the mean trend across channels. A gradual decline in the amplitude of HbO signals can be observed over the duration of the task, which aligns with typical hemodynamic patterns associated with increasing MF (De Roever et al., 2018). This downward trend, indicative of reduced cortical activation or neurovascular responsiveness, was consistently observed across all 21 participants in the dataset. Although we present only three examples here for brevity, this pattern was robust and broadly generalizable across the entire cohort.
3.2 Temporal evolution of EC
The temporal evolution of EC revealed a progressive reorganization of cortical networks across resting and task states (Figure 3A). In the initial resting state (Panel 1), connectivity was sparse, with only a few directed links between frontal and motor regions (e.g., CH2–CH20, CH5–CH18), reflecting a baseline state with minimal integration demands. As the neutral task began (Panels 2–3), connectivity became denser, particularly across right frontal and motor regions (CH16–CH20–CH18–CH17), indicating increased recruitment of executive and motor systems to sustain task engagement. During the incongruent task (Panels 4–5), connectivity patterns expanded further, with widespread bidirectional links involving prefrontal (CH12–CH15), motor (CH16–CH19), and temporal (CH14) regions. The end of the incongruent condition (Panel 5) exhibited the highest density of connections, reflecting strong integration across prefrontal–motor circuits under elevated cognitive load. Finally, in the concluding resting state (Panel 6), connectivity did not return to its initial sparse configuration; instead, persistent frontal–motor links remained, suggesting that task demands and fatigue effects carried over into the post-task resting period.
Consistent with these temporal trends, channel-level analyses (Tables 1, 2; Figure 3B) highlighted specific cortical regions showing marked differences between pre-fatigue and fatigue states. The medial premotor cortex (CH10) demonstrated increased outflow during fatigue, while the right anterior prefrontal cortex (CH12) showed the most pronounced alterations, with strong changes in both inflow and outflow. Additional effects were observed in the right inferior frontal gyrus (CH13) and right superior temporal gyrus (CH14), both of which displayed altered inflow and outflow. Further outflow differences emerged in the right premotor cortex (CH15), right middle frontal gyrus (CH16), and right primary motor cortex (CH18). Finally, the medial motor cortex (CH19) exhibited robust changes in both inflow and outflow. Taken together, these findings indicate that fatigue selectively modulates connectivity within prefrontal, premotor, and motor regions, with particularly strong effects in right-hemispheric circuits.
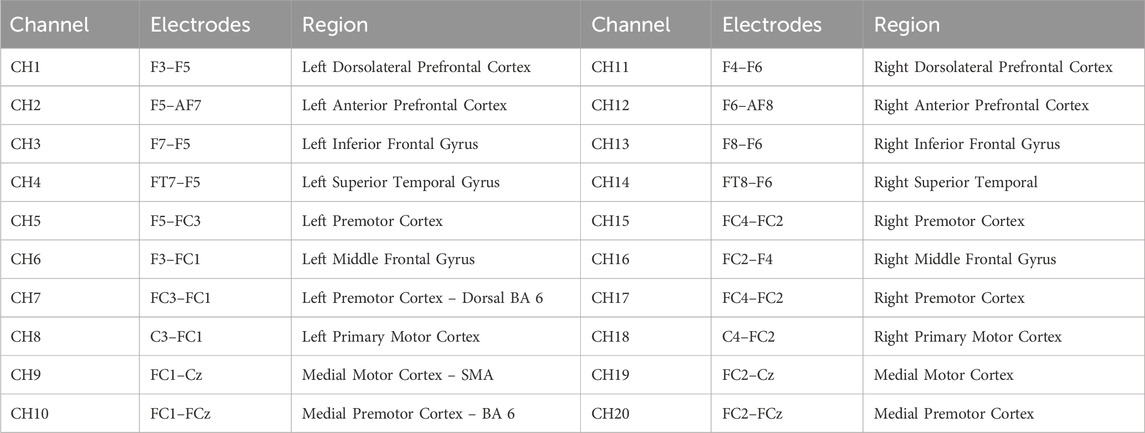
Table 1. Channel mapping and corresponding brain regions.
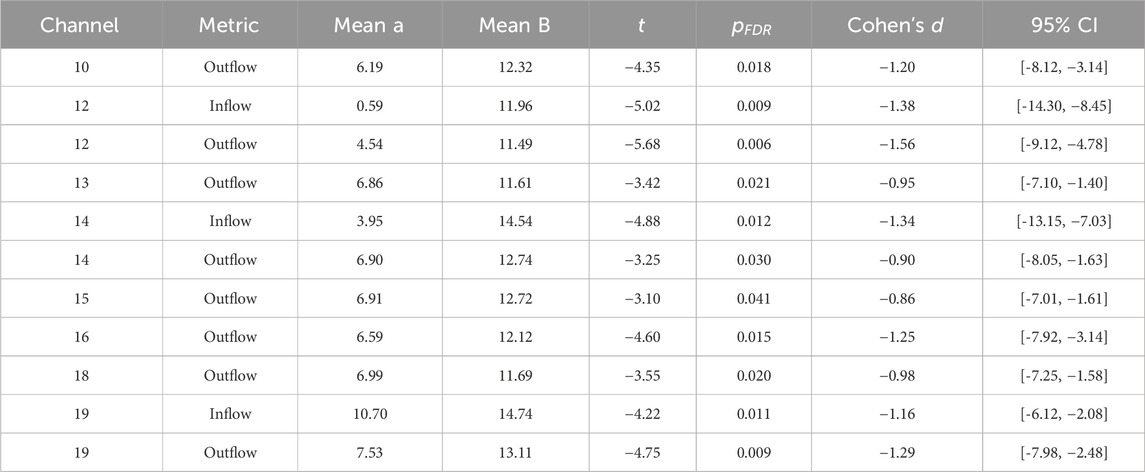
Table 2. Significant channel-level EC differences between pre-fatigue (Group A) and fatigue (Group B). Reported are means,
In line with the observed reductions in density and assortativity, alongside localized disruptions in prefrontal and motor hubs, these results provide converging evidence that fatigue reduces the flexibility of effective connectivity networks (Genova et al., 2010). Rather than supporting adaptive reconfiguration across conditions, fatigued networks appear to adopt a more constrained and less dynamic structure.
3.3 Statistical analysis of channel-wise EC changes
To evaluate the effect of MF on EC, we statistically compared EC patterns between the pre-fatigue (G1) and fatigue (G6) states. For each subject and each of the 20 channels, we computed a 40-dimensional EC vector composed of both incoming and outgoing connections. These vectors were averaged within each condition to yield one representative EC profile per channel per subject.
To control for the inflated risk of false positives arising from multiple comparisons across 20 channels, we applied a false discovery rate (FDR) (Benjamini and Hochberg, 1995) correction using the
At the global network level, we further examined changes in network flexibility using a range of graph-theoretical metrics, including density, clustering coefficient, in/out-degree variability, entropy of the EC matrices, and intensity-based measures (mean, variance, entropy, Gini coefficient, and correlations with strength). Independent
At the channel level, several cortical regions showed marked EC alterations between pre-fatigue and fatigue states (Table 2). The medial premotor cortex (CH10) exhibited increased outflow, while the right anterior prefrontal cortex (CH12) demonstrated the largest overall changes, with pronounced increases in both inflow and outflow. Additional outflow differences were observed in the right inferior frontal gyrus (CH13), right superior temporal gyrus (CH14), right premotor cortex (CH15), right middle frontal gyrus (CH16), and right primary motor cortex (CH18). The medial motor cortex (CH19) also showed significant changes in both inflow and outflow, underscoring its central role in fatigue-related modulation. Notably, most significant alterations were concentrated in right-hemispheric prefrontal and motor regions, highlighting the lateralized vulnerability of executive and motor control networks to fatigue.
To complement the numerical results, Figure 3B presents topographic maps illustrating the spatial distribution of significant inflow and outflow differences. Warmer colors correspond to higher statistical significance
4 Discussion
This study investigated the temporal dynamics of EC during a cognitively demanding Stroop task using fNIRS signals analyzed with GPDC. By combining hemodynamic measures with graph-theoretical modeling, we revealed converging evidence of fatigue-related changes at both the signal and network levels. Specifically, a gradual decline in HbO amplitude was consistently observed across participants, accompanied by progressive alterations in EC patterns that reflected a loss of network flexibility. Together, these findings demonstrate that sustained cognitive load reshapes cortical communication, leading to sparser, less adaptive, and more stereotyped connectivity configurations.
The reduction in HbO amplitude is consistent with prior studies linking decreased cortical activation to mental fatigue (De Roever et al., 2018). This diminished hemodynamic response likely reflects reduced neurovascular coupling efficiency or attenuated neuronal engagement over time. Beyond amplitude changes, EC analyses provided a more detailed picture of how fatigue alters large-scale brain organization. Early in the task, networks exhibited broader and more distributed connections, including interhemispheric links between frontal and motor regions. As the task progressed, however, connectivity became increasingly localized and repetitive, suggesting a gradual erosion of network flexibility. Such patterns align with the neural efficiency hypothesis, whereby the fatigued brain conserves limited cognitive resources by relying on fewer, more specialized pathways, potentially shifting toward more rigid and automatic processing strategies (Boksem et al., 2005).
At the network level, graph-theoretical metrics confirmed these trends. We found significant reductions in density and assortativity of intensity, indicating that fatigued networks were both sparser and less structured in their distribution of strong connections. In contrast, in-degree and out-degree variability increased significantly, suggesting greater dispersion in the way nodes send and receive information. This imbalance reflects a departure from coordinated, well-distributed communication toward fragmented dynamics dominated by a subset of regions. Taken together, these changes portray a system that is less integrated and less adaptive, hallmarks of fatigue-related decline in cognitive control.
At the regional level, channel-wise analyses identified cortical hubs that were disproportionately affected by fatigue. The right anterior prefrontal cortex (CH12) exhibited the most pronounced alterations, with marked increases in both inflow and outflow, underscoring its role as a critical hub for executive regulation and integrative processing. Significant outflow changes were also observed in the right inferior frontal gyrus (CH13) and superior temporal gyrus (CH14), suggesting that inhibitory control and auditory–attentional functions were disrupted. Alterations in premotor and motor regions, including CH15, CH16, CH18, and CH19, indicate compensatory adjustments in motor planning and execution, reflecting the additional effort required to sustain performance under fatigue. The medial premotor cortex (CH10) further showed heightened outflow, reinforcing its contribution to the coordination of motor and cognitive demands during prolonged task engagement. The predominance of right-hemispheric effects aligns with prior evidence that this hemisphere plays a central role in vigilance, sustained attention, and fatigue regulation.
The temporal evolution of EC across task phases further contextualizes these findings. While the initial resting state was characterized by sparse connectivity, the neutral condition elicited denser patterns involving frontal–motor regions. The incongruent condition, which imposed higher executive control demands, produced the most widespread connectivity, particularly in right frontal and motor cortices. Notably, connectivity did not fully return to baseline in the final resting state but remained elevated compared to the initial rest, suggesting lingering neural signatures of fatigue and sustained cognitive effort. This residual connectivity highlights the persistence of fatigue effects beyond task execution and points to altered recovery dynamics.
Methodologically, the present work demonstrates the utility of combining windowed GPDC with graph-based modeling to capture time-resolved and frequency-specific EC patterns from fNIRS data. The integration of statistical testing with FDR correction and topographic visualization provides a rigorous framework for identifying robust channel- and network-level effects. These tools hold promise for advancing real-time fatigue monitoring in applied contexts, such as aviation, education, and neurorehabilitation, where prolonged cognitive effort can compromise performance and safety.
Our results reveal that mental fatigue is characterized not only by diminished hemodynamic responses but also by a reorganization of connectivity toward sparser, more variable, and less flexible network structures. The vulnerability of right-hemispheric prefrontal and motor networks underscores their critical role in sustaining task performance and highlights potential targets for interventions. By integrating hemodynamic and connectivity analyses, this study provides a comprehensive account of the neural dynamics of fatigue, offering insights into both its mechanistic basis and its practical implications.
4.1 Limitations
Although the present study provides novel insights into EC dynamics under mental fatigue, several limitations should be acknowledged. First, fNIRS is limited to measuring cortical hemodynamic responses and cannot capture subcortical contributions, which are known to play an important role in fatigue regulation. This restricts the scope of interpretation to cortical-level interactions. Second, the dataset lacked behavioral and subjective fatigue markers (e.g., reaction time slowing, performance decline, or self-reported fatigue). While Stroop effects in accuracy and reaction time confirmed successful induction of cognitive conflict, these measures do not directly reflect the accumulation of fatigue. Future studies would benefit from incorporating multimodal indicators that combine neuroimaging with behavioral and subjective metrics to provide convergent validation.
Third, inter-subject variability in physiology, task engagement, and fatigue susceptibility may have influenced the observed EC patterns. Although FDR correction was applied to minimize false positives, this conservative approach also reduced the number of significant effects, underscoring the need for replication in larger and more diverse cohorts to improve generalizability. Fourth, our analysis was restricted to the first and last resting windows to provide a clean comparison between pre-fatigue and fatigue states. While this approach minimized confounding task-related influences, it also reduced temporal resolution and may have overlooked dynamic changes unfolding within the task segments themselves. Moreover, the assumption that the resting windows provide a stable baseline may not fully account for residual task effects or inter-individual variability in recovery. Future work should consider applying mathematical modeling approaches to disentangle task-related from fatigue-related connectivity changes more precisely.
In sum, the current findings highlight robust alterations in cortical EC associated with fatigue, but they should be interpreted in light of these methodological and conceptual constraints. Addressing these limitations in future studies will help establish more comprehensive and generalizable markers of fatigue, and may ultimately guide the development of neuroimaging-based tools for monitoring cognitive performance in high-stakes or prolonged task environments.
5 Conclusion
This study investigated the neural correlates of MF by applying GPDC to continuous fNIRS recordings during a Stroop task. We found that sustained cognitive load drives a progressive reorganization of cortical networks, characterized by a transition from distributed and flexible connectivity to more rigid and stereotyped configurations. These alterations were most pronounced in prefrontal and motor regions, particularly within right-hemispheric circuits that support executive control, attention, and motor planning. By integrating statistical analyses with graph-theoretical modeling and topographic visualization, we demonstrated that fatigue is marked not only by reduced hemodynamic responses but also by diminished network flexibility and altered information flow. This work addresses a critical gap in fatigue research by capturing the directed, time-resolved interactions among cortical regions, providing mechanistic insight into how sustained effort disrupts large-scale brain organization. The proposed EC-driven framework offers a promising foundation for real-time monitoring of cognitive fatigue, with potential applications in neuroergonomics, human–machine interaction, and performance management in high-stakes environments. Future studies should integrate behavioral outcomes and multimodal neural data (e.g., EEG–fNIRS fusion) to strengthen interpretability and generalizability. Nevertheless, the present findings underscore the promise of EC as a robust biomarker of mental fatigue and a tool for advancing brain-based monitoring systems in applied contexts.
Data availability statement
Publicly available datasets were analyzed in this study. This data can be found here: https://doi.org/10.6084/m9.figshare.c.6623431.v1.
Ethics statement
Ethical approval was not required for the study on human participants in accordance with the local legislation and institutional requirements. Written informed consent from the patients/participants or patients/participants legal guardian/next of kin was not required to participate in this study in accordance with the national legislation and the institutional requirements.
Author contributions
NAb: Methodology, Software, Validation, Visualization, Writing – original draft. NAr: Conceptualization, Methodology, Project administration, Supervision, Writing – review and editing.
Funding
The author(s) declare that no financial support was received for the research and/or publication of this article.
Conflict of interest
The authors declare that the research was conducted in the absence of any commercial or financial relationships that could be construed as a potential conflict of interest.
Generative AI statement
The author(s) declare that Generative AI was used in the creation of this manuscript. For proofreading and grammatical corrections in the paper.
Any alternative text (alt text) provided alongside figures in this article has been generated by Frontiers with the support of artificial intelligence and reasonable efforts have been made to ensure accuracy, including review by the authors wherever possible. If you identify any issues, please contact us.
Publisher’s note
All claims expressed in this article are solely those of the authors and do not necessarily represent those of their affiliated organizations, or those of the publisher, the editors and the reviewers. Any product that may be evaluated in this article, or claim that may be made by its manufacturer, is not guaranteed or endorsed by the publisher.
References
Abdollahpour, N., and Artan, N. S. (2025). Significant interactions in infant operculum regions when exposed to a bilingual environment: a resting-state fnirs study. Manuscript under review
Abdollahpour, N., Kakaraparthi, A., Valluru, C. S., and Artan, N. S. (2025). Advancing functional near-infrared spectroscopy (fnirs) with transformers: a prisma-driven systematic review. IEEE Access 13, 97794–97817. doi:10.1109/access.2025.3576056
Akaike, H. (1974). A new look at the statistical model identification. IEEE Trans. Automatic Control 19, 716–723. doi:10.1109/tac.1974.1100705
Al Imran, M. A., Nasirzadeh, F., and Karmakar, C. (2024). Designing a practical fatigue detection system: a review on recent developments and challenges. J. Saf. Res. 90, 100–114. doi:10.1016/j.jsr.2024.05.015
Baccalá, L. A., and Sameshima, K. (2001). Partial directed coherence: a new concept in neural structure determination. Biol. Cybern. 84, 463–474. doi:10.1007/pl00007990
Baccalá, L. A., Sameshima, K., and Takahashi, D. (2007). “Generalized partial directed coherence”, in 2007 15th International Conference on Digital Signal Processing, 163–166. doi:10.1109/icdsp.2007.4288544
Balia, M., Zenasni, F., Lepoittevin, M., Bianchi, R., Julian, A., Bodard, S., et al. (2025). Toward early detection of burnout: a systematic review of potential biomarkers. medRxiv 2025, 08. doi:10.1101/2025.08.05.25332953
Behrens, M., Gube, M., Chaabene, H., Prieske, O., Zenon, A., Broscheid, K.-C., et al. (2023). Fatigue and human performance: an updated framework. Sports Med. 53, 7–31. doi:10.1007/s40279-022-01748-2
Benjamini, Y., and Hochberg, Y. (1995). Controlling the false discovery rate: a practical and powerful approach to multiple testing. J. R. Stat. Soc. Ser. B Methodol. 57, 289–300. doi:10.1111/j.2517-6161.1995.tb02031.x
Boksem, M. A., Meijman, T. F., and Lorist, M. M. (2005). Effects of mental fatigue on attention: an erp study. Cognitive brain Res. 25, 107–116. doi:10.1016/j.cogbrainres.2005.04.011
Borghini, G., Astolfi, L., Vecchiato, G., Mattia, D., and Babiloni, F. (2014). Measuring neurophysiological signals in aircraft pilots and car drivers for the assessment of mental workload, fatigue and drowsiness. Neurosci. and Biobehav. Rev. 44, 58–75. doi:10.1016/j.neubiorev.2012.10.003
Chen, Z., Gao, C., Li, T., Ji, X., Liu, S., and Xiao, M. (2023). Open access dataset integrating eeg and fnirs during stroop tasks. Sci. Data 10, 618. doi:10.1038/s41597-023-02524-1
Craig, A., Tran, Y., Wijesuriya, N., and Nguyen, H. (2012). Regional brain wave activity changes associated with fatigue. Psychophysiology 49, 574–582. doi:10.1111/j.1469-8986.2011.01329.x
De Roever, I., Bale, G., Mitra, S., Meek, J., Robertson, N. J., and Tachtsidis, I. (2018). Investigation of the pattern of the hemodynamic response as measured by functional near-infrared spectroscopy (fnirs) studies in newborns, less than a month old: a systematic review. Front. Hum. Neurosci. 12, 371. doi:10.3389/fnhum.2018.00371
Derosière, G., Mandrick, K., Dray, G., Ward, T. E., and Perrey, S. (2013). NIRS-measured prefrontal cortex activity in neuroergonomics: strengths and weaknesses. Front. Hum. Neurosci. 7, 583. doi:10.3389/fnhum.2013.00583
Edde, M., Leroux, G., Altena, E., and Chanraud, S. (2021). Functional brain connectivity changes across the human life span: from fetal development to old age. J. Neurosci. Res. 99, 236–262. doi:10.1002/jnr.24669
Genova, H. M., Wylie, G. R., and DeLuca, J. (2010). Neuroimaging of fatigue. In Brain Imaging in Behavioral Medicine and Clinical Neuroscience. New York, NY: Springer New York, 369–381. doi:10.1007/978-1-4419-6373-4_22
Glavå, G., Skau, S., Lövdén, M., and Johansson, B. (2025). Differences in frontal cortical brain function between individuals suffering from pathological mental fatigue following acquired brain injury and healthy individuals. Behav. Brain Res. 490, 115631. doi:10.1016/j.bbr.2025.115631
Hamann, A., and Carstengerdes, N. (2023). Assessing the development of mental fatigue during simulated flights with concurrent eeg-fnirs measurement. Sci. Rep. 13, 4738. doi:10.1038/s41598-023-31264-w
Hinss, M. F., Brock, A. M., and Roy, R. N. (2022). Cognitive effects of prolonged continuous human-machine interaction: the case for mental state-based adaptive interfaces. Front. Neuroergonomics 3, 935092. doi:10.3389/fnrgo.2022.935092
Huang, R. S., Jung, T. P., Makeig, S., Lei, Q., Zhang, Y., Yin, Z., et al. (2016). Combining partial directed coherence and graph theory to analyse effective brain networks of different mental tasks. Front. Hum. Neurosci. 10, 235. doi:10.3389/fnhum.2016.00235
Jap, B. T., Lal, S., Fischer, P., and Bekiaris, E. (2009). Using eeg spectral components to assess algorithms for detecting fatigue. Expert Syst. Appl. 36, 2352–2359. doi:10.1016/j.eswa.2007.12.043
Kocsis, L., Herman, P., and Eke, A. (2006). The modified beer–lambert law revisited. Phys. Med. and Biol. 51, N91–N98. doi:10.1088/0031-9155/51/5/n02
Kunasegaran, K., Ismail, A. M. H., Ramasamy, S., Gnanou, J. V., Caszo, B. A., and Chen, P. L. (2023). Understanding mental fatigue and its detection: a comparative analysis of assessments and tools. PeerJ 11, e15744. doi:10.7717/peerj.15744
Li, G., Zhang, H., Pan, J., Zhang, D., Jiang, L., Che, Y., et al. (2022). Mental fatigue assessment based on eeg connectivity: a granger causality approach in a simulated driving task. Entropy 24, 1093. doi:10.3390/e24081093
Li, F., Bi, J., Liang, Z., Li, L., Liu, Y., and Huang, L. (2023). Functional near-infrared spectroscopy-based evidence of the cerebral oxygenation and network characteristics of upper limb fatigue. Bioengineering 10, 1112. doi:10.3390/bioengineering10101112
Li, T., Liu, P., Gao, Y., Ji, X., and Lin, Y. (2024). Advancements in fatigue detection: integrating fnirs and non-voluntary attention brain function experiments. Sensors 24, 3175. doi:10.3390/s24103175
Lin, C. T., Chiu, T. C., Wang, Y. K., Chuang, C. H., and Ko, L. W. (2019). Local gamma activity during Non-REM sleep in the context of sensory evoked K-Complexes. Front. Neurosci. 13, 1094. doi:10.3389/fnins.2019.01094
Lütkepohl, H. (2005). New introduction to multiple time series analysis. Berlin and Heidelberg: Springer.
Morf, M., Vieira, A., and Kailath, T. (1978). Covariance characterization by partial autocorrelation matrices. Ann. Statistics 6, 643–648. doi:10.1214/aos/1176344208
Peng, Y., Li, C., Chen, Q., Zhu, Y., and Sun, L. (2022). Functional connectivity analysis and detection of mental fatigue induced by different tasks using functional near-infrared spectroscopy. Front. Neurosci. 15, 771056. doi:10.3389/fnins.2021.771056
Saleem, A. A, Siddiqui, H. U. R., Raza, M. A., Rustam, F., Dudley, S., and Ashraf, I. (2016). A systematic review of physiological signals based driver drowsiness detection systems. Cognitive neurodynamics 17 (5), 1229–1259. doi:10.1007/s11571-022-09898-9
Sameshima, K., and Baccalá, L. A. (2014a). “Methods in neuroconnectivity: validating causal connectivity claims”, in Handbook of time series analysis (Wiley), 301–333.
Sameshima, K., and Baccala, L. A. (2014b). Methods in brain connectivity inference through multivariate time series analysis. CRC Press.
Sharma, P., Justus, J. C., Thapa, M., and Poudel, G. R. (2023). Sensors and systems for monitoring mental fatigue: a systematic review. arXiv preprint arXiv:2307.01666. doi:10.48550/arXiv.2307.01666
Shin, J., von Lühmann, A., Kim, D.-W., Mehnert, J., Hwang, H.-J., and Müller, K.-R. (2018). Simultaneous acquisition of eeg and nirs during cognitive tasks for an open access dataset. Sci. Data 5, 180003. doi:10.1038/sdata.2018.3
Tachtsidis, I., and Scholkmann, F. (2016). False positives and false negatives in functional near-infrared spectroscopy: issues, challenges, and the way forward. Neurophotonics 3, 030401. doi:10.1117/1.nph.3.3.030401
Trejo, L. J., Kubitz, K., Rosipal, R., Kochavi, R. L., and Montgomery, L. D. (2015). Eeg-based estimation and classification of mental fatigue. Psychology 6, 572–589. doi:10.4236/psych.2015.65055
Varandas, R., Lima, R., Bermúdez i Badia, S., Silva, H., and Gamboa, H. (2022). Automatic cognitive fatigue detection using wearable fnirs and machine learning. Sensors 22, 4010. doi:10.3390/s22114010
Wang, F., Wan, Y., Li, M., Huang, H., Li, L., Hou, X., et al. (2023). Recent advances in fatigue detection algorithm based on eeg. Intelligent Automation and Soft Comput. 35, 3573–3586. doi:10.32604/iasc.2023.029698
Xia, M., Wang, J., and He, Y. (2013). Brainnet viewer: a network visualization tool for human brain connectomics. PloS One 8, e68910. doi:10.1371/journal.pone.0068910
Yan, W., He, J., Peng, Y., Ma, H., and Li, C. (2024). Research on brain functional network property analysis and recognition methods targeting brain fatigue. Sci. Rep. 14, 22556. doi:10.1038/s41598-024-73919-2
Yan, Y., Guo, Y., and Zhou, D. (2025). Mental fatigue causes significant activation of the prefrontal cortex: a systematic review and meta-analysis of fnirs studies. Psychophysiology 62, e14747. doi:10.1111/psyp.14747
Yücel, M. A., Lühmann, A. v., Scholkmann, F., Gervain, J., Dan, I., Ayaz, H., et al. (2021). Best practices for fnirs publications. Neurophotonics 8, 012101. doi:10.1117/1.nph.8.1.012101
Keywords: mental fatigue, MF, effective connectivity, EC, pattern recognition, fNIRS
Citation: Abdollahpour N and Artan NS (2025) Effective connectivity-based recognition of mental fatigue patterns using functional near-infrared spectroscopy. Front. Electron. 6:1668332. doi: 10.3389/felec.2025.1668332
Received: 17 July 2025; Accepted: 23 September 2025;
Published: 15 October 2025.
Edited by:
Yeonsik Noh, University of Massachusetts Amherst, United StatesReviewed by:
Ahmet Ademoglu, Boğaziçi University, TürkiyeXuetong Zhai, University of Pittsburgh, United States
Copyright © 2025 Abdollahpour and Artan. This is an open-access article distributed under the terms of the Creative Commons Attribution License (CC BY). The use, distribution or reproduction in other forums is permitted, provided the original author(s) and the copyright owner(s) are credited and that the original publication in this journal is cited, in accordance with accepted academic practice. No use, distribution or reproduction is permitted which does not comply with these terms.
*Correspondence: N. Sertac Artan, bmFydGFuQG55aXQuZWR1