 Mesha Mbisana
 Tshepho Rebagamang2
 Dikabo Mogopodi
- 1Laboratory of Analytical Chemistry, Department of Chemistry, Faculty of Science, University of Botswana, Gaborone, Botswana
- 2Residues, Botswana National Veterinary Laboratory, Gaborone, Botswana
Climatic conditions such as drought, high temperatures, and pre-harvest rainfalls promote the occurrence of mycotoxins in grains. Contamination of staple food sources such as maize and sorghum means that many populations are at risk of being poisoned by mycotoxins. Hence the need for sensitive methods for their simultaneous analysis. Herein, a quick, easy, cheap, effective, rugged, and safe liquid chromatography tandem mass spectrometry (QuEChERS-LC-MS/MS) method for the simultaneous determination of ten mycotoxins in maize and sorghum is presented. The QuEChERS extraction procedure was optimized to maximize extraction recovery and minimize matrix effects while using relatively small quantities of organic solvents and acids. This method was validated according to Commission Implementing Regulation (EU) 2021/808, Commission Regulation (EC) No 1881/2006, and Regulation (EC) no. 401/2006. The developed method met the specified requirements. Recoveries of 80.77% to 109.83% and CVs below 15% were obtained. The correlation coefficient values (R2) were all above 0.98, and low limits of quantification ranging from 0.53 to 89.28 µg/Kg were recorded. The method was applied to 10 maize and 10 sorghum samples collected from markets in Botswana. Half of the samples had detectable mycotoxins, Aflatoxins, Fumonisins, T2-toxin, HT2-toxin, and Zearalenone. Two maize samples had levels of aflatoxin B1 above the maximum permitted level (2.55, 4.07 µg/Kg). These findings point to the necessity of more stringent monitoring of mycotoxins, particularly AFB1 in maize, as well as the value of regular assessment using LC-MS/MS.
1 Introduction
Mycotoxins are toxic metabolites produced by fungi. The fungi grow on food commodities such as cereals, coffee, fruits, nuts, oilseeds, and spices when there are favorable conditions (Awuchi et al., 2021). Currently, over 400 mycotoxins have been recorded, and 25% of food has been shown to be contaminated. (Tola and Kebede, 2016; Escrivá et al., 2017); however, only a few are of concern from a food safety perspective: Aflatoxins (AFs), Fumonisins (FBs), Ochratoxin A (OTA), Zearalenone (ZEA), Egort alkoids (EAs), Enniantis (ENs), Patulin (PAT), and Trichothecenes (Barac, 2018). Mycotoxins can affect human and animal health in different ways. Hepatoxicity (liver damage), genotoxicity (damage to genetic information), immunosuppression, and teratogenicity (damage to an embryo or fetus) are the most common.
The detrimental health consequences of mycotoxins have led to the establishment of maximum allowable levels in food and feed by several regulatory authorities. The European Food Safety Authority regulates mycotoxins of concern in the European Union, including AFs, FBs, OTA, trichothecenes, and ZEA (Lawley, 2013; EC, 2019). The same regulations have been adopted in Botswana, and they are implemented by the Botswana National Veterinary Laboratory (BNVL).
The occurrence of mycotoxins in Botswana has been scarcely studied. The latest study involved the identification of mycotoxigenic fungi in maize, millet, sorghum and peas using the polymerase chain reaction (Masitha et al., 2019). Various fungi species such as Aspergillus (flavus, niger), Fusarium (proliferatum, fujikuroi) and Alternaria were found in 40%, 37%, 27%, 10%, and 4% of millet, yellow maize, white maize, cowpeas, and red sorghum, respectively. This indicated possible exposure of humans and animals in Botswana to mycotoxins. However, the earlier findings by Mupunga (2013), who studied the natural contamination of peanuts, peanut butter, and sorghum with AFs in Botswana, reported that no food commodities in Botswana were contaminated. Numerous studies have been conducted on food and feed contamination in Africa. Chauhan summarized foods that are susceptible to aflatoxin contamination, as adapted from several sources. The study revealed that staple foods in most countries are contaminated with AFs, which shows that mycotoxins further jeopardize the United Nations sustainable development goals to end hunger and establish good health and nutrition (Chauhan, 2017).
Losses resulting from mycotoxin contamination of food are of serious economic impact as they are trade-related because produce often doesn’t meet the international trade standards. Consequently, the food is sold to consumers with low incomes, which results in lower profits (Imade et al., 2021). This is a common occurrence in most African counties (Marechera and Ndwiga, 2015). Considering these economic impacts and the fact that mycotoxins can be harmful even at low doses, it is critical to develop sensitive, effective, and rapid analytical methods for their determination, especially those that can simultaneously analyze multiple mycotoxins in food. Extraction, isolation, and cleanup are common steps in determining mycotoxins, followed by detection, qualification, and quantification.
The QuEChERS method, initially developed for pesticides (Anastassiades et al., 2003), has been applied to mycotoxins due to its benefits, as implied by its name, and has yielded high-quality results (Sirhan et al., 2014; Jo et al., 2021; Pantano et al., 2021). In terms of quantification, LC-MS/MS has proven to be the most effective method for measuring mycotoxins because it combines the separating power of high performance liquid chromatography with the detection power of triple quadrupole mass spectrometry (Pascale et al., 2019). The mass spectrometer enables simultaneous detection of many metabolites due to its unique principle, which offers unequalled sensitivity, detection limits, and speed (Hoffmann and Stroobant, 2007). As many as 33 different mycotoxins have been simultaneously determined using mass spectrometric detection (Spanjer et al., 2008). As a result of the wide variety of possible pairings between the stationary phase and the mobile phase, a separation may be designed to accommodate a wide variety of intricate problems. Several studies have reported the LC-MS/MS method in the determination of multiple mycotoxins, such as 13 different mycotoxins in maize and beans (Jo et al., 2021), 12 mycotoxins in cereal products and spices (Pantano et al., 2021), and 33 mycotoxins in peanuts, maize, raisins, and wheat (Spanjer et al., 2008). However, these studies do not include comprehensive validation based on appropriate regulations. Table 1 shows publications where LC-MS/MS was used to determine mycotoxins in various food matrices from 2018–2021. The standard technique for evaluating ZEA levels in edible vegetable oils and T2/HT2 mycotoxins in cereals and cereal products was recently released by the European Committee for Standardization (CEN) (CEN, 2017a; CEN, 2017b).
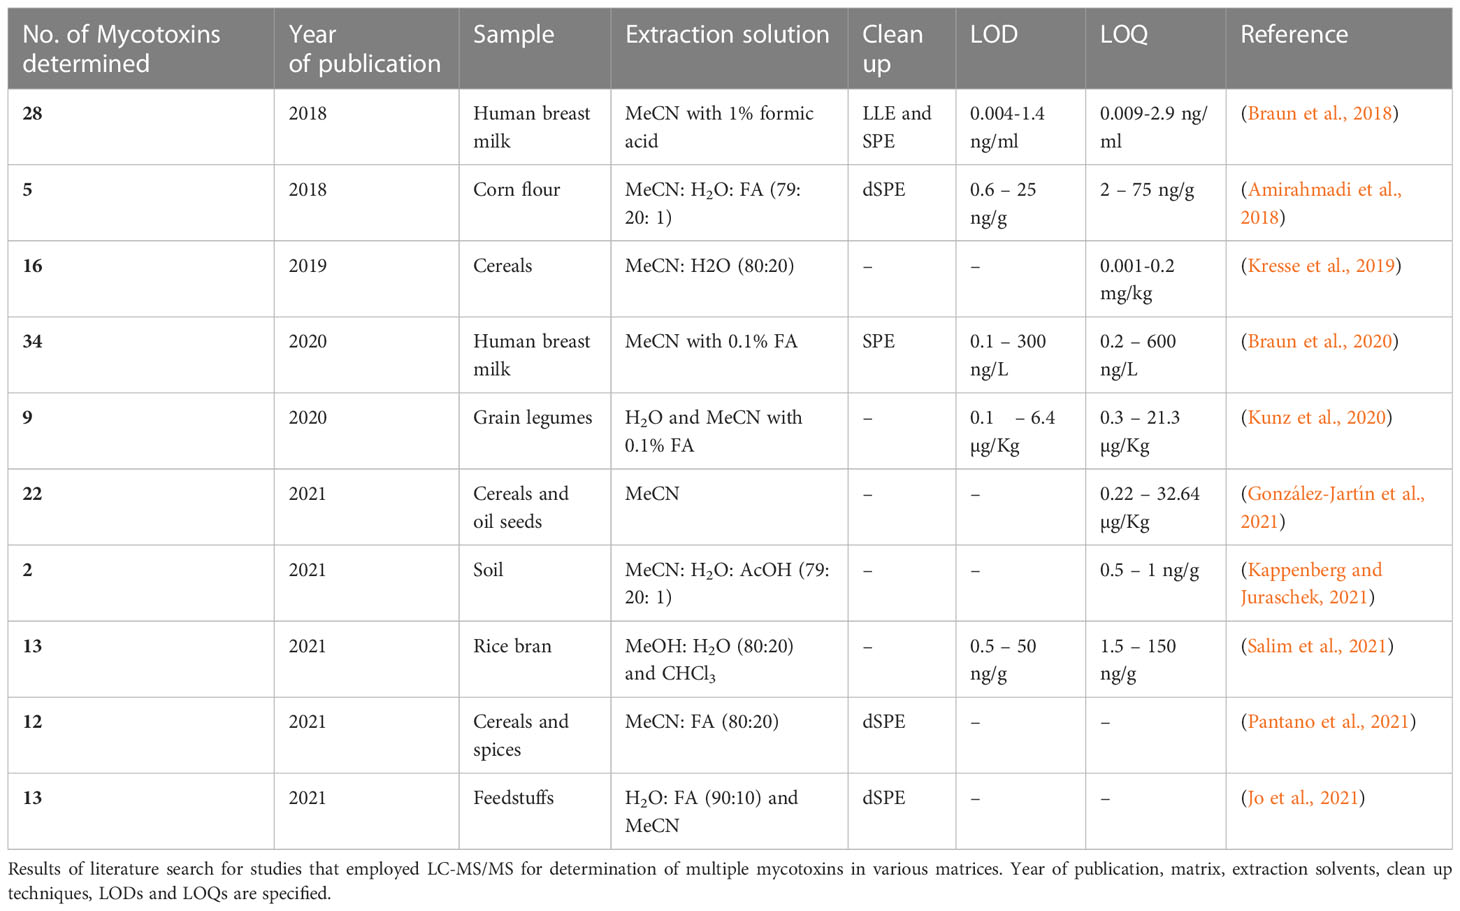
Table 1 Studies in which LC-MS/MS was used to determine multiple mycotoxins in various food matrices (2018-2021).
The purpose of this study was to develop an easy and sensitive approach for the identification of several mycotoxins using a simplified QuEChERS extraction method and LC-MS/MS detection. Using the one factor at a time (OFAT) approach, five factors affecting the QuEChERS extraction efficiency were optimized. The method was then validated according to Commission Implementing Regulation (EU) 2021/808 of 22 March 2021 and Regulation (EC) no. 401/2006. EC and applied to determine the occurrence of ten mycotoxins in maize and sorghum samples collected from markets in Botswana. To the best of our knowledge, this is the first report on the occurrence of multiple mycotoxins in maize and sorghum from Botswana.
2 Materials and methods
2.1 Chemicals and reagents
Mycotoxin standards (AFB1, AFB2, AFG1, AFG2, OTA, HT2-Toxin, T2-Toxin, FB1 and FB2) were purchased from Trigology Analytical Laboratory, Inc (USA), and ZEA was supplied by Sigma Aldrich (Austria). Lichrosolv chemicals and reagents were purchased from Merck, Supelco (Germany); ultrapure water (H2O) for chromatography (LC-MS grade), methanol (MeOH) (hyper-grade for LC-MS), and acetonitrile (MeCN) (gradient grade for liquid chromatography). Formic acid (FA) (ACS, >98%) and Dimethyl Sulfoxide (DMSO) (> 99.8%) were purchased from Carl Roth (Germany). Sodium chloride (NaCl) analytical reagent and magnesium sulphate (MgSO4) were obtained from Rochelle Chemicals (South Africa). Anhydrous MgSO4 was obtained from Parks Scientific.
2.2 Sample collection and treatment
Blank maize sample was purchased from Choppies supermarket in Gaborone, and a blank sorghum sample was provided by the Botswana National Veterinary Laboratory. Twenty samples were collected from Francistown and Gaborone city markets. Ten maize and ten sorghum samples (about 1 kg each) were finely blended using a laboratory blender and stored in a tightly closed plastic honey jar. All samples were kept in the freezer at -20°C until analysis.
2.3 Preparation of multi-mycotoxins standard solution
To obtain a standard solution of AFB1, AFB2, AFG1, AFG2 (10 µg/L), FB1, FB2, T2-toxin (250 µg/L), HT2-toxin, ZEA (100 µg/L), and OTA (40 µg/L), 200 µL of each AF standard (1.25 µg/mL), 1250 µL of FB1, FB2 and T2-toxin standards (5.00 µg/mL), 500 µL of HT2-toxin, ZEA standards (5.00 µg/mL) and 2000 µL of OTA standard (0.50 µg/mL) were all pipetted into a 25 mL volumetric flask, which was then filled to the mark using MeOH. The standard solutions were kept in amber screw-cap bottles at -20°C when not in use.
2.4 Preparation of maize and sorghum sample extracts via the modified QuEChERS procedure
In a 50 mL centrifuge tube, 2.0 ± 0.1g of finely ground sample was extracted with 8 mL MeCN/H2O (80:20 v/v) containing 0.1% FA. The mixture was homogenized for 30 seconds with an Ultra-Torrax T25 (Optolabor, Durban) probe homogenizer and then left to shake for 60 minutes on a PSU-20i electronic shaker for maximum extraction. After shaking was complete, 1 g of NaCl and/or 4 g MgSO4 was added to the mixture for extract cleaning and clear face separation, followed by vortex for 1 minute on a Heldolph multireax. The sample was centrifuged using a Thermo Scientific Haraeus Megafuge 16R Centrifuge (IAEA, Austria) for 10 minutes at 5000 rpm, 4°C. Thereafter, 5 mL of supernatant was collected into a glass tube and preconcentrated to 500 µL over a gentle stream of nitrogen gas (40°C) using a turbovap then reconstituted with 500 µL MeOH/H2O (50:50 v/v). The sample was then filtered through a 0.45 µm syringe filter and ready for injection into LC-MS/MS.
2.5 LC-MS/MS parameters and analysis
The analysis was performed using an ExionLC™ LC coupled with a binary gradient AD pump, AD autosampler, AD column oven and linear ion trap quadrupole (QTRAP 6500+) mass spectrometer with an electron spray ionization (ESI) (IonDrive TM Turbo V source) manufactured by AB Sciex Instruments (USA). Separation employed a Zorbax Eclipse Plus C18 (2.1 x 150 mm, 5 µm, Agilent, USA) column. Mobile phase A was composed of H2O + 0.1% FA while mobile phase B was composed of MeOH/MeCN (50/50 v/v) + 0.1% FA. The binary gradient was set up as follows: for the first 0.5 minutes, eluent B was kept at 5%, from 0.5 to 3 minutes eluent B was increased to 95% and kept at 95% from 4 to 6 minutes, then eluent B was dropped to a constant 5% from 6 to 7 minutes. The tabulated binary gradient is illustrated in Supplementary Table 1. The equilibration time was 1 minute, and the flow rate was kept at 0.5000 mL/min throughout the runs. During all experiments the column oven temperature was maintained at 40°C using the column thermostat, and the autosampler at 15°C. All measurements were done in multiple reaction monitoring (MRM) mode. The conditions of the ion source were as follows: source temperature 450°C, curtain gas 30 psi, collision gas high, ion source gasses (sheath and drying gas) 80 psi. The LC-MS/MS Instrument was controlled using the Analyst 1.7.0 software and data acquisitions were processed using MultiQuant™ 3.0.2 Software.
2.6 Method validation
Linearity, limits of detection (LODs), limits of quantification (LOQs), matrix effects, selectivity, precision (repeatability and reproducibility within-laboratory), recovery, and decision limit (CCα) were determined. Calibration curves were constructed from blank samples that were spiked to five concentrations which covered the analyte concentration range expected to be present in the experiments, Table 2. Matrix-matched calibration curves are used because the matrices in this study were complex; their components interfered with the analyte and altered the instrument response towards the analyte of interest. Peak area vs. mycotoxin concentrations were plotted to generate calibration curves. Linearity was evaluated visually and statistically using the product-moment correlation coefficient, R2.
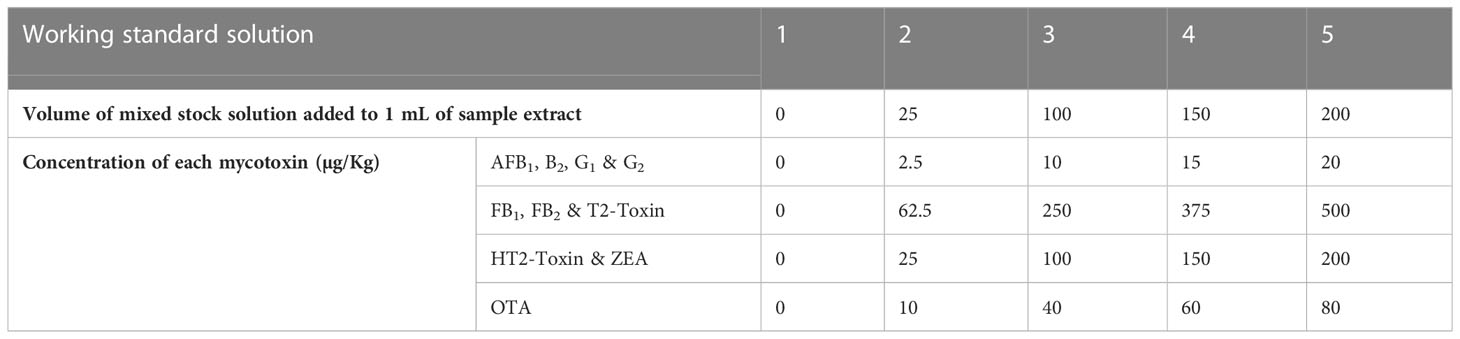
Table 2 Detailed dilution scheme for preparation of calibration standards.
LOD is the lowest concentration of an analyte that can be detected but is not quantifiable under the stated conditions of the method. On the other hand, LOQ is described as the minimum concentration of an analyte that is quantifiable. Since linear regression was used to linearly model the relationship between the concentration (x) of mycotoxins and the response (y), it can be expressed in a model such as where; y is the response signal, x is the concentration, b is the slope of the curve, and c is y-intercept of the curve. This model can then be used to compute the LOD and LOQ of the analytical method, which can be calculated using Equations 1 and 2. Where Sa is the standard deviation of the response. In this study, the standard deviation was estimated using the y-residuals (ŷ) of the response.
To evaluate recovery, 18 blank matrix samples were used. Six aliquots were fortified at each of 0.25, 1, and 1.5 times the maximum residue limit (MRL) of each mycotoxin. Samples were then extracted, and their concentrations were determined. The recovery for each sample and coefficients of variation (CVs) from the six results of each level were calculated using Equations 3, 4, and 5, respectively, where is the mean concentration.
The precision of this analytical method was determined based on quality control (QC) samples. Six replicate QC samples fortified with the multi-mycotoxin standard to yield concentrations equivalent to 0.25, 1, and 1.5 times the MRL of each mycotoxin were prepared and analyzed (n = 6 for 3 different concentrations). These steps were repeated in consecutive weeks to evaluate the within-laboratory repeatability. The mean concentrations, SD (Equation 4), and CVr (%) (Equation 5) of the fortified samples were calculated. The total ion flow chart and MS/MS spectrum of each mycotoxin for the QC sample fortified with multi-mycotoxin standard at MRL are presented in Supplementary Figure 1 and Supplementary Figure 2 respectively.
“CCα is the limit at and above which it can be concluded with an error probability of α that a sample is non-compliant” (EU, 2021). CCα was determined by analyzing 20 blank samples per matrix fortified with the analyte (s) at MRL concentrations. The mean concentration at MRL plus 1,64 times the corresponding standard measurement uncertainty at MRL equals CCα (α = 5%) (Equation 6). CCα values for each mycotoxin are shown in Table 3.
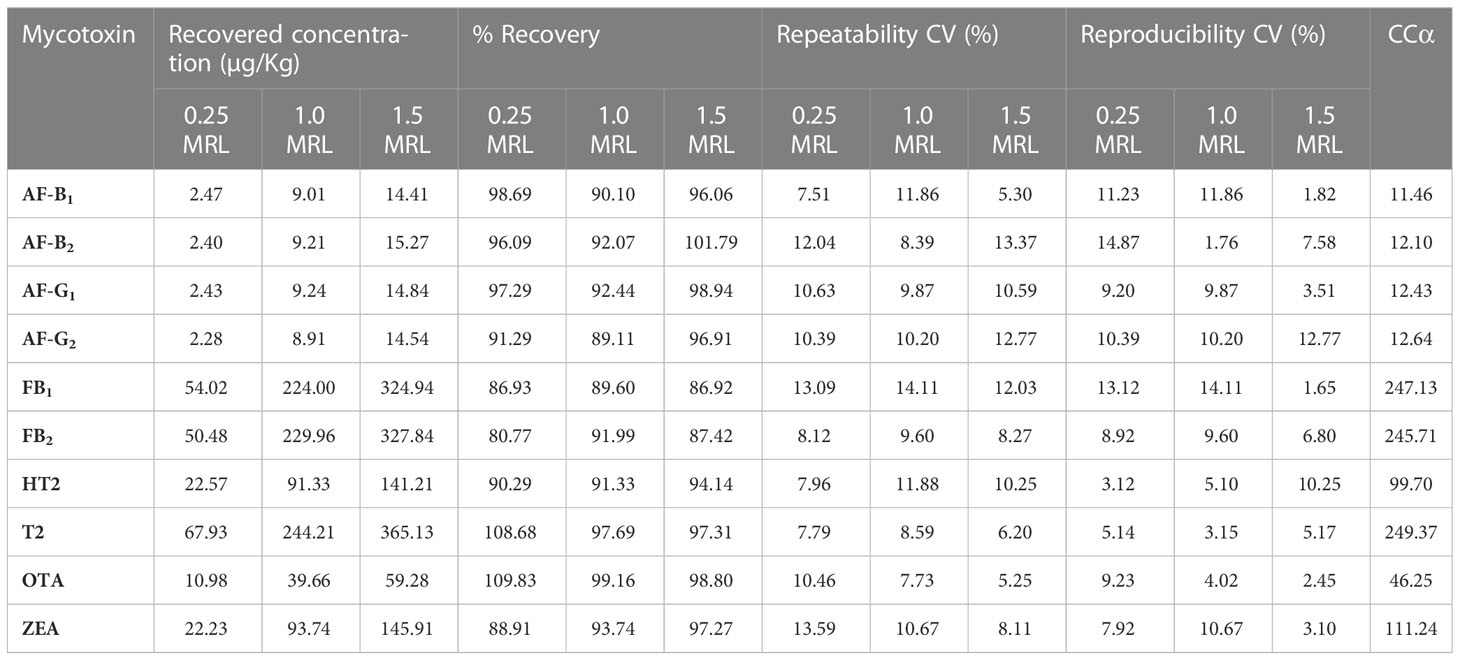
Table 3 Percentage Recoveries, coefficients of variation and decision limits from the validation study.
3 Results and discussion
3.1 LC-MS/MS optimization
ESI and MS/MS parameters were carefully optimized to obtain the ideal analytical conditions for detection of the selected mycotoxins (Table 4). Fragmentation of all target mycotoxins was studied through a full-scan analysis. The most intense ion in the fragmentation was selected for quantitation, and the second intense ion was chosen for qualification. According to the Commission Implementing Regulation (EU) 2021/808 of 22 March 2021, at least two ion transitions should be used for the monitoring of each target analyte in an instrumental method (EU, 2021). Furthermore the literature reports most of the product ions that have been used for the quantification of multiple mycotoxins (Jo et al., 2021; Pantano et al., 2021; Salim et al., 2021). MRM was established in a positive ion mode. Complete MS/MS parameters are summarized in Table 4 and Supplementary Figure 3 shows chromatograms of each mycotoxin.
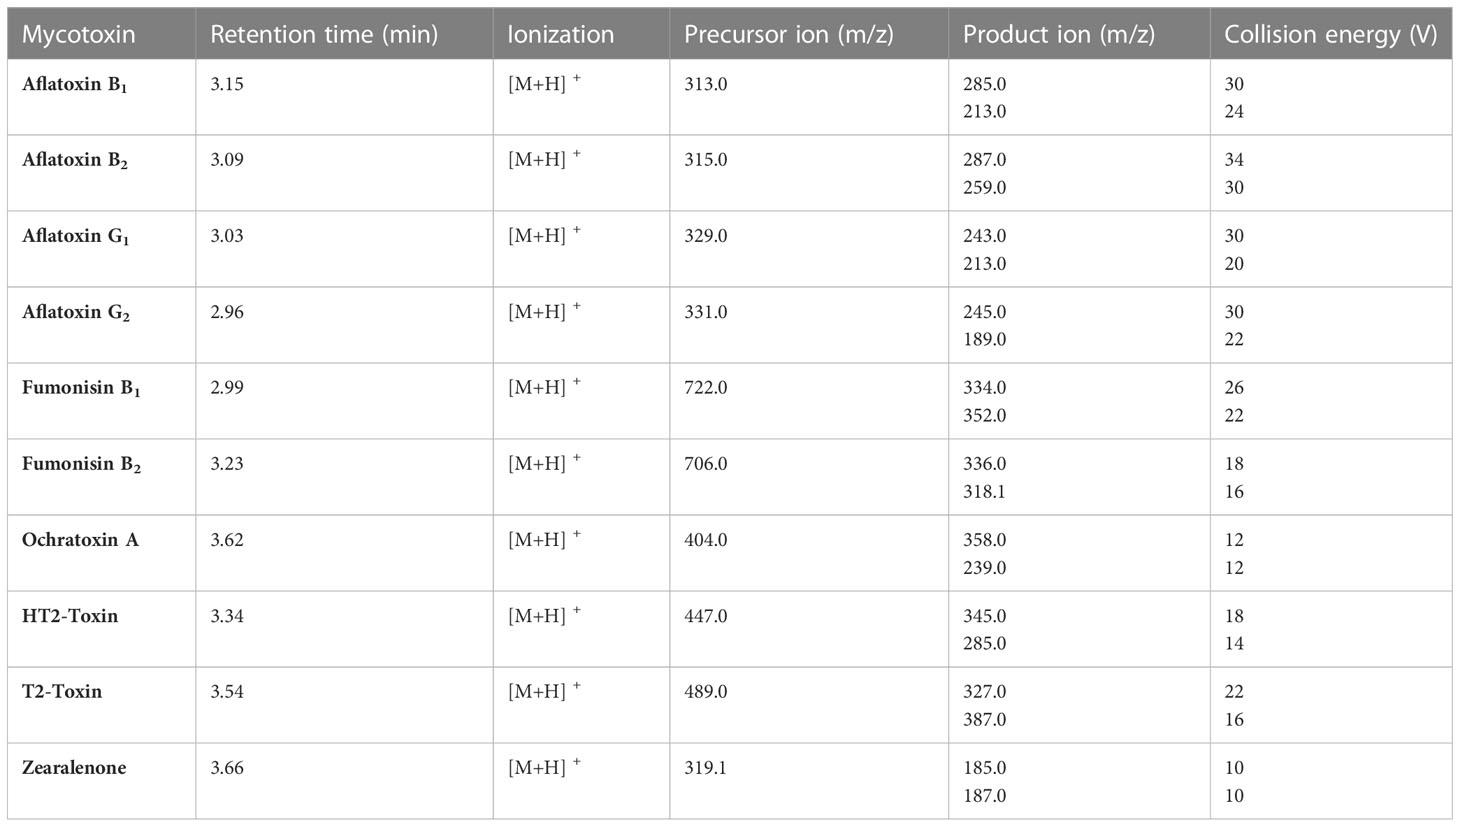
Table 4 MS/MS parameters for all analytes, including retention time (min), ionization, precursor ion (m/z), product ion (m/z) and collision energy (V).
3.2 Optimization of extraction procedure
3.2.1 Effect of the type of extraction solvent
The use of 100% organic solvents to extract multiple mycotoxins has been shown to be ineffective in extracting all analytes, especially the polar mycotoxins such as trichothecenes (HT2 and T2-toxin) (Nakhjavan et al., 2020). MeCN, MeOH, and H2O have been used as mycotoxin extraction solvents. H2O improves the extraction of polar mycotoxins. In this study, three solvent mixtures were investigated for their suitability as extraction solvents for selected mycotoxins; 80% MeOH, 80% MeCN, and 80% MeOH/MeCN (50:50 v/v). Figure 1 shows the analyte recoveries from using the selected extraction solvents. Extraction with 80% MeCN yielded the highest recoveries for all analytes except the FBs; therefore, it was selected as the extraction solvent to be used in this work. FBs are highly polar compounds, and that explains why higher recoveries were observed when extracting with 80% MeOH. Among all analytes, ZEA had the lowest recovery (41.2%) because it is non-polar, and 80% MeCN is polar. These findings are similar to those made by Pantano et al. (2021) who recorded 65.0% recovery for ZEA, which was among the lowest recoveries in their study. Unlike MeOH, MeCN reduces the extraction of matrix components and is able to extract analytes that have different polarities (González-Curbelo et al., 2015). This explains the better recoveries achieved using 80% MeCN since only the substances of interest were extracted from the matrices, leading to few interferences. All mycotoxins analyzed in this study are soluble in MeCN.
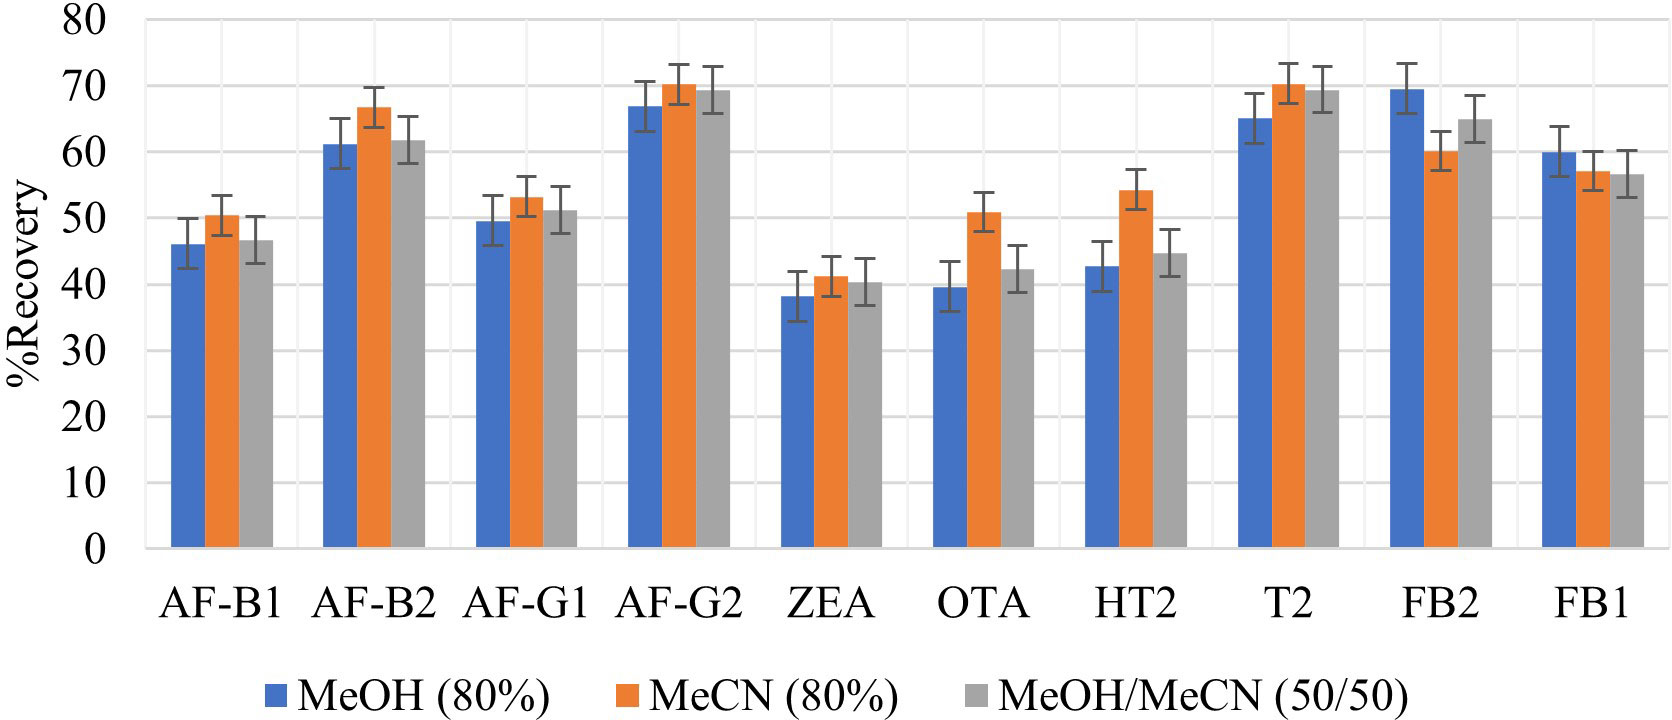
Figure 1 Effect of different extraction solvents, 80% MeOH, 80% MeCN and 80% MeOH/MeCN (50/50 v/v) on extraction recovery of each mycotoxin.
3.2.2 Effect of formic acid on extraction solvent’s efficiency
The addition of an organic acid to the extraction solvent is necessary to improve the extraction of mycotoxins that have a carboxylic acid moiety (FB1, FB2 OTA, and T2-toxin), because these mycotoxins are more soluble in acidic solvents. While some studies have used acetic acid for this purpose (Jettanajit and Nhujak, 2016; González-Jartín et al., 2021), most report the use of FA, possibly because FA is a much simpler organic acid. FA in various percentages has been used by different researchers to decrease the pH of the extraction solvent and effectively extract multiple mycotoxins (Beltrán et al., 2009; Hosseini Asl et al., 2019; Jo et al., 2021; Pantano et al., 2021). In this study, different percentages of FA were added to 80% MeCN to optimize the extraction of FB1, FB2 OTA, and T2-toxin. Figure 2 illustrates the percentage recoveries of each analyte when using various FA percentages in the extraction solvent (0.1, 0.5, 1, 2, and 5%). The addition of 0.1% FA resulted in the highest analyte recoveries; as an illustrative example, the recoveries of FB1, FB2, OTA, and T2-toxin in maize increased from 69.5%, 60.0%, 50.9%, and 59.7% (without FA) to 75.2%, 79.6%, 83.4%, and 74.6%, respectively (Figure 2). Although Beltrán et al. (2009) also used 0.1% FA to extract multiple mycotoxins in maize kernels, they did not report any optimization that influenced their choice of 0.1% FA. Other studies have reported the use of relatively larger amounts of FA the for extraction of multiple mycotoxins in cereals, such as 20% FA in MeCN (Pantano et al., 2021) and 10% FA in H2O (Jo et al., 2021). It is crucial to develop techniques that use FA at relatively low levels because its usage in high quantities has the potential to be hazardous to the environment.
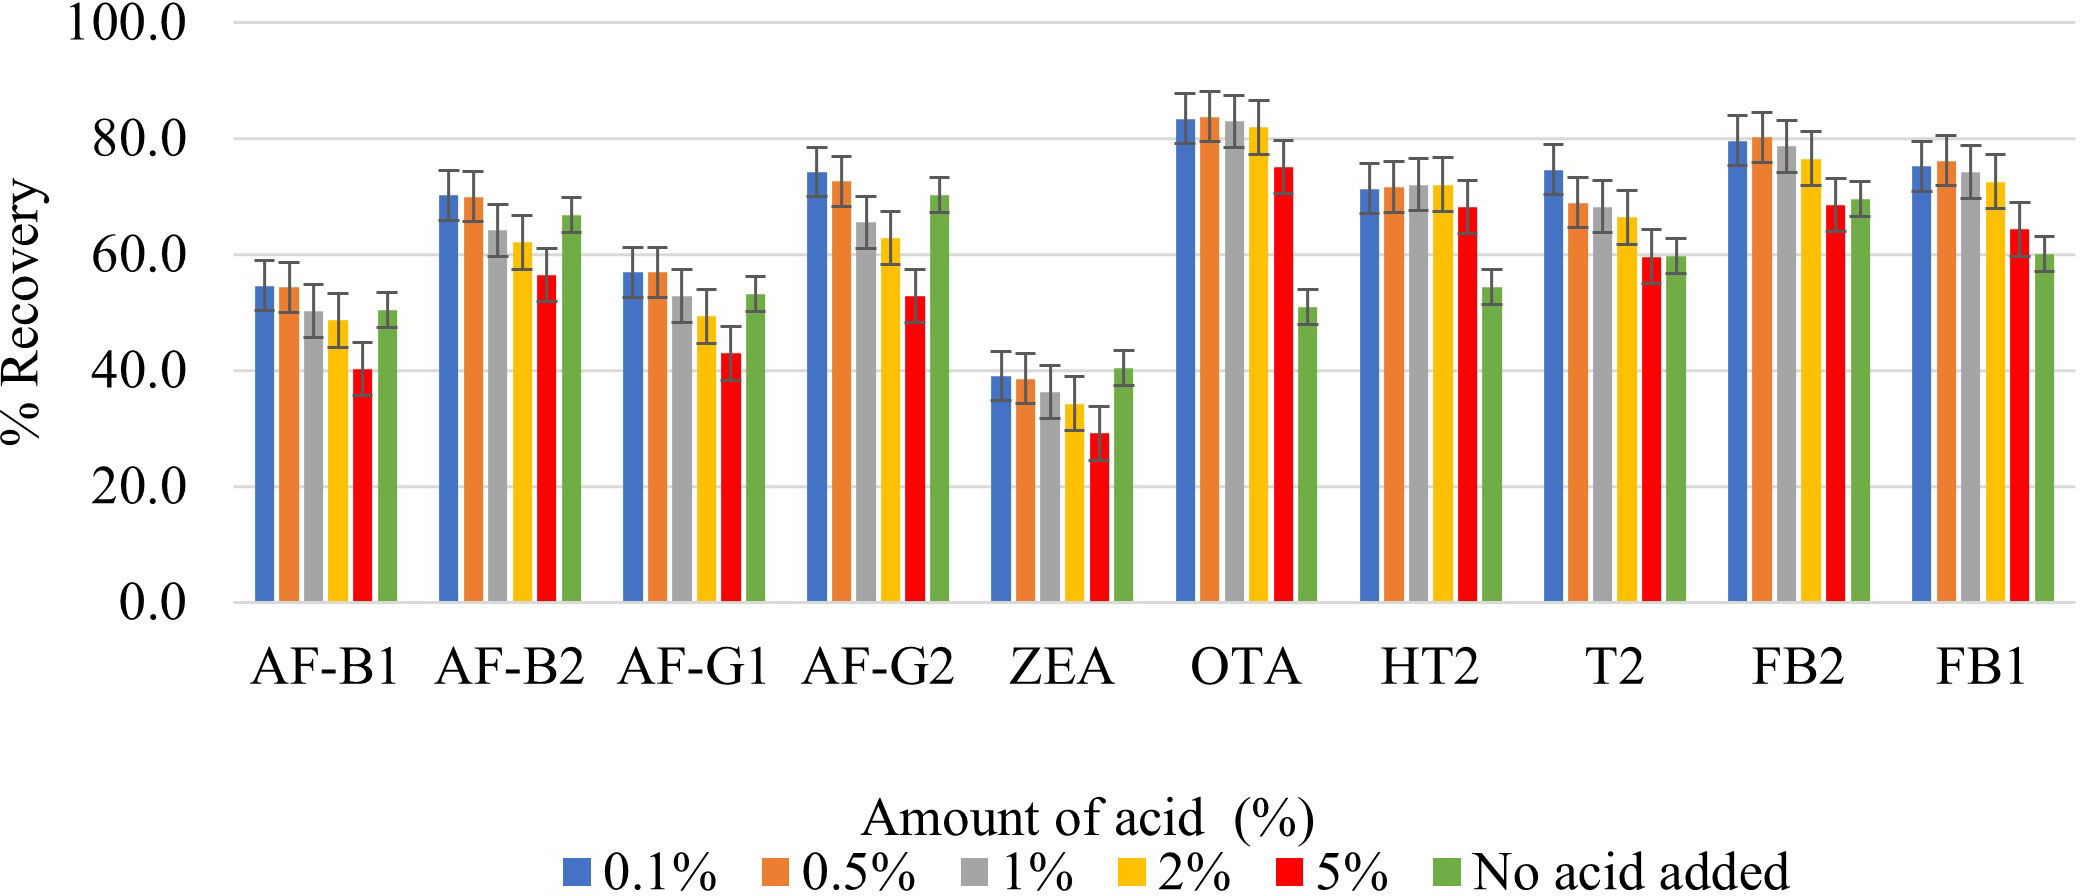
Figure 2 Effect of 0.1%, 0.5%, 1%, 2%, 5% formic acid on the extraction recovery of each mycotoxin.
3.2.3 Effect of agitation time
The mycotoxins analyzed in this study interact differently with the extraction solvent due to their various polarities. It is therefore important to optimize agitation time in order to allow maximum interaction of the extraction solvent with the matrix to effect maximum extraction of all analytes. None of the previously reported QuEChERS methods for determination of multiple mycotoxins in cereals focused on optimization of this factor (Beltrán et al., 2009; Arne and Mehdi, 2014; Jettanajit and Nhujak, 2016; González-Jartín et al., 2021; Jo et al., 2021; Pantano et al., 2021). It should be noted that time spent agitating samples after the addition of the extraction solvent influences the extraction efficiency and the peak intensities of analytes. The effect of different agitation times (15, 30, 40, 60, and 90 minutes) on analyte recovery was assessed. Increasing agitation time increased the recovery of all analytes (Figure 3). Very high analyte recoveries were observed after agitating for 60 and 90 minutes, the most notable was ZEA, which increased from 38.6% at 15 minutes to 62.8% and 63.2% at 60 and 90 minutes, respectively. This could be due to its non-polar and hydrophobic nature. This suggests that ZEA will thus require more time to be effectively absorbed by the relatively polar extraction solvent. As expected, the highest recoveries were among mycotoxins that have an acid moiety (FB1, FB2 OTA, and T2-toxin), and this could be because of their high affinity with the extraction solvent. A paired t-test was used to find out whether the difference between recoveries observed after agitating for 60 and 90 minutes was significant (Equation 7).
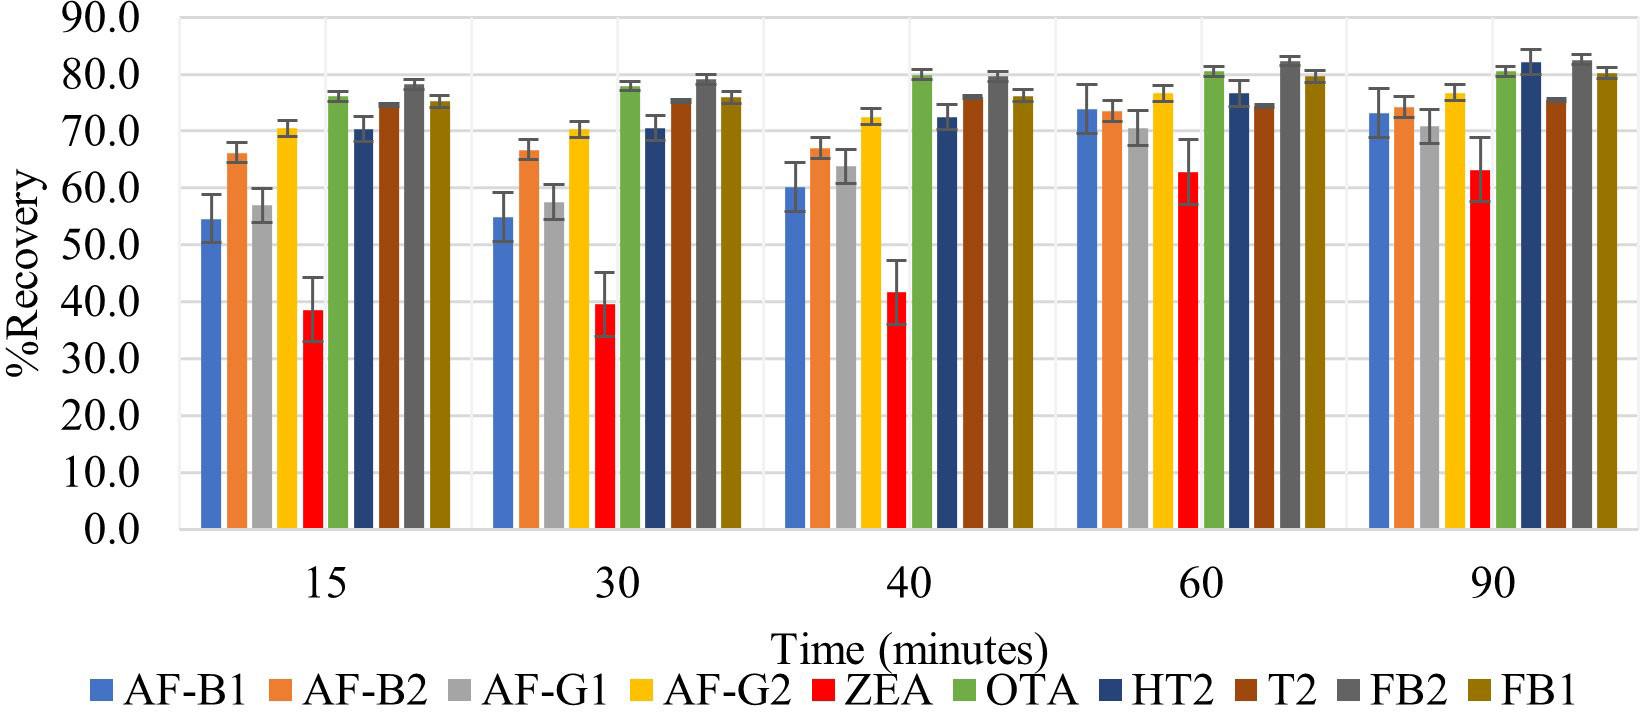
Figure 3 Effect of 15-, 30-, 40-, 60- and 90-minutes agitation time on the extraction recovery of each mycotoxin.
Where d is the difference between the pair of results, n is the number of paired results, and Sd is the standard deviation d. The 60 minutes shaking time was selected for this study because, according to statistical analysis, |tstatistic| was less than tcritical (1.51< 2.26) and this meant that there was no significant difference between the recoveries observed after shaking for 60 and 90 minutes (Supplementary Table 2). Thus, 60 minutes was selected for a faster extraction procedure.
3.2.4 Effect of salt addition
Extraction of multi-component analytes is challenging mainly because of the different physicochemical properties of the analytes. It can also be difficult due to matrix effects and interferences. Salting in QuEChERS is done to induce proper separation of the organic and aqueous phases (González-Curbelo et al., 2015) and reduce the amount of water in the final extract, leading to cleaner extracts and reduced emulsions. Anhydrous MgSO4 and hydrated MgSO4 are the commonly employed drying agents in the QuEChERS technique, while NaCl is used to induce phase separation (Anastassiades et al., 2003; González-Curbelo et al., 2015). The effect of salt addition prior to centrifuging was investigated under the following conditions: (i) 4g Anhydrous MgSO4 + 1g NaCl, (ii) 4g MgSO4 + 1g NaCl, (iii) 1g NaCl, and (iv) No salt. Higher analyte recovery (Figure 4) and chromatograms with less noise were observed for all analytes after the addition of NaCl only. Figures 5, 6 are sample presentations of the chromatograms without and with NaCl addition using T2 and HT2 toxin. Upon visual inspection, the extracts from which only NaCl was added were much cleaner than the rest, meaning that NaCl reduces the extraction of interferants and other unwanted matrix components, hence resulting in less noise recorded in the chromatograms. NaCl is also said to provide a clear and distinct phase that facilitates the penetration of mycotoxins into the organic layer (Sirhan et al., 2014). These observations may also be influenced by the agitation time because the longer the matrix spends in the organic solvents, the more it disperses, which later makes it easier for NaCl to be used as an extract cleaner. The experiments also revealed that using anhydrous MgSO4 and ordinary MgSO4 yields significantly different results, as confirmed by a paired t-test where |tstatistc| > tcritical (2.48> 2.26) (Supplementary Table 3). Due to its strong exothermic nature, anhydrous MgSO4 raises the temperature of the material inside the falcon tube. This explains the lower recoveries observed after adding it compared to the hydrated MgSO4.
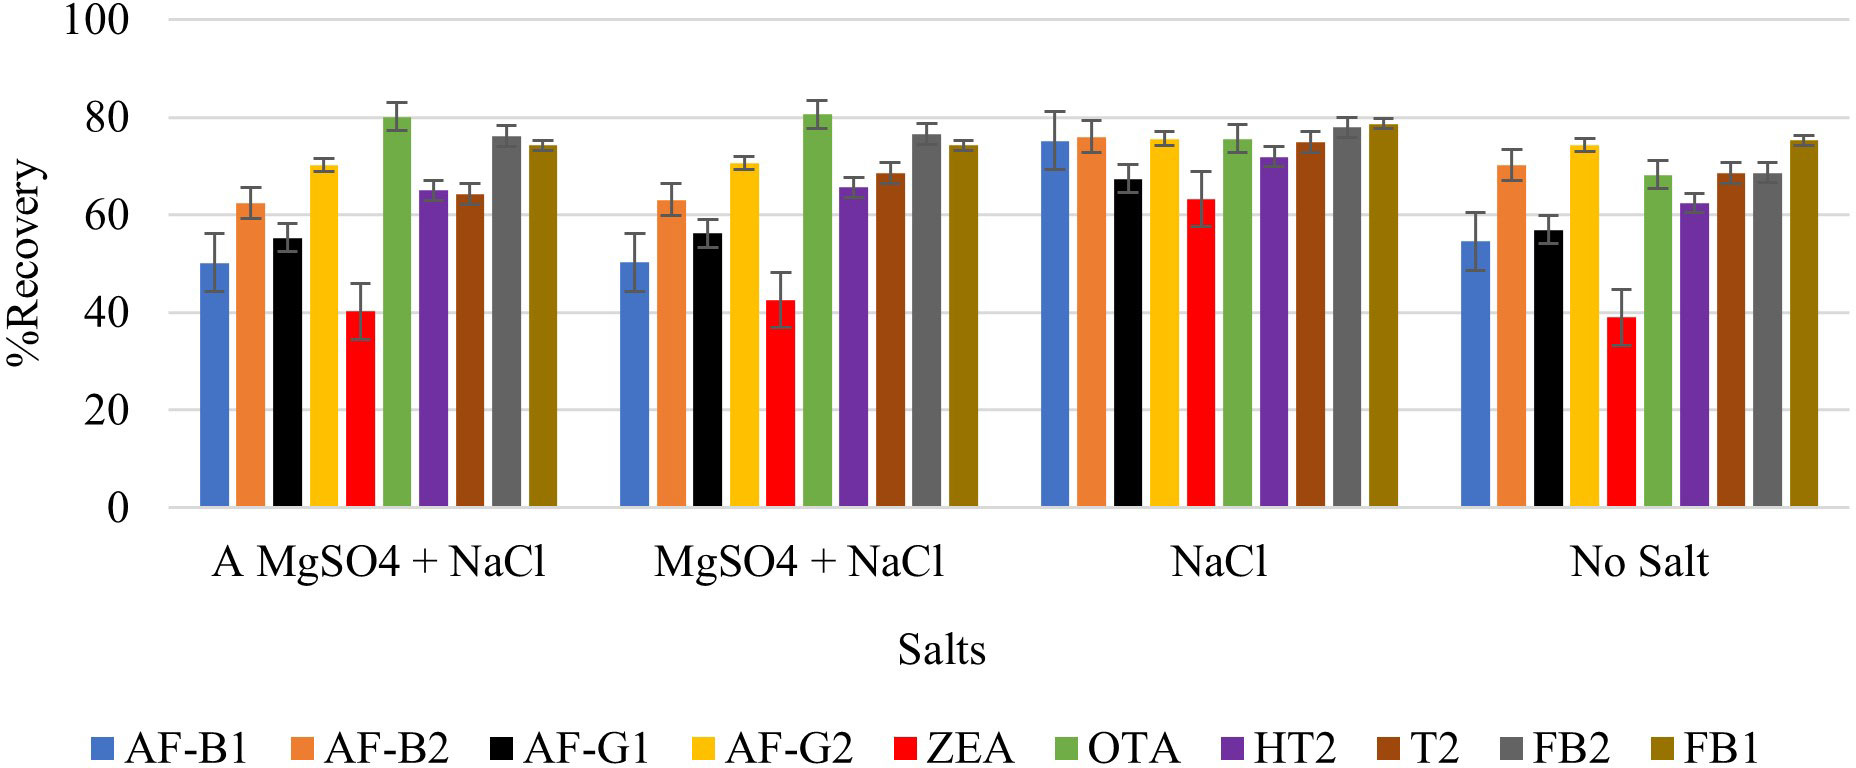
Figure 4 Effect of salt addition (NaCl and MgSO4) on the extraction recovery of each mycotoxin.
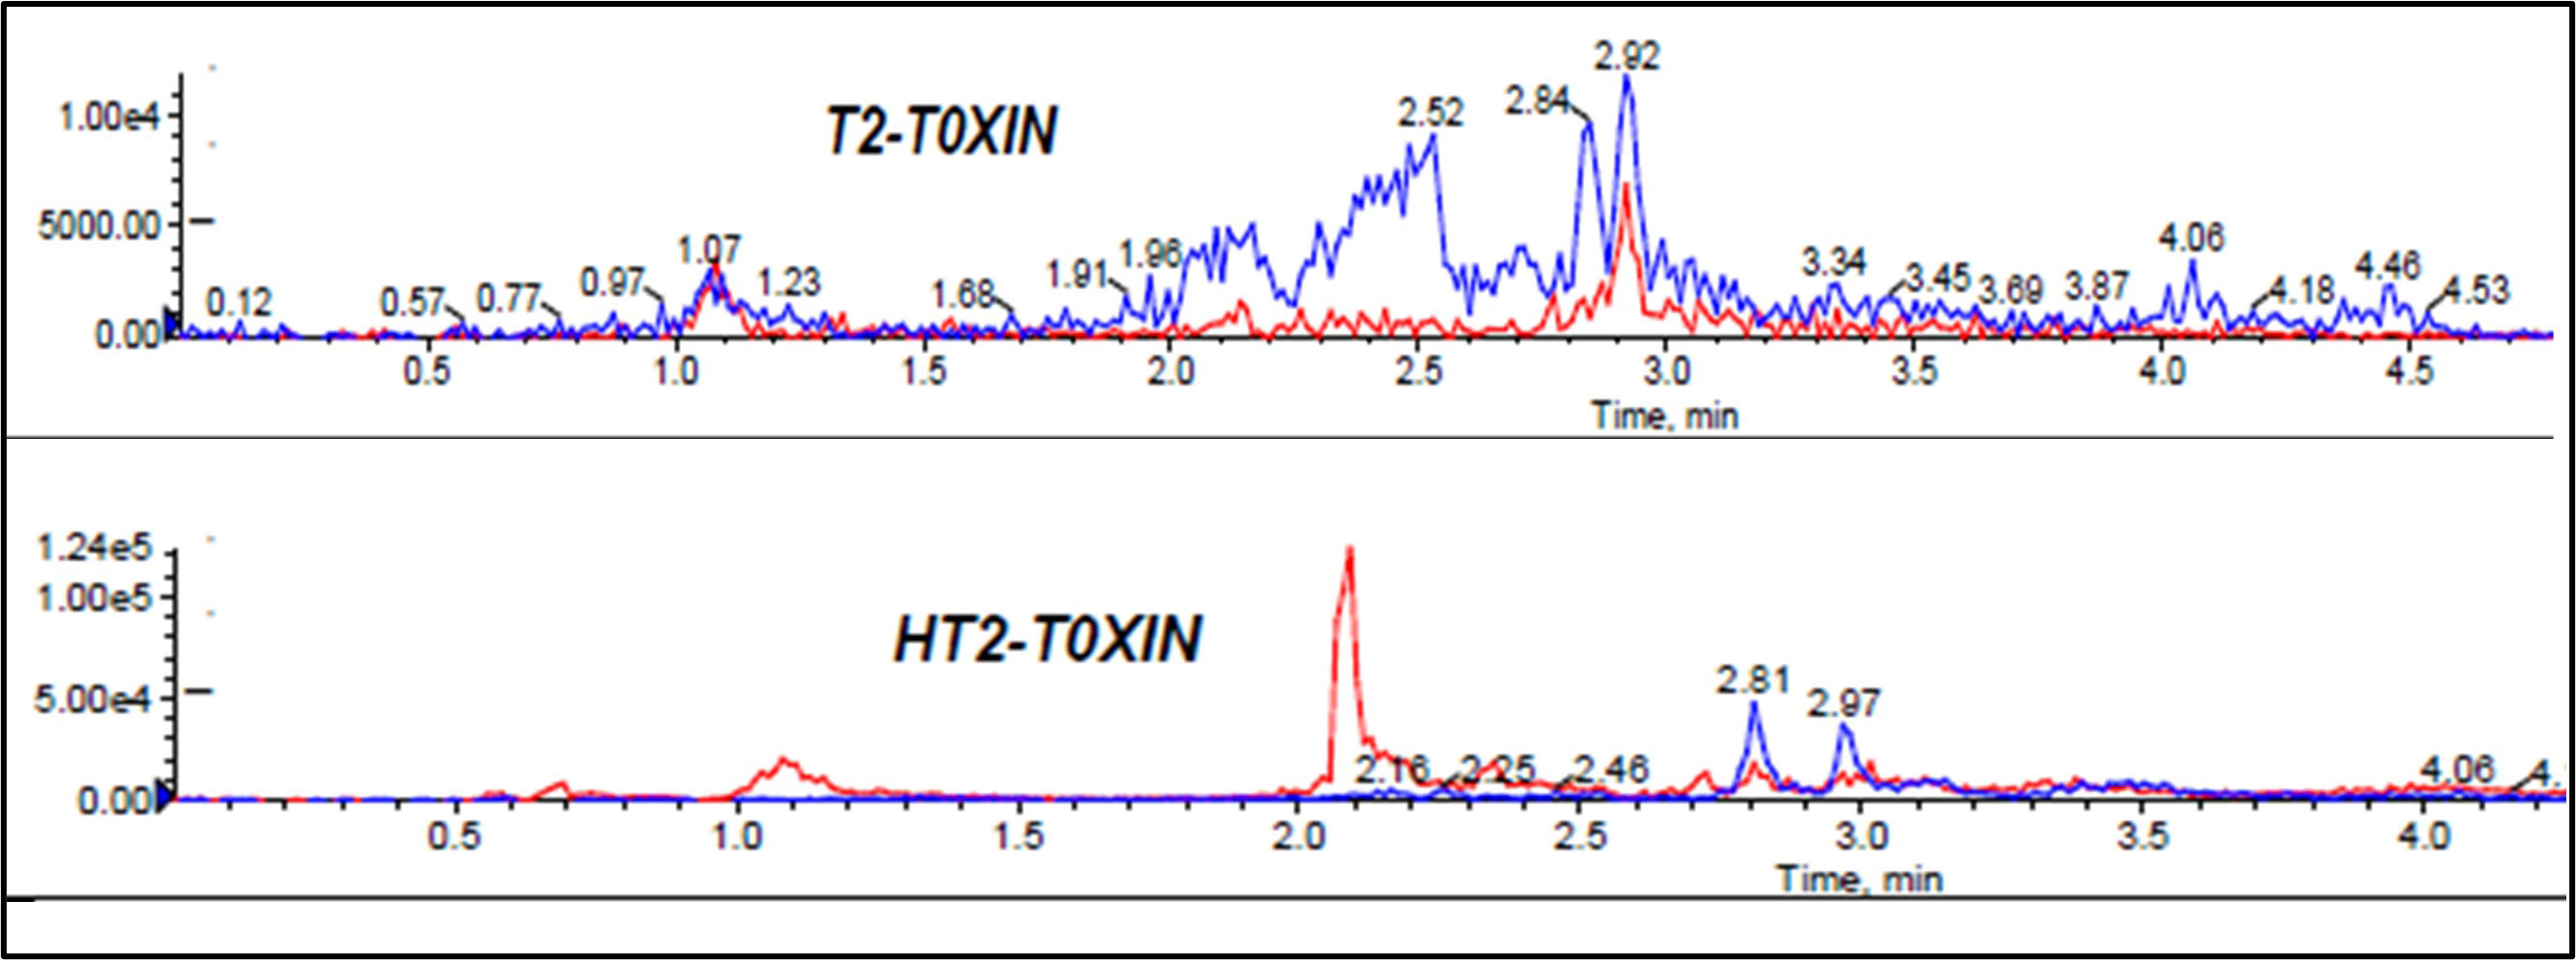
Figure 5 Effect of no salt addition to mycotoxin chromatograms, T2 and HT2 toxins chromatograms used as samples.
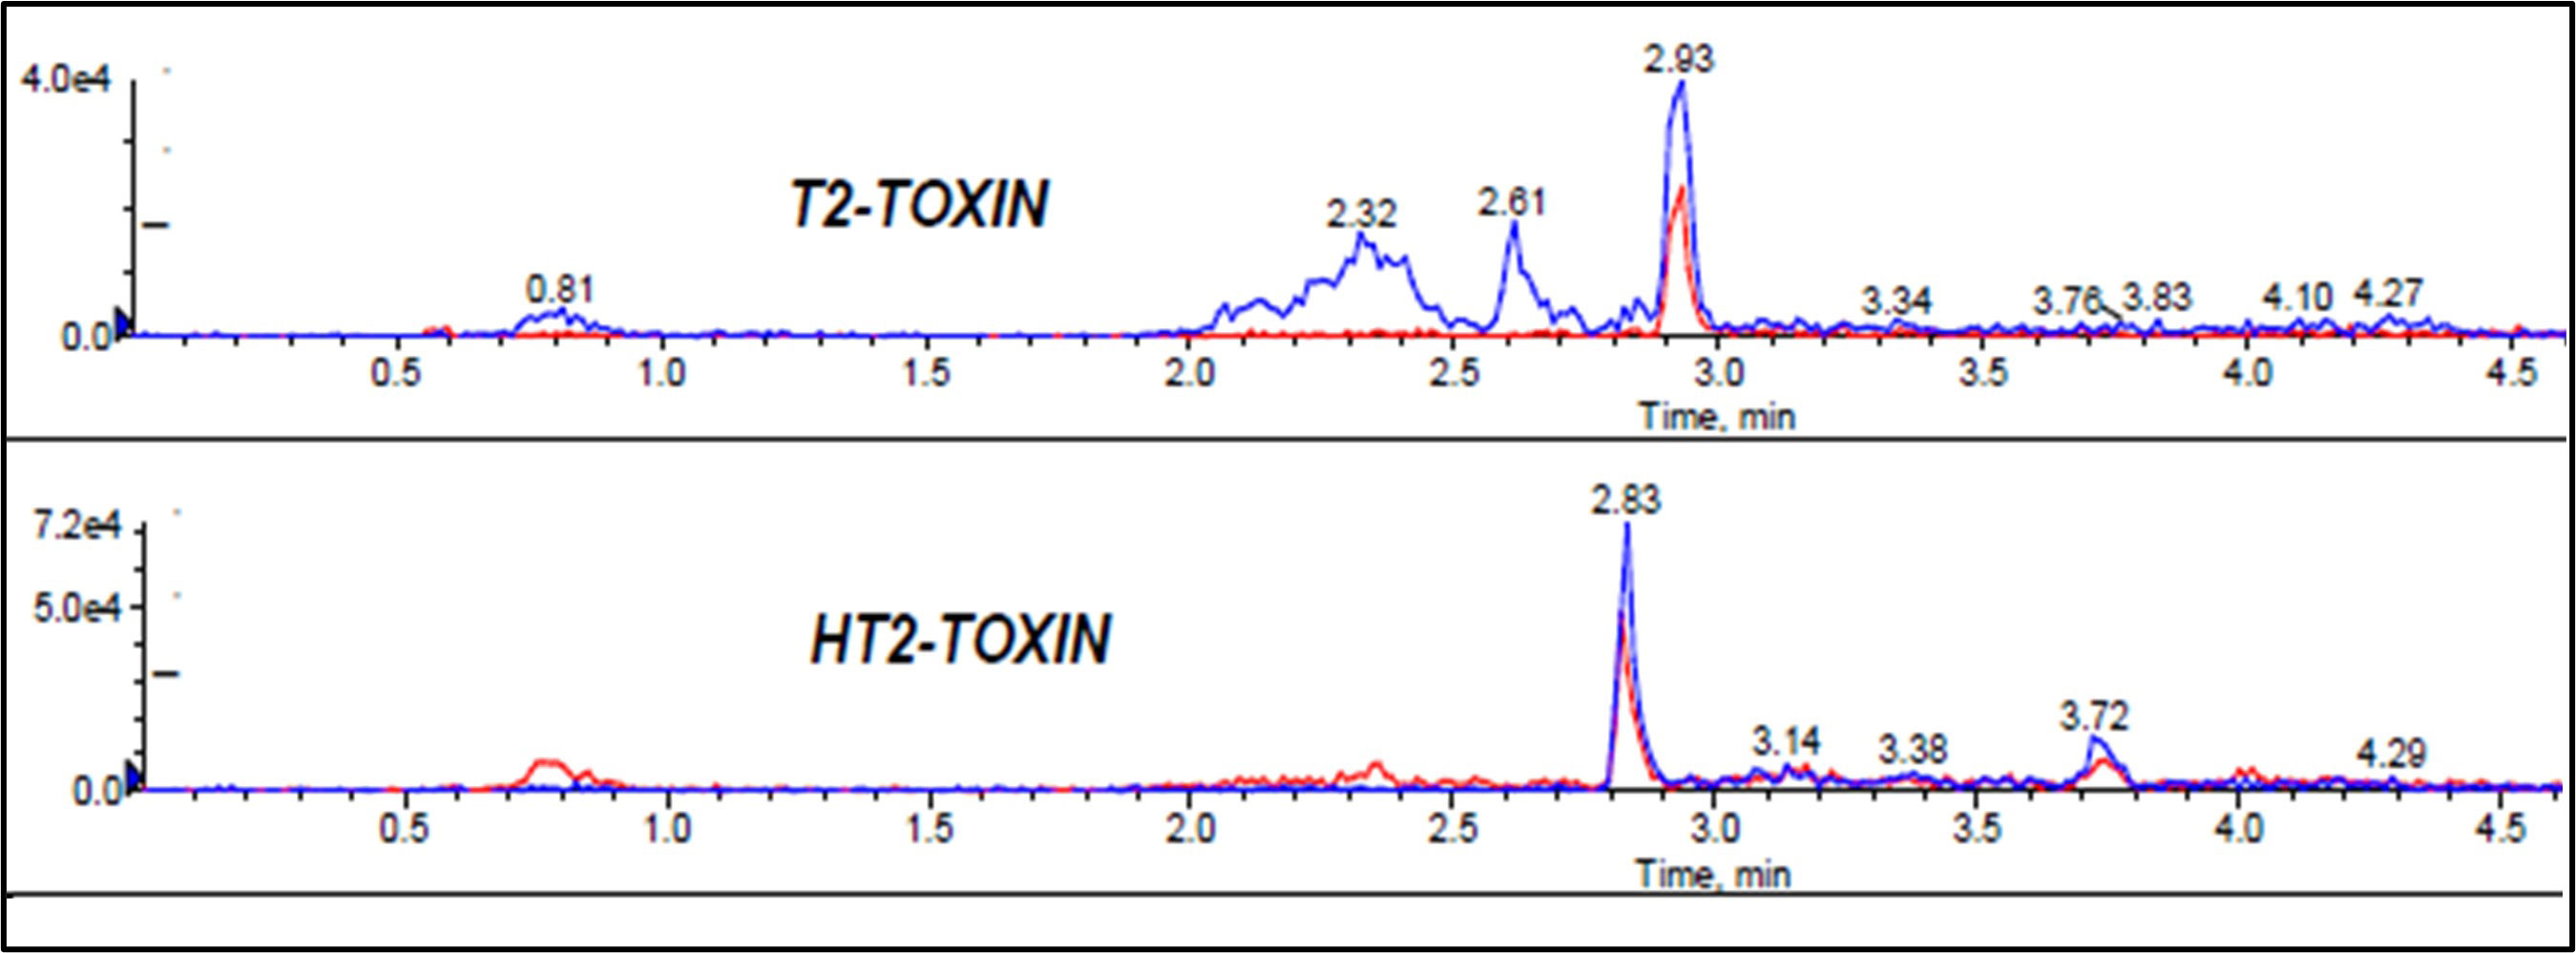
Figure 6 Effect of NaCl addition to mycotoxin chromatograms, T2 and HT2 toxins chromatograms used as samples.
3.2.5 Effect of extract dilution and concentration
According to Sirhan et al. (2014), in order to facilitate the release of analytes from the matrix, it is necessary to dilute sample extracts. This minimizes matrix effects and reduces the number of competing molecules per drop area. However, dilution may also reduce the sensitivity and result in poor detection limits. On the other hand, concentrating analytes in the extracts may improve sensitivity and lead to better detection limits while suppressing other analytes in a multi-determination study. Previous studies do not report investigations of these factors. Therefore, these two factors need to be studied and optimized to find the most optimal treatment of the extract prior to injection into the LC-MS/MS. In this study, the effect of dilution and concentration were investigated by subjecting one extract to dilution, where 500 µL of the extract was mixed with 500 µL of the reconstitution solution (MeOH/H2O 50:50 v/v), then filtered and injected into LC-MS/MS. The second extract was collected (≈ 6 mL), concentrated under a nitrogen stream to 500 µL, reconstituted with 500 µL of MeOH/H2O (50:50 v/v), then filtered and injected into LC-MS/MS. Higher analyte recoveries were observed from the sample that was concentrated prior to injection into the LC-MS/MS (Figure 7). The |tstatistic| was greater than tcritical (9.66 > 2.26), meaning that the difference is significant (Supplementary Table 4). Therefore, the concentration step was included in the extraction procedure because it improves instrument sensitivity to the selected mycotoxins. Recoveries ranging from 90.5% to 108.4% were observed, and these are much higher compared to those recorded from studies that diluted the extract prior to injection into LC-MS/MS. Jo et al. (2021) diluted 400 µL of their supernatant with 100 µL H2O and 100 µL MeCN, and their recoveries ranged from 70.1% to 106.3% for cereal based feedstuffs. Similarly, Arne and Mehdi (2014) reported recoveries ranging from 84.24% to 105.06% for rice samples after diluting 500 µL of the supernatant extract with 500 µL of H2O.
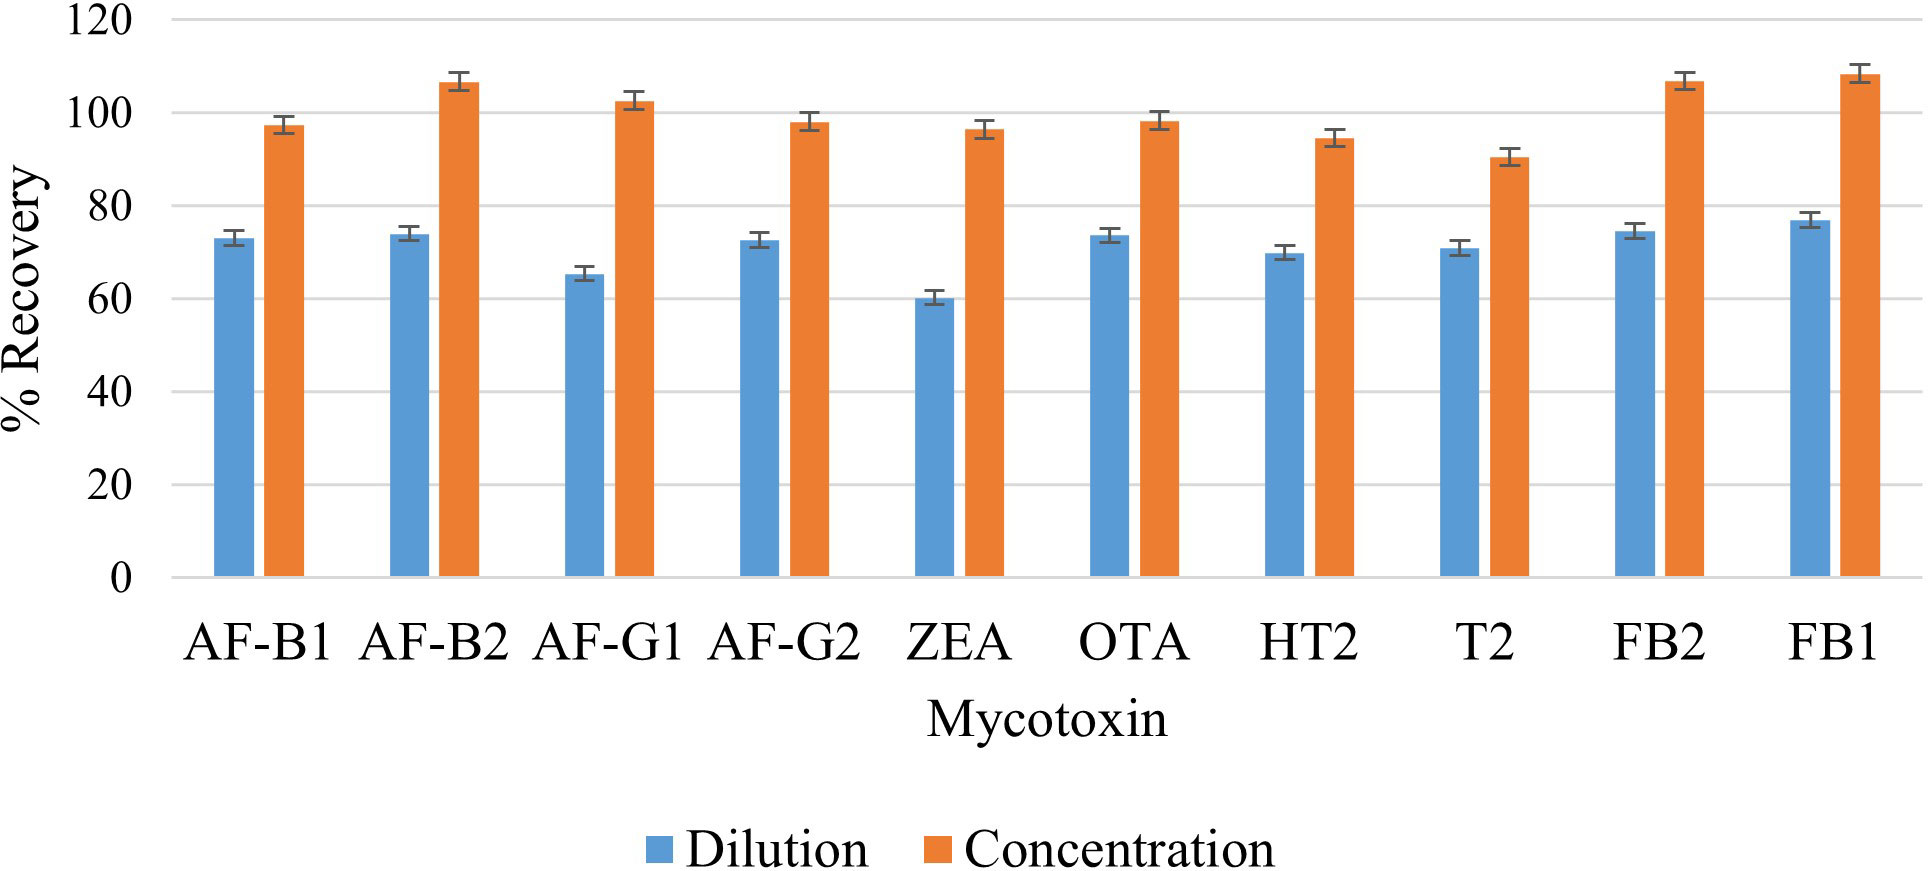
Figure 7 Effect of dilution and concentration on extraction recovery of each mycotoxin.
3.3 Method validation
3.3.1 Calibration function, LODs and LOQs
Calibration curves for each analyte are presented in Supplementary Figures 4-12. The R2 value, were greater than 0.98 in all cases, suggesting that the recorded signals can be well correlated with the actual concentration of the mycotoxins. Furthermore, one can directly predict the concentration of the analytes from the curve over the concentration ranges used in these experiments. The linearity ranges, LODs, and LOQs for the selected mycotoxins are listed in Table 5.
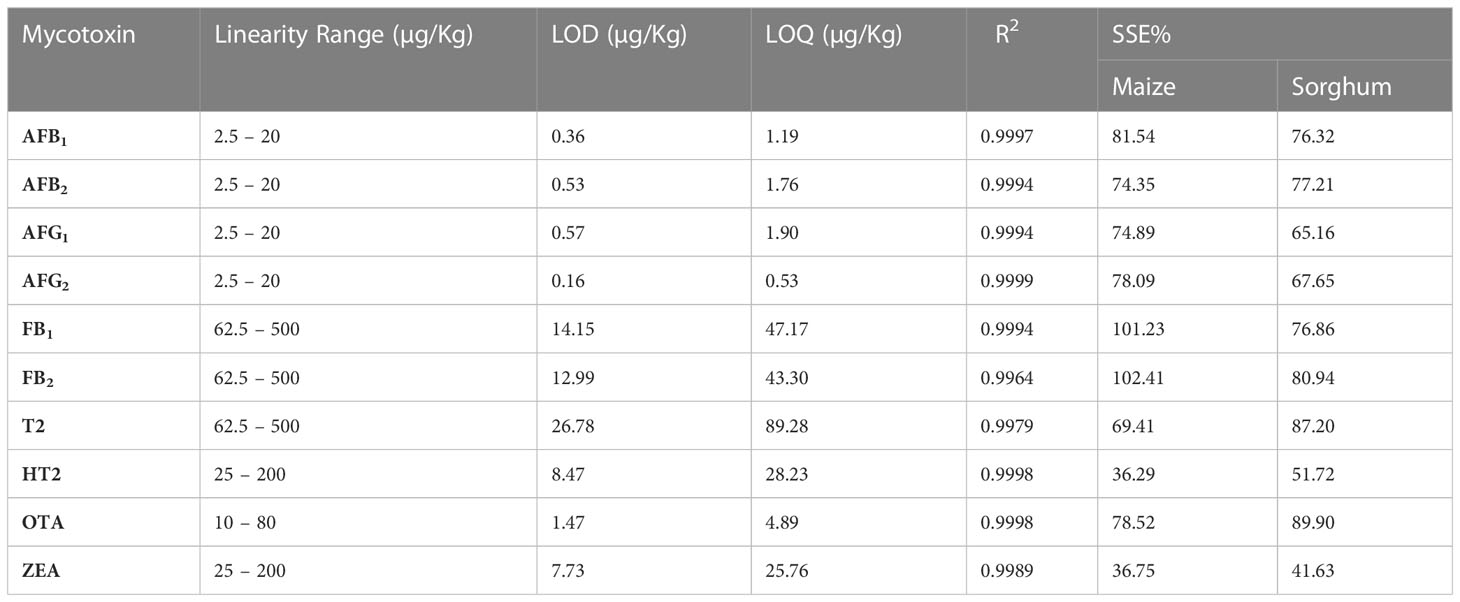
Table 5 Linearity ranges, limits of detection (LODs), limits of quantification (LOQs) and matrix effects for the selected mycotoxins.
3.3.2 Matrix effects
The signal suppression/enhancement (SSE) for all analytes in each matrix was calculated using Equation 8 to assess any ME brought on by biological components of the maize and sorghum samples. Slope comparisons were made between solvent and matrix-matched standards to evaluate MEs. A 100% SSE value indicates that the matrix has no discernible impact on the strength of the MS signal. For signal suppression, the difference between these slopes is less than 100%, while it is more than 100% for signal enhancement.
Table 5 Shows data on the calculated SSE for selected mycotoxins in maize and sorghum. The data shows signal enhancement of FB1 and FB2 in maize by 1.23% and 2.41%, respectively. Ion suppression for all other mycotoxins varied in maize and sorghum. From these results, it was determined that the ion SSE depends on both the analyte and matrix together.
3.3.3 Recovery and precision
Satisfactory recoveries were obtained for all mycotoxins. Recoveries ranged from 80.77% to 109.83% for all mycotoxins. These were within the recommended range of 70% to 120% by Commission Implementing Regulation (EU) 2021/808 of 22 March 2021 (EU, 2021). Satisfactory results for the within-laboratory reproducibility of the method were observed, with CV values typically below 15% with very few exceptions, Table 3. According to Regulation (EC) no. 401/2006 the within laboratory repeatability should be as low as possible (Regulation, 2006). The data in Table 3 also shows CV values below 15%, which is considered low enough and indicates good precision.
3.3.4 Decision limit (CCα)
CCα is a concentration at and above which, with an error probability of 1 – α, a decision can be made that if a signal is detected, it is not noise and the analyte detected is truly present or above the MRL. The CCα values were calculated according to Equation 6 and are listed in Table 3. They are close to the MRL values for each mycotoxin, which means the method can detect and quantify mycotoxins at the permit limits accurately.
3.4 Application to maize and sorghum samples
Concentrations of the selected mycotoxins in maize and sorghum samples are show in Supplementary Table 5. The most frequently detected mycotoxins were AFB1, AFB2, AFG1, AFG2, FB1, FB2, and ZEA, with detections in 5, 4, 3, 3, 5, 5, and 3 samples, respectively. In addition, T2 and HT2 toxins were detected in one of the 20 samples. Ten samples had detectable mycotoxins, and three showed 4 or more mycotoxins. Maize samples were the most contaminated with AFs, FBs, and ZEA. FB1 and ZEA were simultaneously detected indicating that they could be co-occurring toxins in Botswana food stuffs. Therefore. AFs, FBs and ZEA appear to be the more important contaminants in maize and sorghum in Botswana.
Amounts of these toxins were detected in the range of 1.27 - 4.07 µg/Kg for AFB1, 1.045 - 2.175 µg/Kg for AFB2, 1.30 - 2.835 µg/Kg for AFG1, 1.335 - 2.11 µg/Kg for AFG2, 18.345 - 25.64 µg/Kg for FB1, 11.86 - 18.32 µg/Kg for FB2, and 13.73 - 20.625 µg/Kg for ZEA. All detected concentrations except for AFB1 were below the maximum permitted levels by the EU. Two samples of maize had levels of AFB1 (2.545 and 4.07 µg/Kg) above the maximum permitted levels of 2 µg/Kg in cereals intended for human consumption (EU, 2021). Thus indicating exposure to high levels of AFB1. These findings reflected the possible contamination of Botswana’s maize and sorghum by mycotoxins, especially, maize which was also reported by Masitha, Sereme-Mothobole and Kabelo (Masitha et al., 2019), who identified mycotoxigenic fungi such as Aspergillus (flavus, niger), Fusarium (proliferatum, fujikuroi), and Alternaria in maize and sorghum samples from Botswana. These results suggest that our method can be applied in the screening of mycotoxins in cereals such as maize and sorghum.
4 Conclusions
A quick, economical, and environmentally friendly analytical method based on QuEChERS-LC-MS/MS was developed and validated for the simultaneous determination of ten mycotoxins in maize and sorghum grains. Extraction solvent, agitation time, salt addition, dilution, and concentration of supernatants in the extraction procedure were all optimized by the OFAT approach. This study revealed that optimization of the QuEChERS extraction procedure for different matrices is crucial, as the different stages of this technique affect analyte recovery in different ways. The method was validated with respect to linearity (R2 > 0.98), limits of detection (0.16 to 26.78 µg/Kg), limits of quantification (0.53 to 89.28 µg/Kg) matrix effects, selectivity, precision (repeatability and reproducibility within-laboratory), percentage recoveries (80.77% to 109.83%) and decision limits. The developed method was applied to 20 real samples (10 maize and 10 sorghum). Half of the samples had detectable mycotoxins (AFs, FBs, T2, HT2, and ZEA). The most frequently occurring were the AFs, and two maize samples had levels of AFB1 above the maximum permitted level of 2 µg/Kg (2.55, 4.07 µg/Kg). Thus indicating the possibility of exposure for Botswana to high levels of mycotoxins, especially the most toxic of them all, AFB1. It is recommended that statistical tools such as response surface methodology be used to further optimize these factors in the next studies.
Data availability statement
The original contributions presented in the study are included in the article/Supplementary Material. Further inquiries can be directed to the corresponding author.
Author contributions
MM collected samples, performed the experiments, analyzed the data, and wrote the manuscript with guidance from TR and DM. TR assisted with design of experiments, method validation and execution of experiments. DM coordinated the project. IC assisted with coordination of the project and data analysis. All authors contributed to the article and approved the submitted version.
Funding
This study was partly funded by the University of Botswana through the Office of Research and Development (ORD).
Acknowledgments
We would like to thank Botswana National Veterinary Laboratory for allowing free use of their instruments and chemical reagents.
Conflict of interest
The authors declare that the research was conducted in the absence of any commercial or financial relationships that could be construed as a potential conflict of interest.
Publisher’s note
All claims expressed in this article are solely those of the authors and do not necessarily represent those of their affiliated organizations, or those of the publisher, the editors and the reviewers. Any product that may be evaluated in this article, or claim that may be made by its manufacturer, is not guaranteed or endorsed by the publisher.
Supplementary material
The Supplementary Material for this article can be found online at: https://www.frontiersin.org/articles/10.3389/ffunb.2023.1141427/full#supplementary-material
References
Amirahmadi M., Shoeibi S., Rastegar H., Elmi M., Mousavi K. A. (2018). Simultaneous analysis of mycotoxins in corn flour using LC/MS-MS combined with a modified QuEChERS procedure. Toxin Rev. 37 (3), 187–195. doi: 10.1080/15569543.2017.1354306
Anastassiades M., Lehotay S. J., Stajnbaher D. (2003). “Quick, Easy, Cheap, Effective, Rugged, and Safe (QuEChERS) approach for the determination of pesticide residues,” in 18th Annual Waste Testing and Quality Assurance Symposium, WTQA 2002 - Proceedings.
Arne D., Mehdi S. (2014). Simultaneous multi- residue determination of mycotoxins in foods using LC-MS/MS. J. Environ. Analytical Toxicol. 5 (2), 1–6. doi: 10.4172/2161-0525.1000259
Awuchi C. G., Ondari E. N., Ogbonna C. U., Upadhyay A. K., Baran K., Okpala C. O. R., et al. (2021). Mycotoxins affecting animals, foods, humans, and plants: types, occurrence, toxicities, action mechanisms, prevention, and detoxification strategies-A revisit. Foods 10 (1279), 1–48. doi: 10.3390/foods10061279
Barac A. (2018). “Mycotoxins and human disease,” in Clinically Relevant Mycoses: A Practical Approach (Cham, Switzerland: Springer). doi: 10.1007/978-3-319-92300-0_14
Beltrán E., Ibanez M., Sancho L. V., Hernandez F. (2009). Determination of mycotoxins in different food commodities by ultra-high-pressure liquid chromatography coupled to triple quadrupole mass spectrometry. Rapid Commun. Mass Spectrometry : RCM 23 (12), 1801–1809. doi: 10.1002/RCM.4077
Braun D., Ezekiel C. N., Abia W. A., Wisgrill L., Degen G. H., Turner P. C. (2018). Monitoring early life mycotoxin exposures via LC-MS/MS breast milk analysis. Analytical Chem. 90 (24), 14569–14577. doi: 10.1021/ACS.ANALCHEM.8B04576/SUPPL_FILE/AC8B04576_SI_001.PDF
Braun D., Ezekiel C. N., Marko D., Warth B. (2020). Exposure to mycotoxin-mixtures via breast milk: an ultra-sensitive LC-MS/MS biomonitoring approach. Front. Chem. 8. doi: 10.3389/FCHEM.2020.00423/BIBTEX
CEN (2017a). EN 16923 - European Standards: Foodstuffs—Determination ofT-2 Toxin and HT-2 Toxin in Cereals and Cereal Products for Infants and Young Children by LC-MS/MS after SPE Cleanup. Available at: https://www.en-standard.eu/csn-en-16923-foodstuffs-determination-of-t-2-toxin-and-ht-2-toxin-in-cereals-and-cereal-products-for-infants-and-young-children-by-lc-ms-ms-after-spe-cleanup/ (Accessed 27 January 2022).
CEN (2017b). EN 16924:2017 - Foodstuffs - Determination of zearalenone in edible vegetable oils by LC-FLD or. Available at: https://standards.iteh.ai/catalog/standards/cen/4e2b5d81-3aec-40ab-ab44-b968e06abc2f/en-16924-2017 (Accessed 27 January 2022).
Chauhan N. M. (2017). Aflatoxin: A risky menace for african’s food commodities. Aflatoxin-Control Analysis Detection Health Risks, 91–113. doi: 10.5772/INTECHOPEN.69302
EC (2019). Regulations relating to mycotoxins in food: Perspectives in a global and European context | Knowledge for policy. Available at: https://knowledge4policy.ec.europa.eu/publication/regulations-relating-mycotoxins-food-perspectives-global-european-context_en (Accessed 27 February 2022).
Escrivá L., Font G., Manyes L., Berranda H. (2017). Studies on the presence of mycotoxins in biological samples: An overview. Toxins 9 (8), 1–33. doi: 10.3390/toxins9080251
EU (2021). Commission Implementing Regulation (EU) 2021/808 of 22 March 2021 on the performance of analytical methods for residues of pharmacologically active substances used in food-producing animals and on the interpretation of results as well as on the methods to. Off. J. Eur. Union 180 (401), 84–109.
González-Curbelo M., Socas-Rodríguez B., Herrera-Herrera A. V., González-Sálamo J., Hernández-Borges J., Rodríguez-Delgado M. A. (2015). Evolution and applications of the QuEChERS method. Trends Analytical Chem. 71 (9), 169–185. doi: 10.1016/J.TRAC.2015.04.012
González-Jartín J. M., Alfonso M., Sainz M. J., Vieytes M. R., Botana L. M. (2021). Multi-detection method for mycotoxins with a modified QuEChERS extraction in feed and development of a simple detoxification procedure. Anim. Feed Sci. Technol. 272, 114745. doi: 10.1016/J.ANIFEEDSCI.2020.114745
Hoffmann E., Stroobant V. (2007). Mass Spectrometry Principle and Applications (West Sussex, England: Third Edit. Sussex: John Wiley & Sons, Ltd).
Hosseini Asl S. M., Javadian H., Khavarpour M., Belviso C., Taghavi M., Maghsudi M. (2019). Porous adsorbents derived from coal fly ash as cost-effective and environmentally-friendly sources of aluminosilicate for sequestration of aqueous and gaseous pollutants: A review. J. Cleaner Production 208, 1131–1147. doi: 10.1016/j.jclepro.2018.10.186
Imade F., Ankwasa E., Geng H., Ullah S., Ahmad T., Wang G. (2021). Updates on food and feed mycotoxin contamination and safety in Africa with special reference to Nigeria. Mycology 12 (4), 245. doi: 10.1080/21501203.2021.1941371
Jettanajit A., Nhujak T. (2016). Determination of mycotoxins in brown rice using quEChERS sample preparation and UHPLC–MS-MS. J. Chromatographic Sci. 54 (5), 729. doi: 10.1093/CHROMSCI/BMV244
Jo H. W., Park M., Heo H., Jeon H., Choi S., Lee S., et al. (2021). Simultaneous determination of 13 mycotoxins in feedstuffs using QuEChERS extraction. Appl. Biol. Chem. 64 (34), 1–12. doi: 10.1186/s13765-021-00602-9
Kappenberg A., Juraschek L. M. (2021). Development of a lc–ms/ms method for the simultaneous determination of the mycotoxins deoxynivalenol (Don) and zearalenone (zea) in soil matrix. Toxins 13 (7), 1–6. doi: 10.3390/toxins13070470
Kresse M., Drinda H., Romanotto A., Speer K. (2019). Simultaneous determination of pesticides, mycotoxins, and metabolites as well as other contaminants in cereals by LC-LC-MS/MS. J. Chromatogr. B 1117, 86–102. doi: 10.1016/J.JCHROMB.2019.04.013
Kunz B. M., Wanko F., Kemmlein S., Bahlmann A., Rohn S., Maul R. (2020). Development of a rapid multi-mycotoxin LC-MS/MS stable isotope dilution analysis for grain legumes and its application on 66 market samples. Food Control 109, 106949. doi: 10.1016/J.FOODCONT.2019.106949
Lawley R. (2013). AFLATOXINS : Food Safety Watch. Available at: https://web.archive.org/web/20170706211122/http://www.foodsafetywatch.org/factsheets/aflatoxins/ (Accessed 11 September 2021).
Marechera G., Ndwiga J. (2015). Estimation of the potential adoption of aflasafe among smallholder maize farmers in lower eastern Kenya. Afr. J. Agric. Resource Economics 10 (1), 72–85. doi: 10.22004/AG.ECON.200589
Masitha B., Sereme-Mothobole B., Kabelo K. (2019). Current status of mycotoxigenic fungi in cereal grains in the central region of Botswana: a mini survey. J. Food Saf. Hygiene 5 (2), 120–125. doi: 10.18502/JFSH.V5I2.3950
Mupunga I. (2013). A comparative study of natural contamination with aflatoxins and fumonisins in selected food commodities from Botswana and Zimbabwe. (Johannesburg). Available at: https://uir.unisa.ac.za/handle/10500/13339 (Accessed 1 November 2021).
Nakhjavan B., Ahmed N. S., Khosravifard M. (2020). Development of an improved method of sample extraction and quantitation of multi-mycotoxin in feed by LC-MS/MS. Toxins 12 (7), 462. doi: 10.3390/TOXINS12070462
Pantano L., Scala L. L., Olibrio F., Galluzzo F. G., Bongiorno C., Buscemi M. D., et al. (2021). Quechers lc–ms/ms screening method for mycotoxin detection in cereal products and spices. Int. J. Environ. Res. Public Health 18 (3774), 1–17. doi: 10.3390/ijerph18073774
Pascale M., De girolaMo A., Lippolis V. (2019). Performance evaluation of LC-MS methods for multimycotoxin determination. J. AOAC Int. 102 (6), 1708–1720. doi: 10.1093/JAOAC/102.6.1708
Regulation E. C. (2006). European commission commission regulation (EC) no 401/2006 laying down the methods of sampling and analysis for the official control of the levels of mycotoxins in foodstuffs. Off. J. Eur. Union, 1–42.
Salim S. A., Sukor R., Ismail M. N., Selamat J. (2021). Dispersive liquid-liquid microextraction (DLLME) and LC-MS/MS analysis for multi-mycotoxin in rice bran: method development, optimization and validation. Toxins 13 (280), 1–21. doi: 10.3390/toxins13040280
Sirhan A. Y., Tan G., Al-Shunnaq A., Abdulra'uf L., Wong R. C. S. (2014). QuEChERS-HPLC method for aflatoxin detection of domestic and imported food in Jordan. J. Liquid Chromatogr. Related Technol. 37 (3), 321–342. doi: 10.1080/10826076.2012.745138
Spanjer M. C., Rensen P. M., Scholten J. M. (2008). LC–MS/MS multi-method for mycotoxins after single extraction, with validation data for peanut, pistachio, wheat, maize, cornflakes, raisins and figs. Food Additives Contaminants 25 (4), 472–489. doi: 10.1080/02652030701552964
Keywords: multiple mycotoxins, food safety, maize, sorghum, QuEChERS-LC-MS/MS, method development
Citation: Mbisana M, Rebagamang T, Mogopodi D and Chibua I (2023) Development and validation of a QuEChERS-LC-MS/MS method for determination of multiple mycotoxins in maize and sorghum from Botswana. Front. Fungal Biol. 4:1141427. doi: 10.3389/ffunb.2023.1141427
Received: 10 January 2023; Accepted: 20 July 2023;
Published: 03 August 2023.
Edited by:
Alex Echeverría-Vega, Universidad Católica del Maule, ChileReviewed by:
Fuguo Xing, Chinese Academy of Agricultural Sciences, ChinaSefater Gbashi, University of Johannesburg, South Africa
Copyright © 2023 Mbisana, Rebagamang, Mogopodi and Chibua. This is an open-access article distributed under the terms of the Creative Commons Attribution License (CC BY). The use, distribution or reproduction in other forums is permitted, provided the original author(s) and the copyright owner(s) are credited and that the original publication in this journal is cited, in accordance with accepted academic practice. No use, distribution or reproduction is permitted which does not comply with these terms.
*Correspondence: Mesha Mbisana, bWltaW1iaXNhbmFAZ21haWwuY29t; TWJpc2FuYW1AdWIuYWMuYnc=