 Ran Wei1†
 Hengchang Liu
 Chunxiang Li
 Xu Guan
 Zheng Jiang
- 1Department of Colorectal Surgery, National Cancer Center/National Clinical Research Center for Cancer/Cancer Hospital, Chinese Academy of Medical Sciences and Peking Union Medical College, Beijing, China
- 2Department of Thoracic Surgery, National Cancer Center/National Clinical Research Center for Cancer/Cancer Hospital, Chinese Academy of Medical Sciences and Peking Union Medical College, Beijing, China
Systematic classification of colon and rectal cancer-associated signatures is critical for the classification and prognosis of cancer patients. In this study, we identified a panel of 29 colon and rectal cancer-associated signatures from bioinformatics analyses on both TCGA and GEO datasets. Based on the signatures, we developed a machine learning method to classify colon and rectal cancer into three immune subtypes named High-Immunity Subtype, Medium-Immunity Subtype, and Low-Immunity Subtype, respectively. Reconfirmed by different datasets, this classification was associated with the tumor mutational burden (TMB) and many cancer-associated pathways. Compared to Medium-Immunity and Low-Immunity, patients with High-Immunity Subtype have a greater immune cell infiltration and better survival prognosis. In addition, a prognostic signature of six differentially−expressed and survival-associated genes among the three cancer subtypes (CERCAM, CD37, CALB2, MEOX2, RASGRP2, and PCOLCE2) was identified by the multivariable COX analysis, which was further used to develop an accurate model to predict the prognosis of colon and rectal cancer patients.
Introduction
Colon and rectal tumors are among the most lethal and common malignancies after lung and prostate cancer (Sanoff et al., 2007; Wilkinson et al., 2010; Bray et al., 2018). It has been estimated that 53,990 new cases would be diagnosed in 2019 in the United States alone (Yothers et al., 2013). Distant metastasis is the main factor affecting the overall survival (OS) of patients with colon cancer, and prevention can reduce its incidence (Sanoff et al., 2007; Bray et al., 2018). Nevertheless, mortality remains high in case of advanced disease (Wilkinson et al., 2010). In patients with locally advanced or distantly metastatic colon cancer, conventional treatments are often insufficient to achieve a curative effect (Pagès et al., 2018; Wang Y. et al., 2018). Consequently, early detection and monitoring of the development of colon cancer using sensitive biomarkers could increase the proportion of patients diagnosed before the onset of aggressive disease.
Immunotherapy is a significant part of precision medicine in oncotherapy, enhancing the ability of the host immune system to fight advanced cancer types (Becht et al., 2016; Gutting et al., 2019). In recent decades, cutting-edge immunotherapies offered the promise of alternative treatment methods for many types of cancer (Sharma and Allison, 2015; Palucka and Coussens, 2016). Recent studies indicate that inhibiting immune checkpoint receptors expressed on T cells can boost the elimination of colon cancer cells in vivo. Furthermore, programmed cell death protein 1 (PD-1) and cytotoxic T lymphocyte associated antigen-4 (CTLA-4) have been proved as effective targets for the treatment of patients with immunogenic tumors, especially in mismatch repair-deficient colon cancer and melanoma (Brahmer et al., 2012; Sasidharan Nair et al., 2018). Some studies also showed that MSI tumor classification may be a predictive biomarker for PD-1 inhibition because of its association with increased expression of PD-1 and other immune-checkpoint molecules (Basile et al., 2017; Chouhan and Sammour, 2018). At the same time, multiple studies investigated tumor immunology in colon cancer (Kather and Halama, 2019). The colon is not only one of the most significant digestive organs, but also contains the largest accumulation of immune cells in the body, which regulate this very large immune barrier (Fletcher et al., 2018). Some studies have showed that ulcerative colitis, which is partly considered an autoimmune disease, can promote the development of colon cancer, but the underlying signaling mechanism needs further research (Bopanna et al., 2017; Lopez et al., 2018). Due to the abundant immune cells in the colon cancer microenvironment (Fridman et al., 2012), the type, density, and location of diverse immune cells is a promising resource for predicting the clinical outcomes. In addition, the evaluation of the extent of tumor-infiltration by T-lymphocytes, macrophages and mast cells could be considered as a significant biomarker for TNM staging and prognosis (Yang et al., 2017; Han et al., 2018). Indeed, the density of T-lymphocytes and mast cells should be treated as a widely available prognostic biomarker in colon and rectal cancer, which is related to their functions in immune suppression, inflammation, and tumor development (Marech et al., 2014; Lv et al., 2019). The cancer microenvironment also commonly consists of stromal cells originating from the mesenchyma, which can regulate immune cell trafficking and activation to influence the prognosis of different cancer types and disease stages (Greten et al., 2004; Koliaraki et al., 2015). In order to promote the development of effective immunotherapy strategies, it is important to investigate the immunomodulatory role of the immune and stromal compartments of tumors. By combining different immunotherapeutic methods with other therapeutic approaches, and paying attention to the association between immunotherapy response and the tumor mutation burden (TMB), it is possible to significantly improve the efficacy of cancer therapy.
In this study, we used the “Cell type Identification by Estimating Relative Subsets of RNA Transcripts (CIBERSORT)” algorithm, which employs support vector regression and has already been employed for immune score model construction in several cancer types (Newman et al., 2015; Zeng et al., 2018). Furthermore, we classified both rectal and colon cancer into three distinct subtypes: High-Immunity Subtype, Medium-Immunity Subtype, and Low-Immunity Subtype using immunogenomic profiling based on “Estimation of Stromal and Immune cells in Malignant Tumors using Expression data (ESTIMATE)” (Yoshihara et al., 2013; Vincent et al., 2015). We employed CIBERSORT and ESTIMATE to evaluate the proportions of immune cells and subtype-specific molecular features in samples from 870 colon and rectal cancer patients and 70 normal controls based on gene expression profiles available in public databases. This investigation aimed to assess the potential clinical utility of differentially expressed genes form distinct subtypes for prognostic stratification and their potential as biomarkers for targeted colon and rectal cancer therapy. Additionally, we explored underlying functional signaling mechanisms via bioinformatic analyses. The results of this study lay a great promise and foundation for subsequent in-depth immune-related studies for the precision treatment of colon and rectal cancer.
Materials and Methods
RNA-Sequencing Data and Bioinformatics Analysis
Transcriptomic RNA-sequencing data of colon cancer and rectal cancer patients were obtained from The Cancer Genome Atlas (TCGA)1, which contained data from a colon adenocarcinoma (COAD, n = 467) cohort and rectal adenocarcinoma (READ, n = 172) tissues. The exclusion criteria were normal COAD and READ samples and an OS of <30 days. Besides level 3 HTSeq-FPKM data were transformed into TPM (transcripts per million reads) for the following analyses. The TPM data for 430 patients with COAD were employed for further analyses. Gene expression datasets of colon cancer and rectal cancer patients obtained using an GPL570 platform were searched against the gene expression omnibus (GEO)2. The raw CEL files of matching microarray data were processed using the robust multichip average algorithm (Irizarry et al., 2003). Then, microarray presets could be mapped to gene symbols according to the platform annotation file and normalized employing a robust multi-array averaging method using the “affy” and “simpleaffy” packages (Irizarry et al., 2003).
Implementation of Single-Sample Gene Set Enrichment Analysis (ssGSEA)
The R package gsva was used for quantitative ssGSEA of infiltrating immune cell types. The gene signatures of immune cell populations could be applied to individual colon and rectal cancer samples with the ssGSEA (Barbie et al., 2009; Bindea et al., 2013). The enrichment levels of 29 immune signatures which are related to innate immunity [CD56 bright natural killer (NK) cells, NK cells, CD56dim NK cells, plasmacytoid dendritic cells (DCs), activated DCs, immature DCs, neutrophils, eosinophils, monocytes, mast cells, and macrophages] and adaptive immunity (activated B cells, immature B cells, activated CD4+ T cells, effector memory CD4+ T cells, central memory CD4+ T cells, central memory CD8+ T cells, effector memory CD8+ T cells, activated CD8+ T cells, T follicular helper cells, NK T cells, Tγδ, Th1, Th2, Th17, and Treg), were quantified in each sample based on the ssGSEA score. Finally, hierarchical clustering of colon and rectal cancer was conducted on the basis of ssGSEA scores of the 29 immune signatures.
Evaluation of Immune Cell Infiltration Levels, Tumor Purity, and Stromal Content in Colon and Rectal Cancer
Estimation of Stromal and Immune cells in Malignant Tumors using Expression data was employed to analyze the stromal content (stromal score), tumor purity, and immune cell infiltration level (immune score) for colon and rectal cancer sample (He et al., 2018).
Comparison of the Proportions of Immune Cell Subsets Between Colon and Rectal Cancer Subtypes
The transcriptomic RNA-sequencing data with standard annotation were uploaded to the CIBERSORT web portal3, and the algorithm was run employing the LM22 signature with 1000 permutations (Newman et al., 2015). The inferred fractions of immune cell populations produced by CIBERSORT were considered accurate if the CIBERSORT output had a p < 0.05 (Ali et al., 2016), and were considered eligible for further analysis. The final CIBERSORT output estimates were normalized for each sample to add up to one, enabling their direct interpretation as cell fractions for comparison across different datasets and immune cell types. For parts of each immune cell type, the optimal cut-off value was made as the point with the most important split (log-rank test) (Budczies et al., 2012).
Identification of Differentially Expressed Genes
The statistical software R (version3.5.2) and the Bioconductor linear model package for microarray data “limma”4 were used to identify the differentially expressed genes (DEGs) between the High-Immunity Subtype and Low-Immunity Subtype (FDR < 0.05) colon and rectal cancer tissues in TCGA (He et al., 2018). DEGs were defined by a p-value < 0.05 and |log2FoldChange| > 1. For genes corresponding to multiple probe sets, the average data of the multiple probes were used as the gene expression values (Wei et al., 2018). The values of genes over 20% of the total samples were eliminated (Qin et al., 2012). After pre-processing the data, the Wilcoxon signed rank test was used to select significant DEGs using the “limma” package in Bioconductor (He et al., 2018).
Identification of Colon Cancer Subtype-Specific Gene Ontology and Networks
The step-by-step method of the weighted gene co-expression network analysis (WGCNA) in R was employed to identify the gene modules (gene ontology) and construct the module and network that were significantly related with the genes highly correlated with immune cell infiltration based on gene co-expression analysis (He et al., 2018). The adjacency matrix and the topological overlap matrix (TOM) was used to calculate according to the corresponding soft threshold, and the corresponding dissimilarities between each gene were calculated. We employed the dynamic tree cut method, and the branches of the hierarchical cluster tree would be cut to identify modules.
Gene Set Enrichment Analysis
H: Hallmark gene sets; C2: curated gene sets [including Kyoto Encyclopedia of Genes and Genomes (KEGG)]; C5: Gene Ontology (GO) gene sets; C7: immunologic signatures gene sets v6.2 collections were downloaded from Molecular Signatures Database as the target gene sets with which GSEA performed using the software gsea-3.0. The whole transcriptome of all tumor samples was used for GSEA, and only gene sets with NOM p < 0.05 and FDR q < 0.05 were considered as significant.
Survival Analysis
The R package clusterProfiler was employed to conduct gene functional enrichment analyses to identify biological themes among gene clusters (Yu et al., 2012). The R package survival receiver operating characteristic (ROC) was used to calculate the AUC of the survival ROC curves to validate the performance of the prognostic signature (Sun, 2017; Lin et al., 2019). Kaplan–Meier curves were plotted to verify the statistical relationship between genes and the OS of the high-risk group and low-risk groups from the TCGA datasets with the log-rank tests. Using multivariate Cox proportional hazard regression to identify prognostic clinicopathologic factors for OS in colon and rectal cancer patients. They were utilized to verify the differences of survival between the patients in the two different risk groups. The six-gene signature and nomogram were developed from the final (forward and backward elimination methods) Cox model to predict the OS of colon and rectal cancer patients. Besides the performance of the prediction model was validated internally and externally by bootstrap method. Bootstrap-corrected OS rates were calculated by averaging the Kaplan-Meier estimates based on 2000 bootstrap samples.
Results
Immunogenomic Profiling Identifies Three Colon and Rectal Cancer Subtypes
Figure 1 shows a schematic representation of the process for selecting colon and rectal cancer samples. A total of 735 patients with complete overall survival information were included from TCGA, GSE17536, and GSE109057. A total of 29 immune-associated gene sets, representing diverse immune cell types, functions, and pathways, were analyzed in the datasets via the ssGSEA scores (Yoshihara et al., 2013; Vincent et al., 2015) to quantify the enrichment levels of immune cells, pathways or functions in the colon and rectal cancer samples. The ssGSEA scores of the 29 gene sets from these microarray datasets were then used to conduct hierarchical clustering, which revealed three types of colon and rectal cancer (Figure 2). We classified the three clusters as: High-Immunity Subtype, Medium-Immunity Subtype, and Low-Immunity Subtype, and the immune scores were higher in High-Immunity Subtype and lower in Low-Immunity Subtype (Yoshihara et al., 2013; Vincent et al., 2015). In addition, we found that tumor purity and stromal score of the three colon and rectal cancer subtypes had opposite trends (Figure 2).
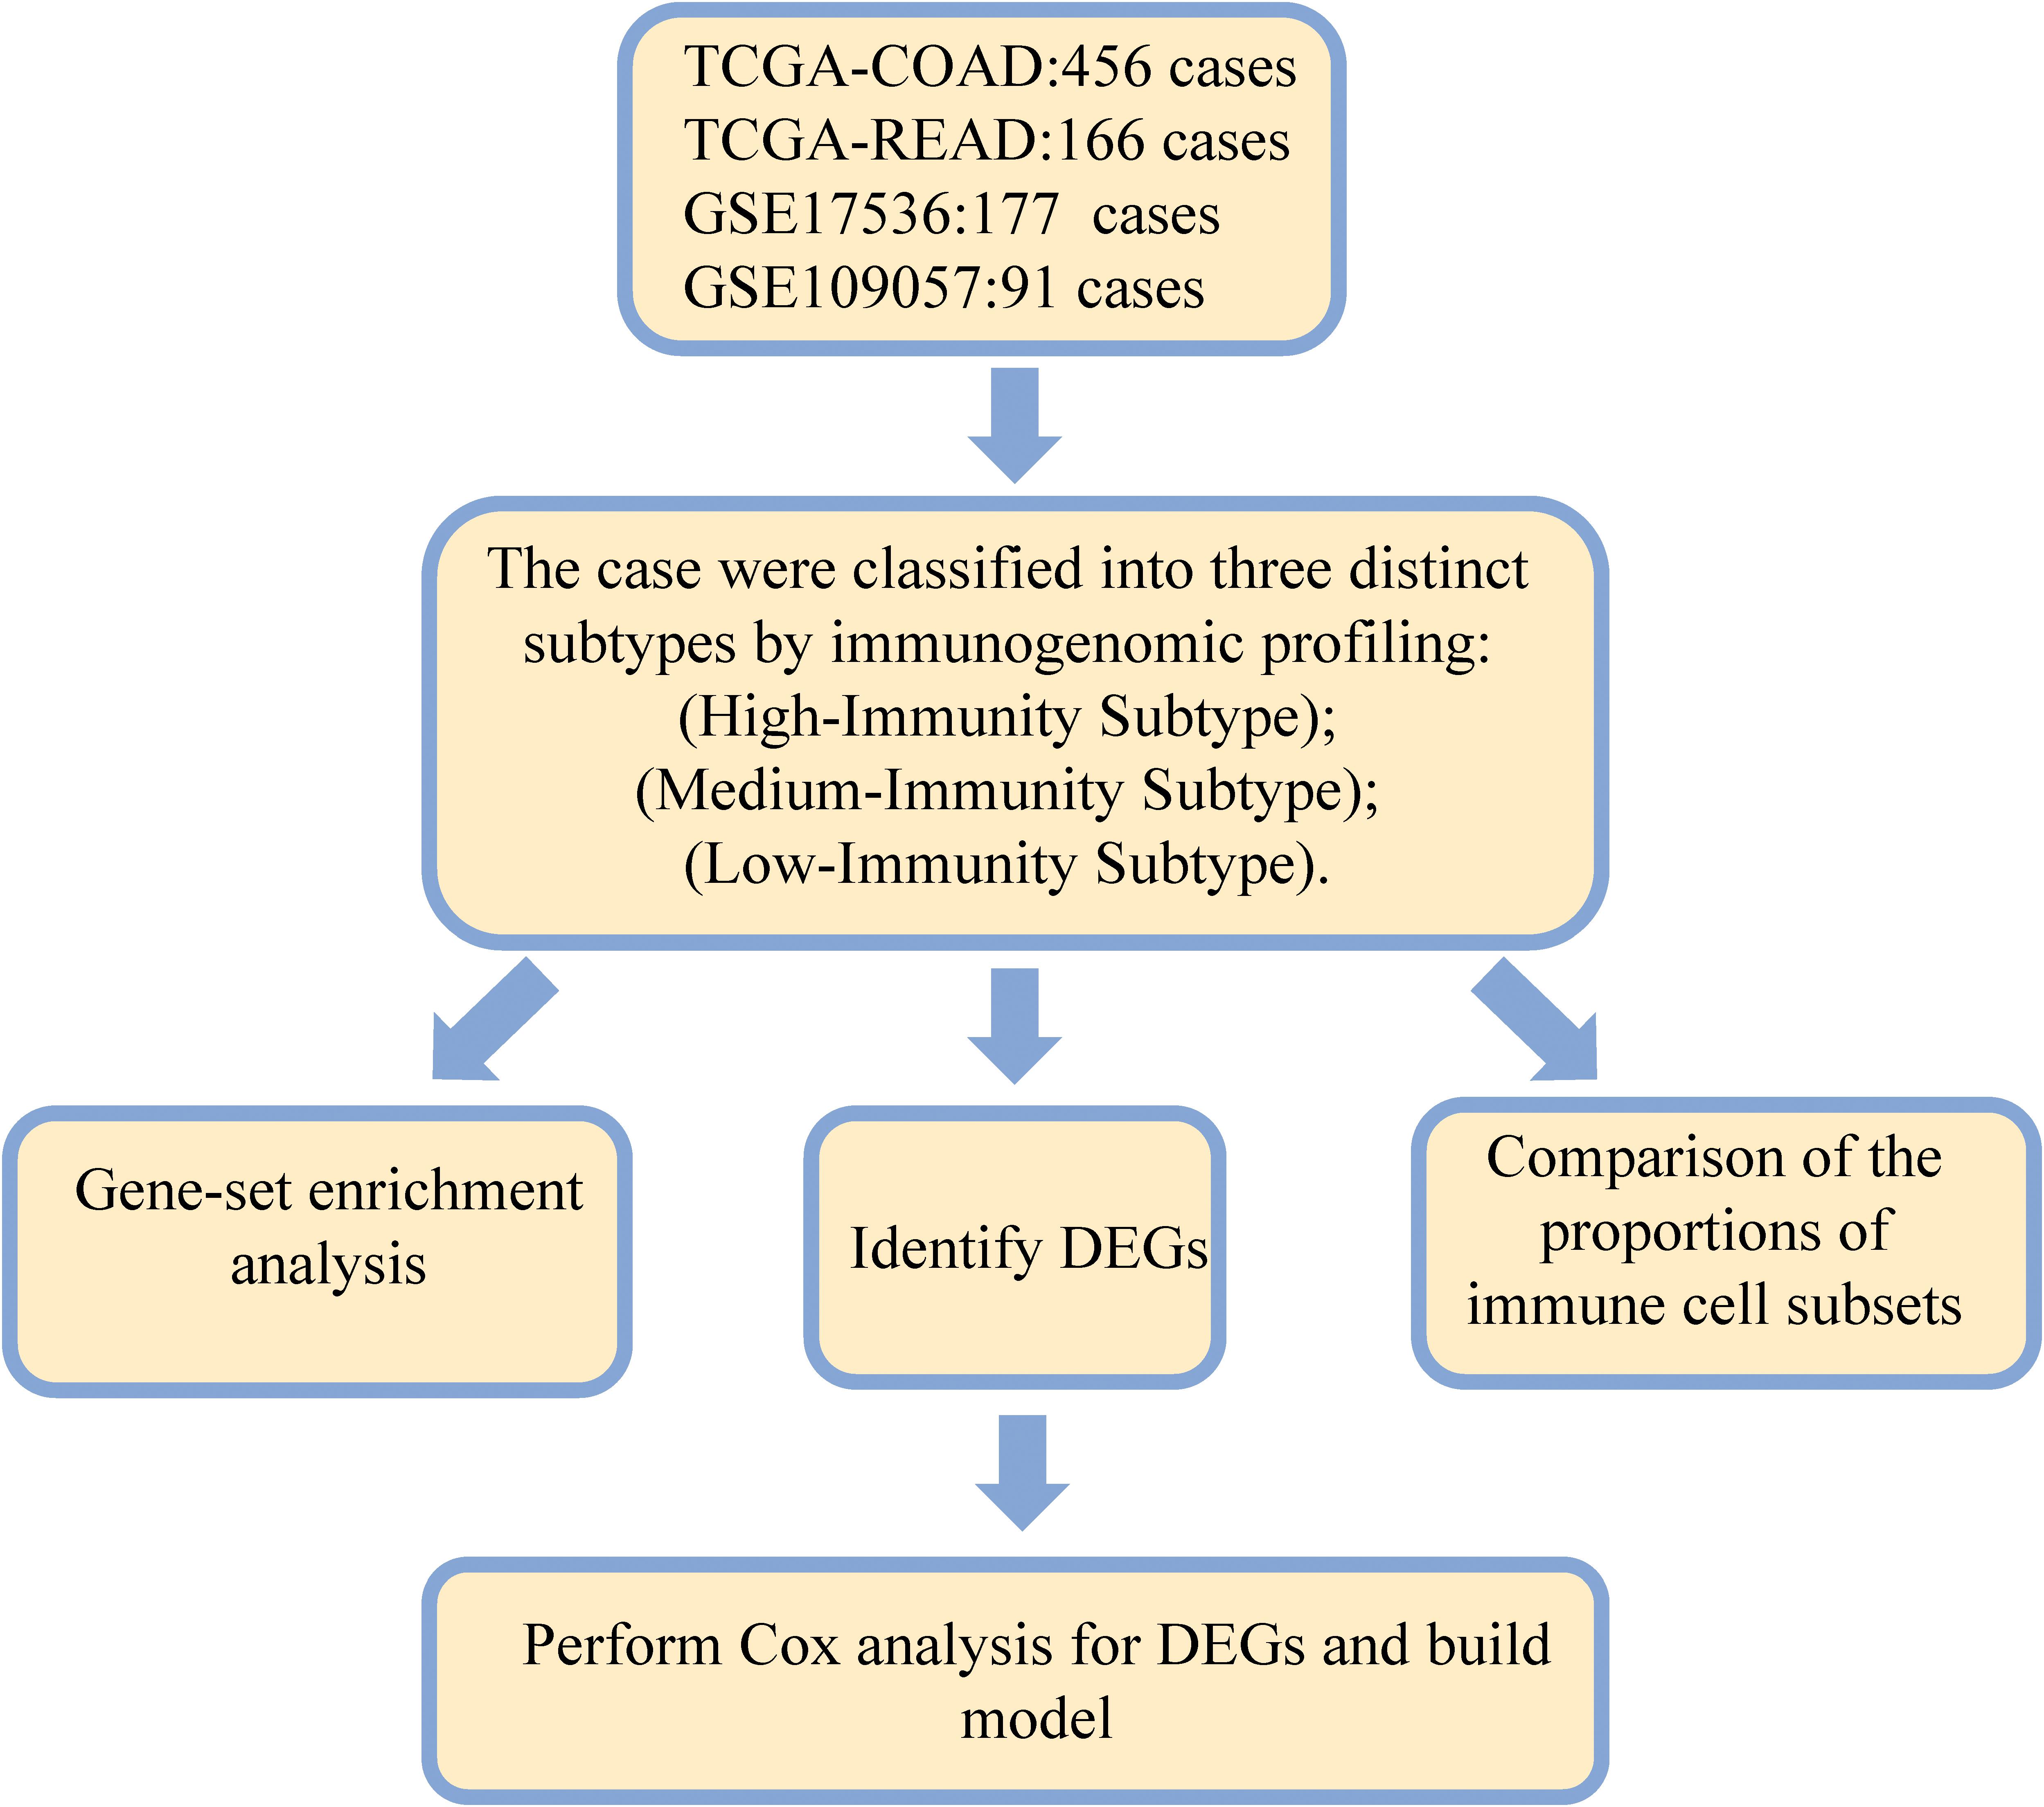
Figure 1. Flow diagram of the analysis procedure: data collection, preprocessing, and analysis. DEGs, differentially expressed genes; ROC, receiver operating characteristic; TCGA, The Cancer genome atlas; GEO, Gene Expression Omnibus.
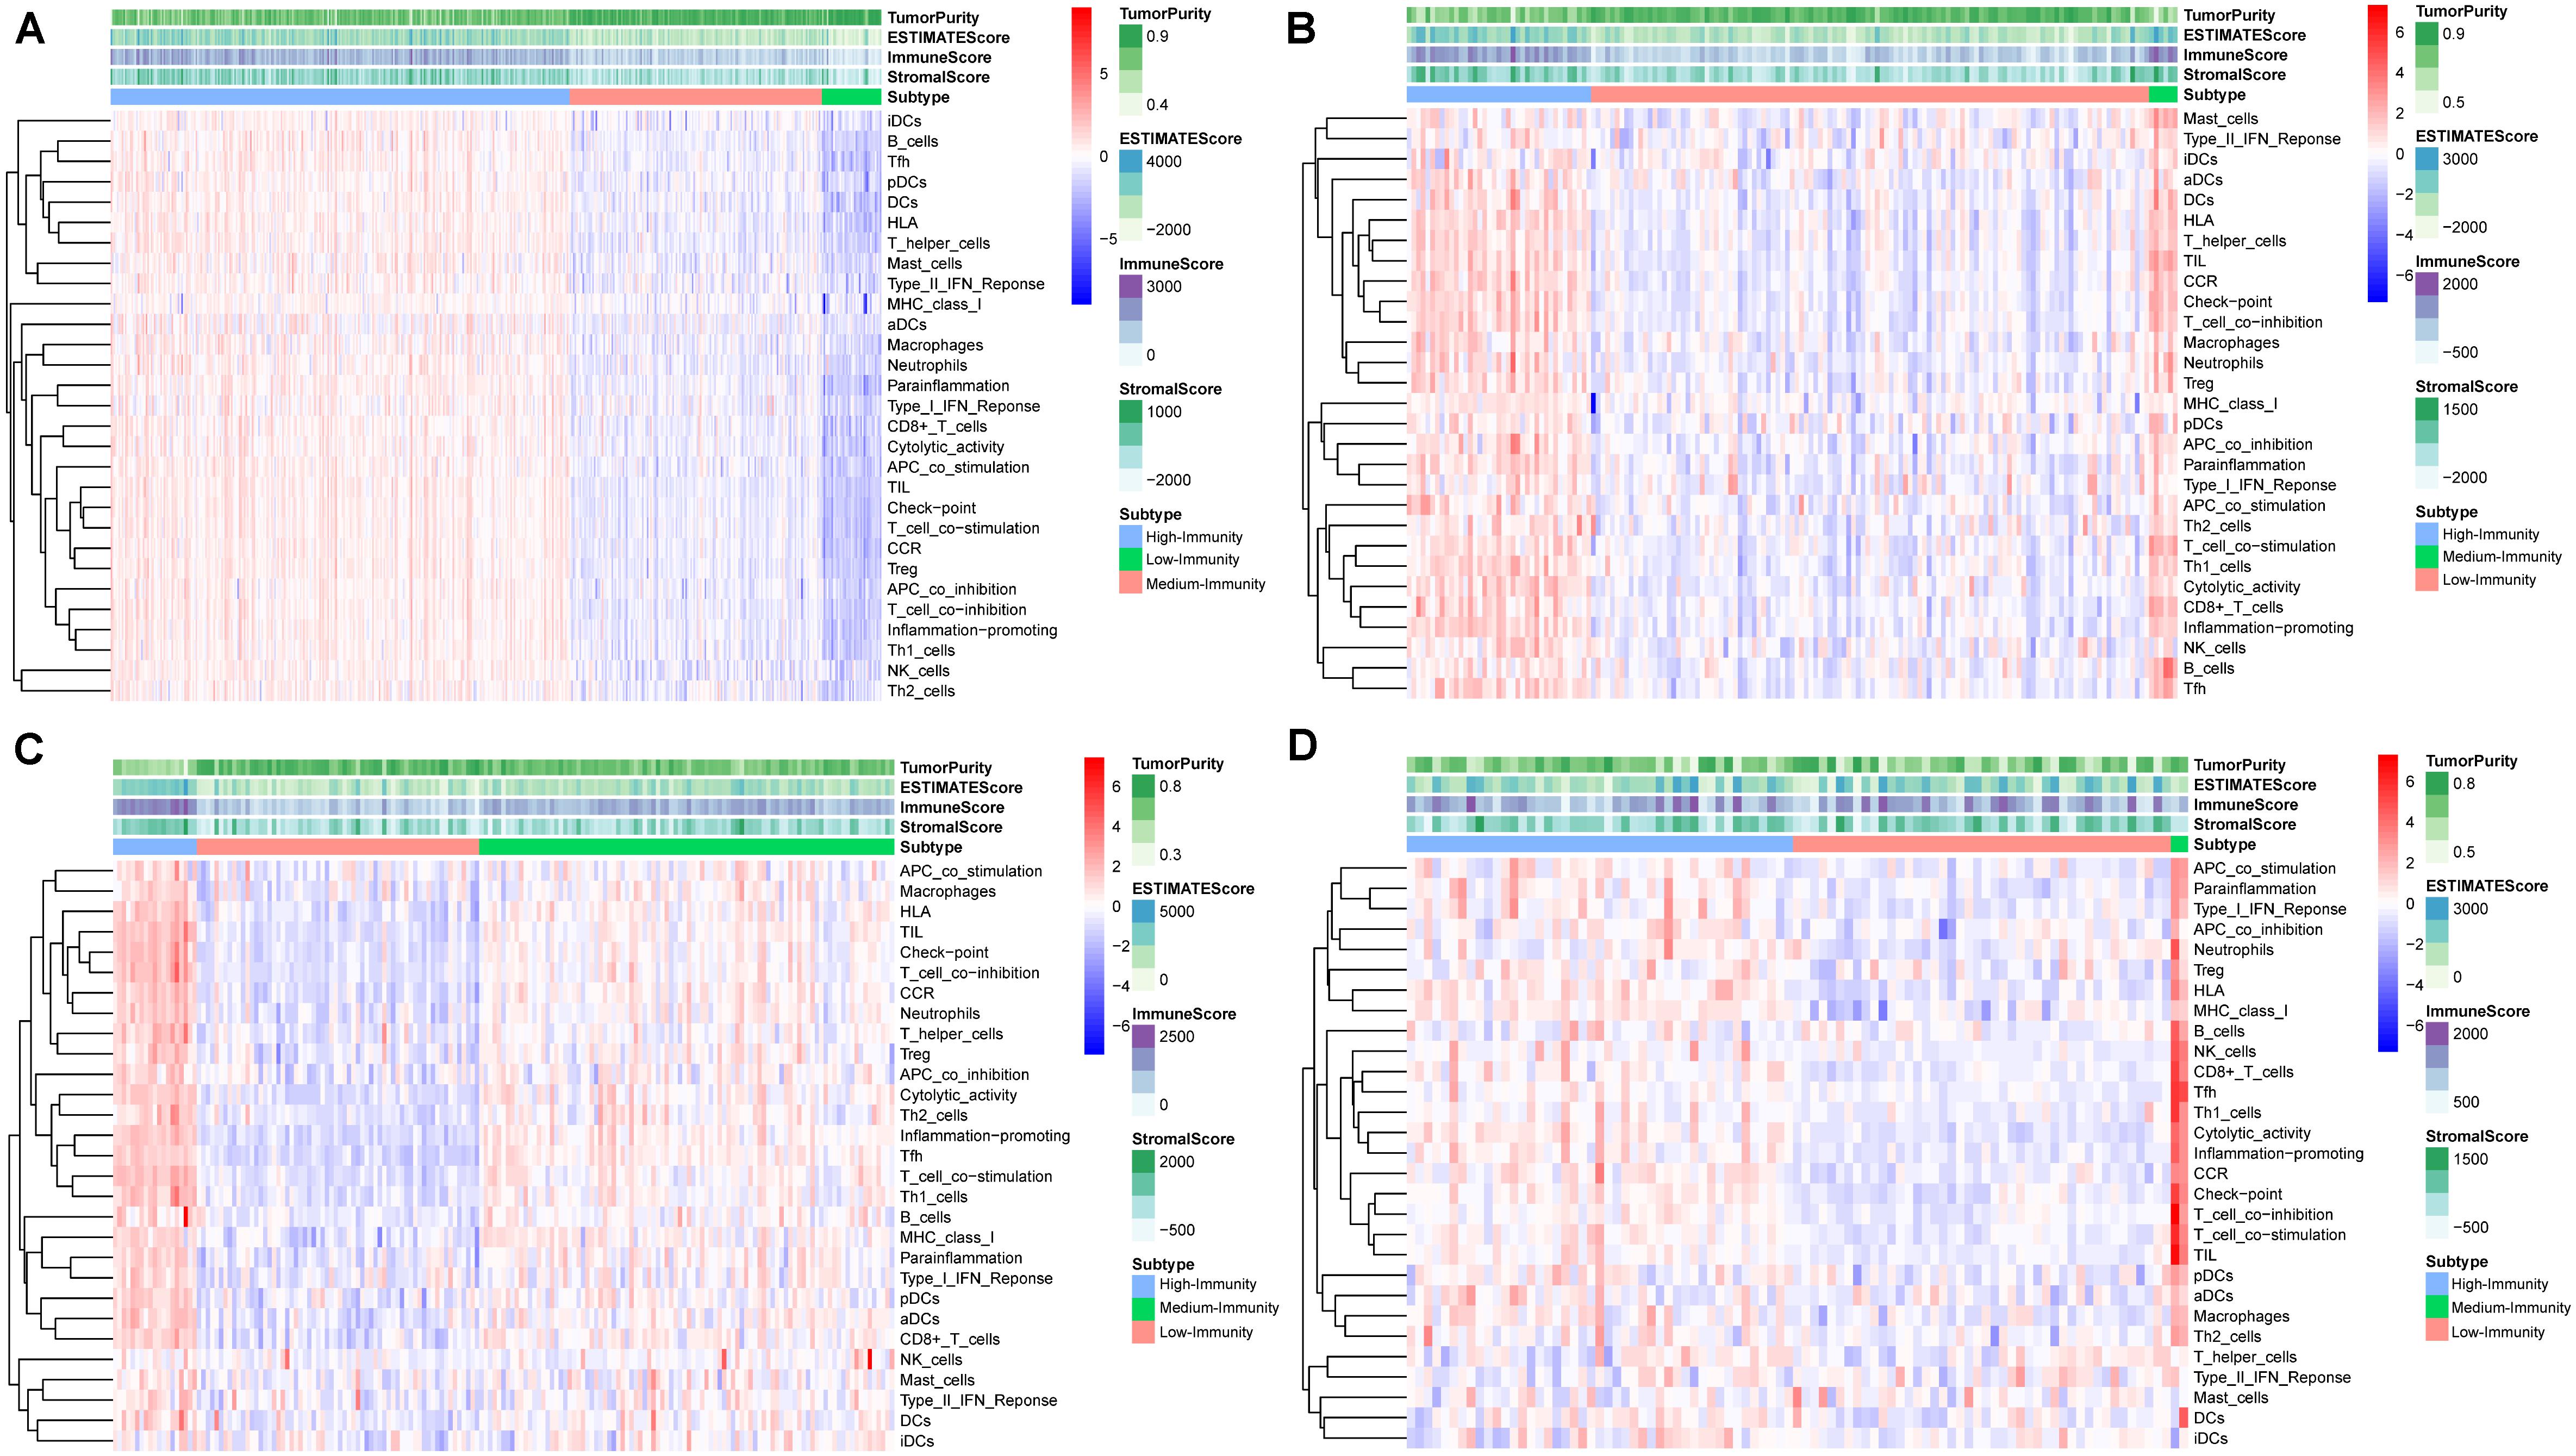
Figure 2. Hierarchical clustering of colon and rectal cancer yields three stable subtypes in four different datasets named High-Immunity Subtype, Medium-Immunity Subtype and Low-Immunity Subtype. Tumor purity, Stromal score, and Immune score were evaluated by ESTIMATE. (A) The colon cancer patients in TCGA-COAD database. (B) The rectal cancer patients in TCGA-READ database. (C) The colon cancer patients in GSE17536 database. (D) The colon cancer patients in GSE109057 database.
Composition of Immune Cells in Three Colon and Rectal Cancer Subtypes
The result showed that the High-Immunity Subtype have significantly higher immune scores than Low-Immunity Subtype in colon and rectal cancer (Figures 3A,B). Mann–Whitney U test. ∗∗p < 0.01; ∗∗∗p < 0.001; p ≥ 0.05, not significant. Besides the levels of TMB were similar with immune scores in High-Immunity Subtype and Low-Immunity Subtype, which showed that the TMB was associated with different Immunity types Figures 3C,D. Kruskal–Wallis rank sum test. ∗∗p < 0.01; ∗∗∗p < 0.001; p ≥ 0.05, not significant. Owing to the significant value of 29 immune-associated gene, we tended to establish a comprehensive exploration of these genes’ molecular characteristics. The result of genetic alterations testing showed that Missense Mutation was commonly occurring type of mutation (Figure 3E). Besides We embarked on the immune cell constitution in colon and rectal cancer tissues versus normal colon tissues in Figure 4B. From the results, the fractions of M1 macrophages, activated CD4+ memory T cells, M1 macrophages, activated NK cells, and neutrophils were consistently higher in the High-Immunity Subtype than in the Low-Immunity Subtype in colon cancer. The fractions of activated CD8+ memory T cells, B cells and Plasma cells were consistently higher in the High-Immunity Subtype than in the Low-Immunity Subtype in rectal cancer. And a summary of the immune cell composition in tumor cases showed that macrophages M1, macrophages M2, mast cells, T cells and neutrophils were most common immune cell fractions in colon and rectal cancer in Figures 4A,D. Besides different types of immune cells affect each other’s fractions, macrophages M0 in high fractions may decrease the fractions of activated CD8+ memory T cells (Figures 4C,E).
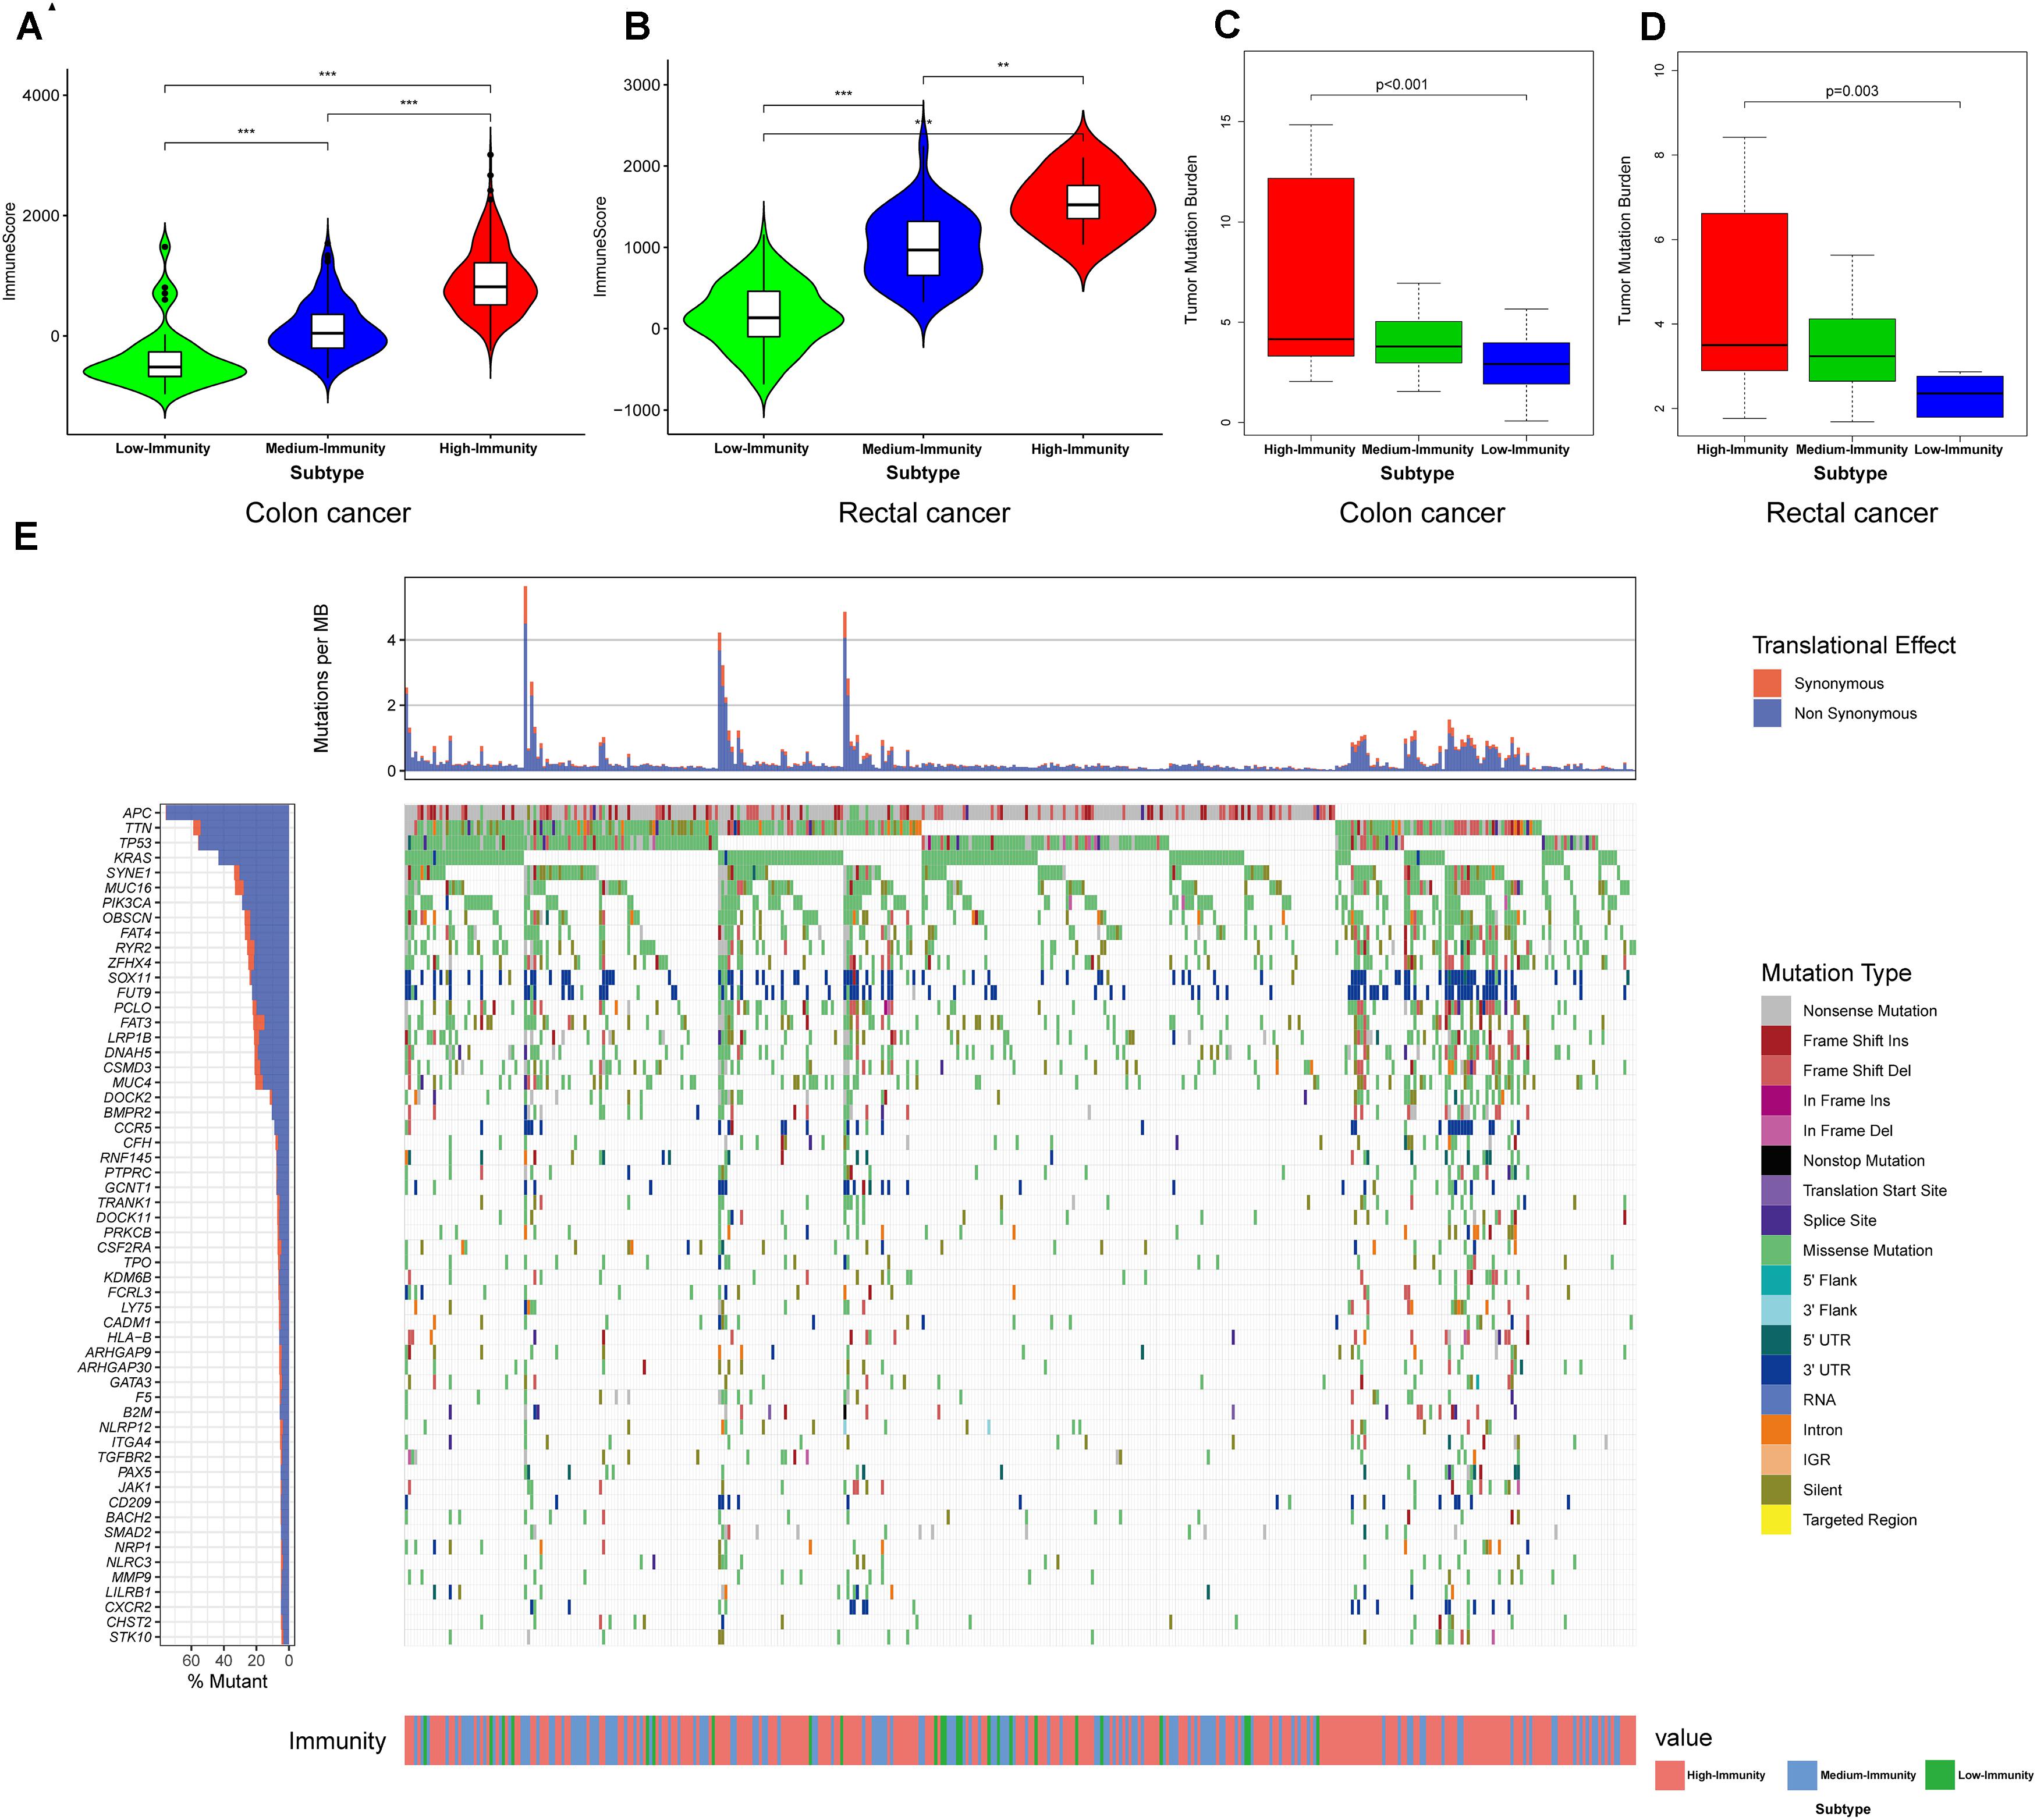
Figure 3. Three Immunity subtypes show differential phenotypes. (A,B) Comparison of the immune cell infiltration levels between three colorectal cancer subtypes. Mann–Whitney U test. (C,D) Comparison of the TMB levels between three colorectal cancer subtypes. Kruskal–Wallis rank sum test. **p < 0.01; ***p < 0.001; p ≥ 0.05, not significant. (E) Mutation landscape of immune-related genes.
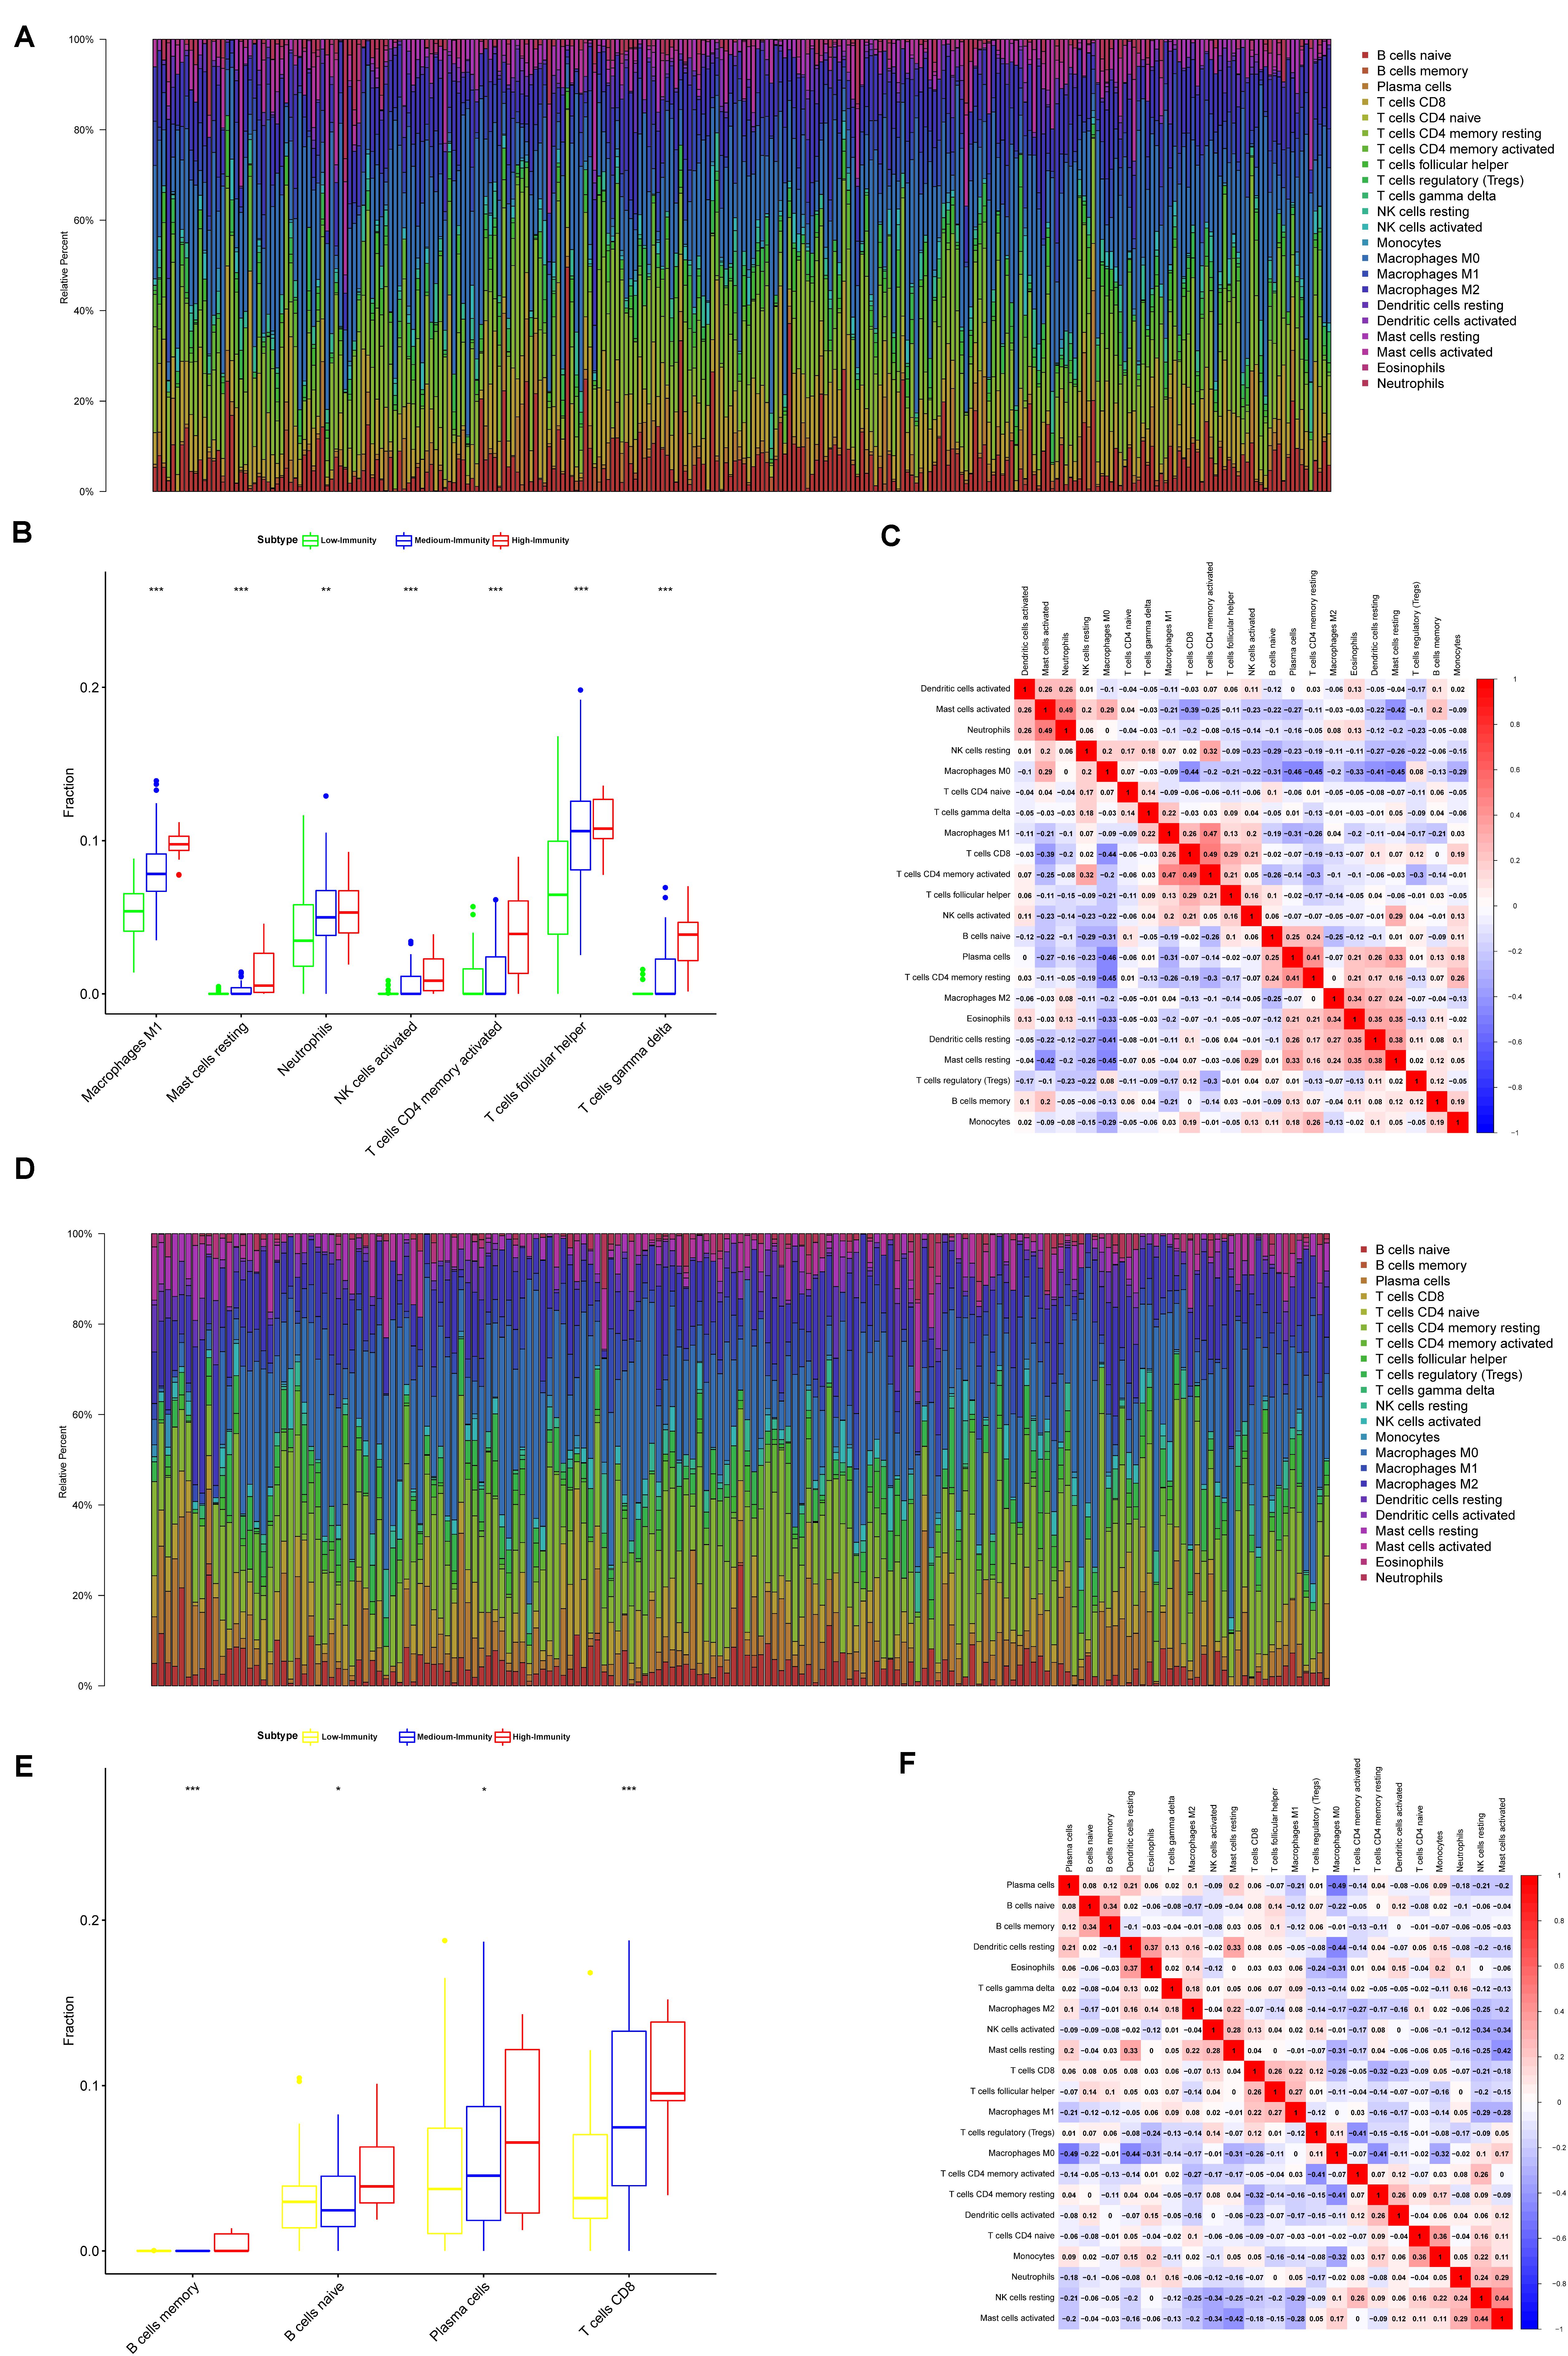
Figure 4. Composition of immune cells in three colon and rectal cancer subtypes and correlation analysis. (A) Barplot showing the fractions of 22 immune cells of colon cancer patients in TCGA-COAD database. Column names of plot were sample ID. (B) Comparison of the proportions of immune cell subsets between colon cancer subtypes in TCGA-COAD. ANOVA test, P values are shown. *P < 0.05; **P < 0.01; ***P < 0.001; p ≥ 0.05, not significant. (C) Heatmap showing the correlation between immune cells of colon cancer cases in TCGA-COAD database. The shade of each tiny color box represented corresponding correlation value between two cells. (D) Barplot showing the fractions of 22 immune cells of colon cancer patients in TCGA-READ database. Column names of plot were sample ID. (E) Comparison of the proportions of immune cell subsets between rectal cancer subtypes in TCGA-READ database. ANOVA test, P values are shown. *P < 0.05; **P < 0.01; ***P < 0.001; p ≥ 0.05, not significant. (F) Heatmap showing the correlation between immune cells of colon cancer cases in TCGA-READ database. The shade of each tiny color box represented corresponding correlation value between two cells.
Expression of Genes on Immune Cells Showed Significantly Higher Expression Levels in High-Immunity Subtype
We found that the expression of most HLA genes were significantly higher in High-Immunity Subtype than in Low-Immunity Subtype (Kruskal-Wallis test, P < 0.001) (Figure 5). Besides the expression of various immune cell subpopulation marker genes (Yoshihara et al., 2013) were the highest in High-Immunity Subtype and the lowest in Low-Immunity Subtype, such as CD8A (CD8+ T cells), TNFSF14 (APC co stimulation), CD79A (B cells), CD28 (Tumor Infiltrating Lymphocyte), and CD28 (T cell co-stimulation) in colon and rectal cancer (Figure 5). ANOVA test. P < 0.01; ∗P < 0.05; ∗∗P < 0.01; ∗∗∗P < 0.001.
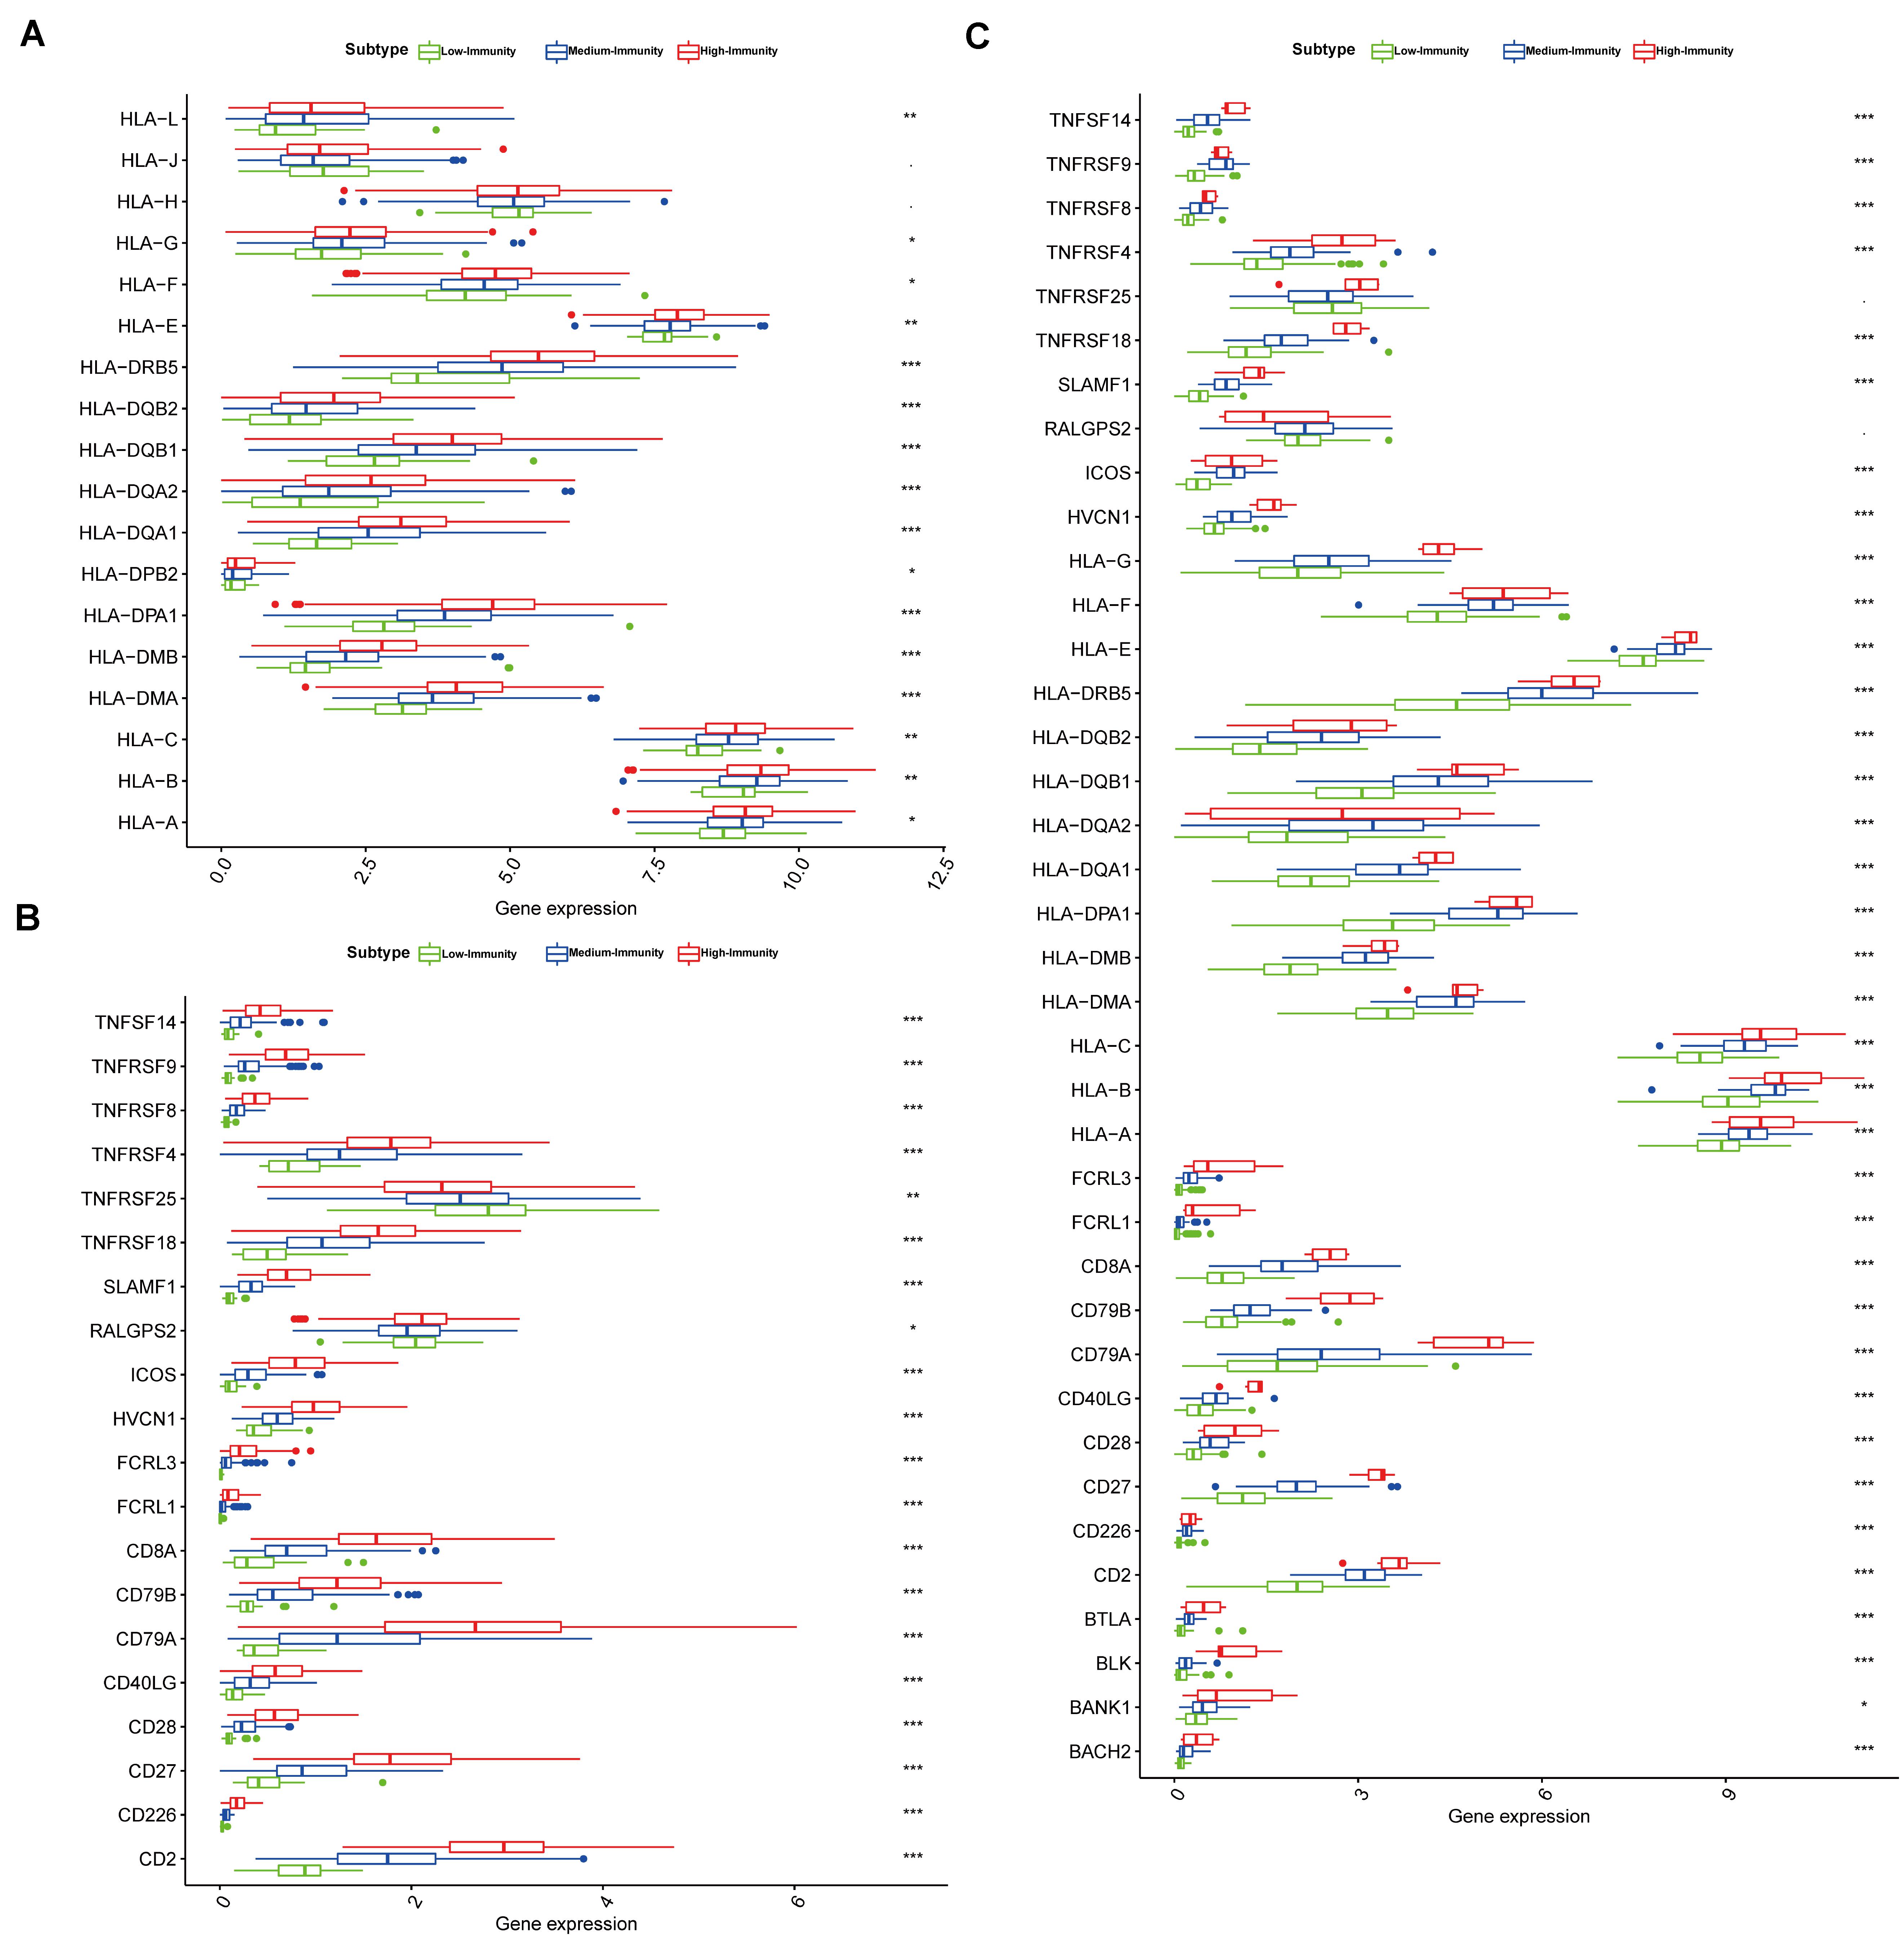
Figure 5. Three colon and rectal cancer subtypes show differential phenotypes. (A) Comparison of the expression levels of HLA genes between colon cancer subtypes in TCGA-COAD database. ANOVA test. (B) Comparison of the expression levels of genes on immune cells between colon cancer subtypes in TCGA-COAD database. (C) Comparison of the expression levels of genes on immune cells between rectal cancer subtypes in TCGA-READ database. ANOVA test P < 0.01; *P < 0.05; **P < 0.01; ***P < 0.001.
Identification of Subtype-Specific Pathways, and Gene Ontology of Colon and Rectal Cancer
We employed the GSEA to indent the KEGG pathways and gene ontology enriched in High-Immunity Subtype and Low-Immunity Subtype (Figures 6A,B). Notably, the positive regulation of humoral immune response, up-regulation of mast cell activation associated with immune response, regulation of T-helper 1,2 cell differentiation and establishment of T cell polarity. Besides the pathways on Immunity moderation were highly increased in High-Immunity Subtype and included antigen processing and presentation pathways, NF-kappa B signaling, p53 signaling pathway, VEGF signaling pathway, Hippo signaling pathway, PI3K-Akt and mTOR signaling pathway and MAPK signaling pathway, which proved that the immune activity was promoted in High-Immunity Subtype. And some previous study proved that the promotion of PI3K-Akt and MAPK cascades positively associated with the elevated of various immune pathways (Sun, 2017). Besides the immune scores were related with colon cancer Stage. The immune scores of Stage IV was lower than Stage I. Based on the selection criteria after preprocessing the raw data, we identified the DEGs of High-Immunity Subtype and Low-Immunity Subtype in TCGA-COAD and TCGA-READ. 2378 DEGs between High-Immunity Subtype and Low-Immunity Subtype colon cancer were identified in TCGA-COAD dataset. The DEGs were analyzed for co-expression network analysis with employing the WGCNA package, and finally, a total of 18 modules were identified. The ME in the brown, yellow, red and pink modules showed significantly higher association with cancer progression than other modules. And more, the four modules with cancer development was identified as the clinically significant module, which was selected for further analysis (Figures 6C,E–F). Kaplan–Meier curves for OS based on three colon cancer immune subtypes. The High-Immunity Subtype had the best survival, whereas other classes were associated with poor outcome (Figure 6D). Log-rank test, p = 0.008. We screened hub DEGs with excellent biomarker potential to evaluate prognosis between three immunity types in colon cancer. A forest plot of expression profiles based on multivariate Cox regression analysis revealed that this immune-based prognostic index could be a significant tool for the assessment of colon cancer prognosis (Figure 6G). And the expression of six DEGs were higher in High-Immunity Subtype than in Low-Immunity Subtype in colon cancer (Figure 6H). ANOVA test ∗∗P < 0.01; ∗∗∗P < 0.001.
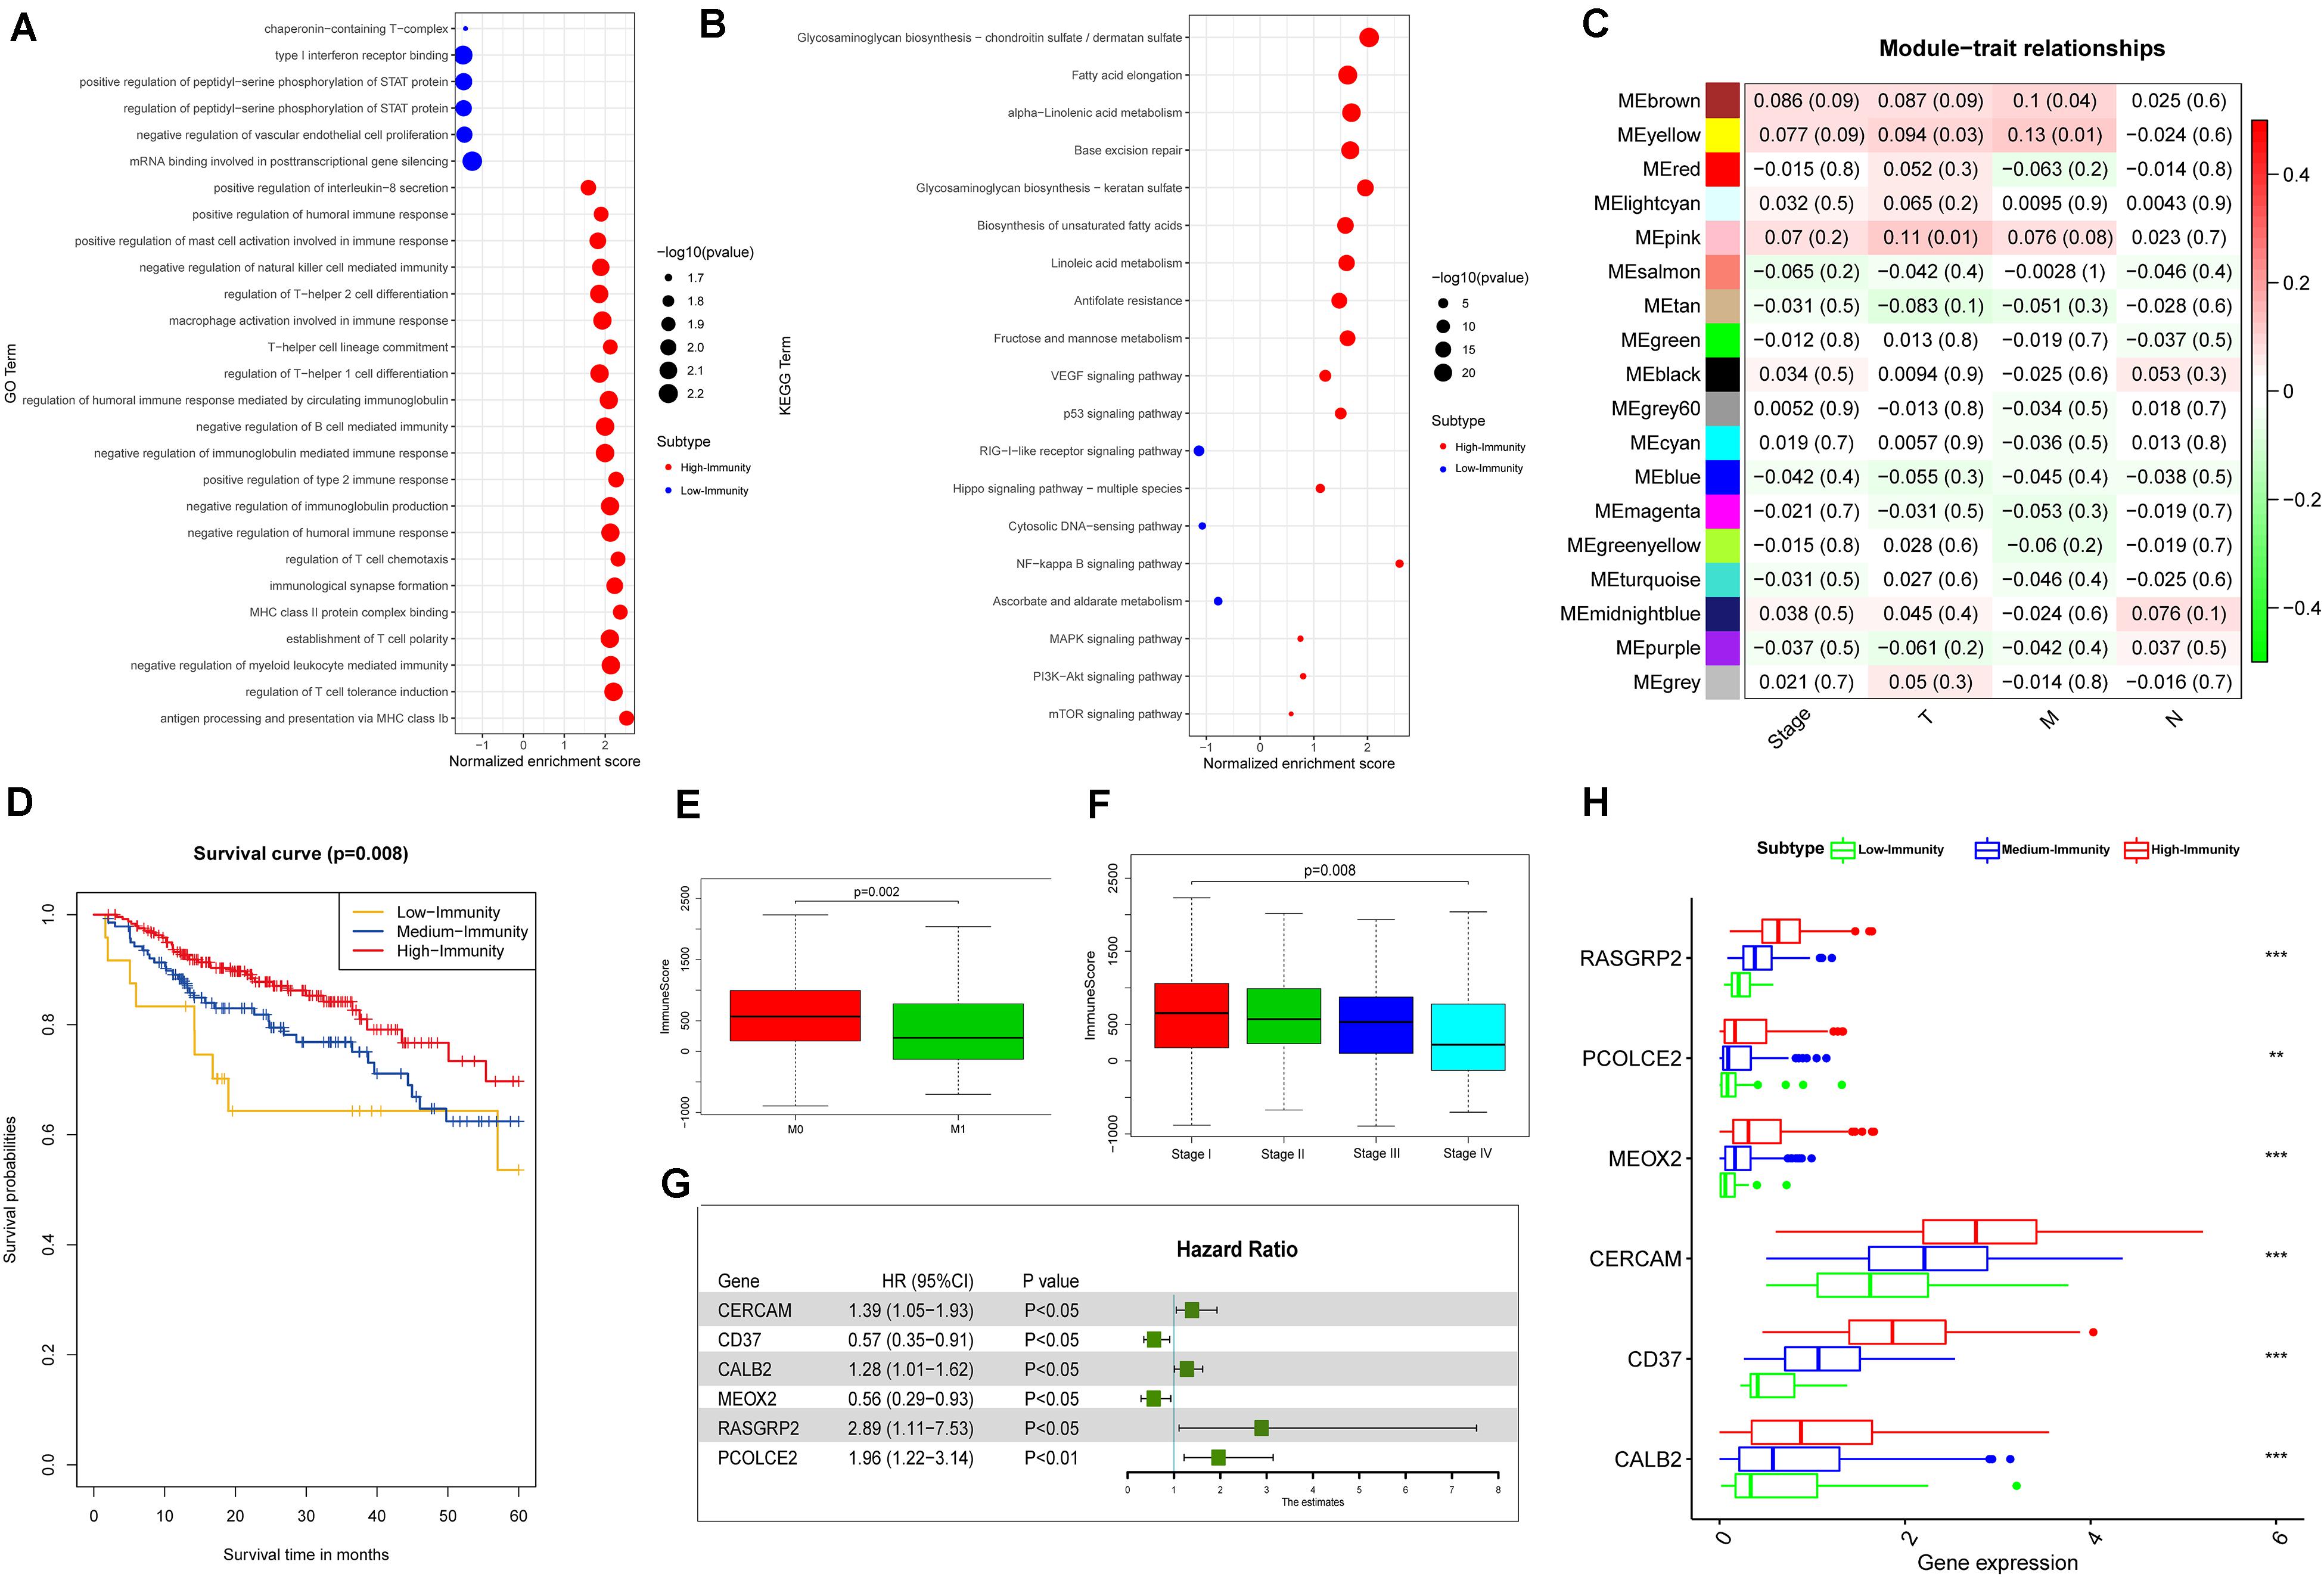
Figure 6. Identification of colon and rectal cancer subtype-specific pathways, gene ontology, DEGs and networks. (A) Gene ontology enriched in High-Immunity Subtype and Low-Immunity Subtype of colon cancer in TCGA-COAD database. (B) KEGG pathways enriched in High-Immunity Subtype and Low-Immunity Subtype of colon cancer in TCGA-COAD database. (C) Heatmap of the correlation between MEs and clinical traits of colon cancer. (D) Kaplan–Meier curves for OS based on three colon cancer immune subtypes. The High-Immunity Subtype had the best survival, whereas other classes were associated with poor outcome (log-rank test, p = 0.008). (E,F) Comparison of the immune cell infiltration levels between Stage and M-Stage in colon cancer. Wilcoxon rank sum or Kruskal–Wallis rank sum test served as the statistical significance test. **p < 0.01; ***p < 0.001. (G) Forest plot of hazard ratios showing the prognostic values of five hub genes with multivariable Cox analyses. (H) Comparison of the expression levels of five hub genes between colon cancer subtypes in TCGA-COAD database. ANOVA test. **P < 0.01, ***P < 0.001.
Correlation of Immune Cells Proportion With Six-Gene Signature Expression
To further confirm the correlation of six-gene signature expression with the immune microenvironment, and 22 kinds of immune cell profiles in COAD samples were constructed. The results from the difference and correlation analyses showed that lots kinds of immune cells were correlated with the expression of six-gene signature (Figure 7 and Supplementary Figures S1, S2). Among them, T cells and Macrophages positively correlated with CALB2, CD37, CERCAM, MEOX2, RASGRP2, PCOLCE2 expression. The blue line in each plot was fitted linear model indicating the proportion tropism of the immune cell along with six-gene signature expression, and Pearson coefficient was used for the correlation test. These results further supported that the levels of six-gene signature expression affected the immune activity.
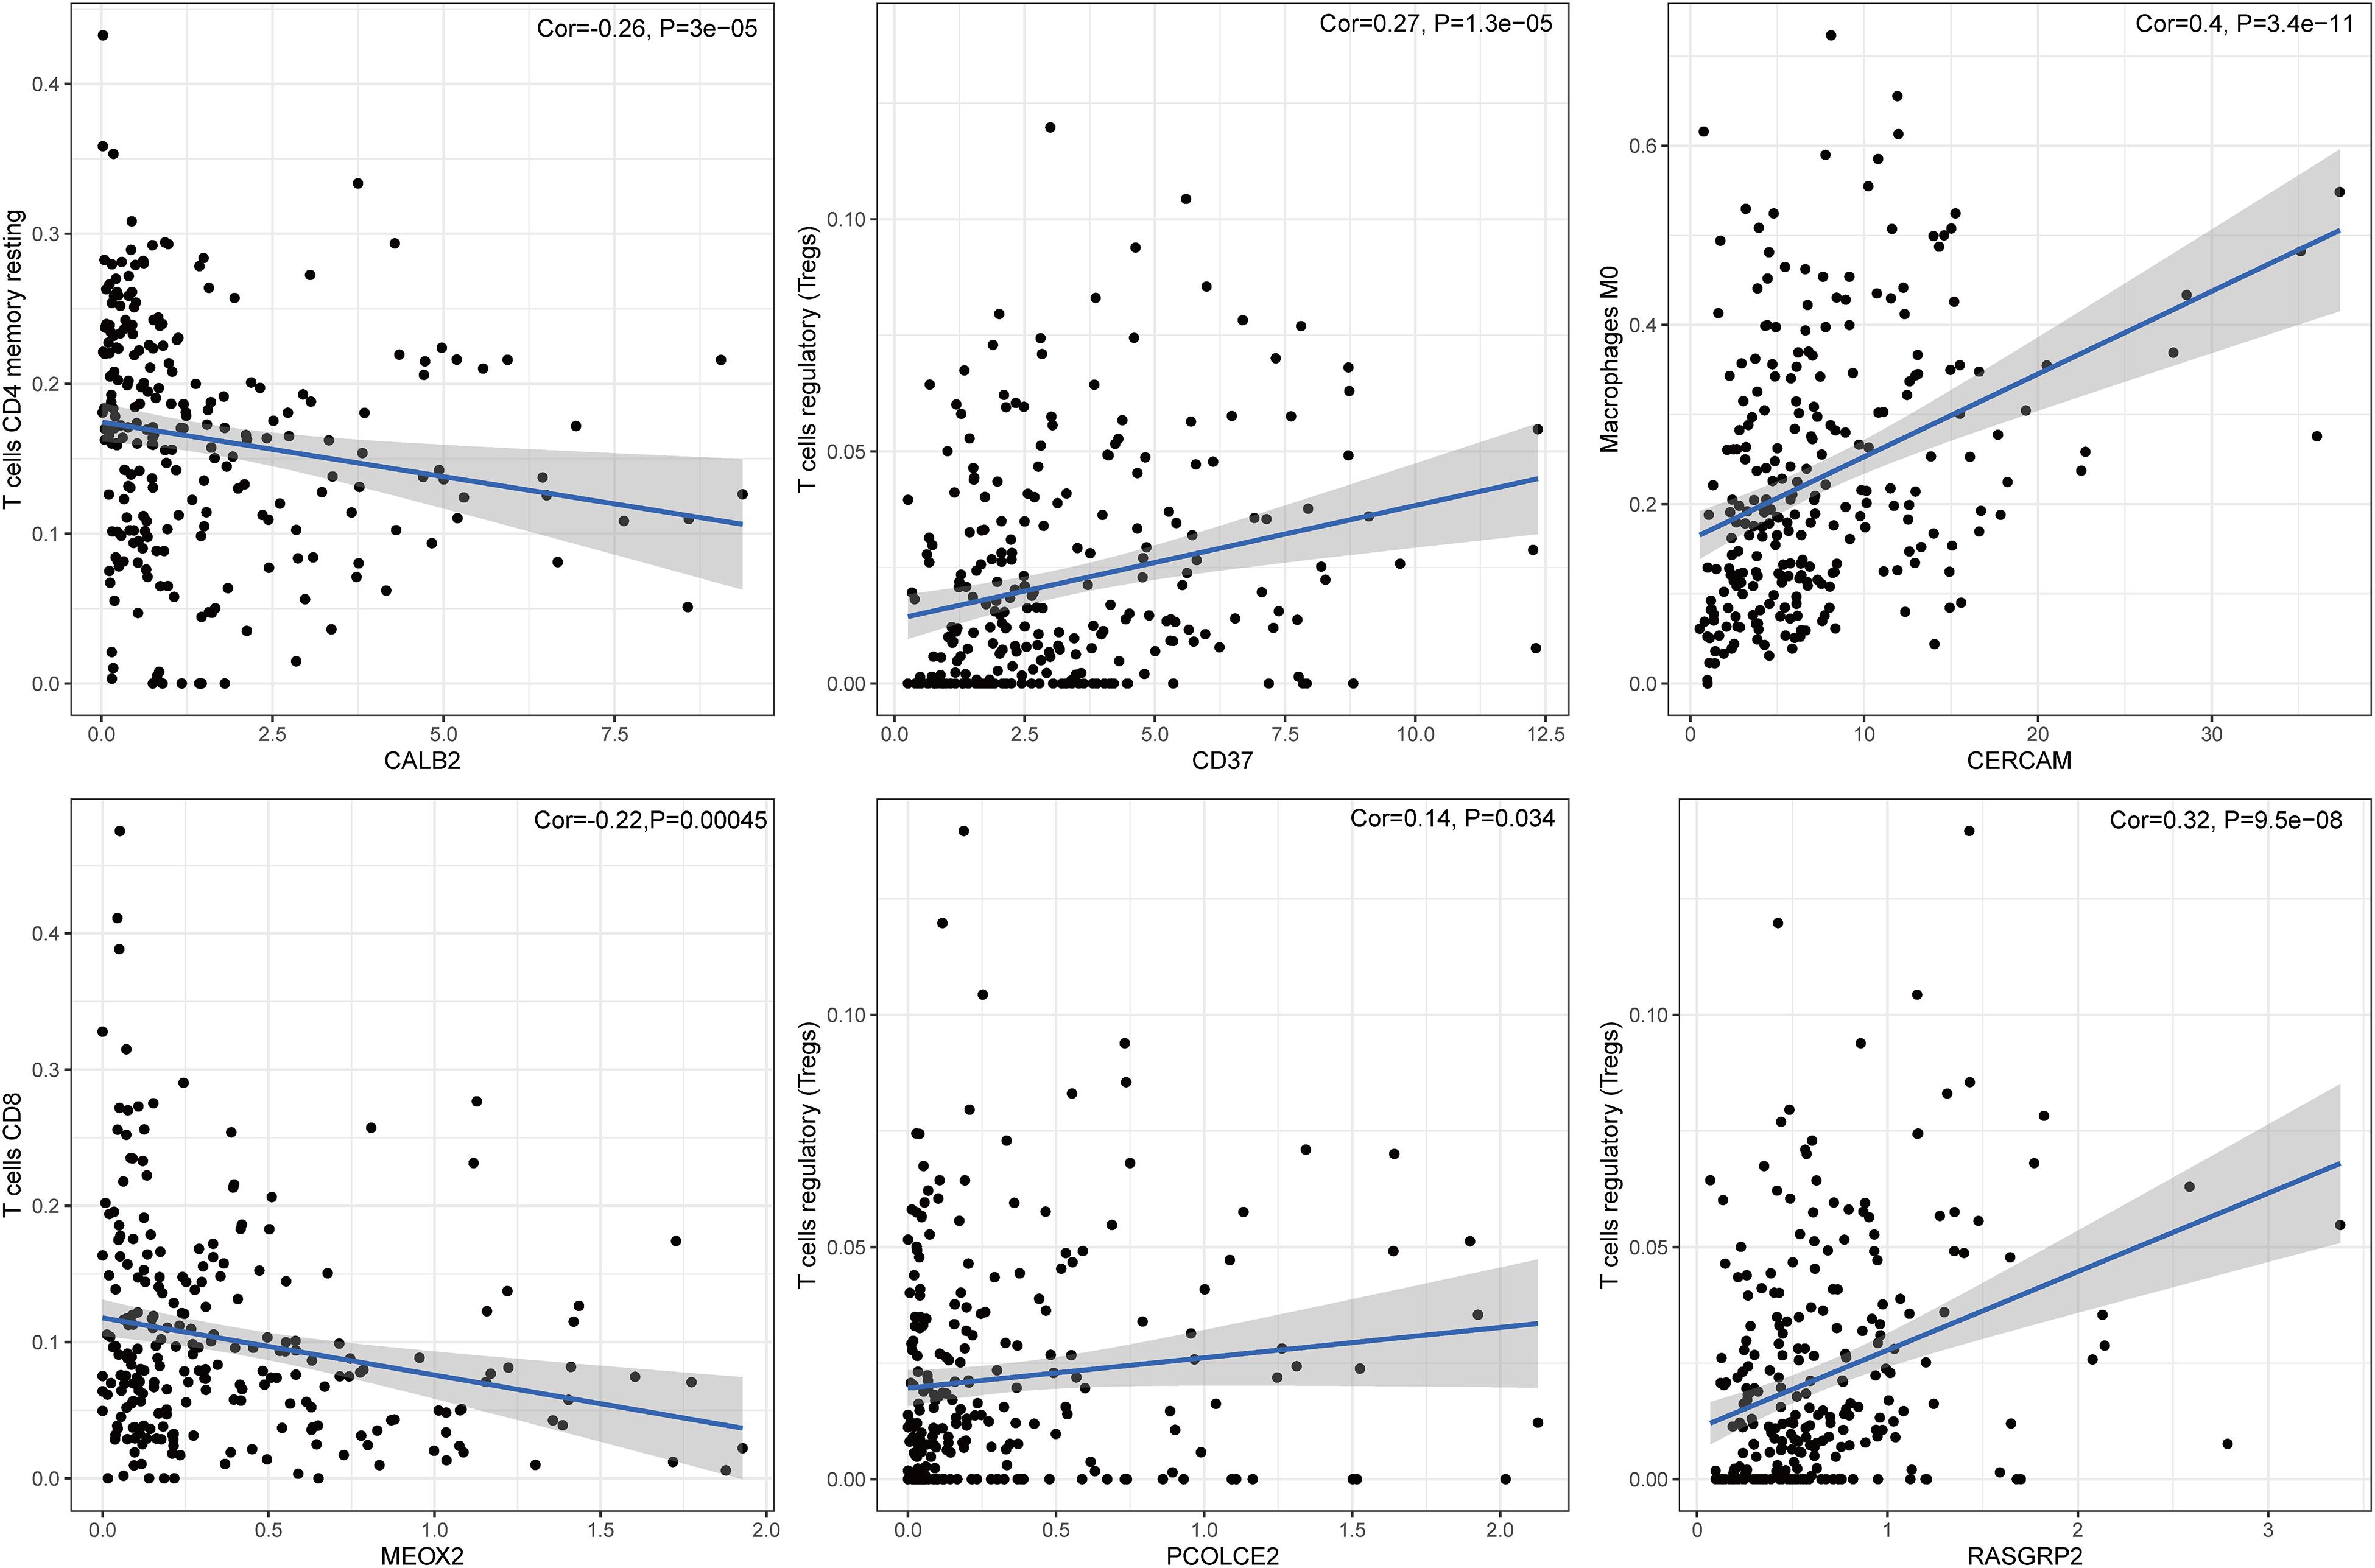
Figure 7. The correlation between immune cell proportion and the expression of six signature genes. The scatter plot showed the correlation of immune cell proportion with the six-gene signature expression (p < 0.05). The blue line in each plot was fitted by a linear model indicating the proportion tropism of the immune cell along with six-gene signature expression, and the Pearson coefficient was used for the correlation test.
Prognostic Value of Overlapped DEGs Between High-Immunity Subtype and Low-Immunity Subtype in Colon and Rectal Cancer
According to the multivariate Cox regression analysis, we established a prognostic signature to divide the colon cancer and rectal cancer patients into two groups with discrete clinical outcomes with regards to OS (Figure 8). The prognostic index formula for colon cancer was as follows: Risk scores = [Status of CERCAM × (0.3314)] + [Status of CD37 × (−0.5627)] + [Status of CALB2 × 0.2474] + [Status of MEOX2 × (−0.5889)] + [Status of RASGRP2 × (1.0606)] + [Status of PCOLCE2 × (0.6738)]. This prognostic index based on the immune subtypes could be a valuable tool for distinguishing among colon and rectal cancer patients on the base of potential discrete clinical outcomes. We calculated the risk scores of hub genes and divided the patients into a high-risk group and a low-risk group on the basis of the median risk score in colon and rectal cancer. The correlation of gene expression and survival status is shown in Figures 8A–D. The results of survival analysis proved that the OS of the high-risk group was significantly lower than that of the low-risk colon cancer patients (log-rank test, p < 0.001). The area under the ROC curve was 0.731 in colon cancer, which indicated a moderate power of the prognostic signature based on DEGs between the high-immunity subtype and low-immunity subtype in survival monitoring. The predictive power of this index for the OS of colon and rectal cancer patients was investigated in the validation cohort (Figures 8E–H). The results of this prognostic index suggested a significant difference between the high-risk group and low-risk group with regard to the OS of rectal cancer patients in the validation cohort (log-rank test, p < 0.05). A nomogram for predicting the 3- and 5-year OS was established based on the independent variables (Figure 9A). The age, Stage-T, Stage-M, Immunity Type and Six-gene model were further included in the nomogram. A weighted total score calculated from these factors was applied to predict the 3- and 5-year OS of the colon cancer patients. The nomogram cohort was divided into 4 equal groups for validation. The error bars represent the 95% CIs of these estimates. A closer distance between two curves suggests higher accuracy (Figure 9B).
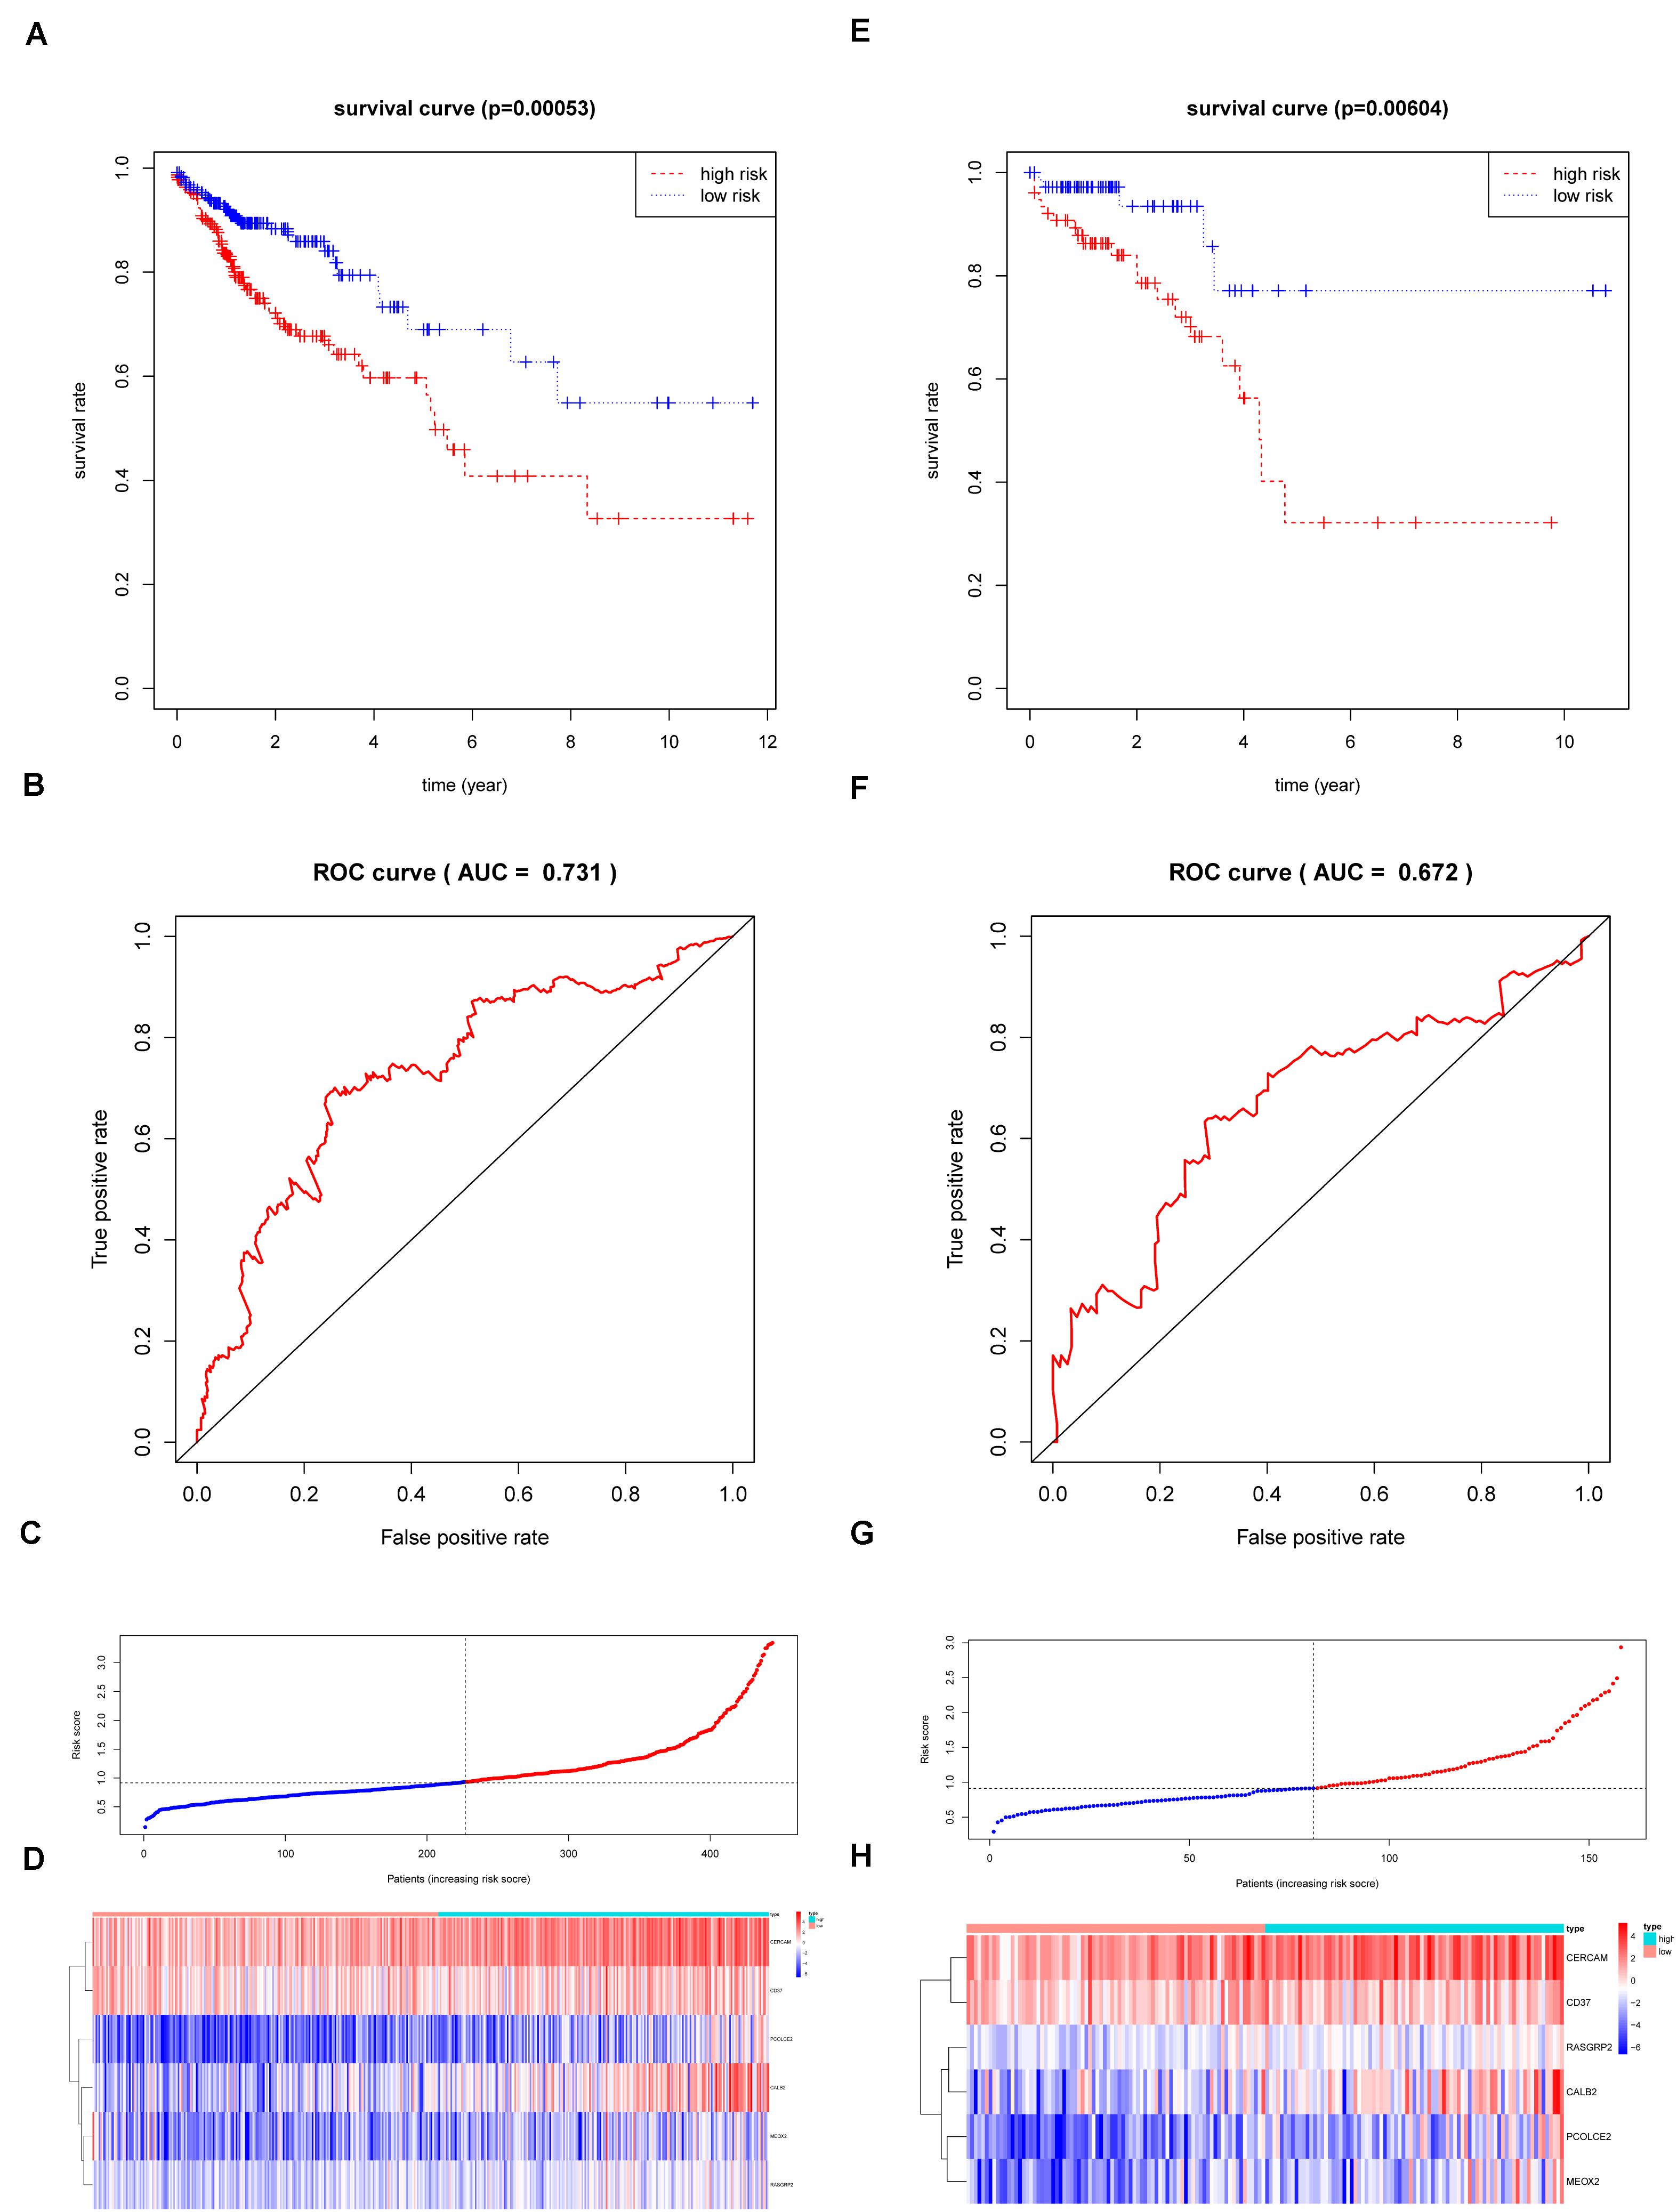
Figure 8. The Survival analysis and prognostic performance of the six-gene signature of colon and rectal cancer. (A) The Kaplan–Meier test of the risk score for the overall survival of colon cancer between high-risk and low-risk patients in TCGA-COAD database (log-rank test, p < 0.001); (B) The prognostic value of the risk score showed by the time-dependent receiver operating characteristic (ROC) curve for predicting the 5 years overall survival. in TCGA-COAD database; (C) Risk score curve of the six-gene signature of colon cancer in TCGA-COAD database; (D) Heatmap showed the expression of six genes by risk score of colon cancer in TCGA-COAD database; (E) The Kaplan–Meier test of the risk score for the overall survival of rectal cancer between high-risk and low-risk patients in TCGA-READ database (log-rank test, p < 0.001); (F) The prognostic value of the risk score showed by the time-dependent receiver operating characteristic (ROC) curve for predicting the 5 years overall survival in TCGA-COAD database; (G) Risk score curve of the six-gene signature of rectal cancer in TCGA-READ database; (H) Heatmap showed the expression of six genes by risk score of rectal cancer in TCGA-READ database.
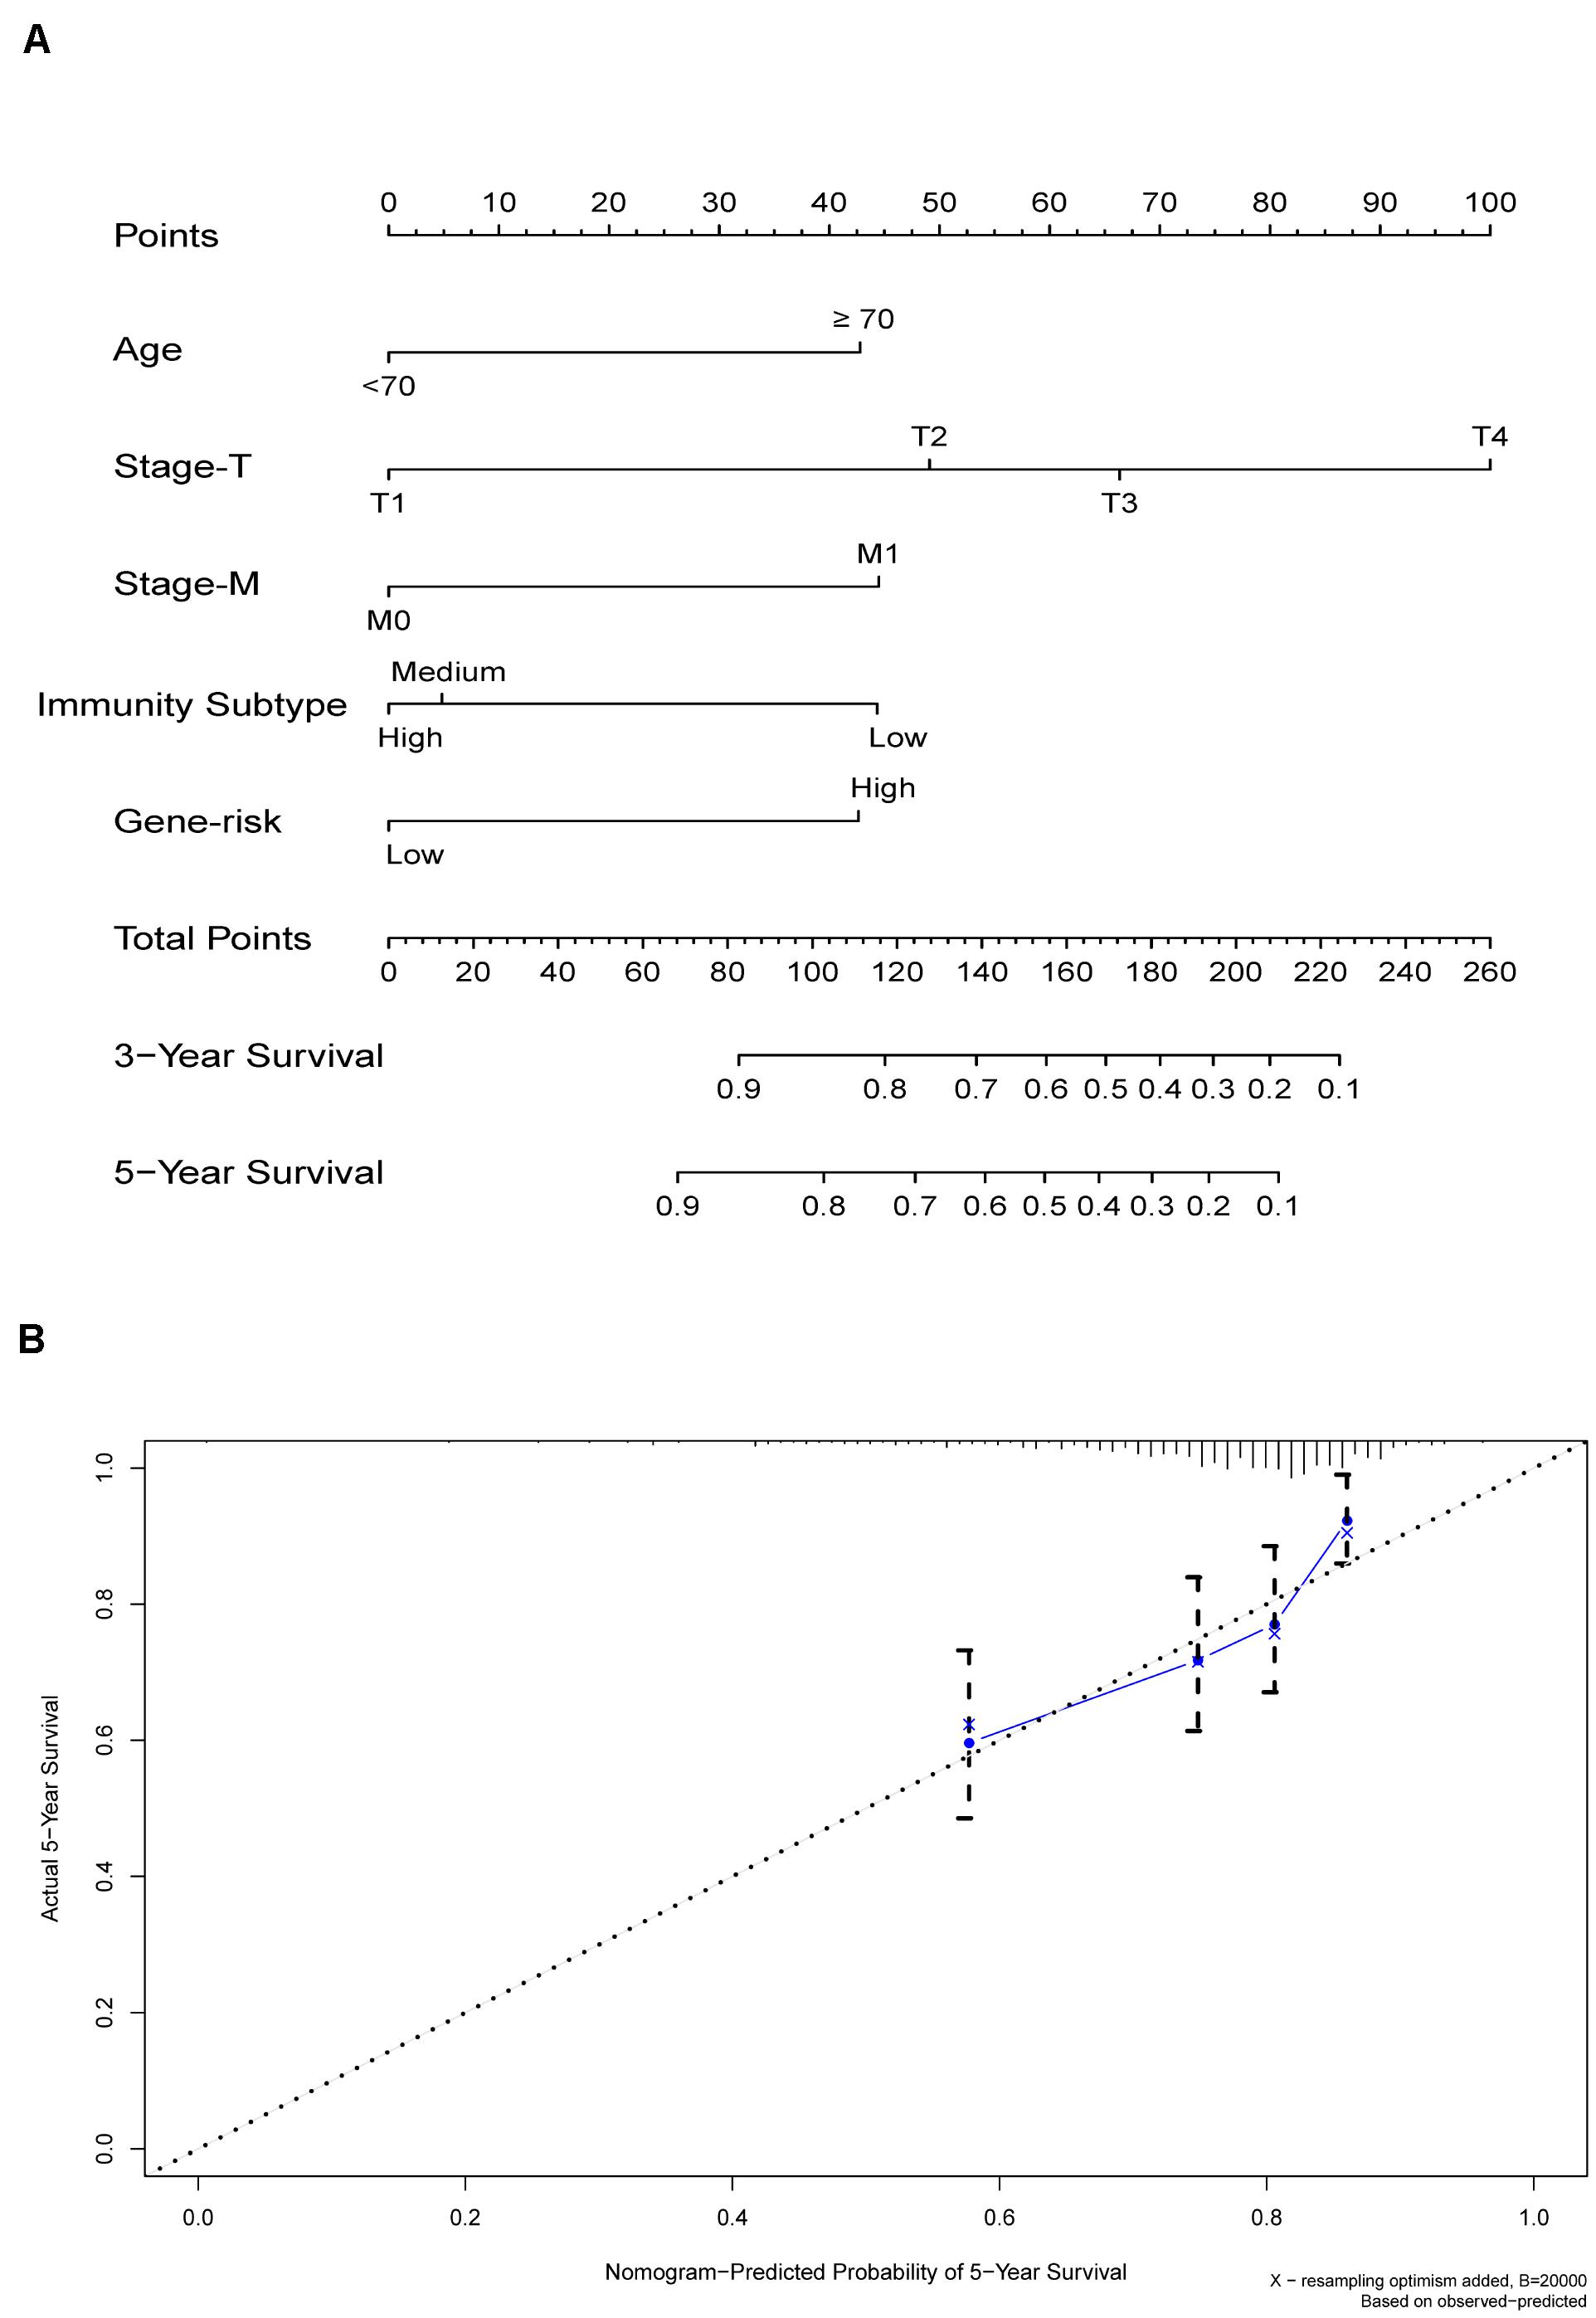
Figure 9. (A) Nomogram for predicting 3- and 5-year OS in colon cancer. To calculate probability of OS, first determine the value for each factor by drawing a vertical line from that factor to the points scale. “Points” is a scoring scale for each factor, and “total points” is a scale for total score. Then sum all of the individual values and draw a vertical line from the total points scale to the 3-, and 5-year OS probability lines to obtain OS estimates. (B) The nomogram cohort was divided into four equal groups for validation. The gray line represents the perfect match between the actual (y-axis) and nomogram-predicted (x-axis) survival probabilities. Black circles represent nomogram-predicted probabilities for each group, and X’s represent the bootstrap-corrected estimates. Error bars represent the 95% CIs of these estimates. A closer distance between two curves suggests higher accuracy.
The Six-Gene Signature Had Potential to Be Indicators of Immune Microenvironment Modulation
Given the levels of prognostic index risk were negatively correlated with the survival, GSEA was employed in the high-risk and the low-risk groups compared with the median level of risk scores. As shown in Figure 10A and Supplementary Table S2, for GO collection defined by MSigDB the genes in high-risk group were mainly enriched in immune-related activities, such as the regulation of cytokine, 2 type response and mast cell mediated immunity. For KEGG collection defined by MSigDB, multiple immune functional singling pathways genes sets were enriched in the high-risk group (Figure 10B and Supplementary Table S2). For HALLMARK collection defined by MSigDB, the genes were enriched in tumor progression-related pathways, including angiogenesis, apoptosis, IL6-JAK and P53 singling pathway (Figure 10C and Supplementary Table S2). For the immunologic gene sets collection defined by MSigDB, multiple immune functional gene sets were enriched in the high-risk group (Figure 10D and Supplementary Table S2).
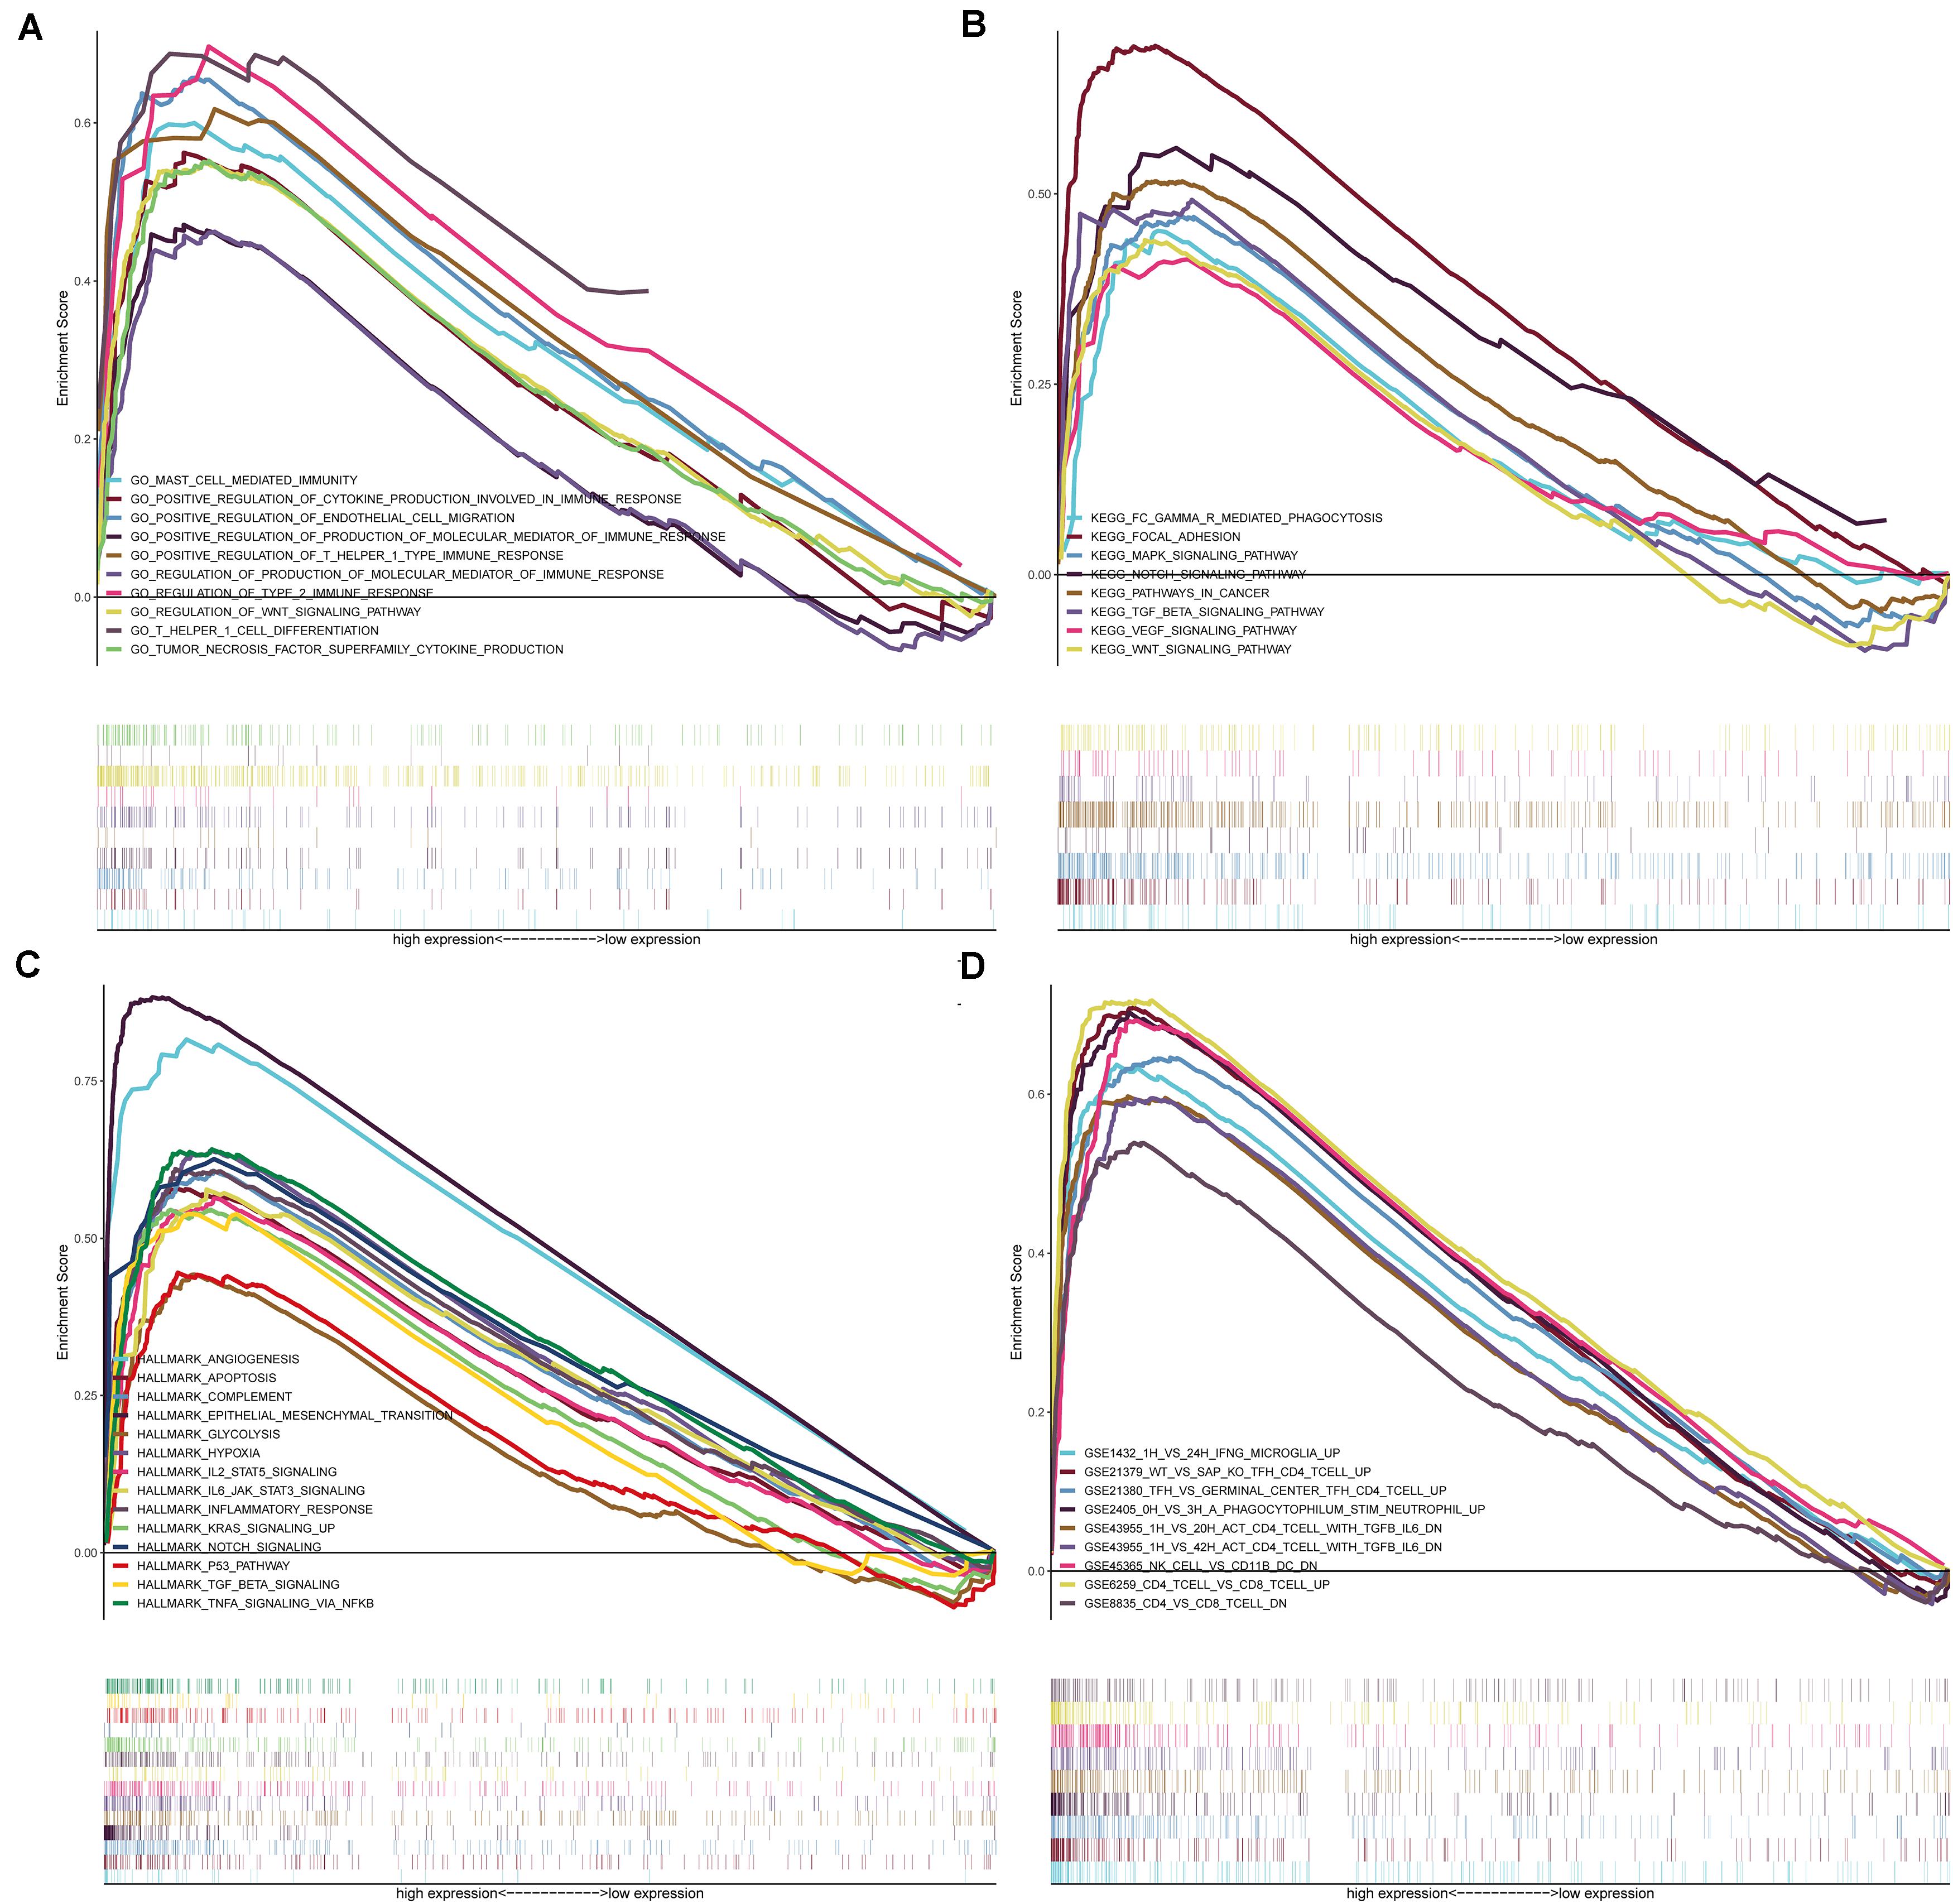
Figure 10. GSEA for samples with high-risk and low-risk based on the prognostic index of six-gene signature. (A) The enriched gene sets in GO collection by the high-risk sample. Each line representing one particular gene set with unique color, and up-regulated genes located in the left approaching the origin of the coordinates, by contrast the down-regulated lay on the right of x-axis. Only gene sets with NOM p < 0.05 and FDR q < 0.05 were considered significant. And only several leading gene sets were displayed in the plot. (B) The enriched gene sets in KEGG by samples with high-risk sample. And only several leading gene sets were displayed in the plot. (C) Enriched gene sets in HALLMARK collection by samples of high-risk sample. Only several leading gene sets are shown in plot. (D) Enriched gene sets in C7 collection, the immunologic gene sets, by samples of high-risk sample. Only several leading gene sets are shown in plot.
Discussion
Although the significance of classification based on immune signatures in tumor immunotherapy has been established, the functions and clinical significance of hub genes have not been explored in colon and rectal cancer. This genome-wide profiling study identified and classified DEGs in colon and rectal cancer, which promotes our understanding of their clinical significance and illuminates potential molecular characteristics. The results show that colon and rectal cancer could be classified into three stable subtypes, a High-Immunity Subtype, Medium-Immunity Subtype, and Low-Immunity Subtype, which were reproducible and predictable. The High-Immunity colon and rectal cancer subtype was enriched in immune response activating and regulating cancer-associated pathways, including the Toll-like receptor signaling pathway, B cell receptor signaling pathway, PI3K-Akt signaling pathway, and NF-κB signaling pathway. Notably, the NF-κB signaling pathway is associated with immune signatures in colon cancer, and it plays a significant role in mediating tumor immunity (Sun, 2017). Moreover, it has a significant negative correlation with the proliferation and differentiation of immune cells as well as the synthesis of immunoglobulins (Su et al., 2017; Wang and Xia, 2018). Additionally, the PI3K-Akt signaling pathway can affect the production of cytokines by T cells and participate in immunosuppression, while mTOR plays a significant role in regulating cell proliferation and protein synthesis, which makes it a promising target for cancer treatment (Lucas et al., 2016; Zheng et al., 2018). The immune signature of the Immunity Low colon cancer subtype was decreased, but enriched in type I interferon receptor binding and serine phosphorylation of STAT protein, which is associates with the regulation of oncogene transcription in tumor apoptosis, proliferation, and angiogenesis (Yu et al., 2009; Li et al., 2017; Zhang et al., 2018). These results indicate the existence of potential positive or negative associations between activation of signaling pathways and immunity in colon and rectal cancer.
The immune context plays a significant role in tumorigenesis and progression, and these insights could influence tumor immunotyping and clinical treatment (Dumauthioz et al., 2018; Locy et al., 2018). Our results showed that the High-Immunity Subtype had stronger immune cell infiltration and anti-tumor immune activity, such as high levels of macrophages, B cells and cytotoxic T cells. Many studies attempted to assess the density of CD8+ and CD3+ lymphocytes in the tumor proper via IHC staining, but the obtained data could not comprehensively reflect the immune cell infiltration and anti-tumor immune activities (Qin et al., 2013; Wong et al., 2018). CIBERSORT was employed to evaluate the proportions of 22 immune cell subsets in colon and rectal cancer, which indicated that CD8+ T cells, M2 macrophages, M1 macrophages, M0 macrophages and mast cells were present4 in higher numbers in the High-Immunity Subtype than in the Low-Immunity Subtype, which confirmed the elevated anti-tumor immune activity in the High-Immunity Subtype. Macrophages represent the first line of defense against foreign pathogens, recognizing a wide range of endogenous and exogenous ligands via important effectors in innate immunity (Duluc et al., 2009; Rhee, 2016). However, M2 macrophages can release pro-angiogenic molecules and growth factors that promote cancer development, as well as inhibit the antitumor immunity of T cells and NK cells (Pollard, 2004; Lewis and Pollard, 2006; Sica et al., 2006), which is in agreement with the findings of this study. In addition, somatic mutations in tumor DNA could give rise to neoantigens recognizable and targetable by the immune system with major histocompatibility complex (MHC) (Wong et al., 2018). As a measure of somatic mutations in cancer cells, TMB is useful in estimating tumor neoantigenic load (Rhee, 2016), and thus critical for the identification of patients likely to respond to immune checkpoint blockade (Wong et al., 2018). In this study, the level of TMB is significantly higher in High-Immunity Subtype than in Medium-Immunity Subtype and Low-Immunity Subtype, confirming the relationship between TMB and immunity.
To investigate the molecular mechanisms and clinical value of potential targets, we established an immune-based prognostic index to develop a convenient and reliable protocol for monitoring the immune status and clinical outcomes in colon and rectal cancer patients. The index is based on the fractions of six genes identified among the differentially expressed genes from the stable High-Immunity and Low-Immunity subtypes, all of which were up-regulated in the High-Immunity Subtype. However, the potential molecular mechanisms of these genes remain poorly understood. Few studies on the function and mechanism of CERCAM in colon and rectal cancer have been published. CD37 belongs to the tetraspanin SUPERFAMILY that is widely expressed and forms complexes with other tetraspanins and MHC class II on mature B cells (Xu-Monette et al., 2016). Some studies indicated that CD37 may be associated with various different cellular processes, including migration, adhesion, proliferation of lymphocytes and survival, and it is significant for interactions between T- and B-cells as well as for immunoglobulin G/immunoglobulin A production (van Spriel et al., 2004, 2009; van Spriel, 2011; Beckwith et al., 2015). Cells with high expression of CALB2 (Calbindin-2) were derived from primary colon tumors, and it could be a diagnostic marker for malignant mesotheliomas (Chu et al., 2005; Blum et al., 2018). Furthermore, CALB2 could be a modifier of 5-fluorouracil sensitivity, promoting cell death in colorectal cancer cells through activation of the intrinsic apoptotic pathway following treatment with this chemotherapy agent (Stevenson et al., 2011). The Mesenchyma MEOX2 (Homeobox 2) was previously shown to be related to malignant progression and clinical prognosis in lung cancer, hepatocellular carcinoma, laryngeal carcinoma and gliomas (Tachon and Masliantsev, 2019). Furthermore, MEOX2 was also found to regulate the migration and proliferation of endothelial cells with NF-kB downregulation (Patel et al., 2005). Additionally, MEOX2 promoter sequences have been treated as part of a test for cancer-specific DNA methylation cluster markers in colorectal cancer, and it may regulate the resistance to chemotherapeutics such as cisplatinum (De Carvalho et al., 2012; Ávila-Moreno et al., 2014). RASGRP2 (RAS guanyl releasing protein 2), is a guanine-nucleotide-exchange-factor that can activate small GTPases, such as Ras and Rap (Irizarry et al., 2003). Additionally, RASGRP2 was identified as a high-avidity target antigen for CD4+ T cells, and its expression is thought to be upregulated by HLA-DR to activate and propagate autoreactive CD4+ T cells (Jelcic et al., 2018). Moreover, RASGRP2 is related to immune-mediated thrombosis and thrombocytopenia, and mediates platelet and T-cell adhesion with integrin-independent neutrophil chemotaxis via integrin-mediated activation of Rap1 (Cifuni et al., 2008; Carbo et al., 2010). Some studies have also shown that RASGRP2 could promote the migratory, invasive and proliferative capacity in vitro, as well as confer chemoresistance in prostate cancer, metastatic melanoma, and colon cancer (Yang et al., 2008; Wang et al., 2017; Wang L.X. et al., 2018). The upregulation of PCOLCE2 expression leads to enhanced extracellular matrix organization, which has in turn promotes cancer cells adhesion, and may be employed to predict tumors with a propensity for developing metastasis in lung cancer, gynecological cancers or rectal cancer (Thutkawkorapin et al., 2016; Adhikary et al., 2017; Lim et al., 2017; Zhang and Wang, 2019). Furthermore, we established the nomogram to predict the survival more accurately for colon cancer patients with visualization results, which can further improve the compliance and therapeutic effect of patients. For example, a 70-year-old (43 points in the model) colon cancer patients with T3 stage (65 points), M0 stage (0 points), High-Immunity Subtype (0 points) with high-risk (42 points) has a total of 150 points, resulting in the estimated 3-, 5-year OS of about 65.0 and 55%. The 3- and 5-year OS of patients with High-Immunity Subtype were both remarkably improved combined with low six-gene signature risk.
There are a number of limitations to this study. For example, we screened the genes by identifying overlapping DEGs from different stable immune subtypes. Although these genes were able to identify the stable immune subtypes of colon and rectal cancer and their prognostic powers was validated in this study, the results are based on RNA-sequencing data, lacking functional validation of the target genes. This should be addressed in future studies. Furthermore, only limited data were used for performance evaluation and it is necessary to collect more datasets for a more comprehensive evaluation. Because of the lack of in vitro or in vivo experiments, the reliability of the analysis of molecular mechanism could be limited. And some prospective study could be carried out to validate the findings of this retrospective study. Functional experiments for the validation of the identified DEGs and corresponding downstream signaling pathways are needed to therapeutic targets and reveal novel diagnostic for colon and rectal cancer. Although the multivariate Cox proportional hazards regression analysis was employed widely to identify key factors involved in the establishment of a prognostic model, several machine learning algorithms might achieve better prediction results, such as Decision Tree, Naïve Bayes, and Random Forest. We will test these algorithms in the future. In the future, many questions remain to be solved on cancer immune therapy, including the correlation between immunogenomics, proteomics, and metabolomics, which can be used to understand the immunological changes in rectal and colon cancer. We hope that our systematic analysis will be of great help in promoting risk stratification, therapeutic decision-making in patients with colon and rectal cancer.
Conclusion
This study demonstrates the utility of colon and rectal cancer immune subtypes based on immune signatures in the diagnosis, treatment evaluation, and prognosis. The proposed DEGs models could assist in formulating more efficient therapeutic strategies for improving the personalized management of colon and rectal cancer patients.
Data Availability Statement
All datasets presented in this study are included in the article/Supplementary Material.
Author Contributions
ZJ, RW, and HL made substantial contributions to the conception and designed the study. ZJ supervised the acquisition of the data. CL, XG, and RW participated in the data analysis and statistical analysis. RW, HL, CL, XG, ZZ, CM, and XW contributed to interpretation of the results. ZZ, CM, and HL performed the revision of manuscript. All authors contributed to the article and approved the submitted version.
Funding
This work was supported by National Program Project for Precision Medicine in National Research and Development Plan of China (2018YFC1315000), Non-profit Central Research Institute Fund of Chinese Academy of Medical Sciences (2018PT32012), and CAMS Innovation Fund for Medical Sciences (CIFMS) (2019-I2M-2-002 and 2017-I2M-1-006).
Conflict of Interest
The authors declare that the research was conducted in the absence of any commercial or financial relationships that could be construed as a potential conflict of interest.
Acknowledgments
The authors acknowledge the great efforts of the TCGA project and GEO in the creation of the database.
Supplementary Material
The Supplementary Material for this article can be found online at: https://www.frontiersin.org/articles/10.3389/fgene.2020.00740/full#supplementary-material
Footnotes
- ^ https://cancergenome.nih.gov/
- ^ https://www.ncbi.nlm.nih.gov/geo/
- ^ http://cibersort.stanford.edu/
- ^ http://www.bioconductor.org/
References
Adhikary, T., Wortmann, A., Finkernagel, F., Lieber, S., Nist, A., Stiewe, T., et al. (2017). Interferon signaling in ascites-associated macrophages is linked to a favorable clinical outcome in a subgroup of ovarian carcinoma patients. BMC Genomics 18:243. doi: 10.1186/s12864-017-3630-9
Ali, H. R., Chlon, L., Pharoah, P. D., and Markowetz, F. (2016). Patterns of immune infiltration in breast cancer and their clinical implications: a gene-expression-based retrospective study. PLoS Med. 13:e1002194. doi: 10.1371/journal.pmed.1002194
Ávila-Moreno, F., Armas-López, L., Álvarez-Moran, A. M., López-Bujanda, Z., Ortiz-Quintero, B., Hidalgo-Miranda, A., et al. (2014). Overexpression of MEOX2 and TWIST1 is associated with H3K27me3 levels and determines lung cancer chemoresistance and prognosis. PLoS One 9:e114104. doi: 10.1371/journal.pone.0114104
Barbie, D. A., Tamayo, P., Boehm, J. S., Kim, S. Y., Moody, S. E., Dunn, I. F., et al. (2009). Systematic RNA interference reveals that oncogenic KRAS-driven cancers require TBK1. Nature 462, 108–112. doi: 10.1038/nature08460
Basile, D., Garattini, S. K., Bonotto, M., Ongaro, E., Casagrande, M., Cattaneo, M., et al. (2017). Immunotherapy for colorectal cancer: where are we heading? Exp. Opin. Biol. Ther. 17, 709–721. doi: 10.1080/14712598.2017.1315405
Becht, E., de Reyniès, A., Giraldo, N. A., Pilati, C., Buttard, B., Lacroix, L., et al. (2016). Immune and stromal classification of colorectal cancer is associated with molecular subtypes and relevant for precision immunotherapy. Clin. Cancer Res. 22, 4057–4066. doi: 10.1158/1078-0432.ccr-15-2879
Beckwith, K. A., Byrd, J. C., and Muthusamy, N. (2015). Tetraspanins as therapeutic targets in hematological malignancy: a concise review. Front. Physiol. 6:91. doi: 10.3389/fphys.2015.00091
Bindea, G., Mlecnik, B., Tosolini, M., Kirilovsky, A., Waldner, M., Obenauf, A. C., et al. (2013). Spatiotemporal dynamics of intratumoral immune cells reveal the immune landscape in human cancer. Immunity 39, 782–795. doi: 10.1016/j.immuni.2013.10.003
Blum, W., Pecze, L., Rodriguez, J. W., Steinauer, M., and Schwaller, B. (2018). Regulation of calretinin in malignant mesothelioma is mediated by septin 7 binding to the CALB2 promoter. BMC Cancer 18:475. doi: 10.1186/s12885-018-4385-7
Bopanna, S., Ananthakrishnan, A. N., Kedia, S., Yajnik, V., and Ahuja, V. (2017). Risk of colorectal cancer in Asian patients with ulcerative colitis: a systematic review and meta-analysis. Lancet Gastroenterol. Hepatol. 2, 269–276. doi: 10.1016/s2468-1253(17)30004-3
Brahmer, J. R., Tykodi, S. S., Chow, L. Q., Hwu, W. J., Topalian, S. L., Hwu, P., et al. (2012). Safety and activity of anti-PD-L1 antibody in patients with advanced cancer. N. Engl. J. Med. 366, 2455–2465. doi: 10.1056/NEJMoa1200694
Bray, F., Ferlay, J., Soerjomataram, I., Siegel, R. L., Torre, L. A., and Jemal, A. (2018). Global cancer statistics 2018: GLOBOCAN estimates of incidence and mortality worldwide for 36 cancers in 185 countries. CA Cancer J. Clin. 68, 394–424. doi: 10.3322/caac.21492
Budczies, J., Klauschen, F., Sinn, B. V., Gyõrffy, B., Schmitt, W. D., Darb-Esfahani, S., et al. (2012). Cutoff finder: a comprehensive and straightforward web application enabling rapid biomarker cutoff optimization. PLoS One 7:e51862. doi: 10.1371/journal.pone.0051862
Carbo, C., Duerschmied, D., Goerge, T., Hattori, H., Sakai, J., Cifuni, S. M., et al. (2010). Integrin-independent role of CalDAG-GEFI in neutrophil chemotaxis. J. Leukoc. Biol. 88, 313–319. doi: 10.1189/jlb.0110049
Chouhan, H., and Sammour, T. (2018). The interaction between BRAF mutation and microsatellite instability (MSI) status in determining survival outcomes after adjuvant 5FU based chemotherapy in stage III colon cancer. J. Surg. Oncol. 118, 1311–1317. doi: 10.1002/jso.25275
Chu, A. Y., Litzky, L. A., Pasha, T. L., Acs, G., and Zhang, P. J. (2005). Utility of D2-40, a novel mesothelial marker, in the diagnosis of malignant mesothelioma. Mod. Pathol. 18, 105–110. doi: 10.1038/modpathol.3800259
Cifuni, S. M., Wagner, D. D., and Bergmeier, W. (2008). CalDAG-GEFI and protein kinase C represent alternative pathways leading to activation of integrin alphaIIbbeta3 in platelets. Blood 112, 1696–1703. doi: 10.1182/blood-2008-02-139733
De Carvalho, D. D., Sharma, S., You, J. S., Su, S. F., Taberlay, P. C., Kelly, T. K., et al. (2012). DNA methylation screening identifies driver epigenetic events of cancer cell survival. Cancer Cell 21, 655–667. doi: 10.1016/j.ccr.2012.03.045
Duluc, D., Corvaisier, M., Blanchard, S., Catala, L., Descamps, P., Gamelin, E., et al. (2009). Interferon-gamma reverses the immunosuppressive and protumoral properties and prevents the generation of human tumor-associated macrophages. Int. J. Cancer 125, 367–373. doi: 10.1002/ijc.24401
Dumauthioz, N., Labiano, S., and Romero, P. (2018). Tumor resident memory T Cells: new players in immune surveillance and therapy. Front. Immunol. 9:2076. doi: 10.3389/fimmu.2018.02076
Fletcher, R., Wang, Y. J., Schoen, R. E., Finn, O. J., Yu, J., and Zhang, L. (2018). Colorectal cancer prevention: immune modulation taking the stage. Biochim. Biophys. Acta Rev. Cancer 1869, 138–148. doi: 10.1016/j.bbcan.2017.12.002
Fridman, W. H., Pagès, F., Sautès-Fridman, C., and Galon, J. (2012). The immune contexture in human tumours: impact on clinical outcome. Nat. Rev. Cancer 12, 298–306. doi: 10.1038/nrc3245
Greten, F. R., Eckmann, L., Greten, T. F., Park, J. M., Li, Z. W., Egan, L. J., et al. (2004). IKKbeta links inflammation and tumorigenesis in a mouse model of colitis-associated cancer. Cell 118, 285–296. doi: 10.1016/j.cell.2004.07.013
Gutting, T., Burgermeister, E., Härtel, N., and Ebert, M. P. (2019). Checkpoints and beyond – immunotherapy in colorectal cancer. Semin. Cancer Biol. 55, 78–89. doi: 10.1016/j.semcancer.2018.04.003
Han, J., Chen, M., Wang, Y., Gong, B., Zhuang, T., Liang, L., et al. (2018). Identification of biomarkers based on differentially expressed genes in papillary thyroid carcinoma. Sci. Rep. 8:9912. doi: 10.1038/s41598-018-28299-9
He, Y., Jiang, Z., Chen, C., and Wang, X. (2018). Classification of triple-negative breast cancers based on immunogenomic profiling. J. Exp. Clin. Cancer Res. 37:327. doi: 10.1186/s13046-018-1002-1
Irizarry, R. A., Hobbs, B., Collin, F., Beazer-Barclay, Y. D., Antonellis, K. J., Scherf, U., et al. (2003). Exploration, normalization, and summaries of high density oligonucleotide array probe level data. Biostatistics 4, 249–264. doi: 10.1093/biostatistics/4.2.249
Jelcic, I., Al Nimer, F., Wang, J., Lentsch, V., Planas, R., Jelcic, I., et al. (2018). Memory B Cells activate brain-homing, autoreactive CD4(+) T Cells in multiple sclerosis. Cell 175, 85–100.e23. doi: 10.1016/j.cell.2018.08.011
Kather, J. N., and Halama, N. (2019). Harnessing the innate immune system and local immunological microenvironment to treat colorectal cancer. Br. J. Cancer 120, 871–882. doi: 10.1038/s41416-019-0441-6
Koliaraki, V., Pasparakis, M., and Kollias, G. (2015). IKKβ in intestinal mesenchymal cells promotes initiation of colitis-associated cancer. J. Exp. Med. 212, 2235–2251. doi: 10.1084/jem.20150542
Lewis, C. E., and Pollard, J. W. (2006). Distinct role of macrophages in different tumor microenvironments. Cancer Res. 66, 605–612. doi: 10.1158/0008-5472.can-05-4005
Li, H. B., Tong, J., Zhu, S., Batista, P. J., Duffy, E. E., Zhao, J., et al. (2017). m(6)A mRNA methylation controls T cell homeostasis by targeting the IL-7/STAT5/SOCS pathways. Nature 548, 338–342. doi: 10.1038/nature23450
Lim, S. B., Tan, S. J., Lim, W. T., and Lim, C. T. (2017). An extracellular matrix-related prognostic and predictive indicator for early-stage non-small cell lung cancer. Nat. Commun. 8:1734. doi: 10.1038/s41467-017-01430-6
Lin, P., Guo, Y. N., Shi, L., Li, X. J., Yang, H., He, Y., et al. (2019). Development of a prognostic index based on an immunogenomic landscape analysis of papillary thyroid cancer. Aging 11, 480–500. doi: 10.18632/aging.101754
Locy, H., de Mey, S., de Mey, W., De Ridder, M., Thielemans, K., and Maenhout, S. K. (2018). Immunomodulation of the tumor microenvironment: turn foe into friend. Front. Immunol. 9:2909. doi: 10.3389/fimmu.2018.02909
Lopez, A., Pouillon, L., Beaugerie, L., Danese, S., and Peyrin-Biroulet, L. (2018). Colorectal cancer prevention in patients with ulcerative colitis. Best Pract. Res. Clin. Gastroenterol. 3, 103–109. doi: 10.1016/j.bpg.2018.05.010
Lucas, C. L., Chandra, A., Nejentsev, S., Condliffe, A. M., and Okkenhaug, K. (2016). PI3Kδ and primary immunodeficiencies. Nat. Rev. Immunol. 16, 702–714. doi: 10.1038/nri.2016.93
Lv, Y., Zhao, Y., Wang, X., Chen, N., Mao, F., Teng, Y., et al. (2019). Increased intratumoral mast cells foster immune suppression and gastric cancer progression through TNF-α-PD-L1 pathway. J. Immunother. Cancer. 7:54. doi: 10.1186/s40425-019-0530-3
Marech, I., Ammendola, M., Gadaleta, C., Zizzo, N., Oakley, C., Gadaleta, C. D., et al. (2014). Possible biological and translational significance of mast cells density in colorectal cancer. World J. Gastroenterol. 20, 8910–8920. doi: 10.3748/wjg.v20.i27.8910
Newman, A. M., Liu, C. L., and Green, M. R. (2015). Robust enumeration of cell subsets from tissue expression profiles. Nat. Methods 12, 453–457. doi: 10.1038/nmeth.3337
Pagès, F., Mlecnik, B., Marliot, F., Bindea, G., Ou, F. S., Bifulco, C., et al. (2018). International validation of the consensus immunoscore for the classification of colon cancer: a prognostic and accuracy study. Lancet 391, 2128–2139. doi: 10.1016/s0140-6736(18)30789-x
Palucka, A. K., and Coussens, L. M. (2016). The basis of oncoimmunology. Cell 164, 1233–1247. doi: 10.1016/j.cell.2016.01.049
Patel, S., Leal, A. D., and Gorski, D. H. (2005). The homeobox gene Gax inhibits angiogenesis through inhibition of nuclear factor-kappaB-dependent endothelial cell gene expression. Cancer Res. 65, 1414–1424. doi: 10.1158/0008-5472.can-04-3431
Pollard, J. W. (2004). Tumour-educated macrophages promote tumour progression and metastasis. Nat. Rev. Cancer 4, 71–78. doi: 10.1038/nrc1256
Qin, L., Wang, W. Z., Liu, H. R., Xu, W. B., Qin, M. W., Zhang, Z. H., et al. (2013). CD4+ and CD8+ T lymphocytes in lung tissue of NSIP: correlation with T lymphocytes in BALF. Respir. Med. 107, 120–127. doi: 10.1016/j.rmed.2012.09.021
Qin, S., Kim, J., Arafat, D., and Gibson, G. (2012). Effect of normalization on statistical and biological interpretation of gene expression profiles. Front. Genet. 3:160. doi: 10.3389/fgene.2012.00160
Rhee, I. (2016). Diverse macrophages polarization in tumor microenvironment. Arch. Pharm. Res. 39, 1588–1596. doi: 10.1007/s12272-016-0820-y
Sanoff, H. K., Bleiberg, H., and Goldberg, R. M. (2007). Managing older patients with colorectal cancer. J. Clin. Oncol. 25, 1891–1897. doi: 10.1200/jco.2006.10.1220
Sasidharan Nair, V., Toor, S. M., Taha, R. Z., Shaath, H., and Elkord, E. (2018). DNA methylation and repressive histones in the promoters of PD-1, CTLA-4, TIM-3, LAG-3, TIGIT, PD-L1, and galectin-9 genes in human colorectal cancer. Clin. Epigenet. 10:104. doi: 10.1186/s13148-018-0539-3
Sharma, P., and Allison, J. P. (2015). The future of immune checkpoint therapy. Science 348, 56–61. doi: 10.1126/science.aaa8172
Sica, A., Schioppa, T., Mantovani, A., and Allavena, P. (2006). Tumour-associated macrophages are a distinct M2 polarised population promoting tumour progression: potential targets of anti-cancer therapy. Eur. J. Cancer 42, 717–727. doi: 10.1016/j.ejca.2006.01.003
Stevenson, L., Allen, W. L., Proutski, I., Stewart, G., Johnston, L., McCloskey, K., et al. (2011). Calbindin 2 (CALB2) regulates 5-fluorouracil sensitivity in colorectal cancer by modulating the intrinsic apoptotic pathway. PLoS One 6:e20276. doi: 10.1371/journal.pone.0020276
Su, P., Liu, X., Pang, Y., Liu, C., Li, R., Zhang, Q., et al. (2017). The archaic roles of the lamprey NF-κB (lj-NF-κB) in innate immune responses. Mol. Immunol. 92, 21–27. doi: 10.1016/j.molimm.2017.10.002
Sun, S. C. (2017). The non-canonical NF-κB pathway in immunity and inflammation. Nat. Rev. Immunol. 17, 545–558. doi: 10.1038/nri.2017.52
Tachon, G., and Masliantsev, K. (2019). Prognostic significance of MEOX2 in gliomas. Mod. Pathol. 32, 774–786. doi: 10.1038/s41379-018-0192-6
Thutkawkorapin, J., Picelli, S., Kontham, V., Liu, T., Nilsson, D., and Lindblom, A. (2016). Exome sequencing in one family with gastric- and rectal cancer. BMC GEneti. 17:41. doi: 10.1186/s12863-016-0351-z
van Spriel, A. B. (2011). Tetraspanins in the humoral immune response. Biochem. Soc. Trans. 39, 512–517. doi: 10.1042/bst0390512
van Spriel, A. B., Puls, K. L., Sofi, M., Pouniotis, D., Hochrein, H., Orinska, Z., et al. (2004). A regulatory role for CD37 in T cell proliferation. J. Immunol. 172, 2953–2961. doi: 10.4049/jimmunol.172.5.2953
van Spriel, A. B., Sofi, M., Gartlan, K. H., van der Schaaf, A., Verschueren, I., Torensma, R., et al. (2009). The tetraspanin protein CD37 regulates IgA responses and anti-fungal immunity. PLoS Pathog. 5:e1000338. doi: 10.1371/journal.ppat.1000338
Vincent, K. M., Findlay, S. D., and Postovit, L. M. (2015). Assessing breast cancer cell lines as tumour models by comparison of mRNA expression profiles. Breast Cancer Res. 17:114. doi: 10.1186/s13058-015-0613-0
Wang, B. D., Ceniccola, K., Hwang, S., Andrawis, R., Horvath, A., Freedman, J. A., et al. (2017). Alternative splicing promotes tumour aggressiveness and drug resistance in African American prostate cancer. Nat. Commun. 8:15921. doi: 10.1038/ncomms15921
Wang, F., and Xia, Q. (2018). Back to homeostasis: negative regulation of NF-κB immune signaling in insects. Dev. Compar. Immunol. 87, 216–223. doi: 10.1016/j.dci.2018.06.007
Wang, L. X., Li, Y., and Chen, G. Z. (2018). Network-based co-expression analysis for exploring the potential diagnostic biomarkers of metastatic melanoma. PLoS One 13:e0190447. doi: 10.1371/journal.pone.0190447
Wang, Y., Lin, H. C., Huang, M. Y., Shao, Q., Wang, Z. Q., Wang, F. H., et al. (2018). The immunoscore system predicts prognosis after liver metastasectomy in colorectal cancer liver metastases. Cancer Immunol. Immunother. 67, 435–444. doi: 10.1007/s00262-017-2094-8
Wei, H., Li, J., Xie, M., Lei, R., and Hu, B. (2018). Comprehensive analysis of metastasis-related genes reveals a gene signature predicting the survival of colon cancer patients. PeerJ 6:e5433. doi: 10.7717/peerj.5433
Wilkinson, N. W., Yothers, G., Lopa, S., Costantino, J. P., Petrelli, N. J., and Wolmark, N. (2010). Long-term survival results of surgery alone versus surgery plus 5-fluorouracil and leucovorin for stage II and stage III colon cancer: pooled analysis of NSABP C-01 through C-05. A baseline from which to compare modern adjuvant trials. Ann. Surg. Oncol. 17, 959–966. doi: 10.1245/s10434-009-0881-y
Wong, Y. N. S., Joshi, K., Khetrapal, P., Ismail, M., Reading, J. L., Sunderland, M. W., et al. (2018). Urine-derived lymphocytes as a non-invasive measure of the bladder tumor immune microenvironment. J. Exp. Med. 215, 2748–2759. doi: 10.1084/jem.20181003
Xu-Monette, Z. Y., Li, L., Byrd, J. C., Jabbar, K. J., Manyam, G. C., Maria de Winde, C., et al. (2016). Assessment of CD37 B-cell antigen and cell of origin significantly improves risk prediction in diffuse large B-cell lymphoma. Blood 128, 3083–3100. doi: 10.1182/blood-2016-05-715094
Yang, H., Zhang, X., Cai, X. Y., Wen, D. Y., Ye, Z. H., Liang, L., et al. (2017). From big data to diagnosis and prognosis: gene expression signatures in liver hepatocellular carcinoma. PeerJ. 5:e3089. doi: 10.7717/peerj.3089
Yang, L., Zhang, L., Wu, Q., and Boyd, D. D. (2008). Unbiased screening for transcriptional targets of ZKSCAN3 identifies integrin beta 4 and vascular endothelial growth factor as downstream targets. J. Biol. Chem. 283, 35295–35304. doi: 10.1074/jbc.M806965200
Yoshihara, K., Shahmoradgoli, M., Martínez, E., Vegesna, R., Kim, H., Torres-Garcia, W., et al. (2013). Inferring tumour purity and stromal and immune cell admixture from expression data. Nat. Commun. 4:2612. doi: 10.1038/ncomms3612
Yothers, G., O’Connell, M. J., Lee, M., Lopatin, M., Clark-Langone, K. M., Millward, C., et al. (2013). Validation of the 12-gene colon cancer recurrence score in NSABP C-07 as a predictor of recurrence in patients with stage II and III colon cancer treated with fluorouracil and leucovorin (FU/LV) and FU/LV plus oxaliplatin. J. Clin. Oncol. 31, 4512–4519. doi: 10.1200/jco.2012.47.3116
Yu, G., Wang, L. G., Han, Y., and He, Q. Y. (2012). clusterProfiler: an R package for comparing biological themes among gene clusters. Omics J. Integr. Biol. 16, 284–287. doi: 10.1089/omi.2011.0118
Yu, H., Pardoll, D., and Jove, R. (2009). STATs in cancer inflammation and immunity: a leading role for STAT3. Nat. Rev. Cancer 9, 798–809. doi: 10.1038/nrc2734
Zeng, D., Zhou, R., Yu, Y., Luo, Y., Zhang, J., Sun, H., et al. (2018). Gene expression profiles for a prognostic immunoscore in gastric cancer. Br. J. Surg. 105, 1338–1348. doi: 10.1002/bjs.10871
Zhang, H., Watanabe, R., Berry, G. J., Tian, L., Goronzy, J. J., and Weyand, C. M. (2018). Inhibition of JAK-STAT signaling suppresses pathogenic immune responses in medium and large vessel vasculitis. Circulation 137, 1934–1948. doi: 10.1161/circulationaha.117.030423
Zhang, X., and Wang, Y. (2019). Identification of hub genes and key pathways associated with the progression of gynecological cancer. Oncol. Lett. 18, 6516–6524. doi: 10.3892/ol.2019.11004
Keywords: Colon and rectal cancer, signature, prognosis, immunogenomic profiling, machine learning
Citation: Wei R, Liu H, Li C, Guan X, Zhao Z, Ma C, Wang X and Jiang Z (2020) Computational Identification of 29 Colon and Rectal Cancer-Associated Signatures and Their Applications in Constructing Cancer Classification and Prognostic Models. Front. Genet. 11:740. doi: 10.3389/fgene.2020.00740
Received: 12 May 2020; Accepted: 22 June 2020;
Published: 22 July 2020.
Edited by:
Jialiang Yang, Geneis (Beijing) Co., Ltd., ChinaReviewed by:
Tianbao Li, University of Texas Health Science Center at San Antonio, United StatesJu Xiang, Changsha Medical University, China
Copyright © 2020 Wei, Liu, Li, Guan, Zhao, Ma, Wang and Jiang. This is an open-access article distributed under the terms of the Creative Commons Attribution License (CC BY). The use, distribution or reproduction in other forums is permitted, provided the original author(s) and the copyright owner(s) are credited and that the original publication in this journal is cited, in accordance with accepted academic practice. No use, distribution or reproduction is permitted which does not comply with these terms.
*Correspondence: Zheng Jiang, MDcxMTA2MjM3QGZ1ZGFuLmVkdS5jbg==
†These authors have contributed equally to this work